1. Introduction
The hydrocarbon process industry is still important for the modern world economy. It involves physical processes like separation, distillation, cracking, etc., to produce the products that are needed in the market. Equipment, such as distillation columns, usually requires thermal insulation to prevent heat losses or heat gains depending on their temperature span and the ambient conditions. As this is an aging industry, the equipment is gradually upgraded to extend the equipment lifetime.
During the last 3–4 decades, this industry has experienced severe accidents [
1,
2]. Much effort is therefore put into limiting the fire and explosion risks that are associated with processing the highly combustible hydrocarbon products. However, every year there are still severe fires in the hydrocarbon processing industry [
1,
3]. Since much of the equipment is working at elevated pressures, a loss of containment in fire-exposed equipment may violently release huge quantities of flammable materials [
2,
3]. Active and passive fire protection measures are therefore very important to prevent the violent escalation of industrial fires.
Corrosion protection paint was applied to prevent external corrosion of the process equipment. Mineral based thermal insulation (typically 50 mm thickness) was then put in direct contact with this paint. In order to achieve proper passive fire protection, high temperature resistant mineral based insulation (typically 30–50 mm thickness) was provided outside the thermal insulation. Stainless-steel cladding (typically 0.7 mm thickness) represented the outer surface preventing ingress of rain and snow. The cladding also served as flame deflection in a fire scenario protecting the passive fire protection and the thermal insulation from direct flame exposure. During the 1990’s, much research was done to evaluate the fire testing procedures of installed process equipment [
4,
5]. In general, the selected solutions were demonstrated to give sufficient resistance to hydrocarbon pool fires.
After 20+ years of service, inspection has shown that it is necessary to do maintenance and rehabilitation of process equipment, such as hydrocarbon distillation columns [
5]. In some cases, where the units operate below the ambient air dew point, natural convection has supplied humidity to the thermal insulation, finally becoming soaked in water. This ruins the thermal insulation capacity since only 4% moisture by volume can reduce the thermal efficiency by 70% due to the high thermal conductivity of water [
1,
6]. The aged corrosion protection paint has in several cases not been able to prevent severe corrosion attacks. A complete rehabilitation is therefore often required.
Today, an improved insulation methodology, where an air gap (typically 1” thick) is introduced, prevents the direct contact between the thermal insulation and the steel unit. The thermal insulation is kept at this distance by perforated metal plates (aluminum or stainless steel) that are electrically insulated from the steel wall by non-conducting spacers. The new insulation method adds at least 52 mm to the equipment diameter. In some situations there is, however, not sufficient room available for this added spacing. Relocating structural elements would require much hot work, which should be avoided in live plants, and, shutting down the plant for such work may not be realistic. The possibility to provide room by relocating structural elements is also very costly.
Due to the typical size of such distillation columns, e.g., 4 m diameter and 20–25 m height and the operating pressures, the columns walls are comparatively thick. The walls therefore represent much thermal capacity. It could therefore in principle be a possibility that the complete system, i.e., the wall, air gap, perforated metal plate, thermal insulation, and cladding, would result in sufficiently slow temperature increase in a fire scenario. To demonstrate this by large scale testing is, however, costly. As an alternative, small scale tests may give valuable information. It was therefore decided to look for options for testing the new thermal insulation method in high heat loads.
The present work investigates a concept for the small scale testing of mockups resembling a part of a typical hydrocarbon distillation column, thermally insulated according to the modern requirements. Mockups built according to these requirements were exposed to a small-scale propane flame where the flow rate and flame zone were optimized to limit heat losses and give high heat flux levels, e.g., in the range 250–350 kW/m2. The fire dynamics principles of the small-scale testing are outlined, and it is explained how it is possible to achieve heat flux levels that are normally considered only in larger scales. The design of the setup to minimize effects of limited size is discussed. Methods to document the validity of the small-scale testing are provided. Gas temperatures were recorded by mantle thermocouples, as well as a plate thermometer for heat exposure evaluations. Temperatures were also recorded in the mockup cladding, in the thermal insulation and in the steel wall sections. Results are presented for a 16 mm thick wall mockup. The paper describes the theoretical considerations and the physics principles involved. Then, the experiments and the results are presented. Finally, the limitations of the method are discussed regarding the potential exposure to full scale liquid fires at the location of the specific distillation column.
2. Theoretical Considerations
2.1. Fire Dynamics
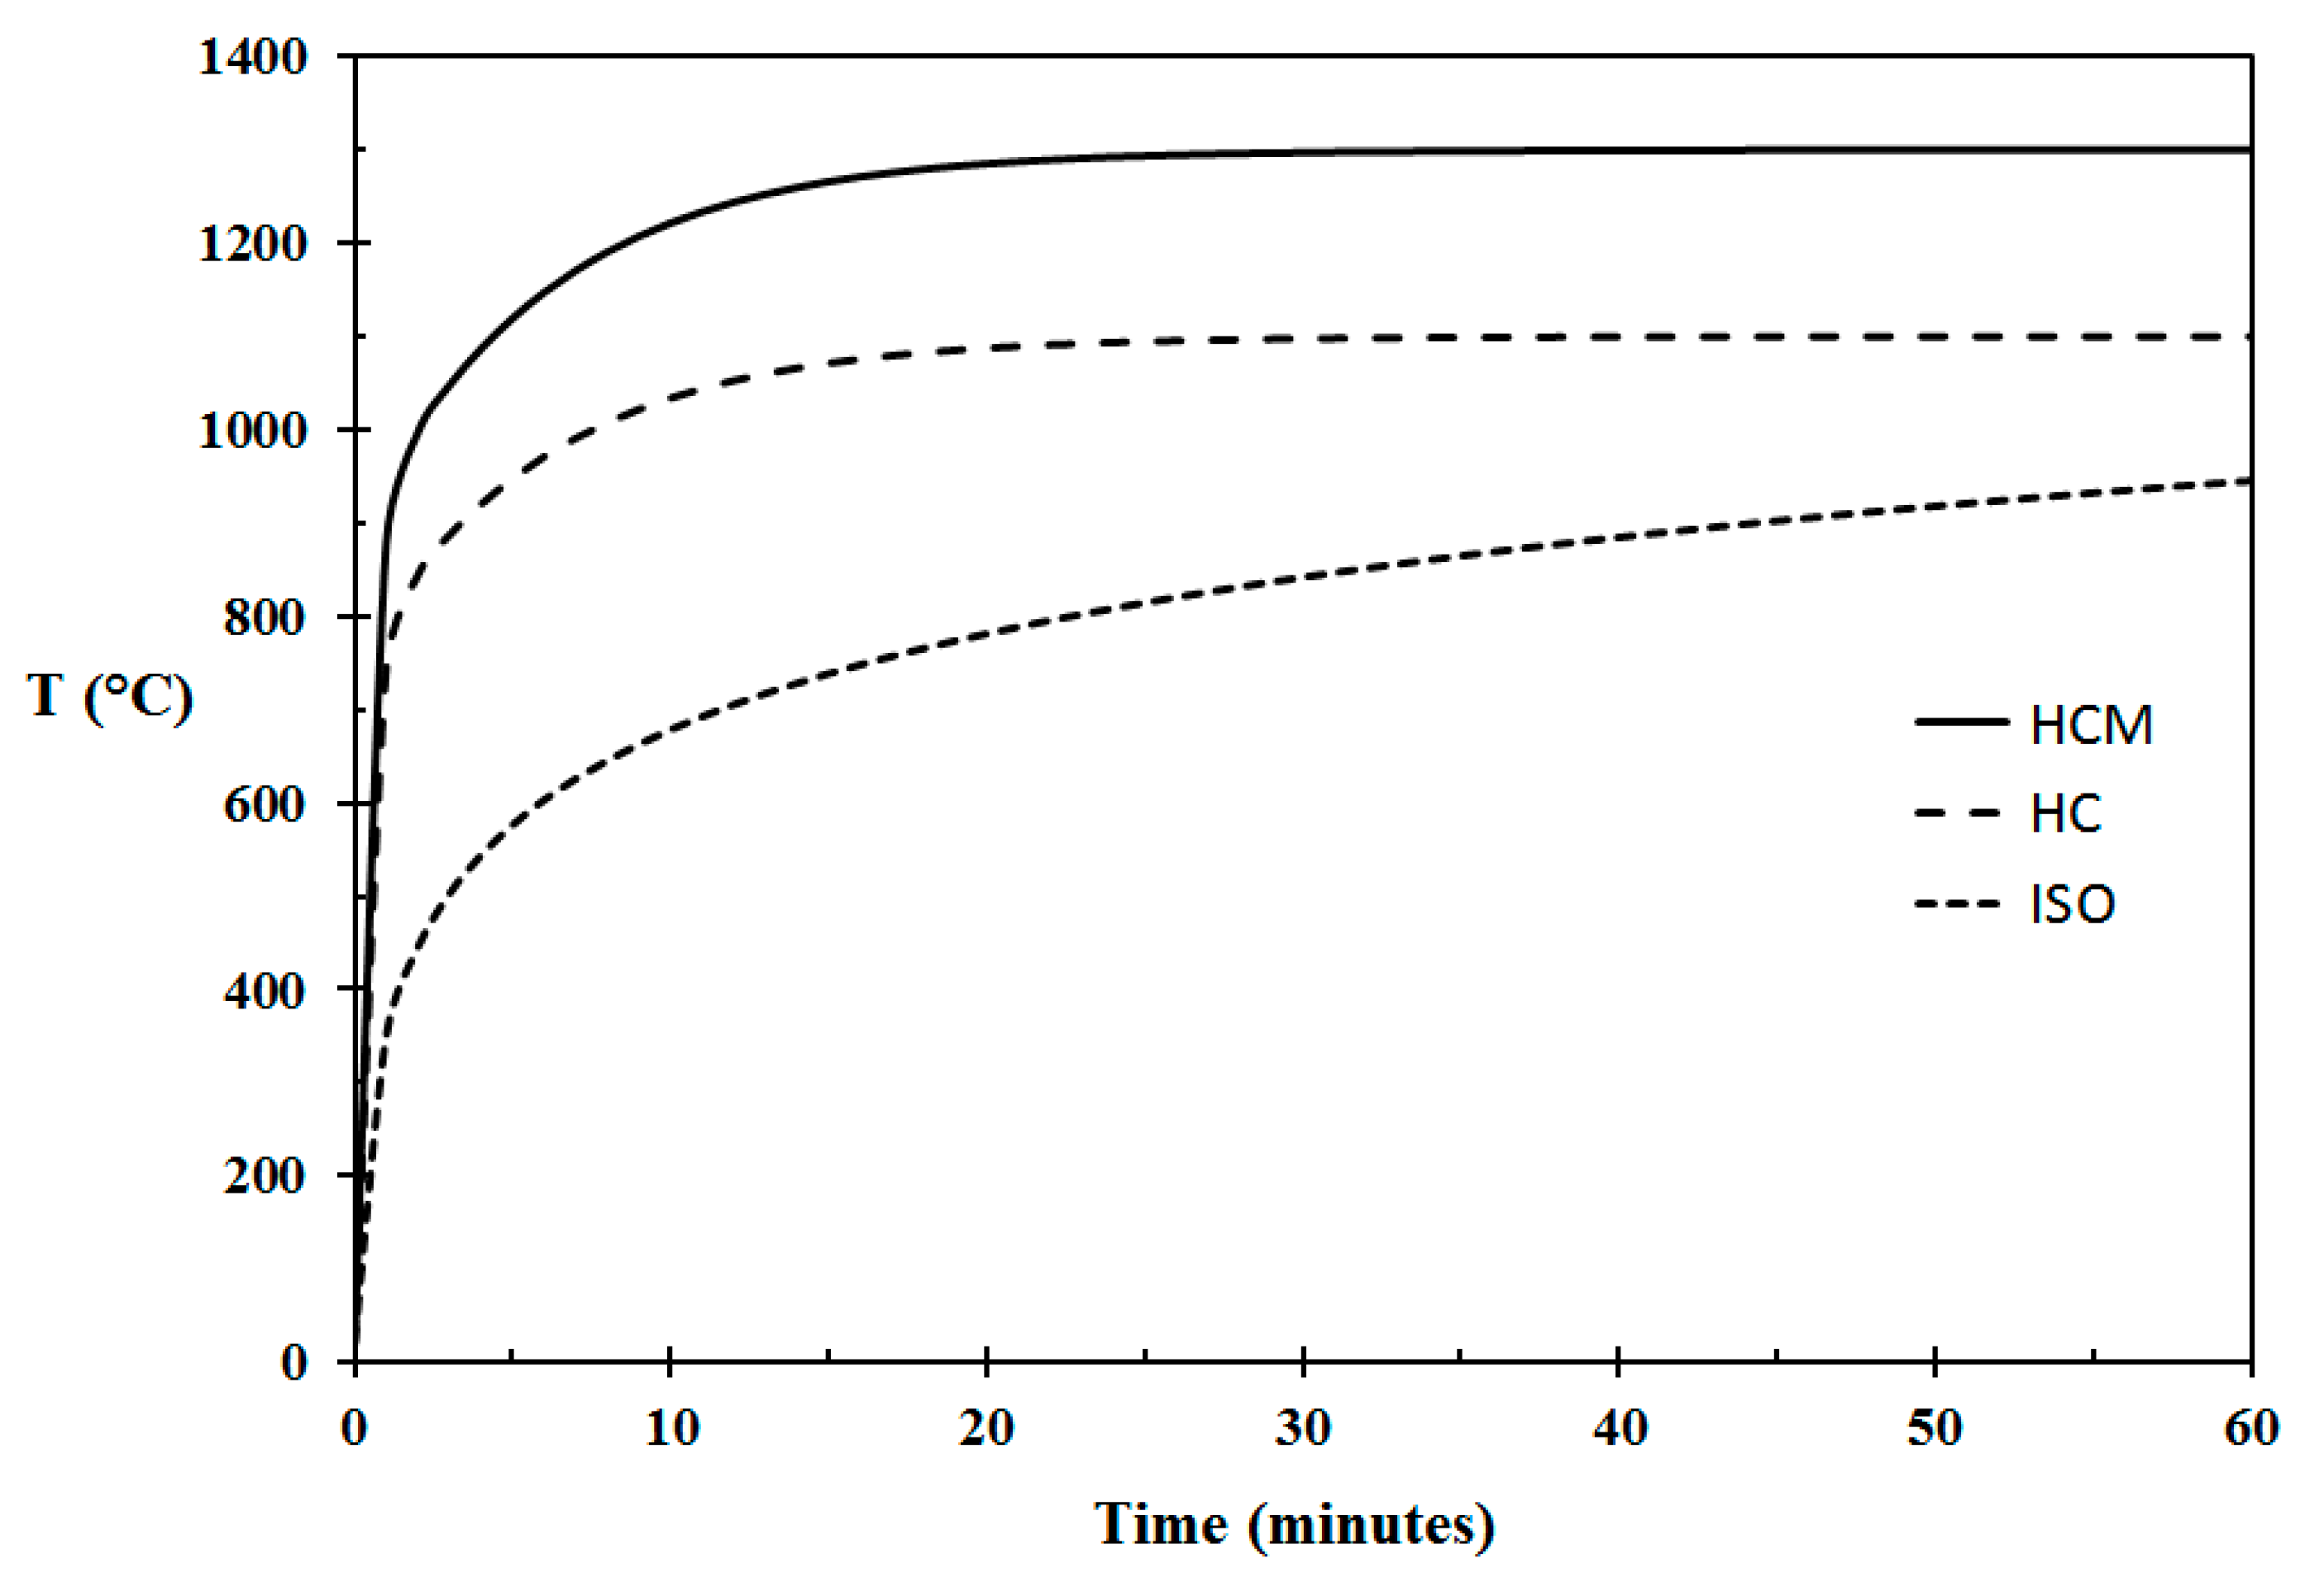
Fire testing is usually done in standardized furnaces that are fired according to given temperature time curves. Structural building elements are tested in furnaces fired in accordance with the ISO 834 temperature time curve [
7]:
where
(min) is the exposure time. Oil and gas fires are expected to quickly result in very high flame temperatures. The standardized hydrocarbon (HC) test curve developed by the Norwegian Petroleum Directorate is therefore different from the ISO 834 temperature time curve and given by [
8]:
It should be noted that there are also other temperature time curves for less severe fire exposure situations, e.g., façade fire exposure and more severe hydrocarbon fire exposure, such as the French HydroCarbon Modified (HCM) curve. The latter one was developed as a result of several full scale fire tests where temperatures well in excess of 1100 °C were recorded. The HCM curve is given by [
9]:
The three standard temperature time curves are shown in
Figure 1.
In industrial fires it is common to distinguish between pool fires resulting from liquid spills and jet fires resulting from the release of pressurized gas. In these two fire regimes, the pool fires are expected to result in heat flux levels of 250 kW/m
2, while jet fires are expected to result in heat flux levels of 350 kW/m
2 [
10]. The reason for the jet fires giving more severe heat exposure is due to the higher speed of the combustion products giving a higher convective heat transfer coefficient, as well as the increased turbulence level resulting in cleaner burning and higher flame temperatures. The jet fires are also in general more erosive. Standardized testing is usually performed according to the ISO 22899 Jet Fire Test [
11]. The 0.3 kg/s propane jet fire, i.e., approximately 14 MW heat release rate, is released horizontally through a standardized jet nozzle for various time periods exposing e.g., panels, wall and pipe configurations coated with Passive Fire Protection (PFP) materials.
The radiant heat flux that is absorbed by the exposed object is a function of the temperature and emissivity of the receiving surface, as well as the emissivity of the flames. The net heat flux received by an object fully engulfed in flames is given by:
where
(W/m K) is the convective heat transfer coefficient,
(K) is the flame temperature,
(K) is the temperature of the exposed surface,
is the emissivity of the flames,
is the emissivity of the solid and
(5.67 × 10
−8 W/m
2 K
4) is the Stefan-Boltzmann constant. The emissivity of the flames is given by:
where
(1/m) is the extinction coefficient and
(m) is the optical flame thickness. Due to the potential size of fires in the oil and gas industry, it is common to assume that the flames are optically thick, i.e., the emissivity is unity.
2.2. The Test Concept
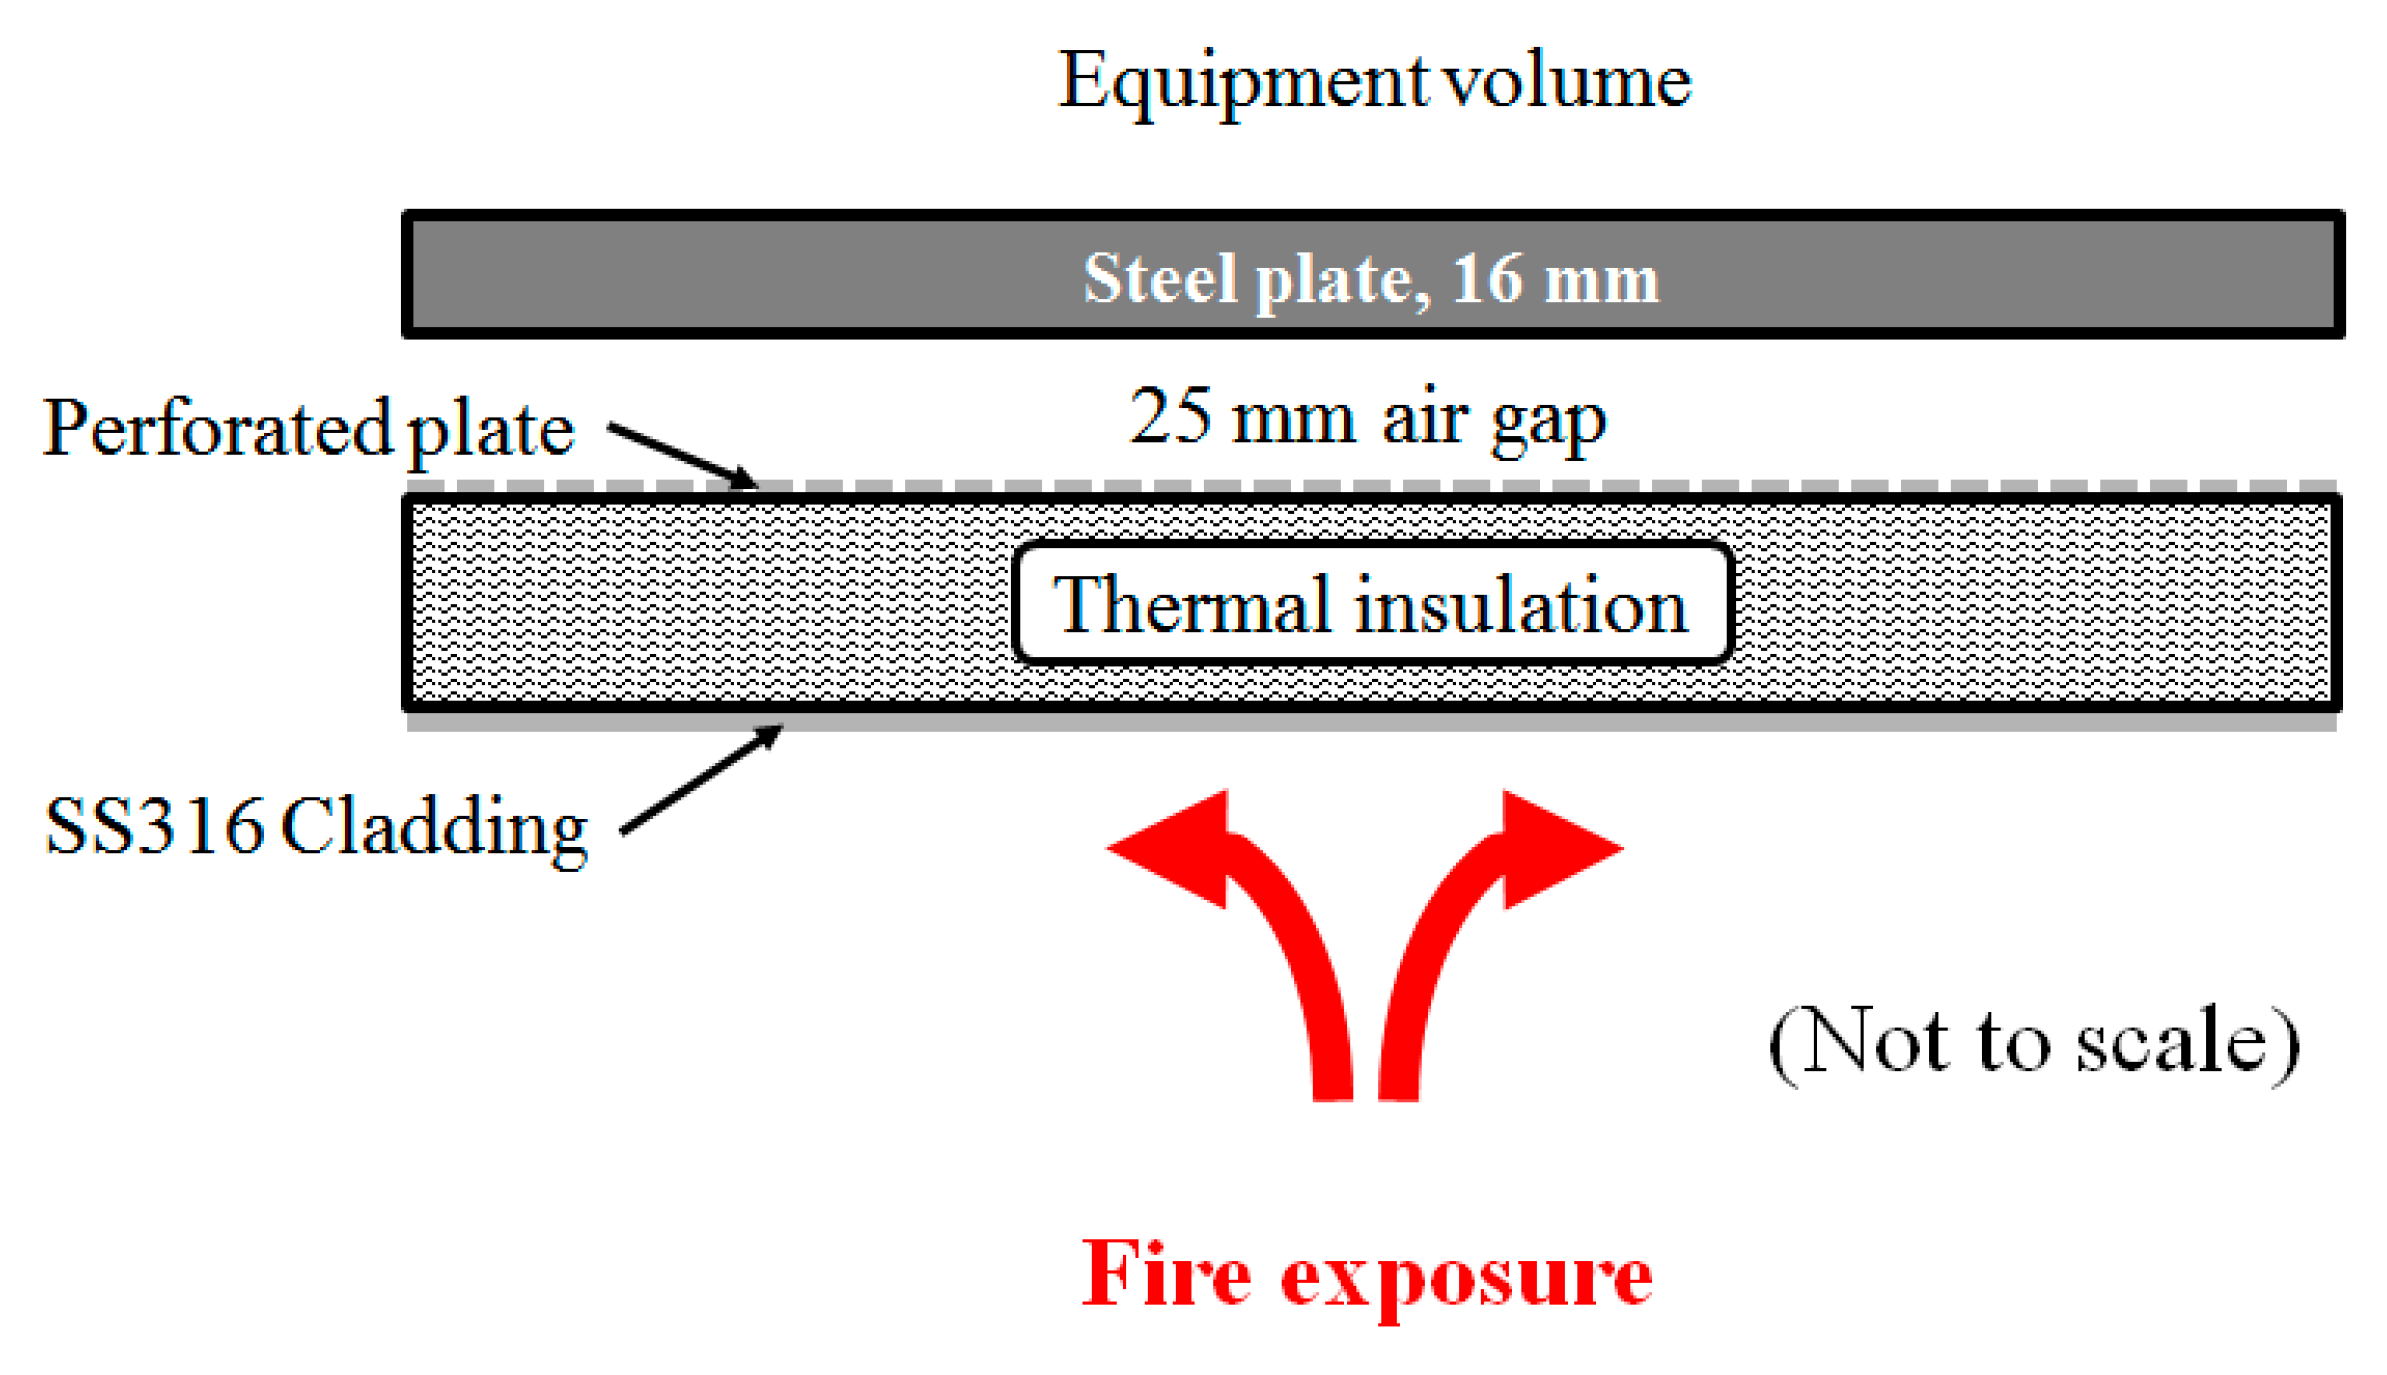
Due to the number of parameters exerting influence on the test severity it is not sufficient to e.g., define 1100 °C recorded by a thermocouple as the target of the flame temperature. Test configuration, heat losses, etc. also needs to be considered. Testing the mockup in a situation that is similar to the real fire is appealing, i.e., where a fire exposes the equipment to be tested. The concept chosen for the present study is shown in
Figure 2. It is, however, evident that even though the flames exposing the stainless-steel cladding may be sufficiently hot to comply with e.g., the HC curve, as described in Equation (2), the heat losses from the exposed stainless-steel cladding may reduce the heat exposure substantially. In a small scale, the setup presented in
Figure 2 will not work properly due to radiative heat losses.
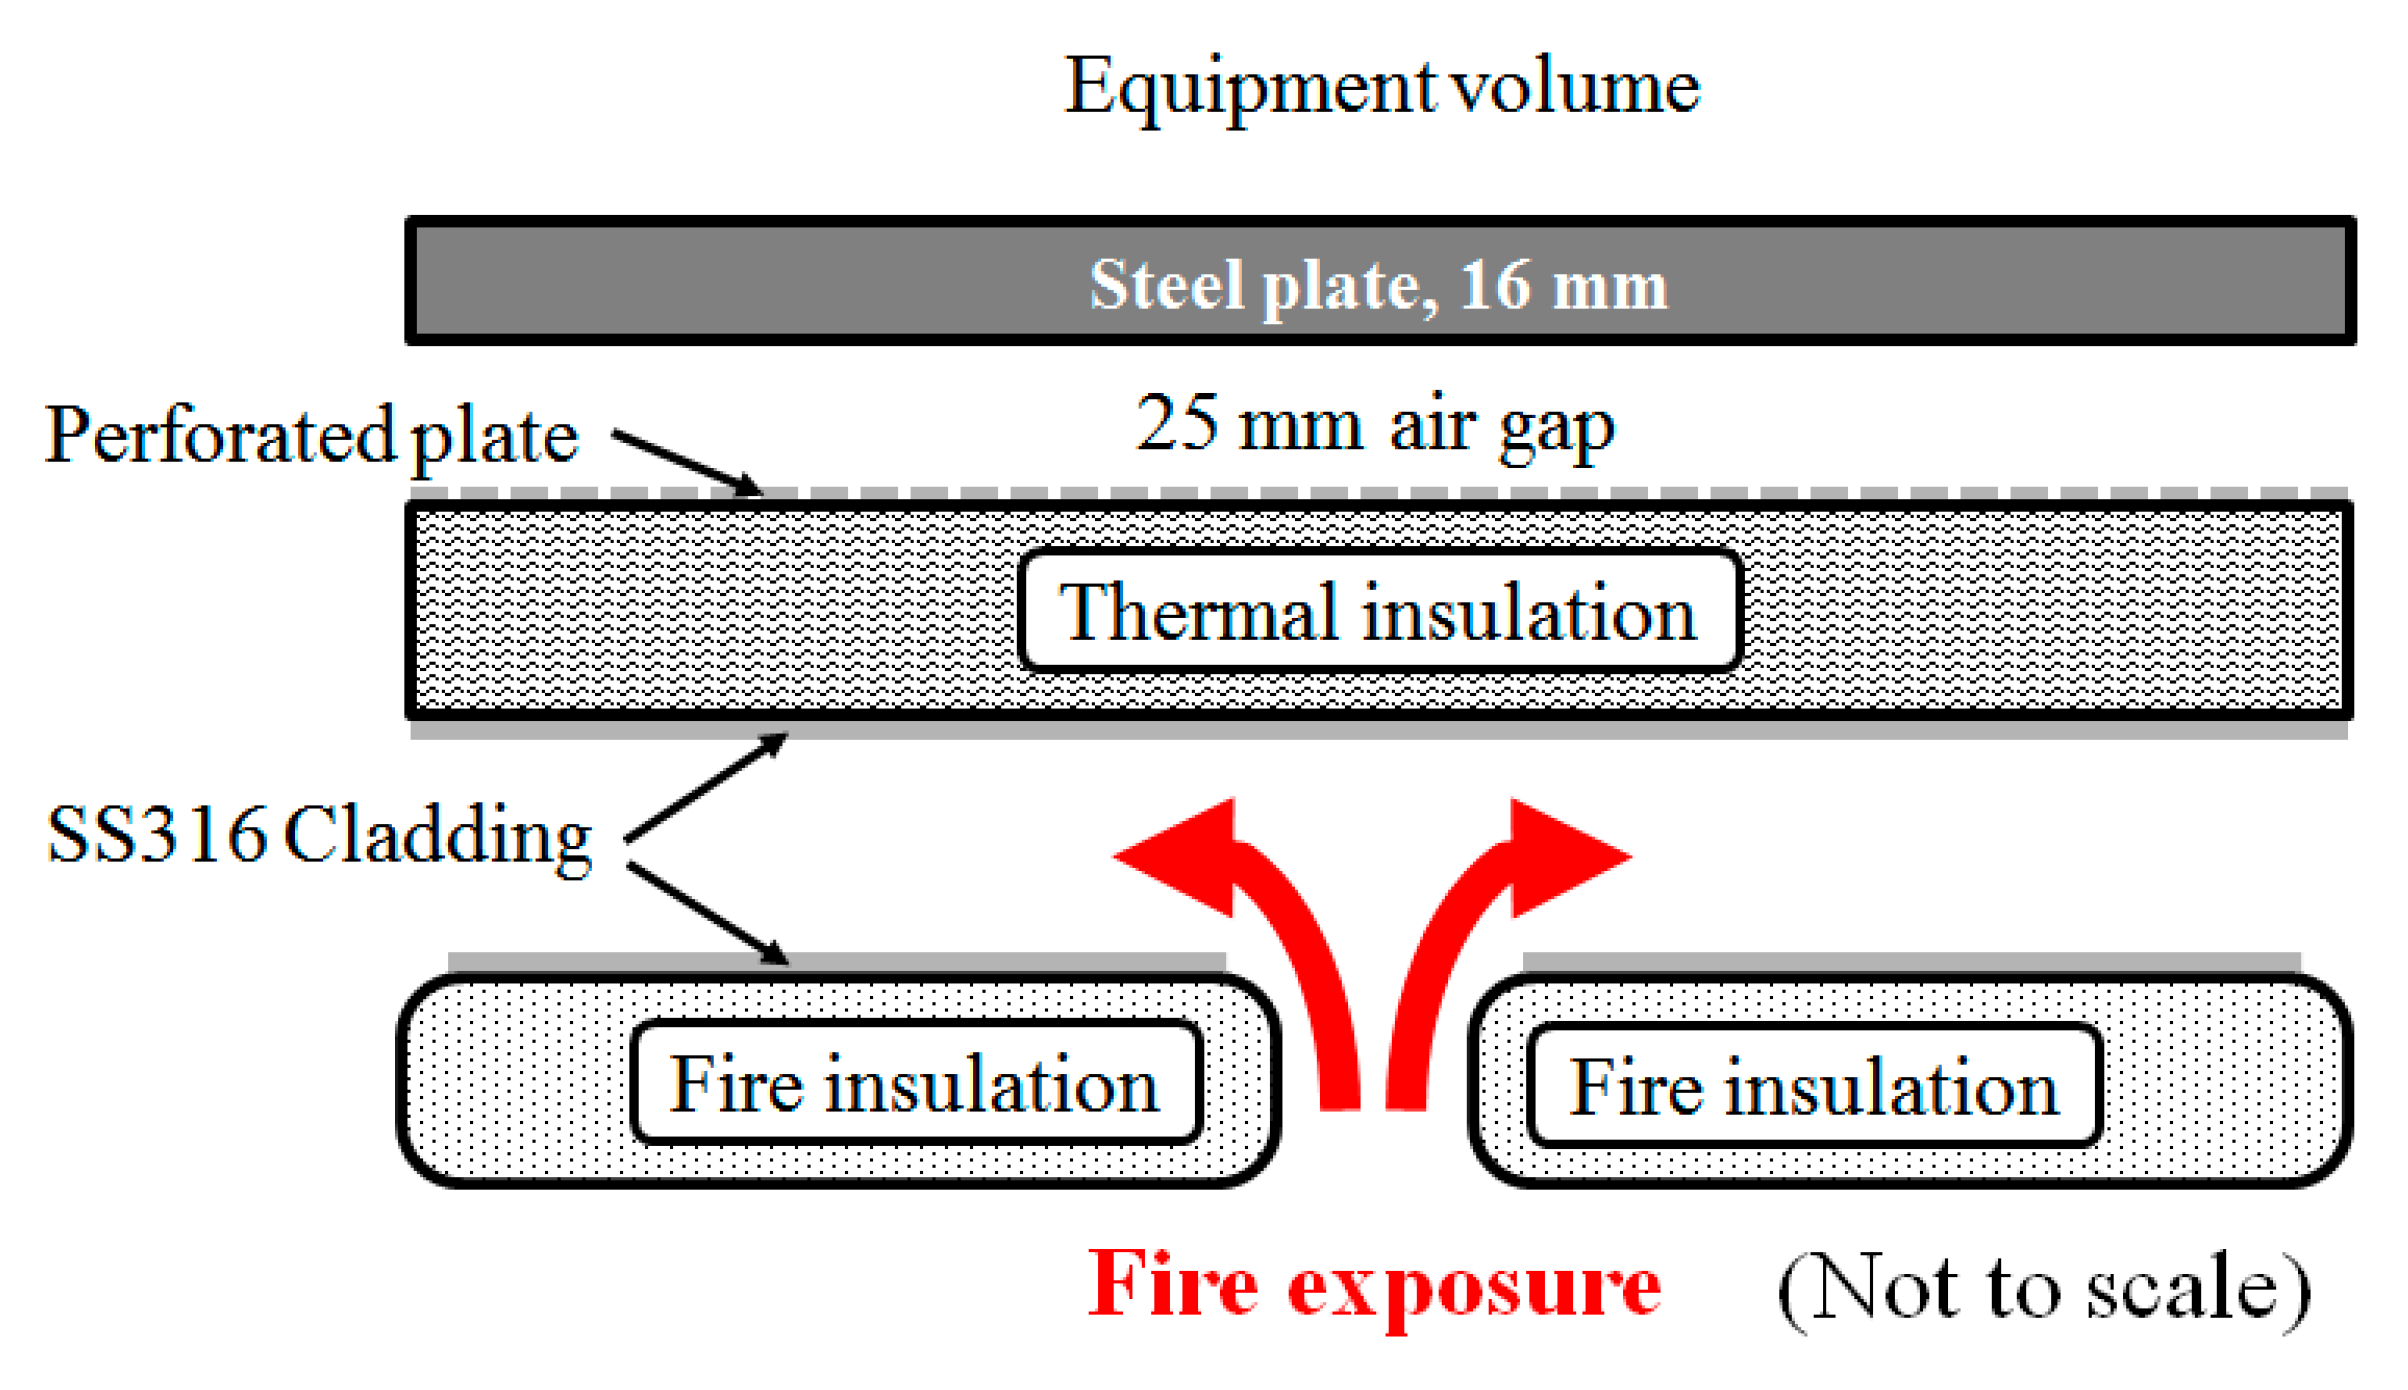
The convective heat transfer coefficient is dependent on the flame temperature, the hot gas velocity and the turbulence level. It is independent of the flame thickness. However, if the exposed cladding “views” only hot objects, the optical flame thickness becomes much less relevant for heat radiation as long as the exposed surfaces radiate sufficient heat at each other. This may indeed be the case with a fire scenario in a process plant that is dominated by thermally insulated equipment. Reconsidering the set-up to include fire exposed neighbor objects may therefore increase the heat exposure significantly, as shown in
Figure 3.
In order for the test set-up shown in
Figure 3 to work properly, the fire needs to be sufficiently intense and the dimensions must be large enough to ensure a limited size influence. An axisymmetric set-up, with a central cylindrical fire source would represent a simple test configuration. Since it is easy to get hold of radial propane burners, it was convenient to design the mockup in the cylindrical coordinate system. The steel plate was therefore cut to a disk shape. When compared to a real scale industry fire, the fire insulation in
Figure 3, i.e., below the flame volume, represents neighbor equipment radiating at the exposed surface of interest.
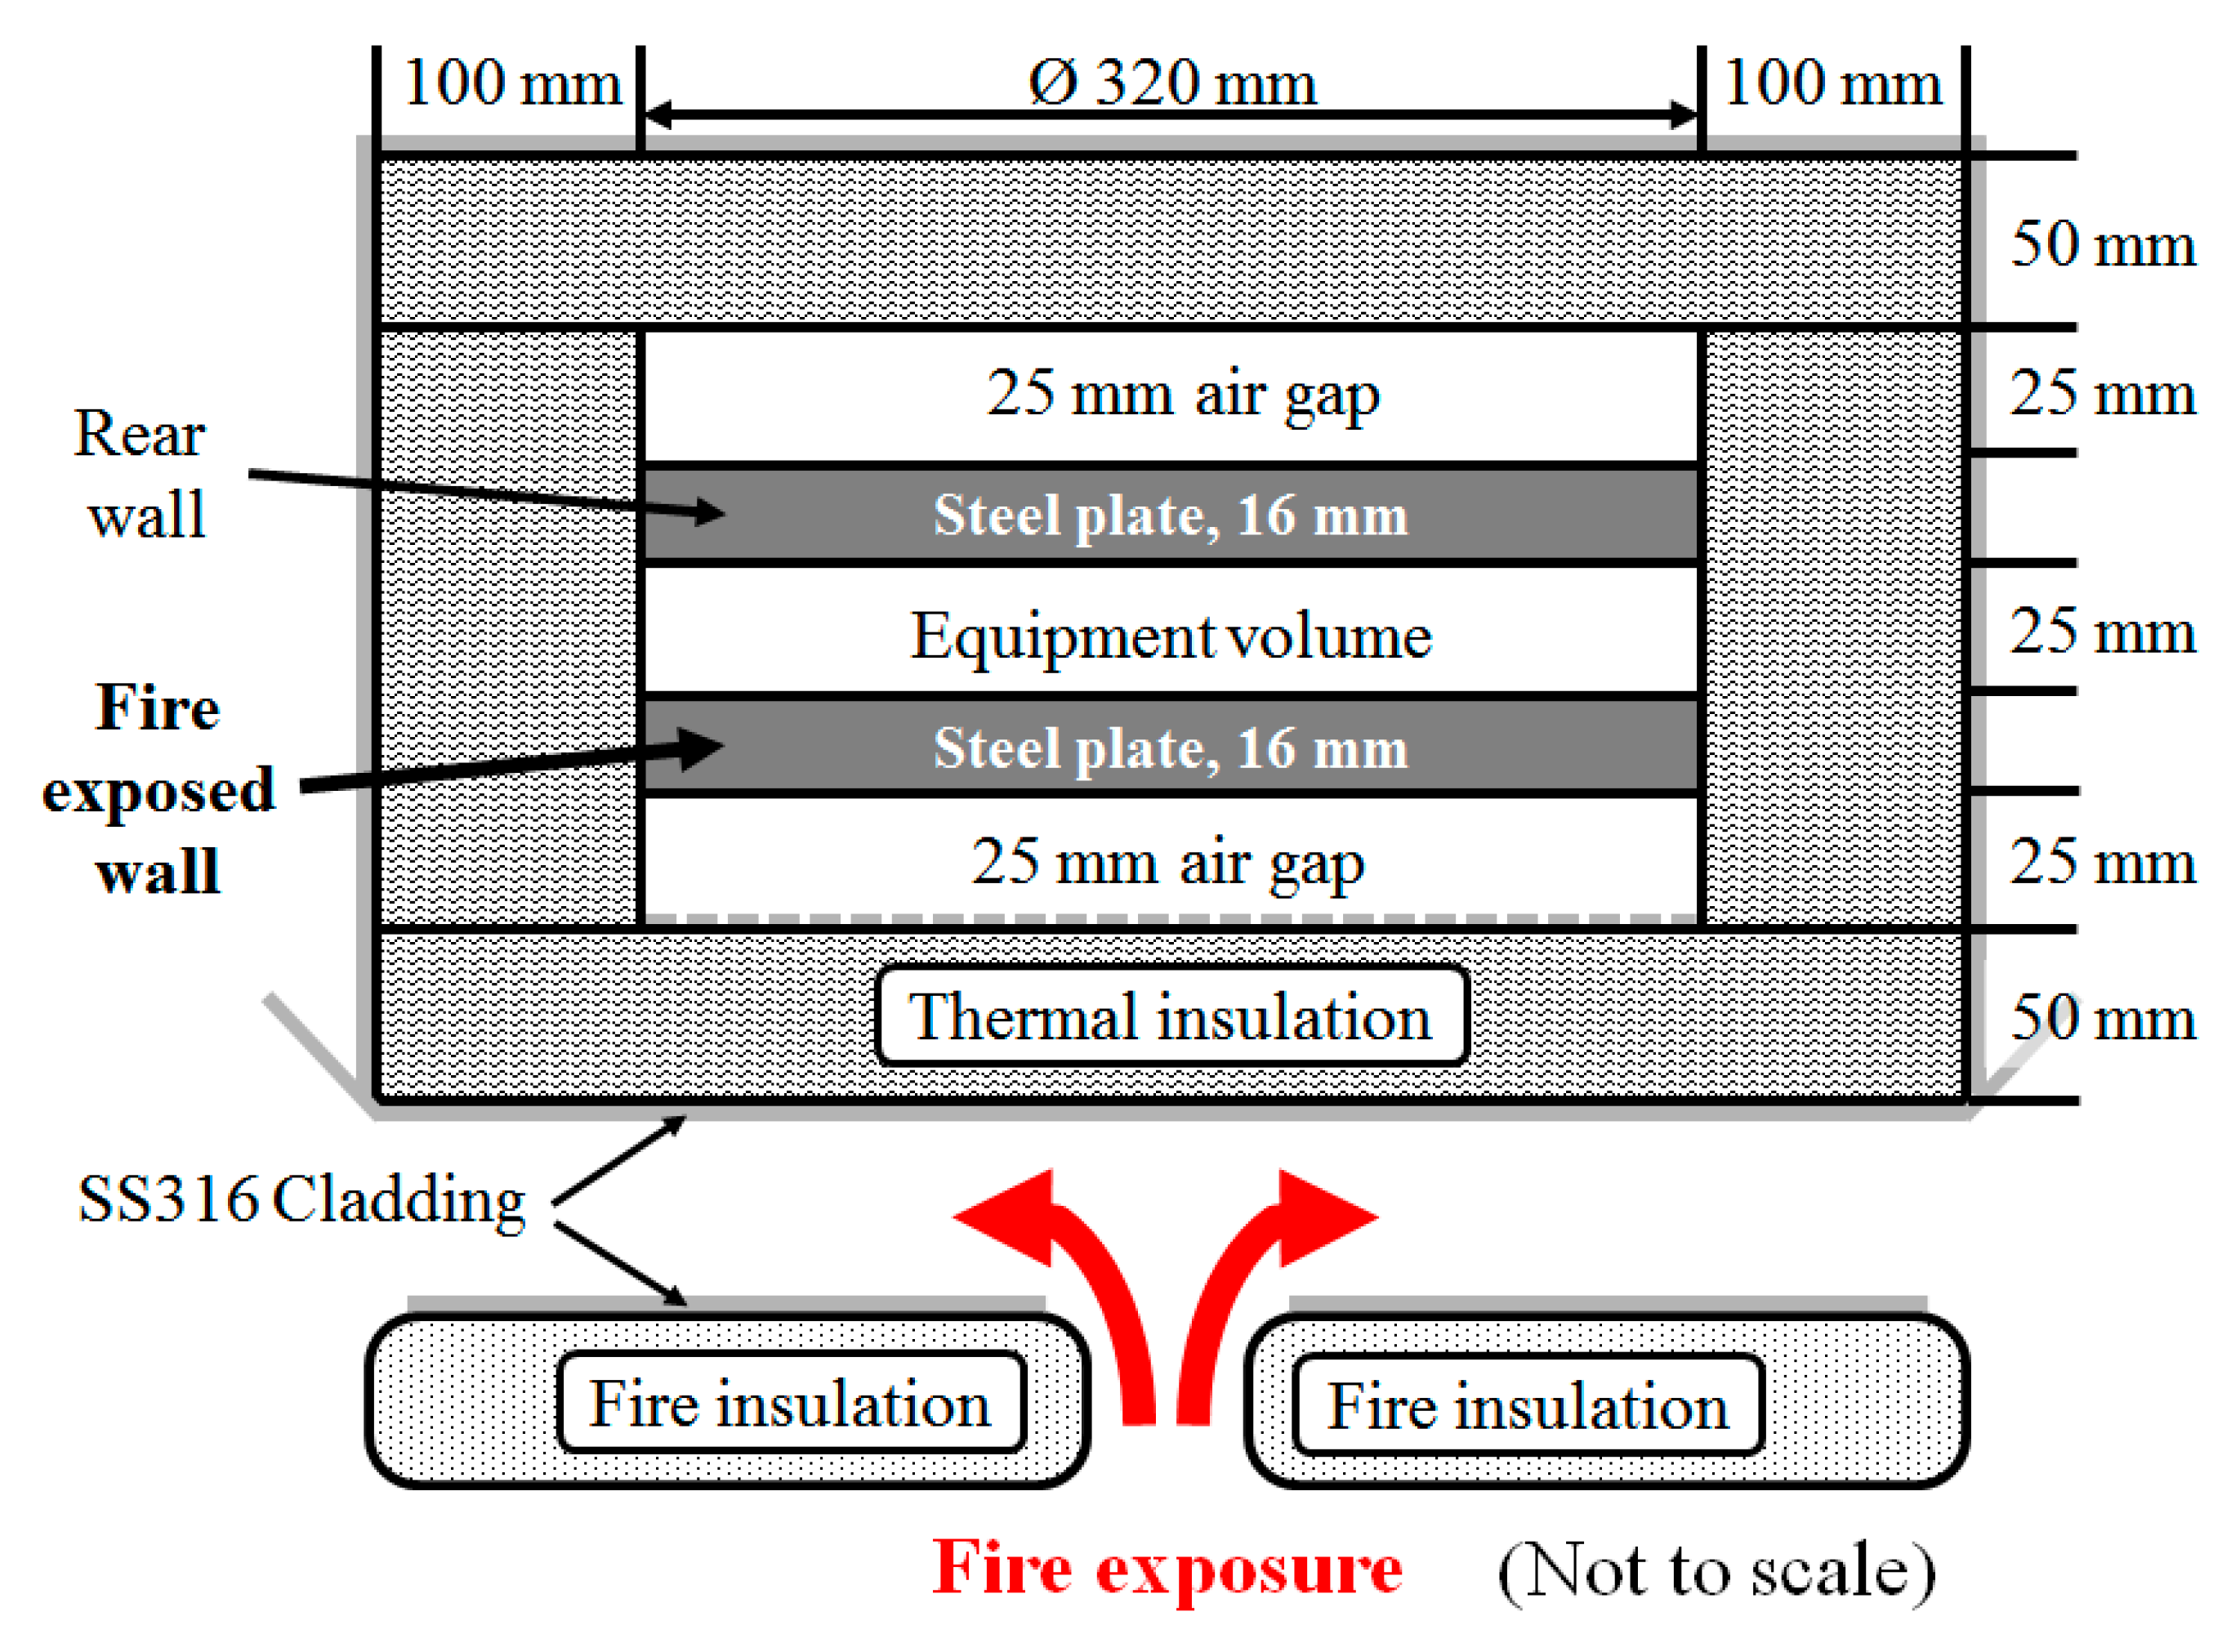
In the real setting, there is also a back side of the distillation column to which the heat exposed steel will lose heat by convection and radiation. The test setup was therefore designed, as shown in
Figure 4. During preliminary testing it was observed that even the set-up as shown in
Figure 3 and
Figure 4 was “leaking too much heat” to the surroundings. It was therefore tried to “box” the flame zone somewhat in by light weight heat resistant bricks. The purpose of these was to prevent ingress of ambient air entering into and cooling the lower parts of the flame zone and the lower cladding. The light weight bricks blocked the view from the flame zone to ambient conditions and reradiated heat back to the flame zone as soon as their surfaces got heated. This principle is further explained in
Section 4.
Distillation columns are often quite large structures, i.e., diameter 4 m and height 20–25 m. When considering a wall thickness only a small fraction of the column diameter, i.e., 16 mm to 4000 mm, the heat flow into the system may be considered one-dimensional. The small scale testing should therefore also be one-dimensional. The radial configuration is very convenient when given a cylindrical burner located at radius zero. Arranging the cylindrical propane fire source vertically, i.e., in positive z-direction, and exposing a horizontal mockup, the heat flow would be one-dimensional through the thermal insulation as long as the size of the mockup is not very large when compared to the deflected flames. The heat exposure should be as independent of radius as possible. Selecting a convenient test specimen diameter is therefore important.
On the other hand, a very low diameter mockup would be more influenced by edge effects due to limited size. It was therefore decided to use steel plate dimension of diameter 20 times the thickness, i.e., diameter 320 mm. This represented a sufficient small scale and a convenient test plate mass (10 kg) for manual handling. Test specimens larger than that would probably result in less uniform heat flow, or required a larger fire source. Limited radial temperature gradients should nevertheless be confirmed by recording temperatures at different locations during fire testing.
2.3. Test Temperatures
The NORSOK S-001 [
10] argues that in heat exposure calculations the total heat flux should be set to 250 kW/m
2 for pool fires and 350 kW/m
2 for jet fires. The oil and gas companies have therefore recently started specifying 250 kW/m
2 for pool fires and 350 kW/m
2 for jet fires, e.g., the Statoil requirements for new installations, TR2237 [
12]. For heat transfer calculations, this TR recommends a convective heat transfer coefficient 100 W/m
2 K, flame emissivity unity and the steel and cladding emissivity 0.85. Flame temperatures of 1050 °C and 1200 °C then corresponds to 250 kW/m
2 and 350 kW/m
2 to an object at 20 °C, respectively.
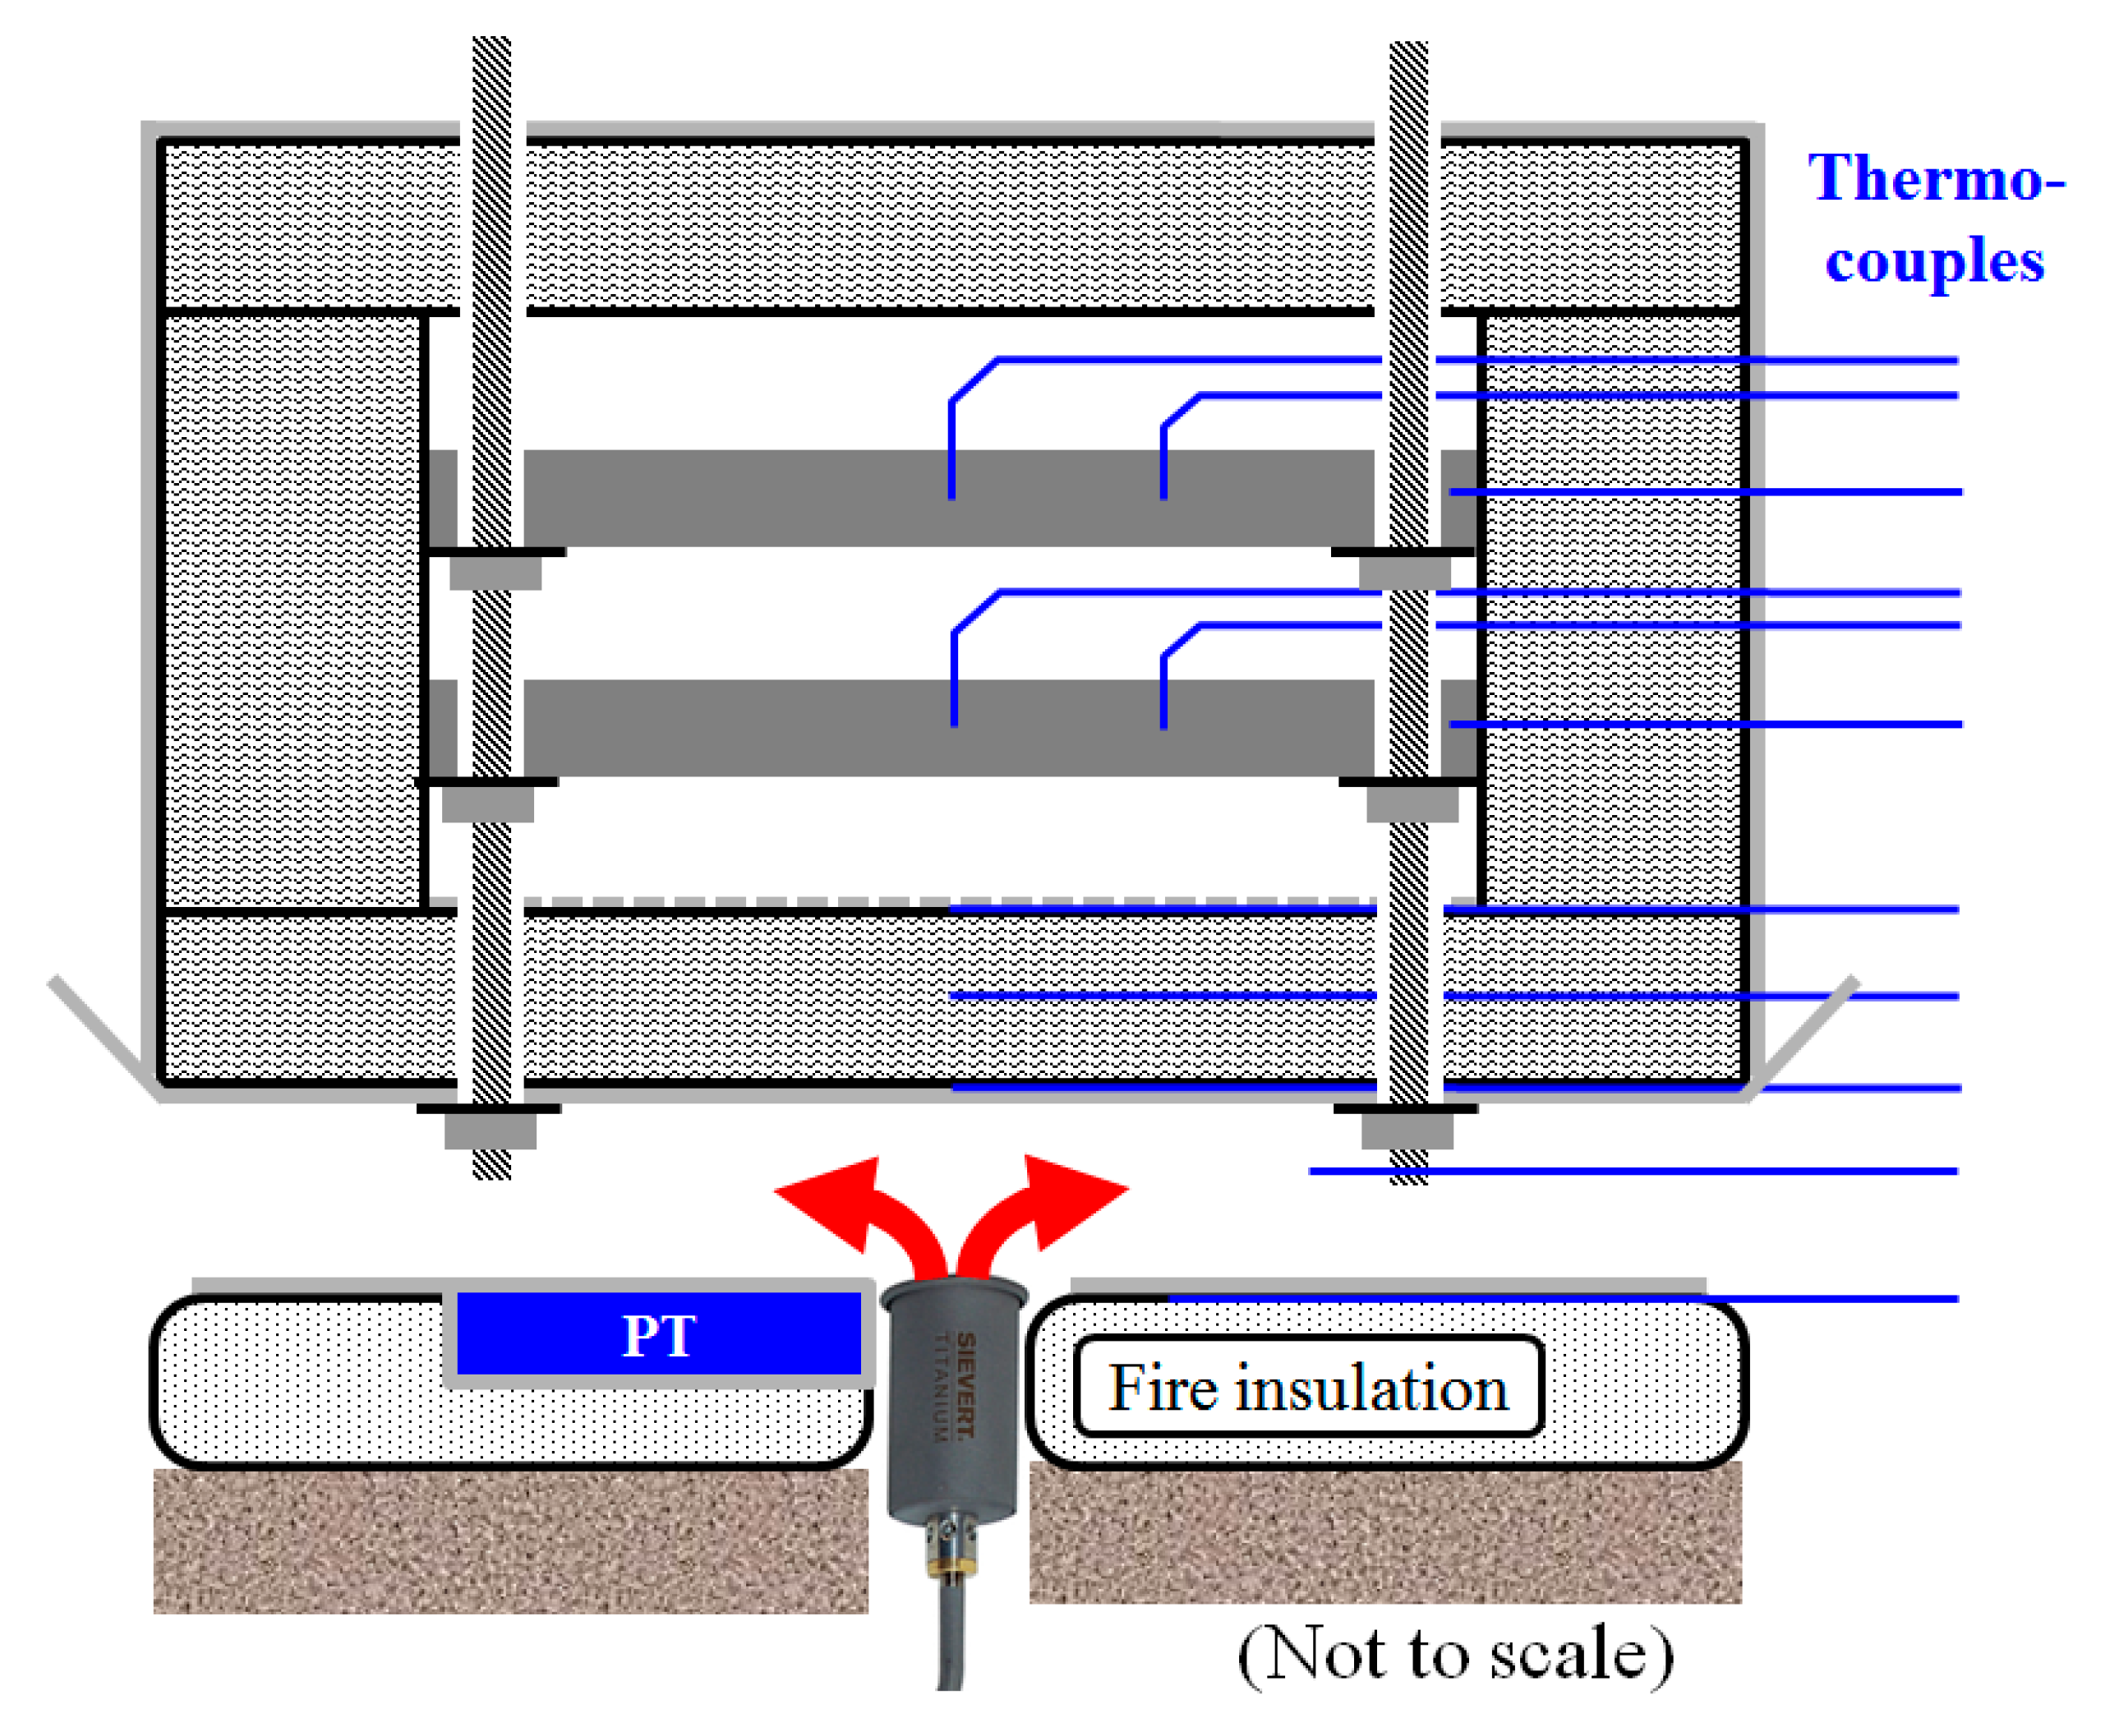
In tests like this, one may introduce cooled total flux meters to record the heat flux levels to the test object. The heat flux meter would, however, in this small-scale setting, not fit in without severely interfering with the heat flux that is received by the test object. Given a combustion chamber propane flame thickness of about 50 mm, the radiation from the exposed solid surfaces quickly dominates the heat flux levels. The best way to ensure proper heat flux levels is then to record the cladding temperatures. This may be done by fixating a thermocouple to the inner cladding surface. Alternatively, introducing a plate thermocouple directly viewing the cladding adds much information about the heat flux levels. A 100 mm by 100 mm by 20 mm thickness type K plate thermometer (100 mm PT, article number 5928050-001, Pentronic AB, Västervik, Sweden), whose function is explained in [
13,
14,
15,
16], was therefore introduced flush with the fire insulation below the flame zone viewing directly upwards, as shown in
Figure 5. It should be noted that this is the opposite of the orientation intended for such plate thermometers. In this orientation, it is mostly exposed to the heat radiation that it can view from the cladding mockup in addition to convective heat that is received from the propane flame. Facing upwards and aligned flush with the fire insulation cladding it had virtually no influence on heat transfer within the flame zone. The surfaces of the PTs are blasted, and heat treated to obtain an emissivity of about 0.9, i.e., about the same value as the suggested by the TR2237 [
12]. During the fire, it is believed that all of the surfaces approach at least emissivity 0.9 due to oxidation processes.
The active part of the plate thermometer, i.e., the stainless-steel plate, had the same thickness as the cladding used in the industry, i.e., 0.7 mm thickness. The flush mounted plate thermometer allowed for a very compact flame volume, exposing the mockup during testing. It should also be noted that the plate thermometer was not designed for the temperatures it was to be exposed to in the present work. It therefore represented an important, but weak, part of the experimental setup which needed to be validated.
To prevent excessive heat exposure to the mockup, the mockup was covered by cladding on the radial surface as well as on the top surface. The direct fire exposed cladding continued 3 cm outside the radius of the mockup and was folded and bent 45° to guide any excess flames away from the mockup, thus reducing the heat stresses and allowing for repeated testing.
3. Materials and Methods
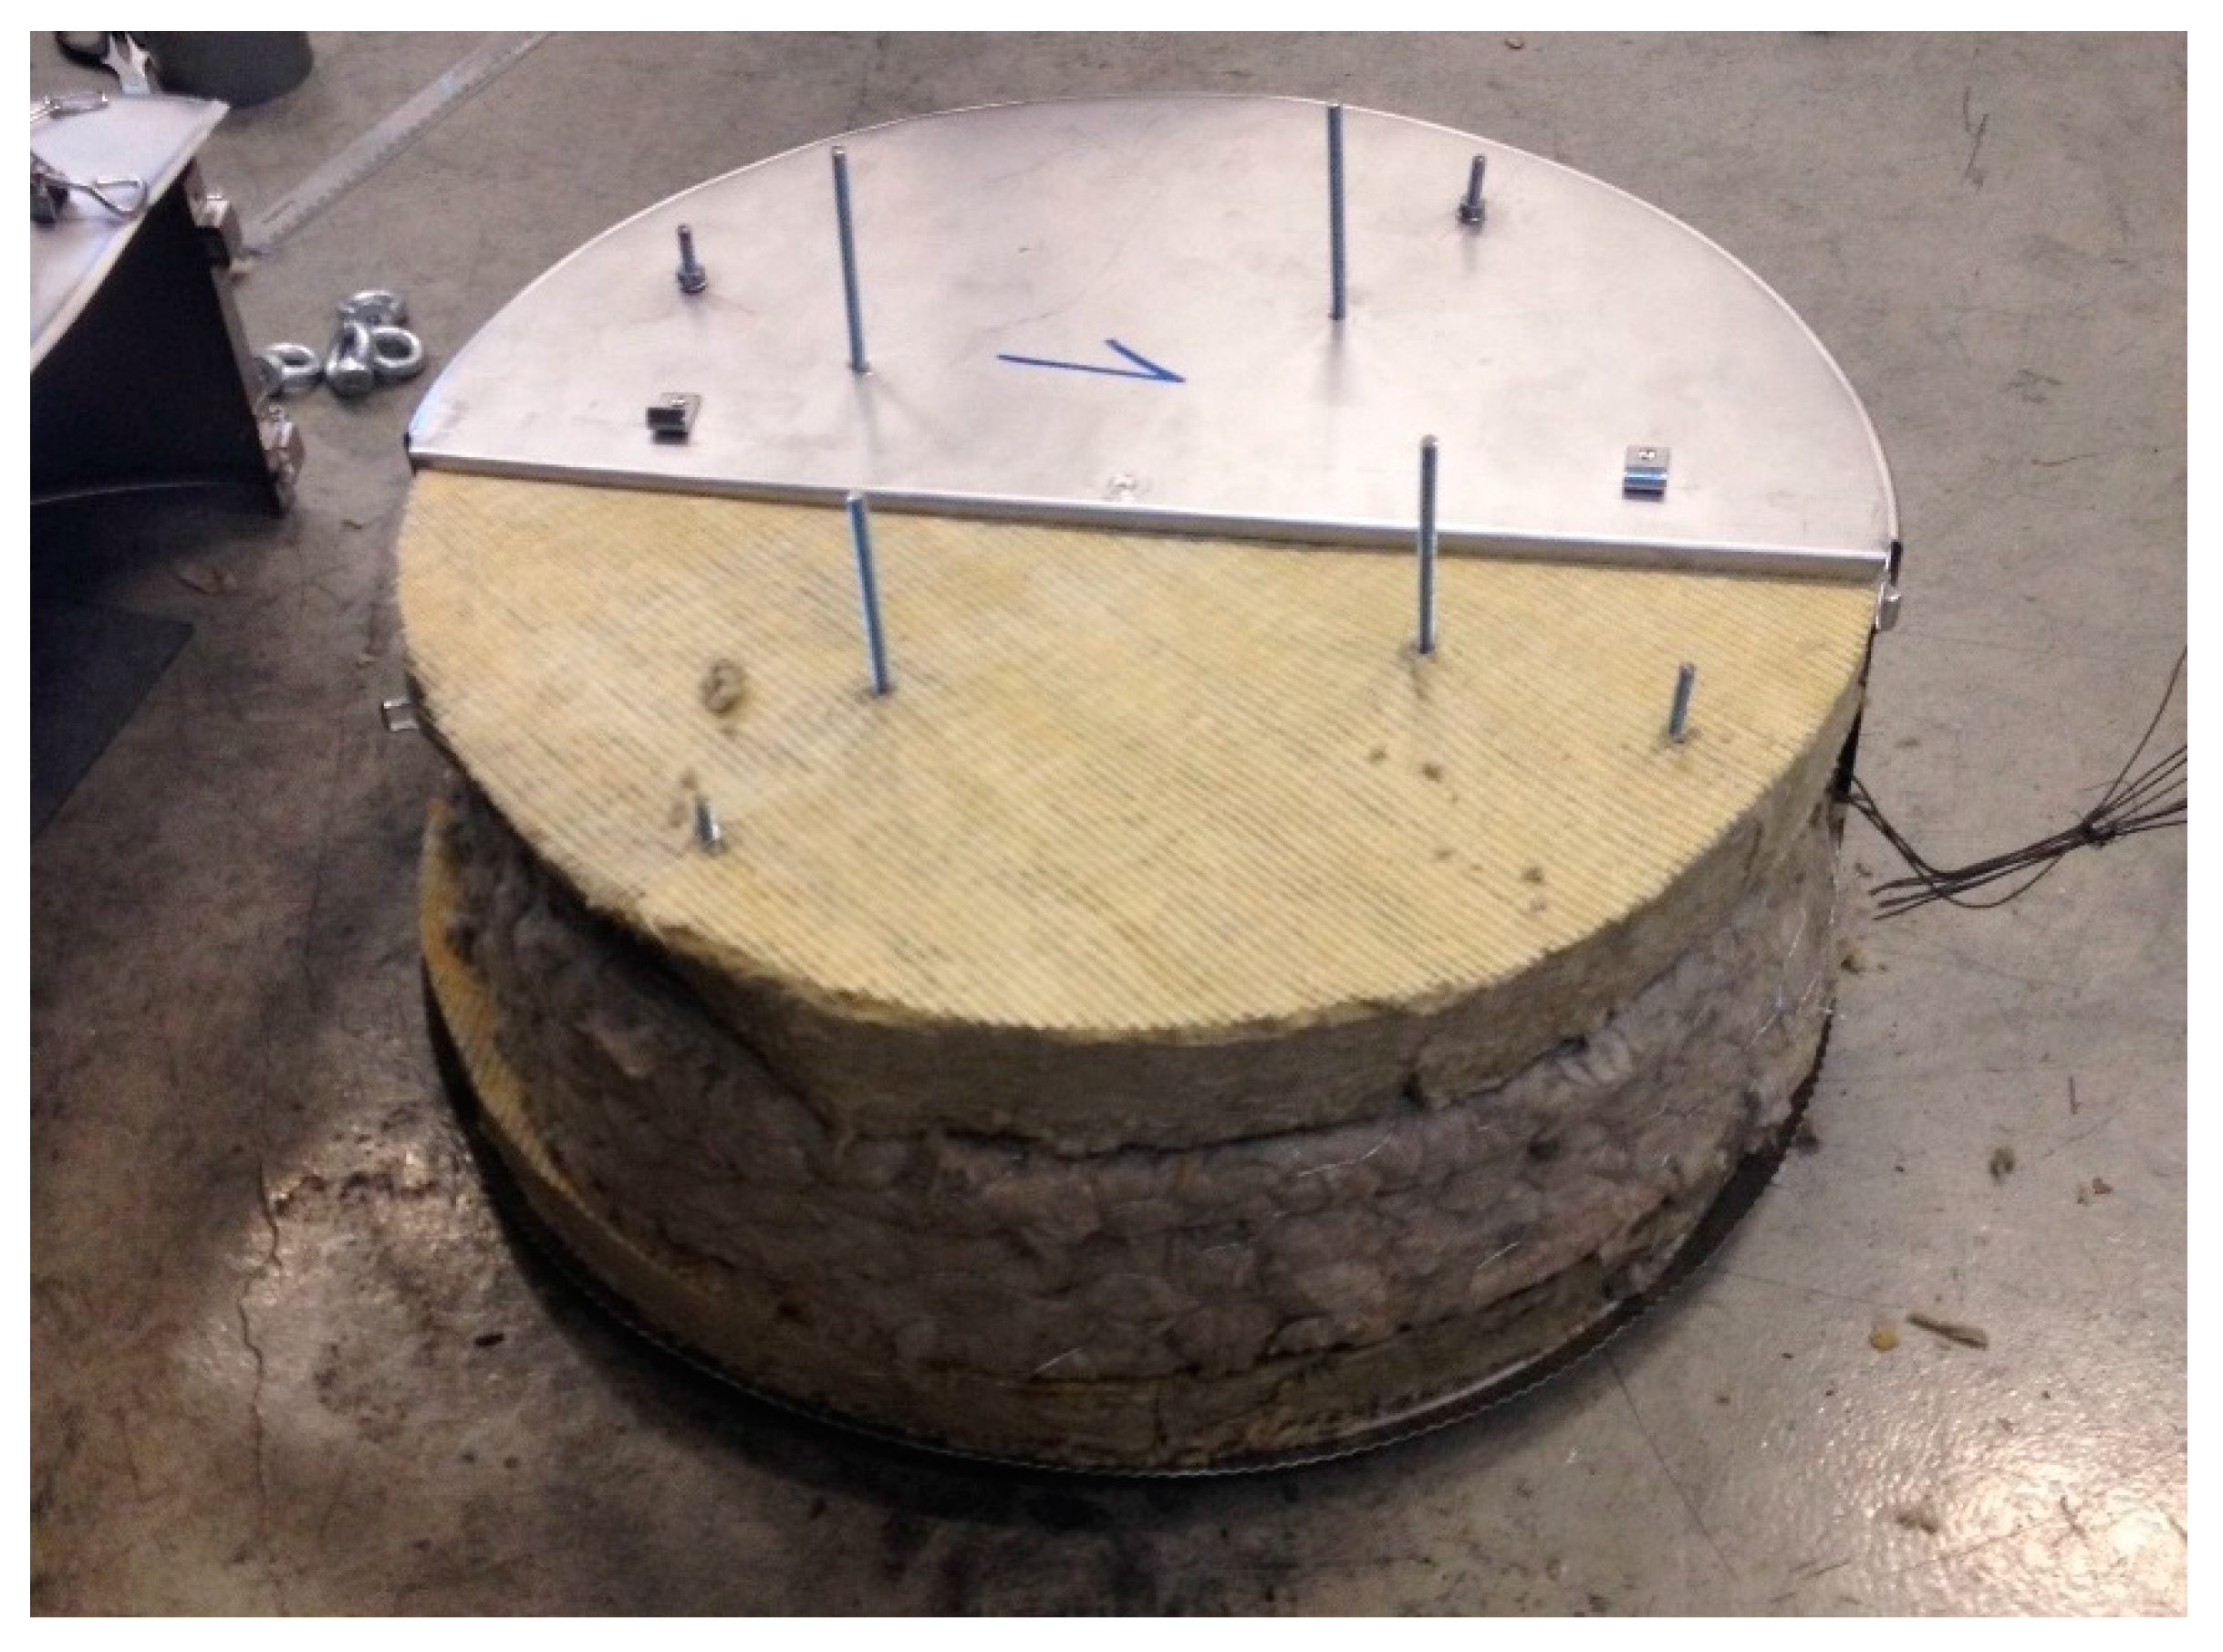
The mockup was arranged with type K thermocouples as indicated in
Figure 5. The nearly completed mockup prior to Test 1 is shown in
Figure 6. The temperatures were recorded using a datalogger (type 34970A Data Acquisition/Data Logger Switch Unit, Keysight, Santa Rosa, CA, USA (formerly Agilent’s Electronic Measurement)).
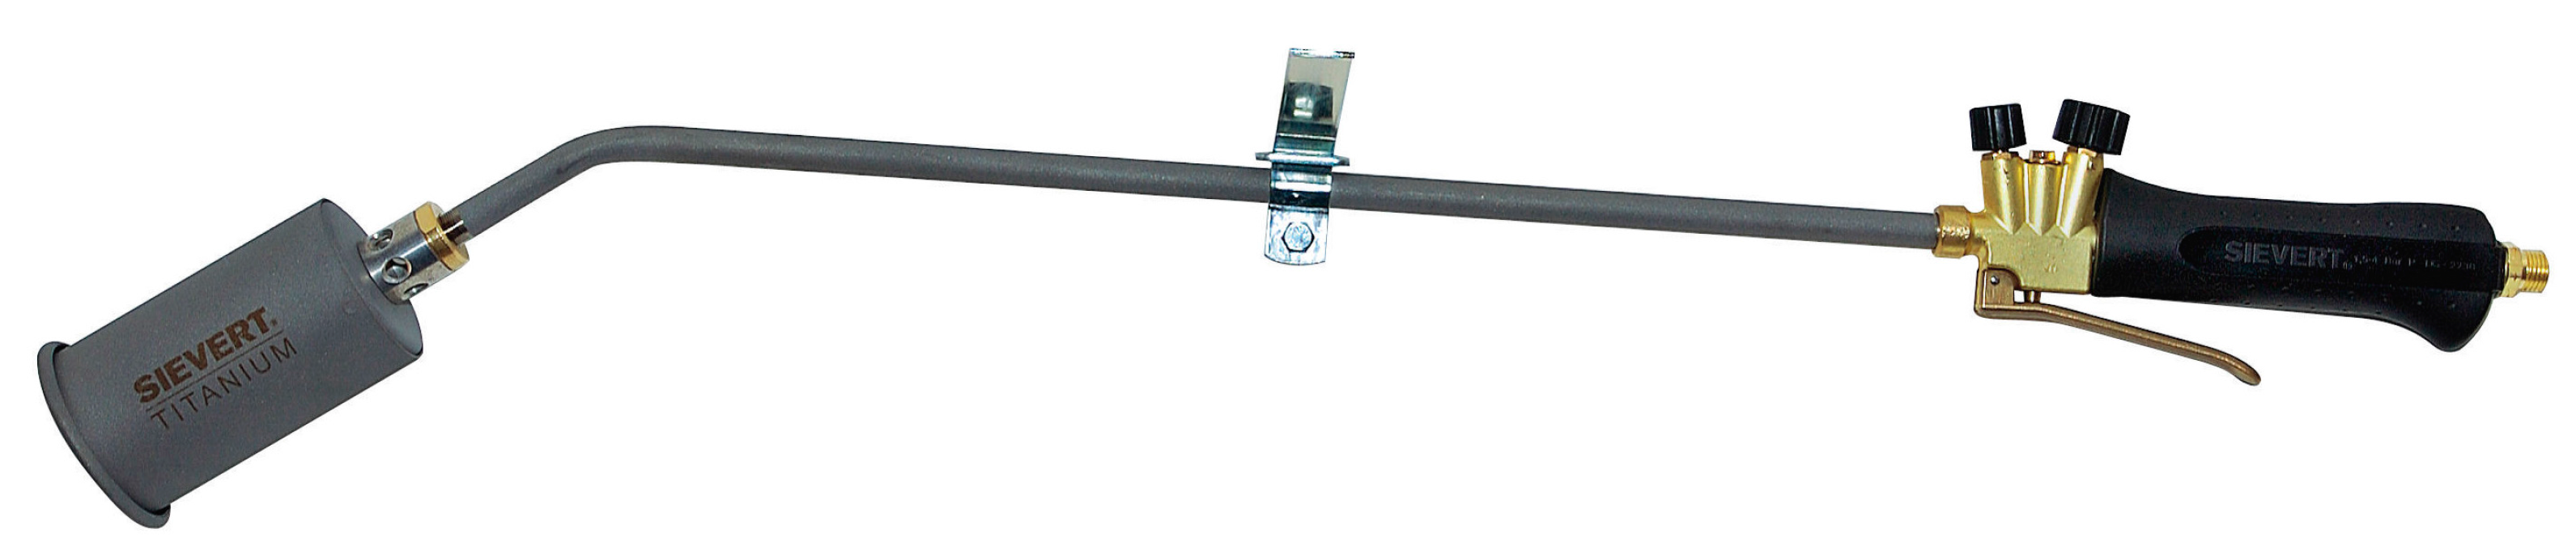
A burner (Sievert 346051, Titan 60 mm diameter), which was fed by propane gas, was used as the fire source, see
Figure 7. The burner was pre-bent about 30° by the producer and was carefully bent another 60° (bending radius 50 mm) in the present work in order to be arranged horizontally for vertical flames as indicated in
Figure 5. It was adjusted to burn with full air access. The gas supply was kept constant during the flame exposure by a flow control unit (Gas control unit, C
3H
8 225 L/min, build 2612, Brooks Instrument Inc., Hatfield, PA, USA).
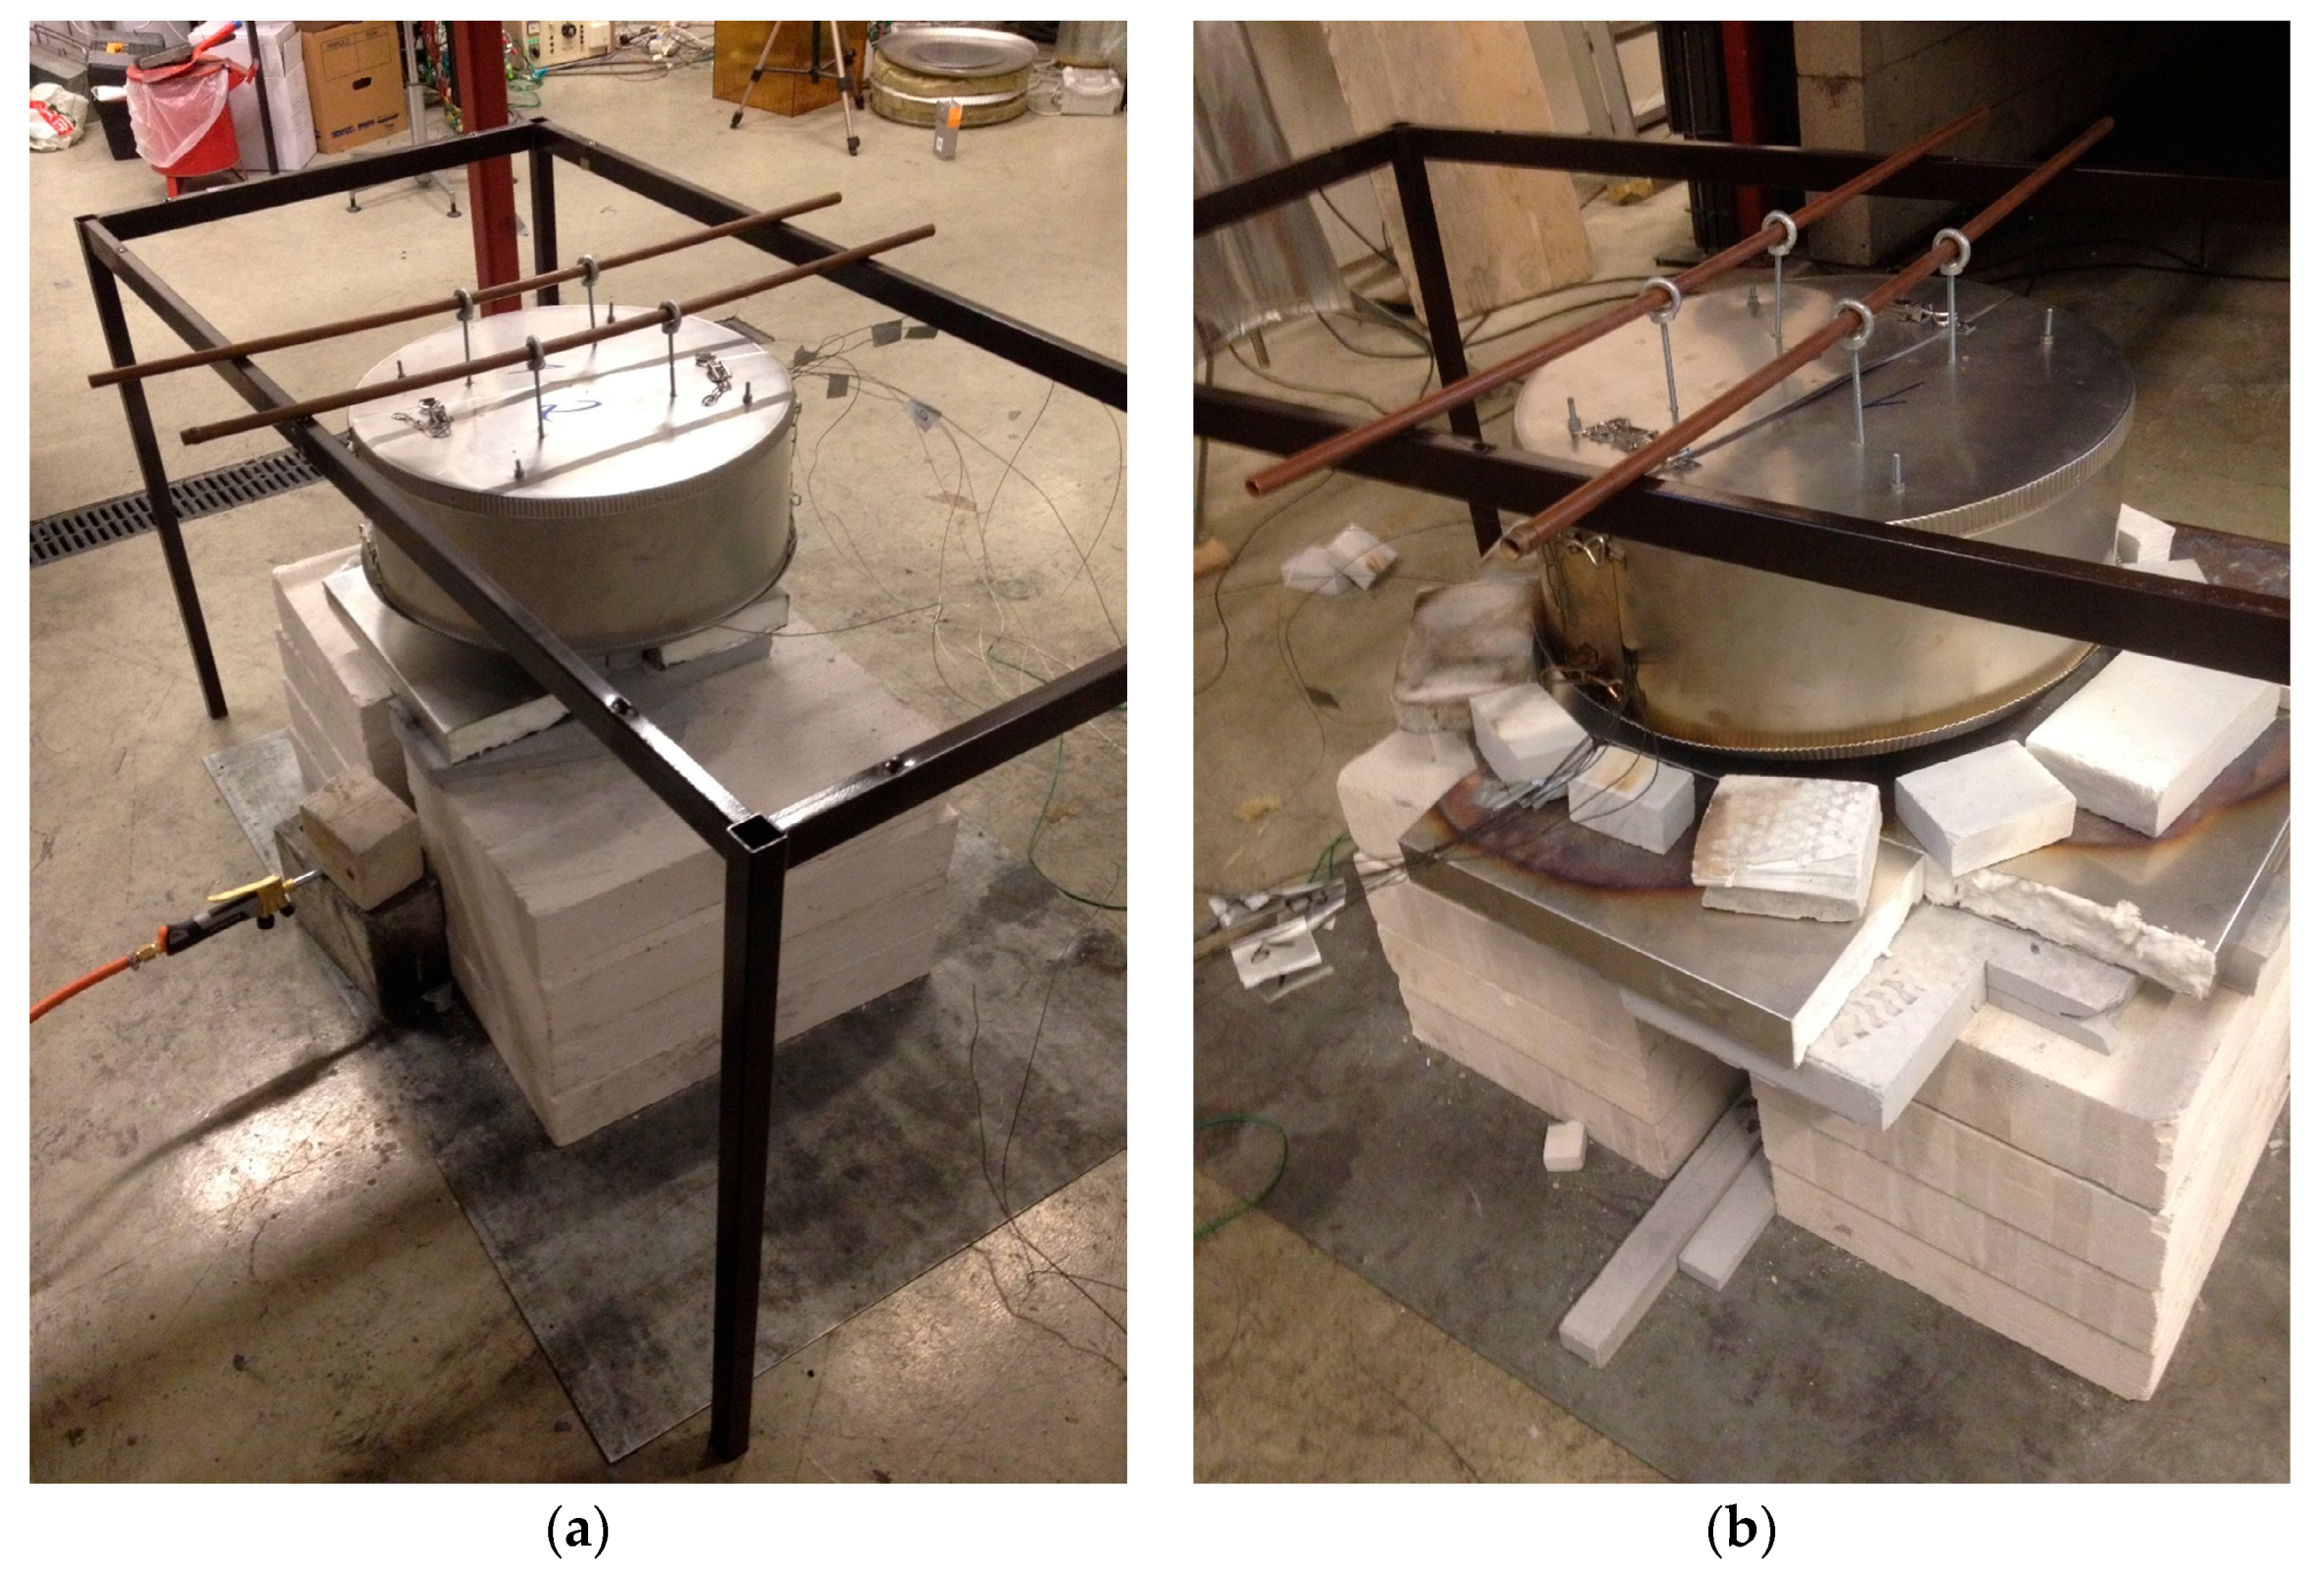
The mockup ready for testing is shown in
Figure 8a,b for Test 1 and Test 2, respectively. In Test 1, the propane supply was 0.5 g/s. There were no flame containment bricks along the perimeter during this test. In Test 2, the propane supply was 0.75 g/s and light weight bricks (Skamotek 225, Skamol Inc., Nykøping Mors, Denmark) were arranged along the perimeter of the mockup to prevent cold air ingress and limit radiative heat losses from the combustion zone. In addition to contributing in re-radiation, the light weight bricks reduced the view factor of the ambient considerably, as well as ensured gas flow in positive
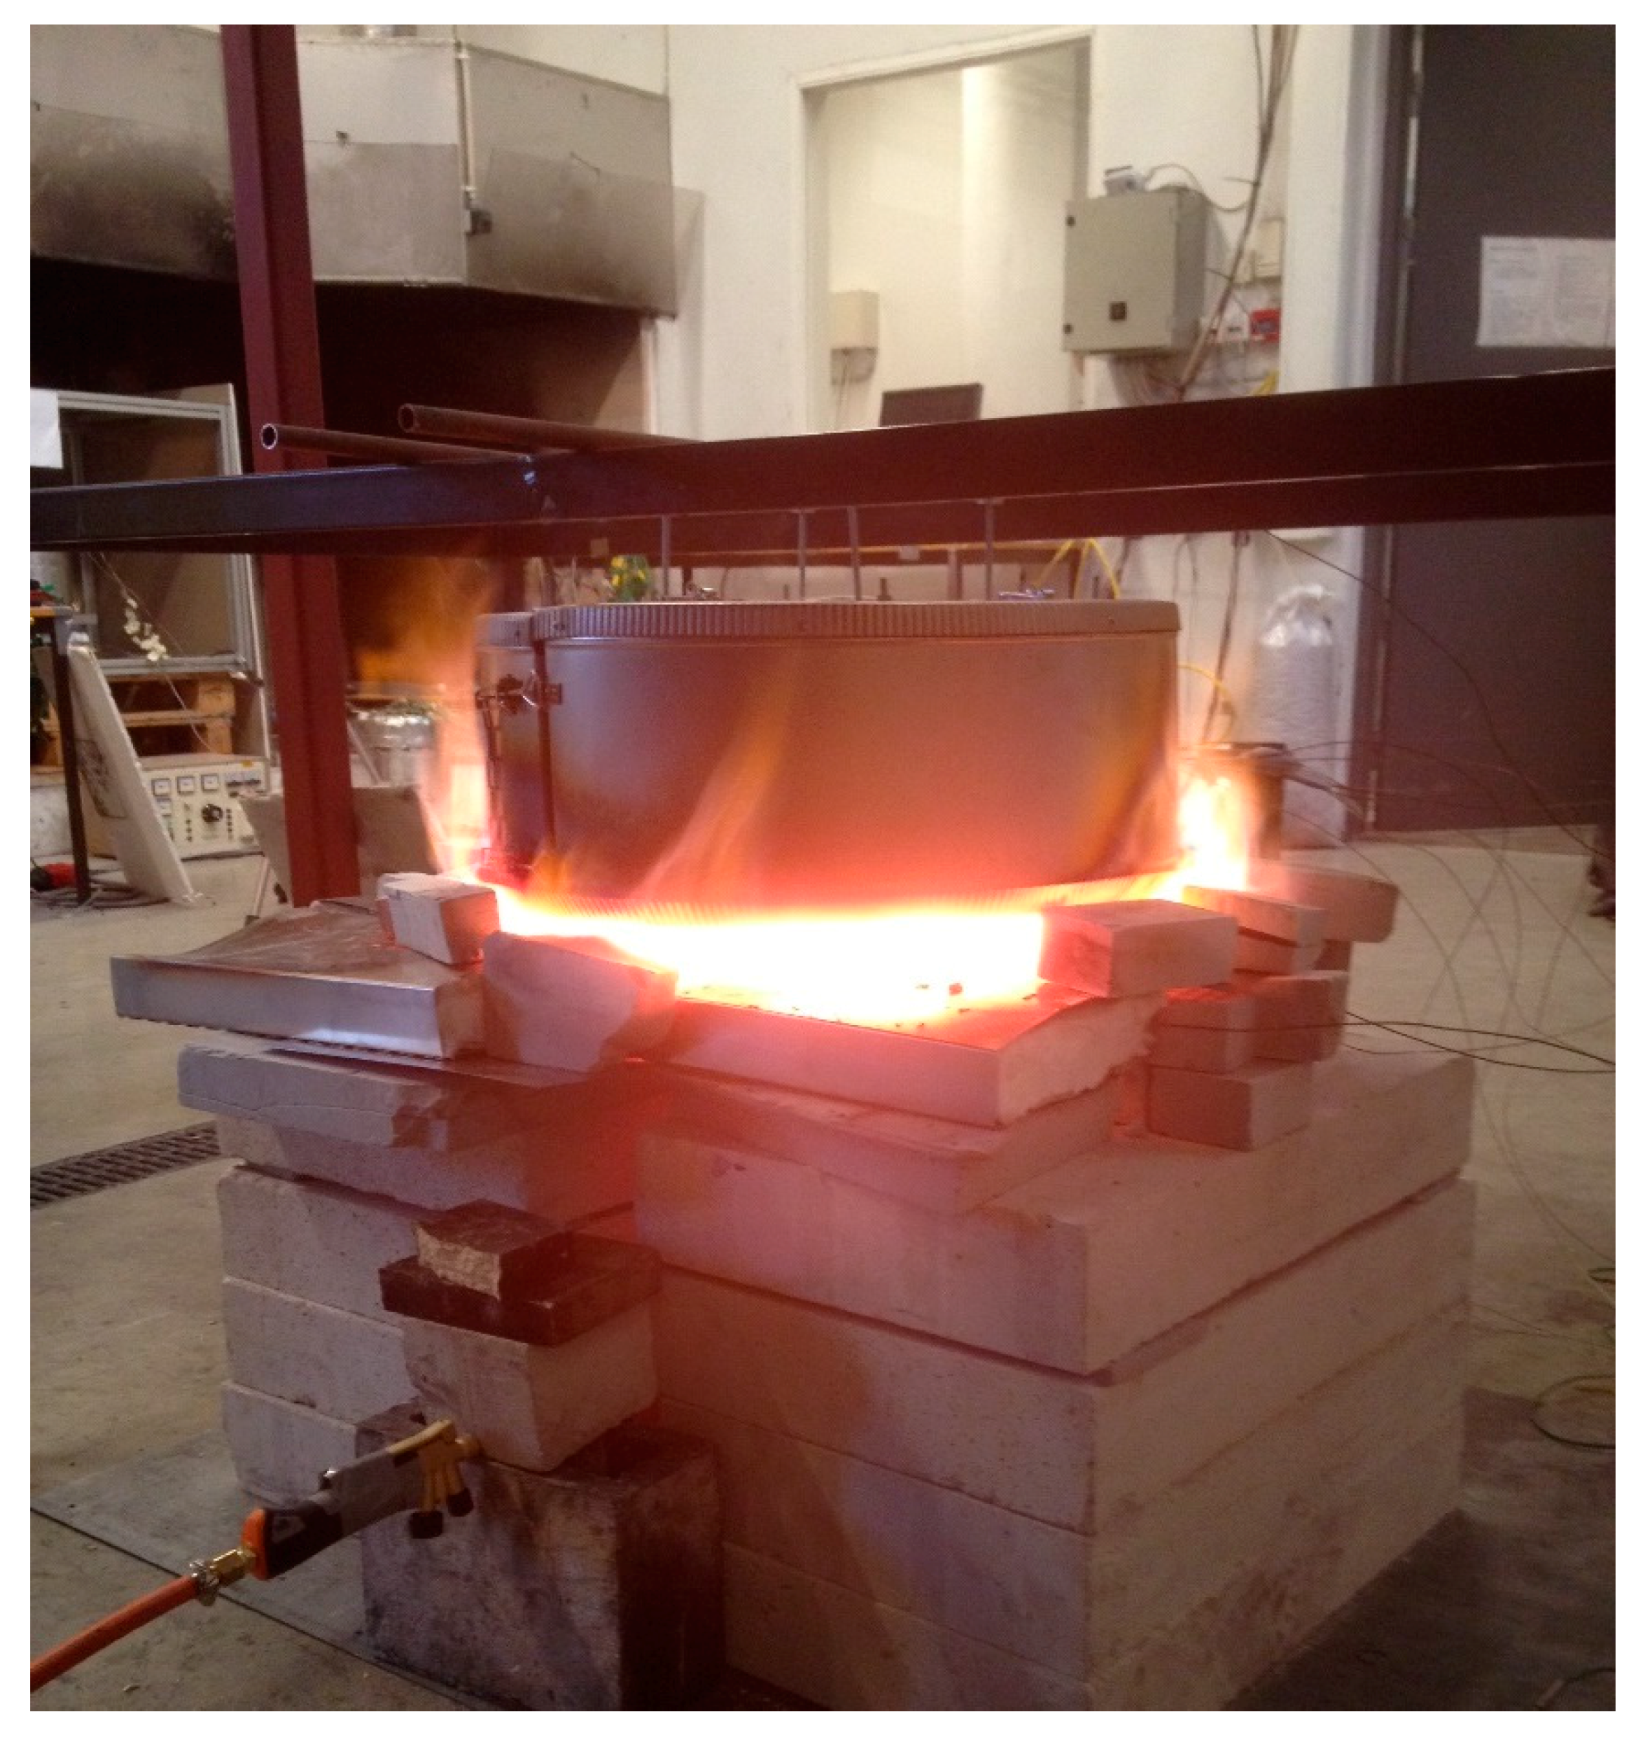
r-direction. A photo of the last seconds of Test 2, when some of the light weight bricks were removed for visual inspection, is shown in
Figure 9.
4. Results
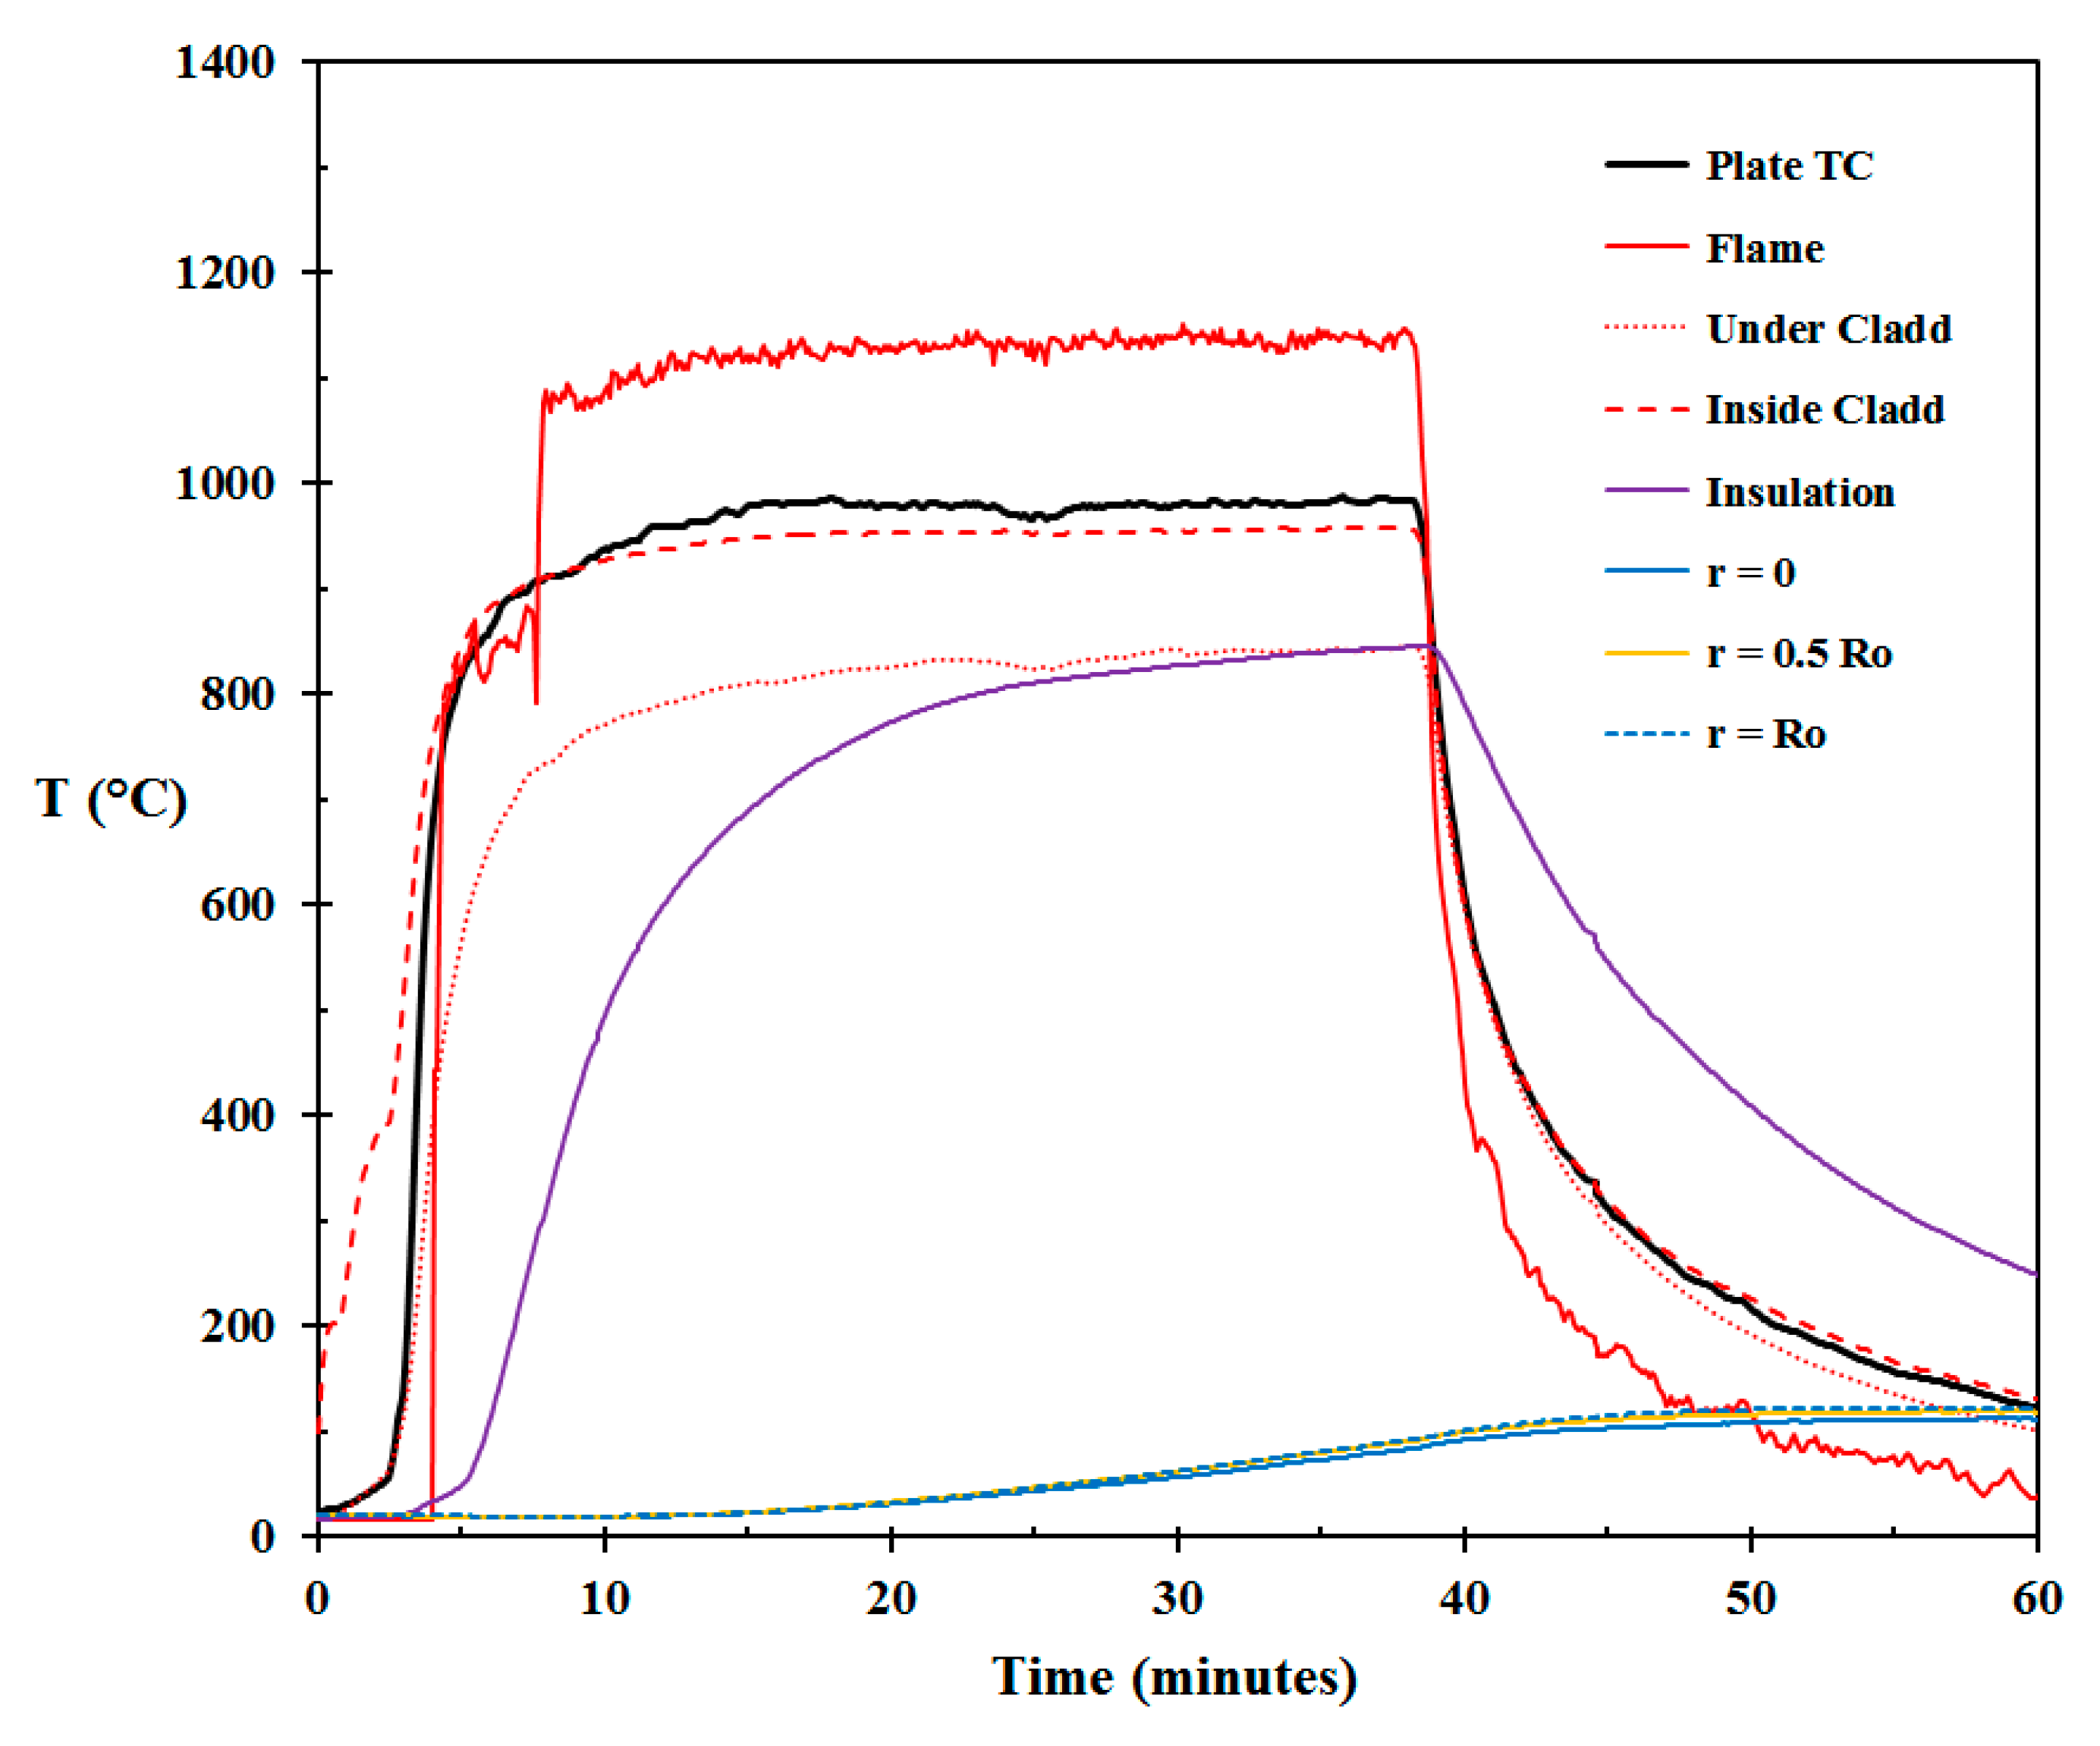
The temperatures recorded in Test 1 are shown in
Figure 10 (an initial problem with one thermocouple was resolved after about 8 min). The recorded flame temperature was above 1100 °C. The plate thermometer (PT) did, however, record much lower temperatures. The explanation for the discrepancy between the two temperature recordings may be a result of the PT also viewing the ambient temperature outside the flame zone and/or cold air entering the lower part of the flame zone cooling the PT. The PT temperature and the temperature inside the mockup cladding show similar temperatures. The temperature recorded just below the cladding protecting the fire insulation below the flame zone show even lower temperatures. This clearly indicates ambient air ingress cooling the lower parts of the flame zone.
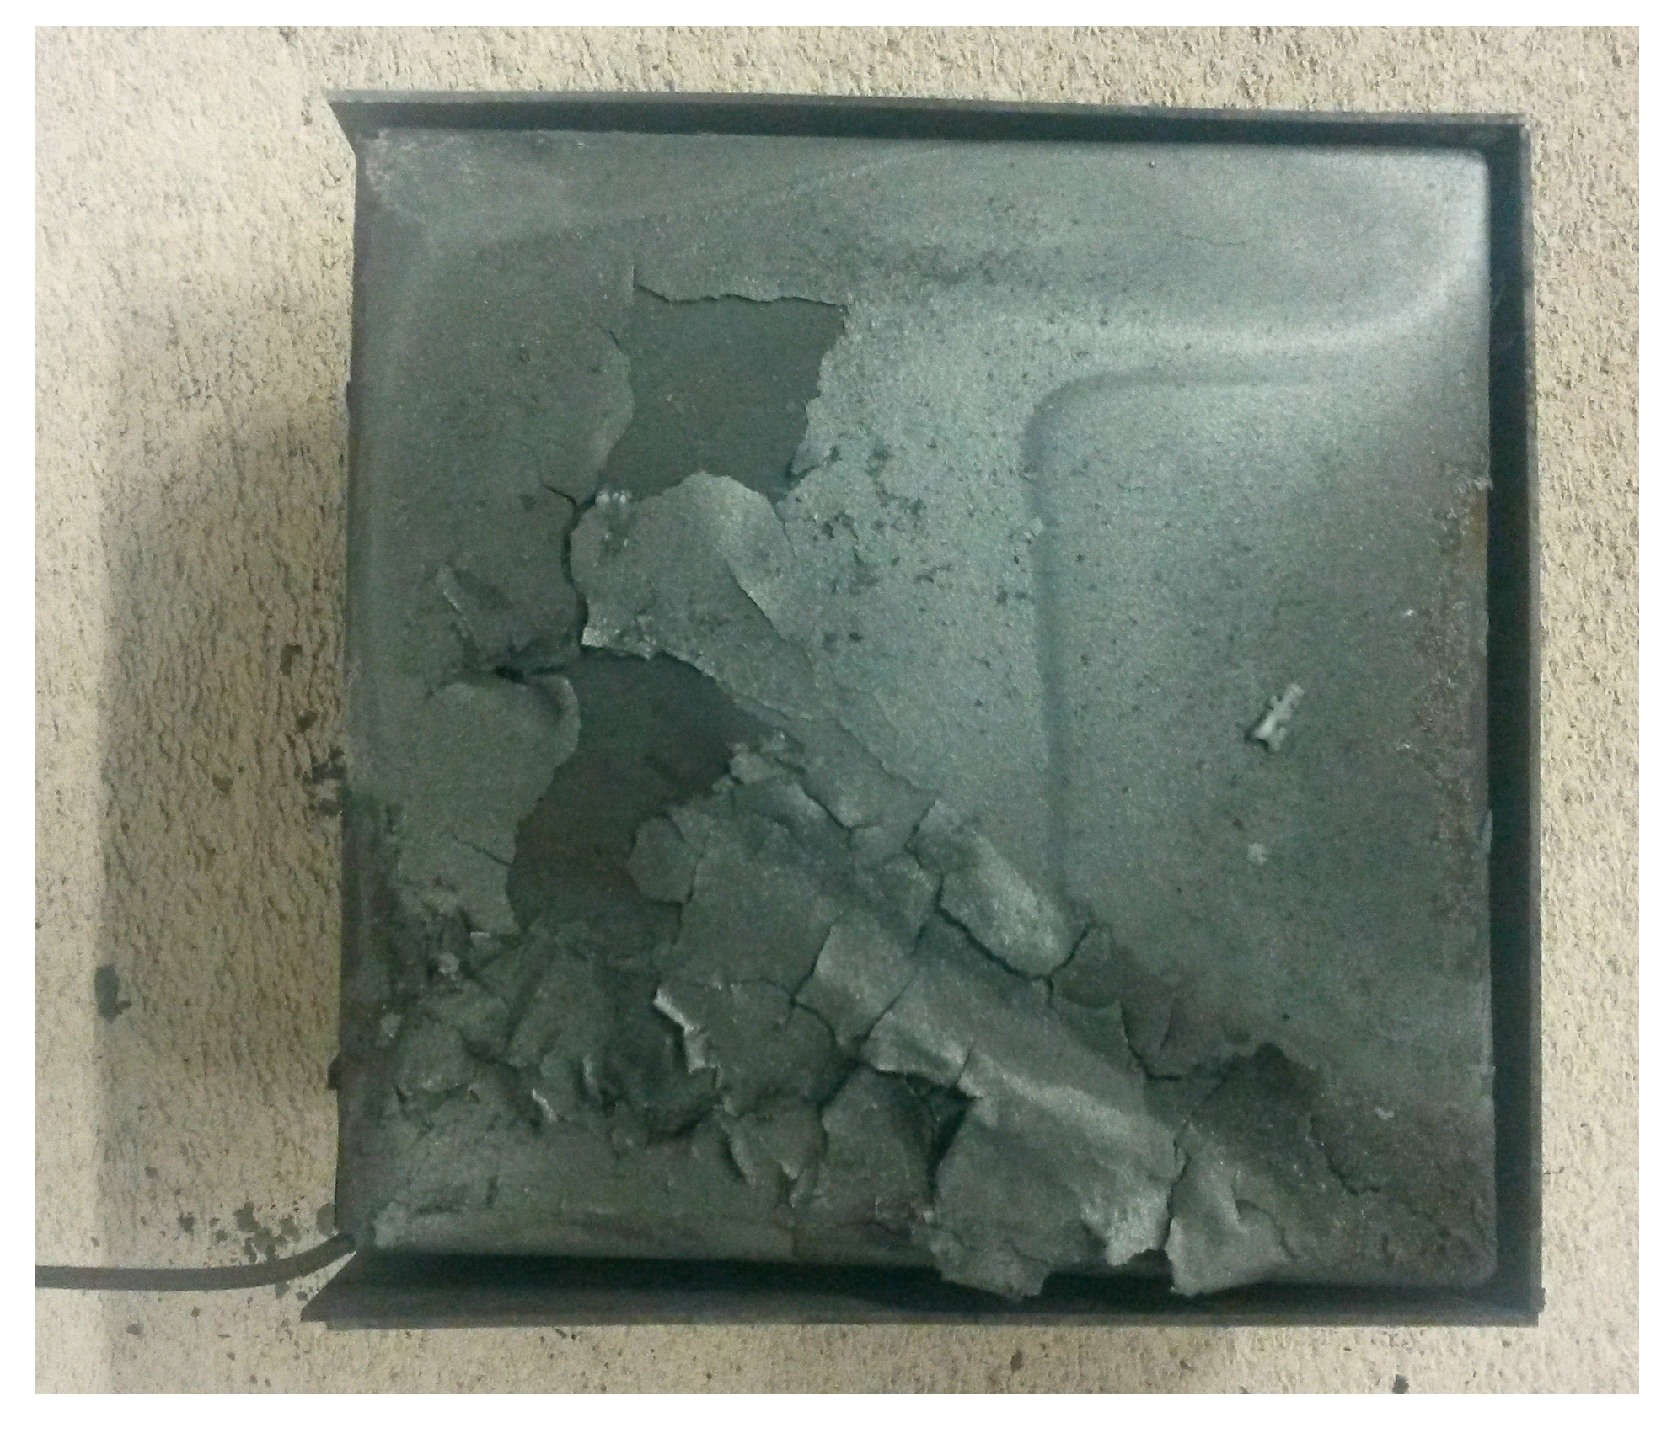
The thermal insulation survived the 30+ min heat exposure, as seen in
Figure 11a. The cladding suffered some spalling, but it kept its flame deflection capacity during the fire exposure.
The experience with the open flame zone was a strong motivation for (i) increasing the propane flow, and (ii) introducing flame containing light weight bricks limiting ambient air ingress to the flame zone, and serving as ambient conditions radiation shields and re-radiation units.
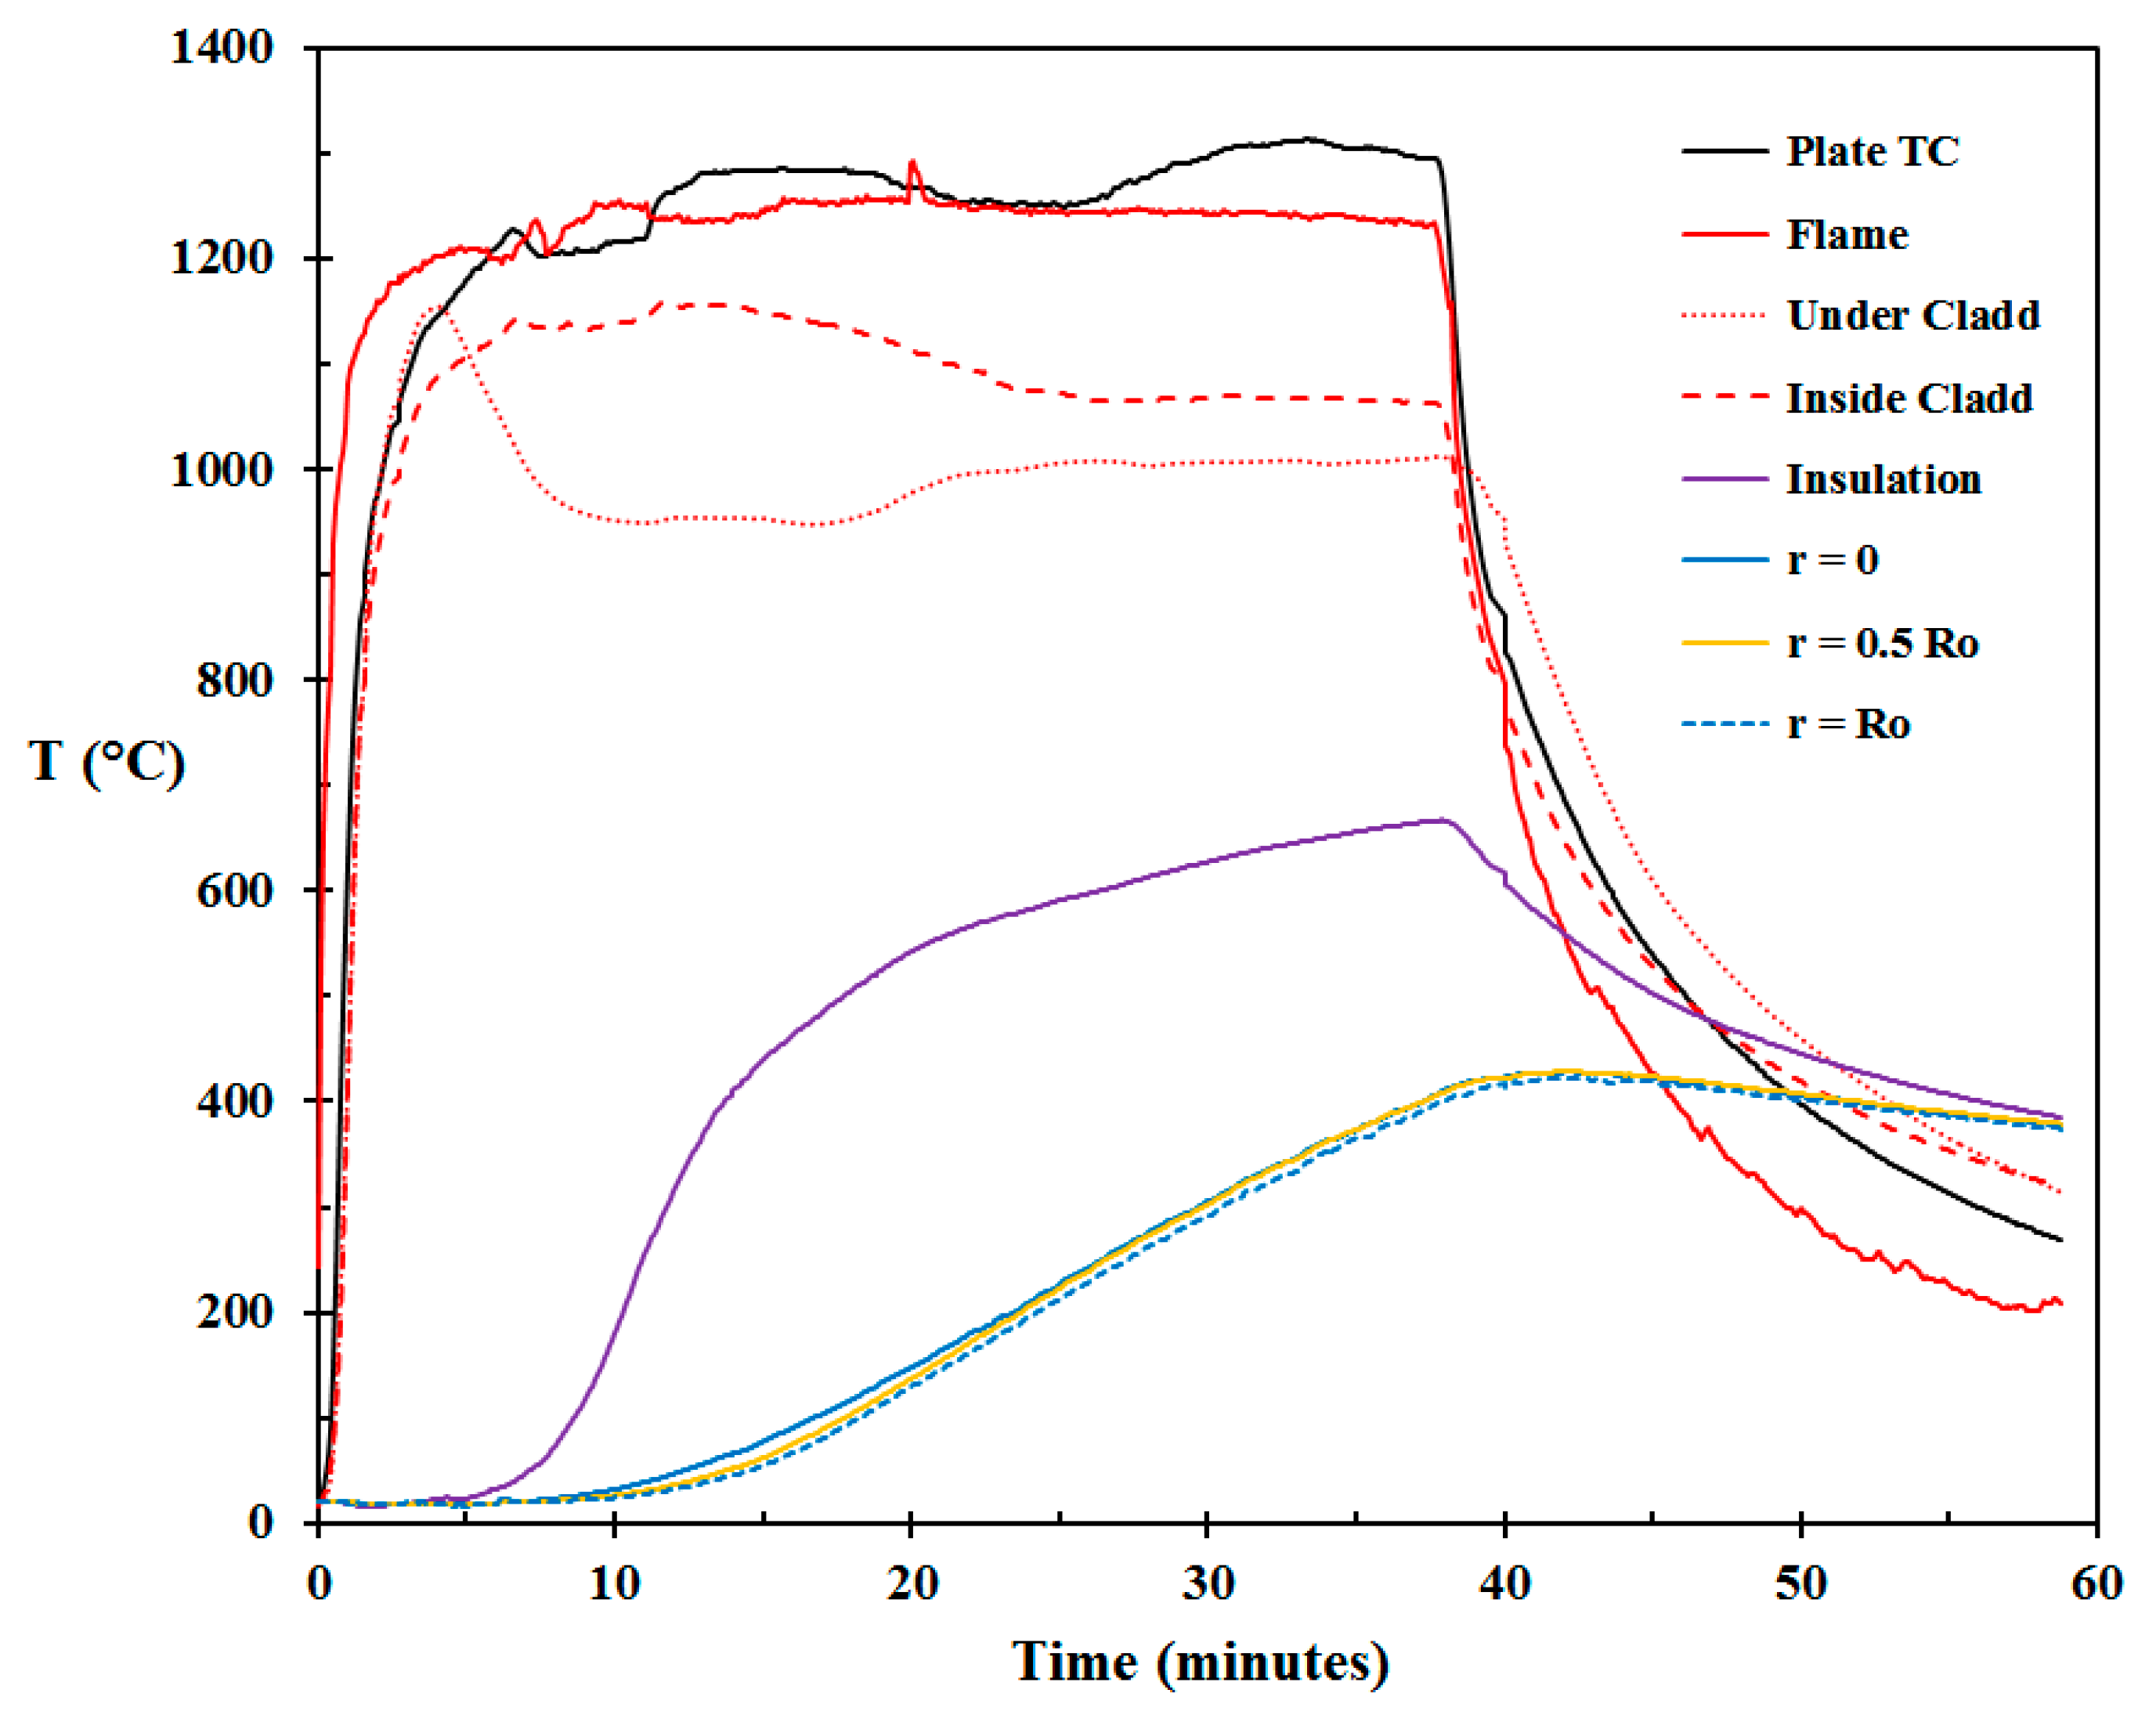
The temperatures recorded in Test 2 are shown in
Figure 12. It is clearly seen that this test exposed the mockup to a far more severe fire scenario. The temperatures recorded in the flame zone were more than 100 °C higher than in Test 1. For most of the test the flame temperatures, as well as the PT temperatures, were well above 1200 °C.
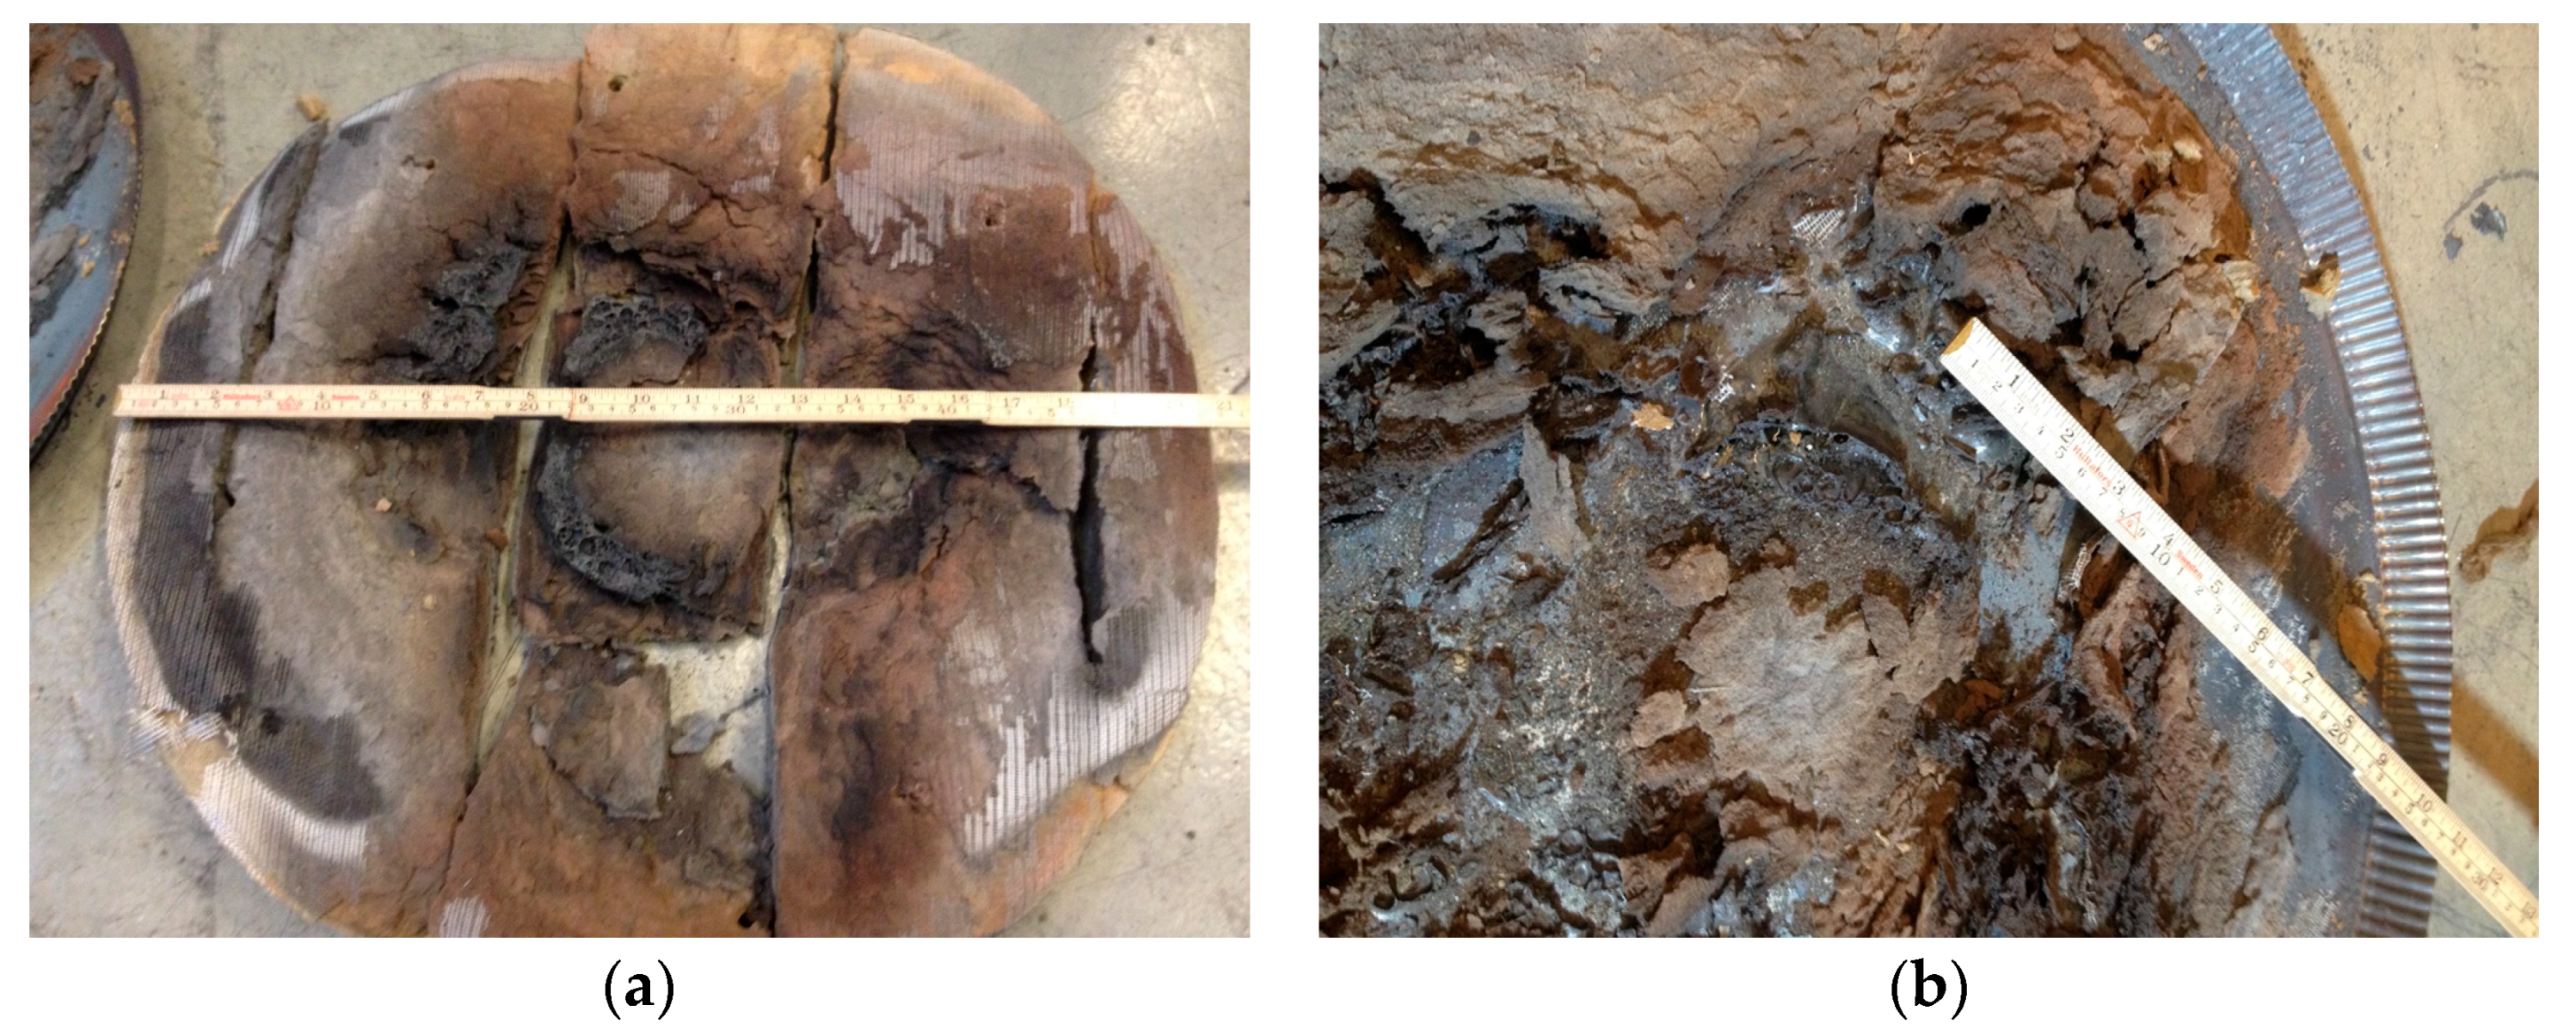
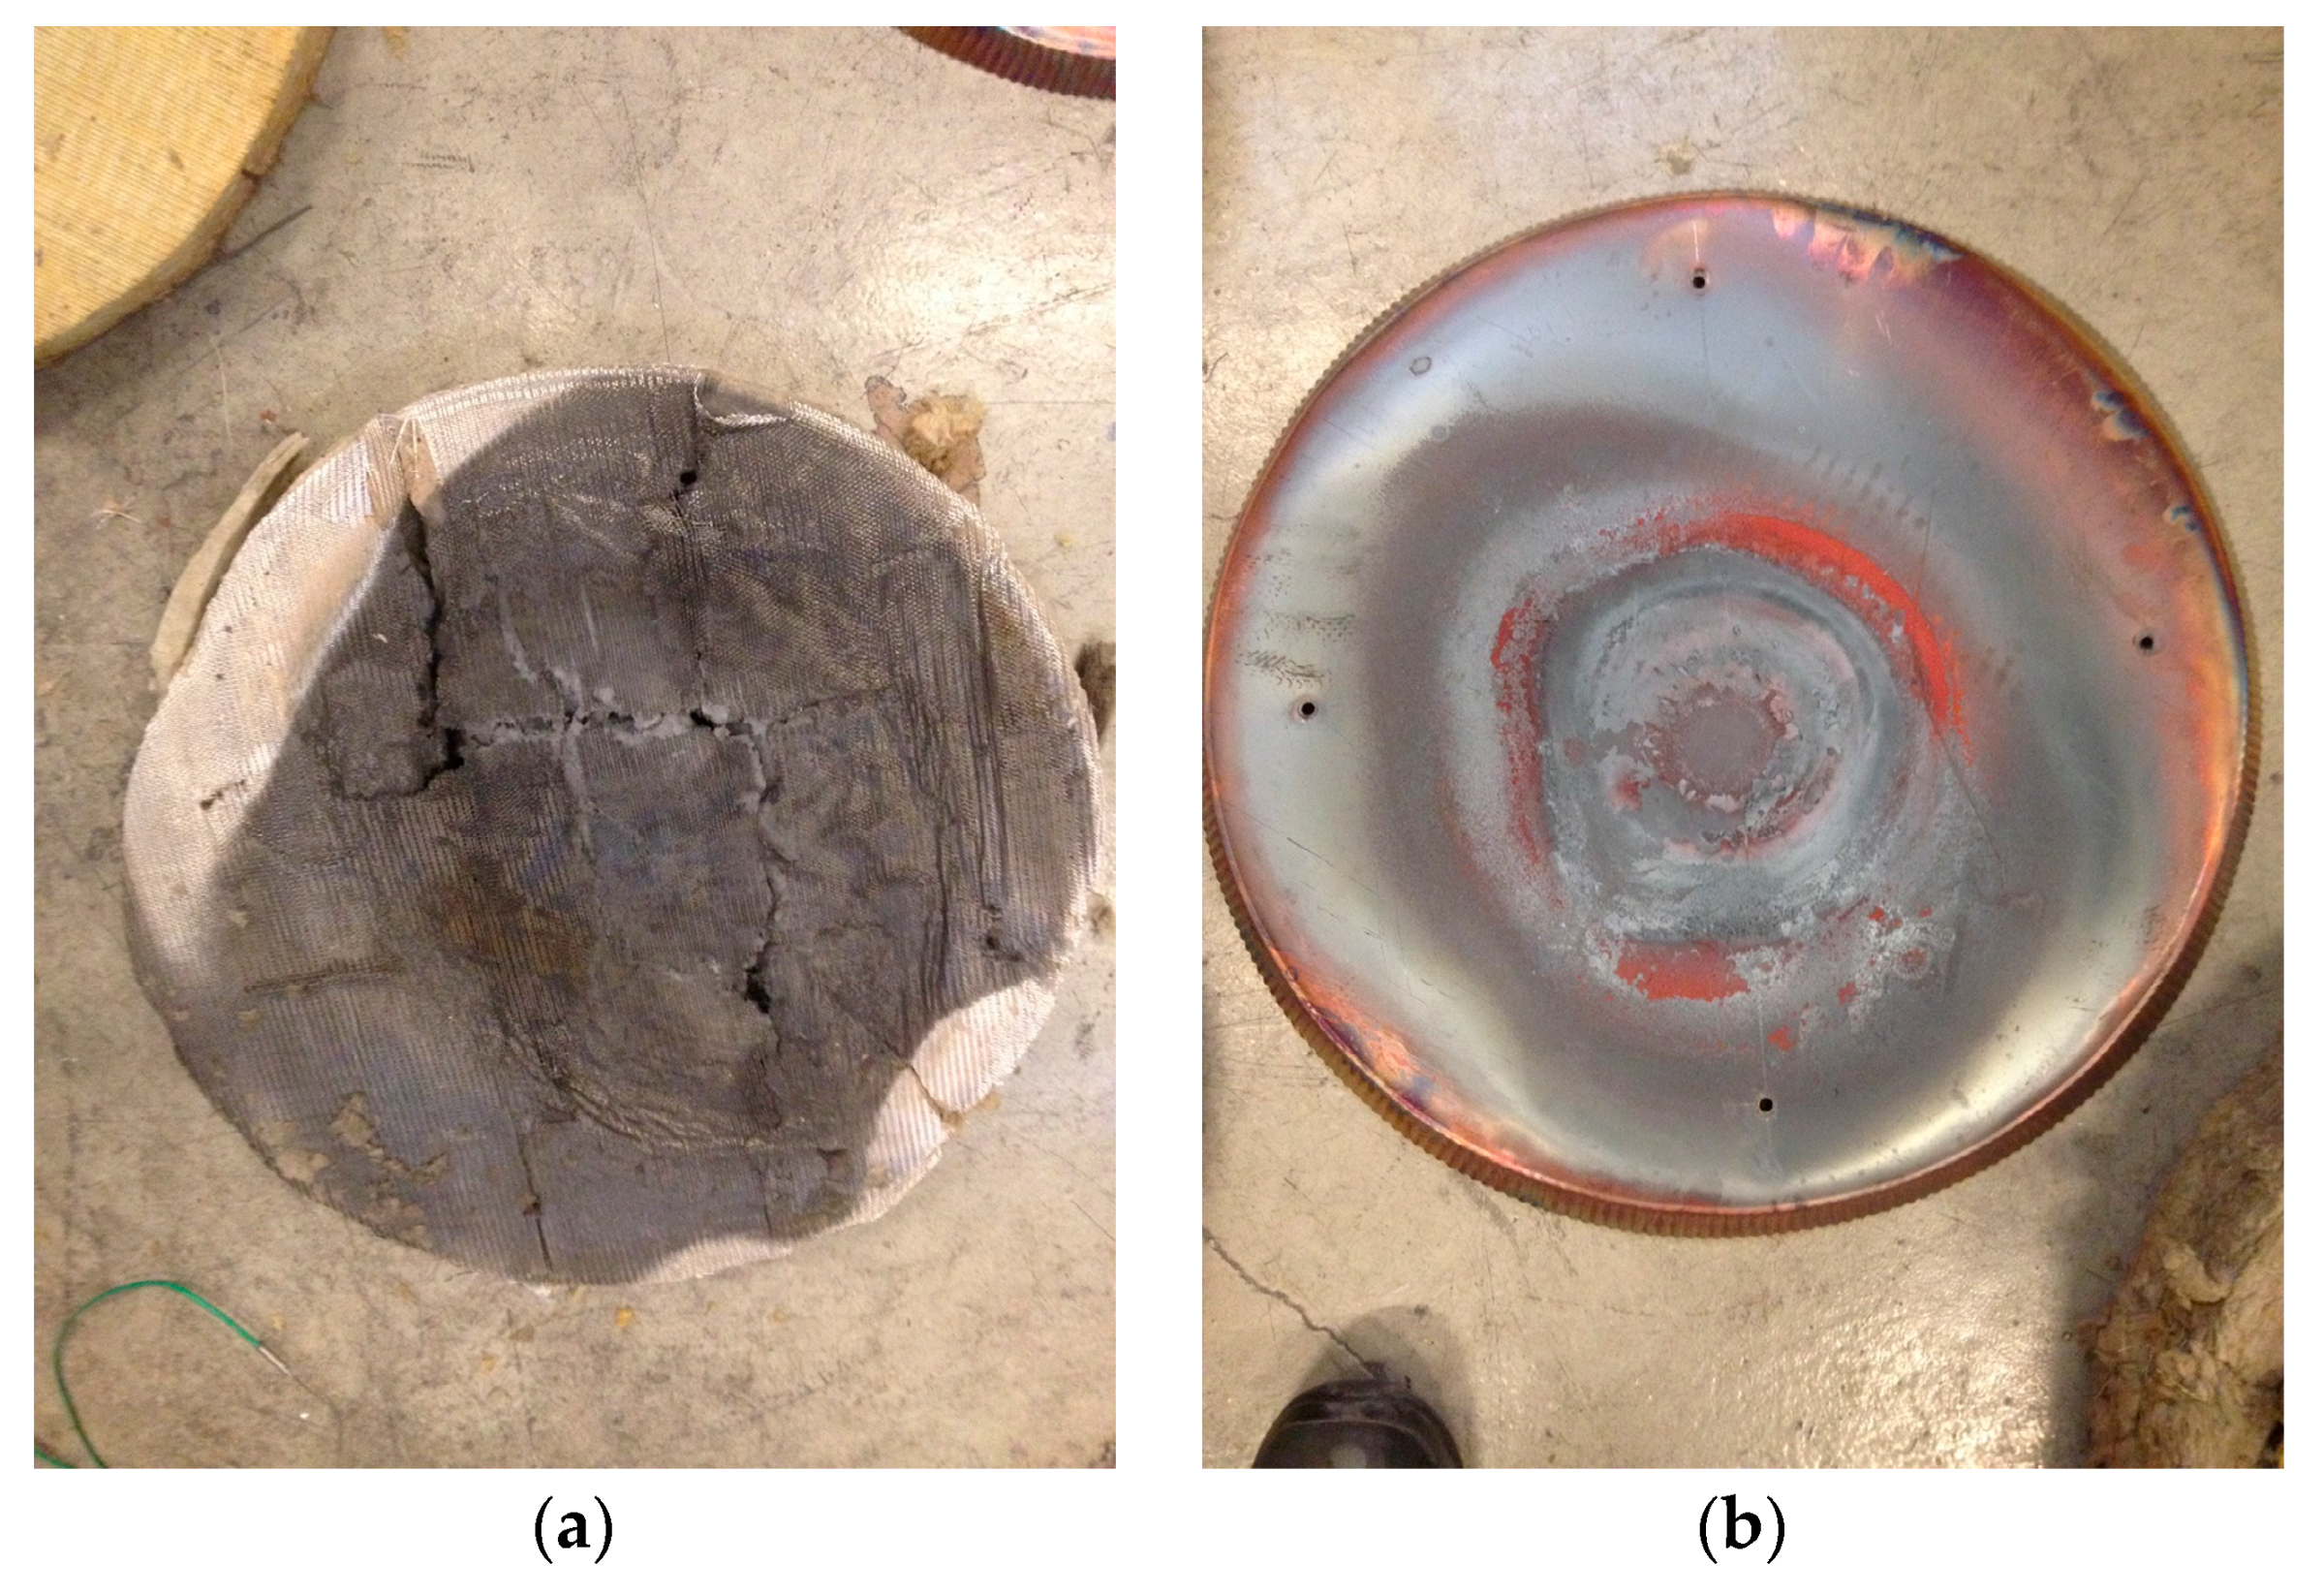
The thermal insulation was, as shown in
Figure 13a,b, severely deteriorated. Traces of glass-like material were observed within the remains of the thermal insulation. Some of the remains showed a powder like structure, which still reduced the heat flow from the flame exposed cladding to the steel plate.
The temperature of the plate thermometer (PT) varied significantly through the test. Spalling, as seen in
Figure 14, may influence the temperature to a minor extent. But, as there is only a small heat flow through the thermally insulated PT, there must be other explanations for the varying temperature. Air drafts through the experimental set-up may be a sound explanation.
The temperatures just below the fire insulating cladding during the first 4–5 min closely followed the PT temperatures. This indicates that the ambient air flow keeping the temperature much lower in Test 1 was prevented in Test 2. In
Figure 12, it is observed that the temperature below the fire insulation cladding at about 5 min started to decrease. This is probably due to the thermocouple loosing contact with the cladding due to buckling. The thermocouple inside the mockup cladding was not fixed and lost contact when the cladding surface buckled. A similar effect was not observed for the plate thermometer, in which, the thermocouple junction is welded to the rear side of the exposed surface. The plate thermometer therefore represented the best source of surface temperature recordings in these tests.
The most interesting observation is, however, that the temperatures recorded in the 16 mm thick steel plate for 30+ min stayed below 400 °C. This is a good indication of the total system fire resistance in this particular case where the steel plate represented a significant heat sink. It is also seen that the temperatures at the center of the steel plate, i.e., at r = 0, and halfway out to the perimeter, i.e., at r = 0.5 Ro, generally do not deviate much. There are, however, some differences between these two temperatures from 10 to 20 min. This may be due to a higher convective heat transfer at the point of propane jet fire impingement, while the gradually increasing radiant heat flux levels average this out. It may, however, also be due to random effects as the thermal insulation starts to disintegrate.
The temperature at the edge of the steel plate, i.e., at r = Ro, seems to lag behind about 12–13 °C. This may be explained by an uneven decomposition of the thermal insulation. It should be noted that the center of the PT, i.e., the thermocouple junction, was located at a radius of about 115 mm. It therefore probably did not record the highest temperatures of the system, which was probably within the inner 20–30 mm radius of the exposed cladding. The PT temperatures may therefore be representative for a major part of the tested surface.
Conservatively, the highest temperature of the steel plate, i.e., at r = 0, and the temperature of the plate thermometer could be used to describe the survivability of the modern distance insulation in a fire scenario. Based on the current small scale test, this system in the case with 16 mm wall thickness would most likely survive more than 30 min exposure to a hydrocarbon pool fire.
5. Discussion and Conclusions
The scope of the present study was to present a new concept for small scale fire testing of hydrocarbon process equipment. By rethinking fire testing from large flames exposure to heat radiation from thermally insulated stainless-steel surfaces, high temperature thermal exposure could be achieved in a small-scale set-up using a 25 kW test fire. With flame impingement and ambient air flow breakers also working as re-radiation solids, the test setup was capable of producing heat flux levels of 250 kW/m2, and probably even approaching 350 kW/m2. It was documented that air flow breakers were necessary to make the small-scale testing work as intended.
The target “fire temperature”, given 0.85 in emissivity of the stainless-steel parts, was 1200 °C. The plate thermometer (PT) worked well as an indicator of the fire intensity. Buckling was an issue in the reported tests, both for the mockup cladding and for the fire insulation cladding below the flame zone. The mockup cladding buckled severely, which would also be expected in a real fire. The fire insulation cladding also buckled. It was the first time a PT was tested in an intense fire well above its working temperature by this research group. As mentioned, the plate thermometer did not buckle significantly. It may be that the 100 mm by 100 mm size, as well as the welding, bent edges, etc. prevented the PT buckling even at temperatures briefly above 1300 °C. Though testing of new equipment was not part of the present study, the authors were quite surprised by the PT performance. It seems promising for future high heat flux level fire testing and research.
It was demonstrated that the thermal insulation was able to keep the temperature of the 16 mm thick steel plate below 400 °C for more than 30 min during exposure to heat flux levels that were well above 250 kW/m2. This result may indicate that work and cost may be saved when refurbishing old hydrocarbon processing equipment. It is believed that the 16 mm plate acted as a significant heat sink. Without this heat sink in close proximity to the heat exposed thermal insulation, the insulation may disintegrate faster. The current tests can therefore not be used to evaluate situations where thinner metal walls with less heat capacity are to be protected by thermal insulation.
The concept of small scale testing and using the PT as an indirect non-disturbing heat flux level sensor worked well. Fortunately, the exposed stainless-steel surface of the PT had a thickness that was similar to the cladding used in the industry, i.e., used in the mockup. While a radiometer or total heat flux meter would disturb the experimental setup, the PT, when placed flush with the fire insulation cladding and viewing the exposed mockup surface, resulted in a minimum of flame zone disturbances. In such small scale measurements, the PT is therefore a very interesting device for future studies.
In the present work, only two tests were reported. Preliminary tests not reported did, however, also support the findings of the present study. For larger test programs it would also be necessary to do several repetitions at similar conditions to evaluate the variability in testing. That was outside the present concept study.
A further improvement of the method would be to place more than one plate thermometer in the flame zone. This could give valuable information about any irregularities in heat flux levels, etc. Shielding the equipment better from draft current could give less variation in plate thermometer readings.
A result from fire testing and time to reach e.g., 400 °C is only one of several parameters in risk evaluations regarding fire safety in process plants. Safety for people is the first priority. Time to collapse of pressurized hydrocarbon containing equipment in fires, and potentially a sudden increase in fire severity, must be evaluated against evacuation times. Operation pressure versus design pressure, PSV set-points, i.e., pressure utilization, as well as blow down capacity, also play roles in the final risk evaluation. The fire frequency in the area of interest may also be considered, as well as the problem related to tall and slender structures that represents a threat to neighboring equipment late in a fire scenario. Active fire protection by water cooling may also be considered before a final decision is taken regarding necessary fire resistance of pressurized equipment.
The small scale testing does, however, indicate a potential to reveal important information that may be a part of the complete picture regarding fire risk when modifying existing equipment. When compliance to modern thermal insulation methods would increase the costs and at the same time introduce hot work in a live plant, the presented test methodology may give valuable information in the refurbishment decision processes.
It is recommended to continue the research regarding small scale fire testing of modern thermal insulation methods for thinner, as well as thicker, steel plates. It may also be worthwhile to try to develop small scale fire tests for piping insulation, etc. The small scale method may also have potential as a preliminary test for product development before eventual full scale certified fire testing is undertaken.
