Article

Assessing Operator Wellbeing through Physiological Measurements in Real-Time—Towards Industrial Application †

Department of Industrial and Materials Science, Chalmers University of Technology, Hörsalsvägen 7A, SE-41296 Gothenburg, Sweden
*
Author to whom correspondence should be addressed.
This paper is an extended version of our paper published in Advances in Neuroergonomics and Cognitive Engineering, Springer, Switzerland , Cham, 2017; pp. 223–232.
Technologies 2017, 5(4), 61; https://doi.org/10.3390/technologies5040061
Submission received: 2 July 2017 / Revised: 13 September 2017 / Accepted: 20 September 2017 / Published: 22 September 2017

Abstract

:
This article focuses on how operator wellbeing can be assessed to ensure social sustainability and operator performance at assembly stations. Rapid technological advances provide possibilities for assessing wellbeing in real-time, and from an assembly system perspective, this could enable the assessment of physiological data in real-time. While technology is available, it has not been implemented or tested in industry. The aim of this paper was to investigate empirically how concurrent physiological measurement technologies can be integrated into an industrial application, in order to increase operator wellbeing and operator performance. A mixed method approach was used, which included a literature study, two laboratory tests, two case studies and a workshop. The results indicated that operator wellbeing could be assessed through electro-dermal activity, but that the data is perceived as difficult to interpret. For an industrial application, operator perception and data presentation are important and risks connected to personal integrity and IT-support need to be addressed. Future work includes testing how a combination of physiological measures and self-assessments can be used to assess operator wellbeing in an industrial context.

1. Introduction

Rapid technological developments, such as Industry 4.0, have enabled smart measurement tools to emerge, and during the last five years, the use of wearables, such as smart-phones, glasses and bracelets, have increased [1,2]. These smart tools can collect data in real-time [3] and be analysed with intelligent software [4]. Examples of such sensors are commercial and semi-commercial health and fitness devices, which have big potential to assess wellbeing in industry, since they are capable and inexpensive [5,6,7]. Wearable healthcare devices are one of the fastest growing markets of this decade and since the technology is fast-growing, efforts are needed to ensure that wearable devices reach their full potential [8].
This article focuses on how wearables can be used to assess operator wellbeing in a manufacturing environment. This is difficult, since wellbeing at work is “a summative concept that characterizes the quality of working lives, including occupational safety and health (OSH) aspects” [9], and a survey of wellbeing at work (performed within the European Union) showed no consensus of what wellbeing at work should include [10]. The most commonly used terms were job satisfaction, good/fair working conditions, quality of work and health at work [10]. A common way to assess psycho-social risks and ill-health is through self-report questionnaires [10,11]. When using self-assessments or self-report questionnaires, it is important to report emotions close in time, and directly connected to, actual experiences—not in terms of a remembered utility (e.g., “how do you feel about what just happened?”) [12]. This is because past experiences are often connected to systematic biases (e.g., connected to a situation or a subjective reconstruction [13,14]). Schwarz et al. saw that when making judgments of how happy and satisfied people were with their lives, they relied on momentary affective states—if they felt positive or negative at that moment [15]. In addition, if they were unhappy, they tried to explain their state more than those who were in pleasant affective states [16]. Capturing real-time data is one way to minimize biases [12,17]. Smart devices, therefore, have the potential to increase job satisfaction, reduce complexity and errors, and influence behaviour by giving visible hints to the operator and matching the job to the person [18]. These smart devices are not only important from a wellbeing perspective; they can also be used to increase operator performance [19]. Psychological wellbeing and psychological health have been seen to correlate with performance at work [20,21]. High performance has been connected to having both a high job satisfaction and a high psychological wellbeing [22]. In addition, correlations between motivation and wellbeing have been seen—such as competence, autonomy and relatedness—which affect intrinsic motivation, self-regulation and wellbeing [23]. When these three are satisfied, they increase self-motivation and mental health, but when not satisfied, they instead diminish both motivation and wellbeing. With an increasingly diversified work force (due to demographic changes), it is important to further investigate how operator wellbeing can be increased from an individual perspective [24,25,26,27]. Since individuals have different knowledge and skills in their work situations, they will therefore often experience work-related stress when the work demand is not matched with their own abilities [26,27]; for instance, negative feelings such as boredom and under-stimulation affect operator performance [28].
Studies are needed to investigate how physiological measurements can be used in a manufacturing context. According to the work environment act, “the work environment must be satisfactory with regard to the nature of work and the social and technological developments in society ... Working conditions must be adapted to people’s differing physical and mental aptitudes” (The Work Environment Act 2:1, 2015). Today, few assembly workstations are however designed with principles that support the operators’ mental capabilities [29,30,31], and self-assessments (NASA-TLX) have been used to assess cognitive load [32,33]. Self-assessments can, however, be connected to biases and take valuable time away from production, and cannot be used to support the operator in real-time. Some examples of physiological measurements have been seen, e.g., the perceived stress of robots in a shared working environment was assessed using Electro Dermal Activity (EDA) [34]. Also, in an attempt to better assess physical load, electromyography (measuring the electric activity of muscles) was used, together with body postures and movements [35]. EDA has also been proven useful for studying user satisfaction, as well as real-time affect assessments of the Human–Automation Interface [36].
This paper aims to investigate empirically how concurrent physiological measurements can be integrated into an industrial application, in order to increase both operator wellbeing and productivity of the operator. A big challenge lies in the industrial application and the visualization of the data; so far only the vision of how that will be performed has been presented [37]. It is therefore important to investigate conditions that are associated with the use of physiological measurements; this is done by studying the following two questions:
(I)
Which physiological measurements can be used to assess operator wellbeing in real-time?
(II)
What risks and possibilities are connected to assessing operator wellbeing in real-time in industry?

2. Materials and Methods

A mixed method research approach was carried out to answer the two questions. This is useful since the questions are complex in nature and because a combination of quantitative and qualitative methods can be used to find deeper understanding of a phenomenon (how to assess operator wellbeing in industry) [38,39]. Since physiological measures in industry are uncommon and new devices are developed continuously, long-term studies are not possible and therefore a more exploratory approach is suitable (such as mixed method). Triangulation is used to increase reliability, validity and interpretation of data, through collecting different types of data (e.g., by combining interview and laboratory results [39,40]). There are four basic types of triangulation that are used in this paper: data triangulation (different types of data, at different times), method triangulation (different methods), theory triangulation (a phenomenon is investigated using different research disciplines that are assumed to have equal value) and investigator triangulation (multiple researchers involved in the investigation) [41]. The mixed method design is presented in Table 1 and is connected to the research questions respectively.
The methods used are described in the following sections. First, the literature study on physiological measures is presented.

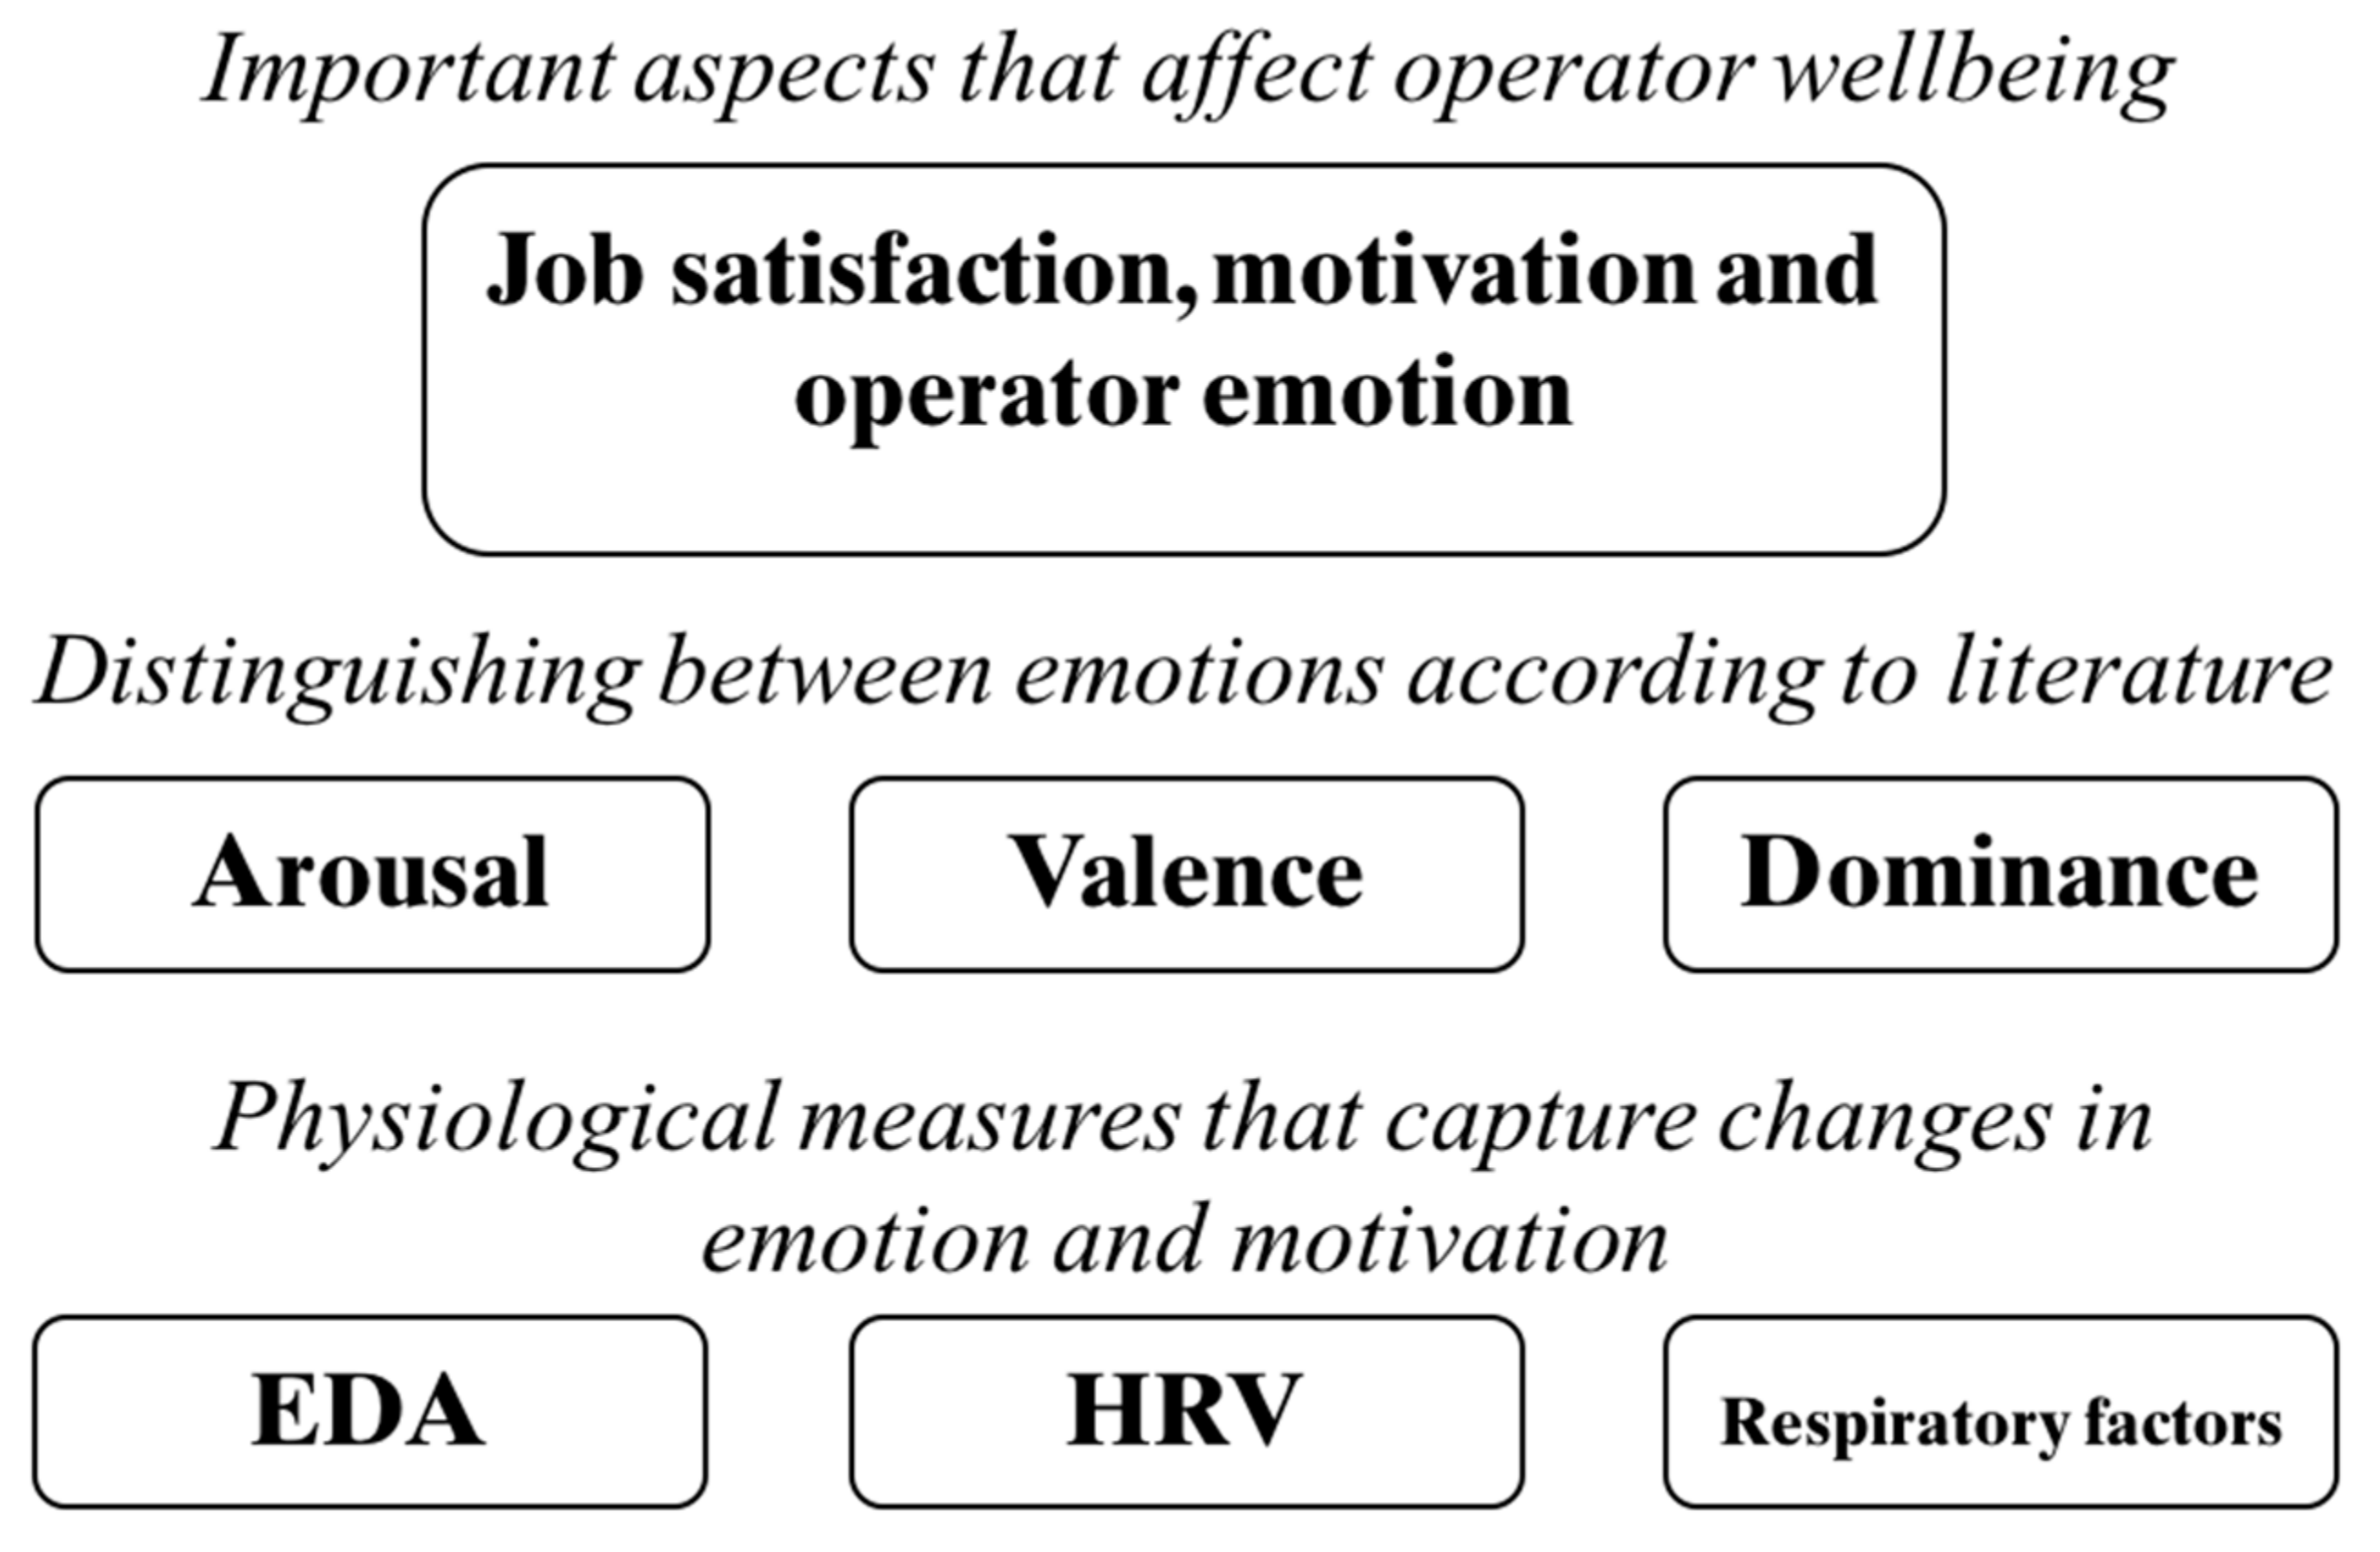
2.1. Literature Study: Identifying Physiological Measures

In the introduction, several aspects were identified as important when assessing operator wellbeing, e.g., job satisfaction, motivation and operator emotion. Operator wellbeing is defined as a state characterised by job satisfaction and changes in motivation and operator emotion. This section describes how changes in operator emotion and motivation have been assessed.
Individual difficulties in assessing and describing one’s own emotions have been noted by many researchers [42]. These difficulties suggest that emotions lack distinctive borders, which makes it hard for individuals to discriminate one emotion from another. However, correlations between different emotions have been found [13] and a model of affect states, which includes two dimensions of emotion—arousal and valence—has been suggested [43]. Here, arousal is connected to how activated you are feeling and valence to whether you perceive the emotion as pleasant or unpleasant (positive or negative). Even though it is hard to distinguish the valence of an emotion, this is often given by the situation or can be included through self-report measures, such as rating scales [11]. Furthermore, some researchers argue that a third dimension, dominance, is needed to describe affect [44,45]. Dominance is defined as the extent to which an individual feels free to act [45]; this can be translated to autonomy in the workplace, which was seen as an important connection to wellbeing and motivation [23].
Changes in emotion, motivation, habits and attitude have been successfully investigated by studying changes in the sympathetic branch of the Autonomic Nervous System (ANS) [11,36]; the sympathetic branch is connected to physical activity or mental work. Since ANS signals could be due to reactions to a situation (noise in the background, people walking by) and not to the task itself, differences in whether participants are passive or active during a measurement have been found [11,36]. If a person is active, like when giving a speech, the ANS results could be connected to the action of giving a speech (e.g., physiological changes while talking, producing a higher voice) and not the physiological response to the situation [11].
ANS have been assessed by measuring EDA, Heart Rate Variability (HRV) and respiratory activities [46,47,48,49]. EDA is useful for assessing changes connected to emotional and cognitive states, since it is not affected by parasympathetic activity (e.g., the body’s unconscious actions such as digestion and salivation [50]) and is measured through current in the skin (which increases when an operator is producing sweat) [36,46]. As the sensors are both cheap and can be measured reliably [11], EDA measures can also easily be conducted. HRV measures the time between heartbeats and is useful since when a person is exposed to stress, the autoimmune nervous system triggers stress hormones that change both the heart rate and HRV [51]. Studies show that HRV levels are high when a person does not feel stressed, while low HRV levels are an indicator of a higher perceived stress level [52]. Respiratory factors are interesting since breathing has been connected to emotions—negative emotions, such as anger, anxiety, disgust and surprise, as well as some positive emotions, such as contentment, happiness and joy [49].
EDA, HRV and respiratory factors have been identified as physiological measures that can be used to assess changes in operator emotion and motivation, Figure 1.

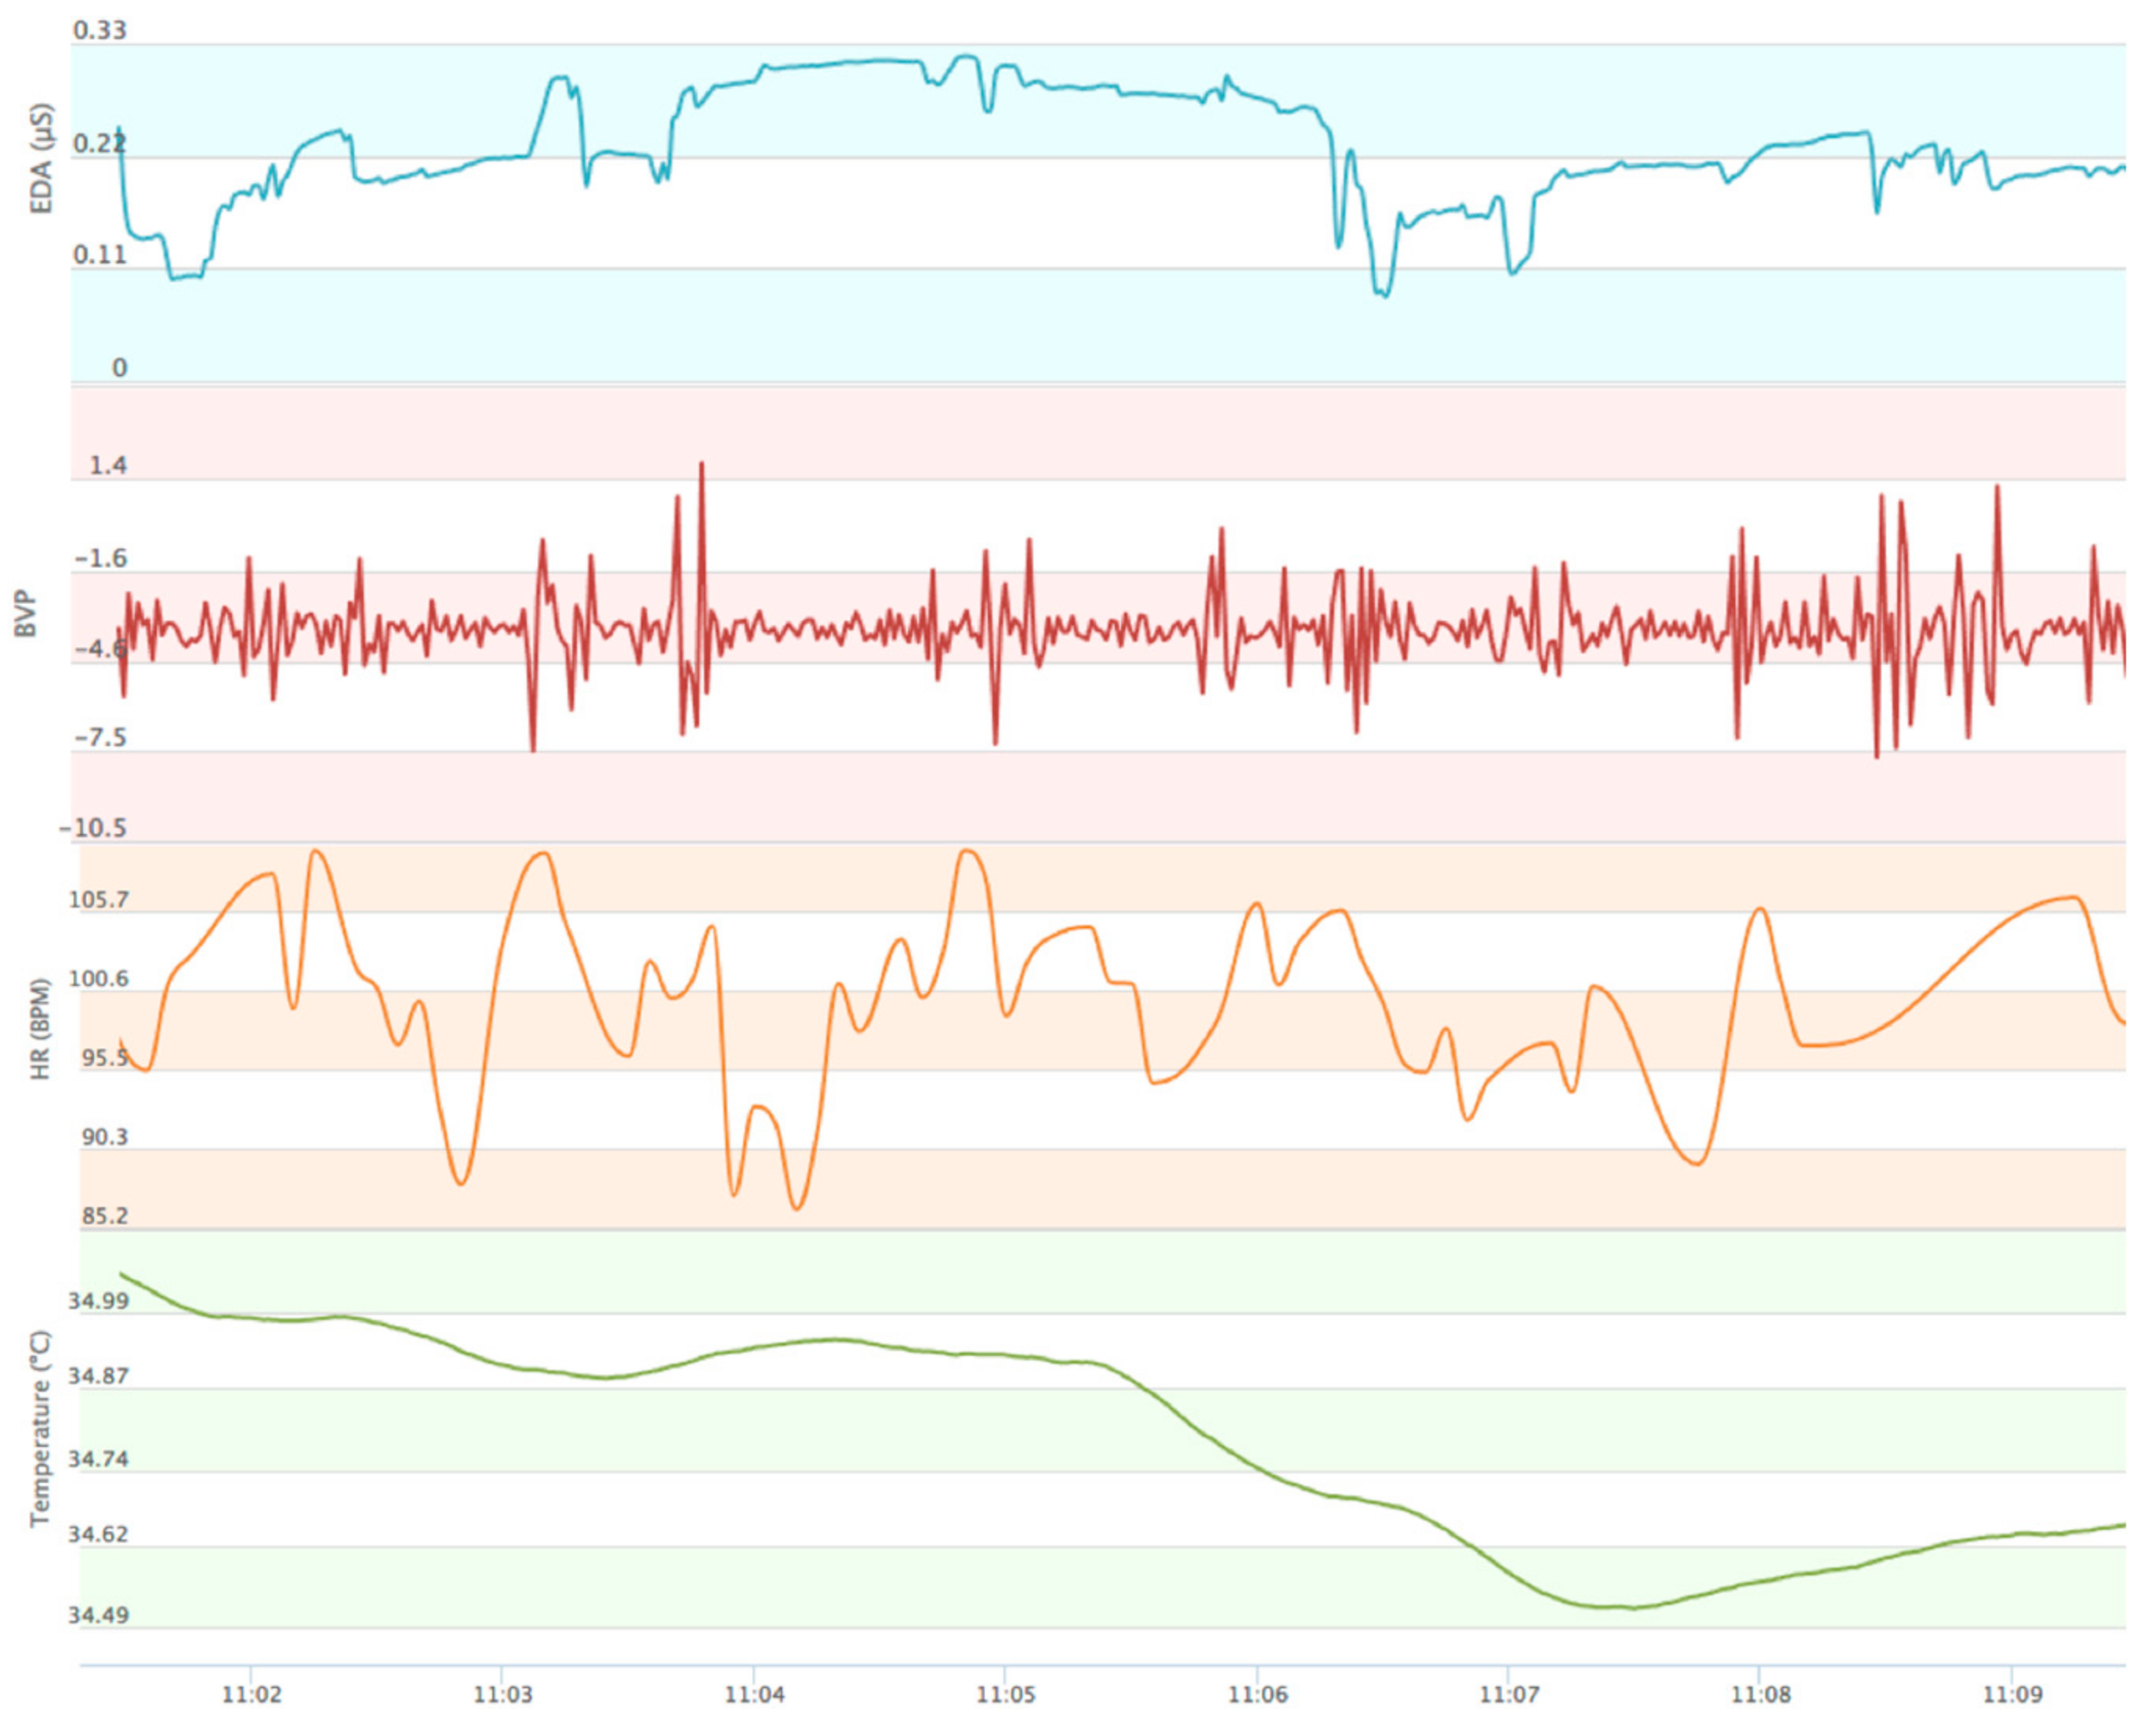
2.2. Devices Used to Assess Physiological Data

Devices that were used in the laboratory tests, case studies and the workshop are presented in Table 2. These devices were chosen since they were easy to use and had software that could be connected to either a mobile device or a computer that could show physiological data in real-time.

2.3. Laboratory Test Designs

Two laboratory tests were carried out to test how physiological measures found in the literature study can be used to assess operator wellbeing. Details of the tests can be found in previous published articles, e.g., in Li et al. [27], Söderberg et al. [53], Mattsson et al. [19] and Mattsson et al. [5]. At the beginning of each test session, the participants were given a verbal description of the experimental proceedings and were asked for oral consent to participate. To set a baseline for the arousal assessment, participants were asked to walk up and down a stair five times (as suggested in [11]).
Laboratory Test A was carried out in 2014 to investigate which physiological measurements correlate with operator performance. Sixty participants were recruited primarily via campus message boards at Chalmers University of Technology. Participation was voluntary and each participant was studied separately (not studied in a group). Repeated experiments were performed, where participants assembled five + five Lego gearboxes (named 1st and 2nd assembly) during two different assembly times (A and B); A was 70 s long and B was 50 s long. To avoid experimental bias, they were divided into two randomized groups: Group AB and Group BA. To avoid plausible alternative causes, all other conditions were held constant. The assembly instructions were placed on a screen to the left, and the time was on the right. The component shelf was optimized for picking order. Operator emotion was assessed through EDA and subjectively-rated arousal, valence and dominance, using the Self-Assessment Manikin (SAM) [54] with Likert scales ranging from 1 to 5. Relationships between EDA, SAM and operator performance were assessed statistically with two-tailed Pearson’s tests, and EDA was measured using the Qsensor (Table 1) and analysed by comparing the number of Non-Specific Skin Conductance Responses (NSCR) per minute to operator performance [36]. Three types of NSCR peaks were calculated: down peaks, flat peaks and up peaks (see Figure 2). In a pre-test, flat peaks were seen when participants focused on their work, e.g., before assembling a new component or before filling out a survey. Therefore, flat peaks were defined and introduced as part of the experiment’s data collection. Flat peaks were defined as down peaks that were longer than 2 s. Operator performance was assessed as the number of parts assembled correctly (the gear box had 12 parts). All calculations involved multiple researchers to increase data reliability. After the assembly, an interview was carried out to validate findings. Between the first and second assemblies, an interviewer asked the participants how they perceived the assembly; this was also done after the second assembly (followed by other questions regarding their performance). Participants were then shown their EDA graph, but their view of the data was not captured. Therefore, a follow up test—Laboratory Test B—was designed.
In Laboratory Test B, participants assembled eight Lego gearboxes (the same gearbox as in A). The test was carried out at Chalmers Smart Industry lab in 2016. The aim was to test which was the most and the least preferred device and why, to allow further investigation about the use of EDA as a reliable measurement. Thirteen participants were recruited through email and wore three devices during the assembly: the Qsensor, Breathing Activity Device and SmartBand 2 (presented in Table 1). In the experiment, covariation between operator emotion and performance was investigated and the number of flat peaks was also calculated; however, operators were not given a cycle time (half were told to assemble with as high quality as possible and half were told to assemble as fast as possible). The environment was also manipulated (randomized and structured) during the experiment, but no correlations between manipulation and choice of device were seen. Presentation of the device data differed for the three devices; the presentation of the Qsensor was a graph, the Breathing Activity Device had a label and a minute stamp and the SmartBand 2 was displayed as a graph connected to a bar chart with three pre-defined bars (the pre-defined bars were low stress, average stress and high stress levels). In addition, participants were asked how the assembly felt (after the assembly).
Participant data for the two designs are presented in Table 3.

2.4. Case Study Designs

Two case studies were carried out at two different industrial environments (two companies) with five different operators. The aim was to assess how operators and company representatives perceived the output data and to investigate how physiological data could be presented. Two data types, EDA and Blood Volume Pulse (BVP), were analysed by studying the output graphs with the participants; Figure 3 depicts an example graph.
The assembly tasks were simple, with few components to assemble. In Case Study A, the activity bracelet usefulness was tested in a manual assembly cell with five stations (which included small set-ups of machines, details in Korneliusson et al. [55]). Two participants with different experience levels—an experienced operator, but novice with the specific product and an operator with great experience with the product and assembly—participated in the study. In Case Study B, the physiological aspects of a collaborative working environment between a human and a cobot (co-existing robot) were studied (details in Jacobsson and Nilsson [56]). In the study, the cobot and a human shared the station but did not assemble at the same time. The station contained ten tasks, of which the robot performed four tasks and the human six. Three operators were studied with varied levels of experience.

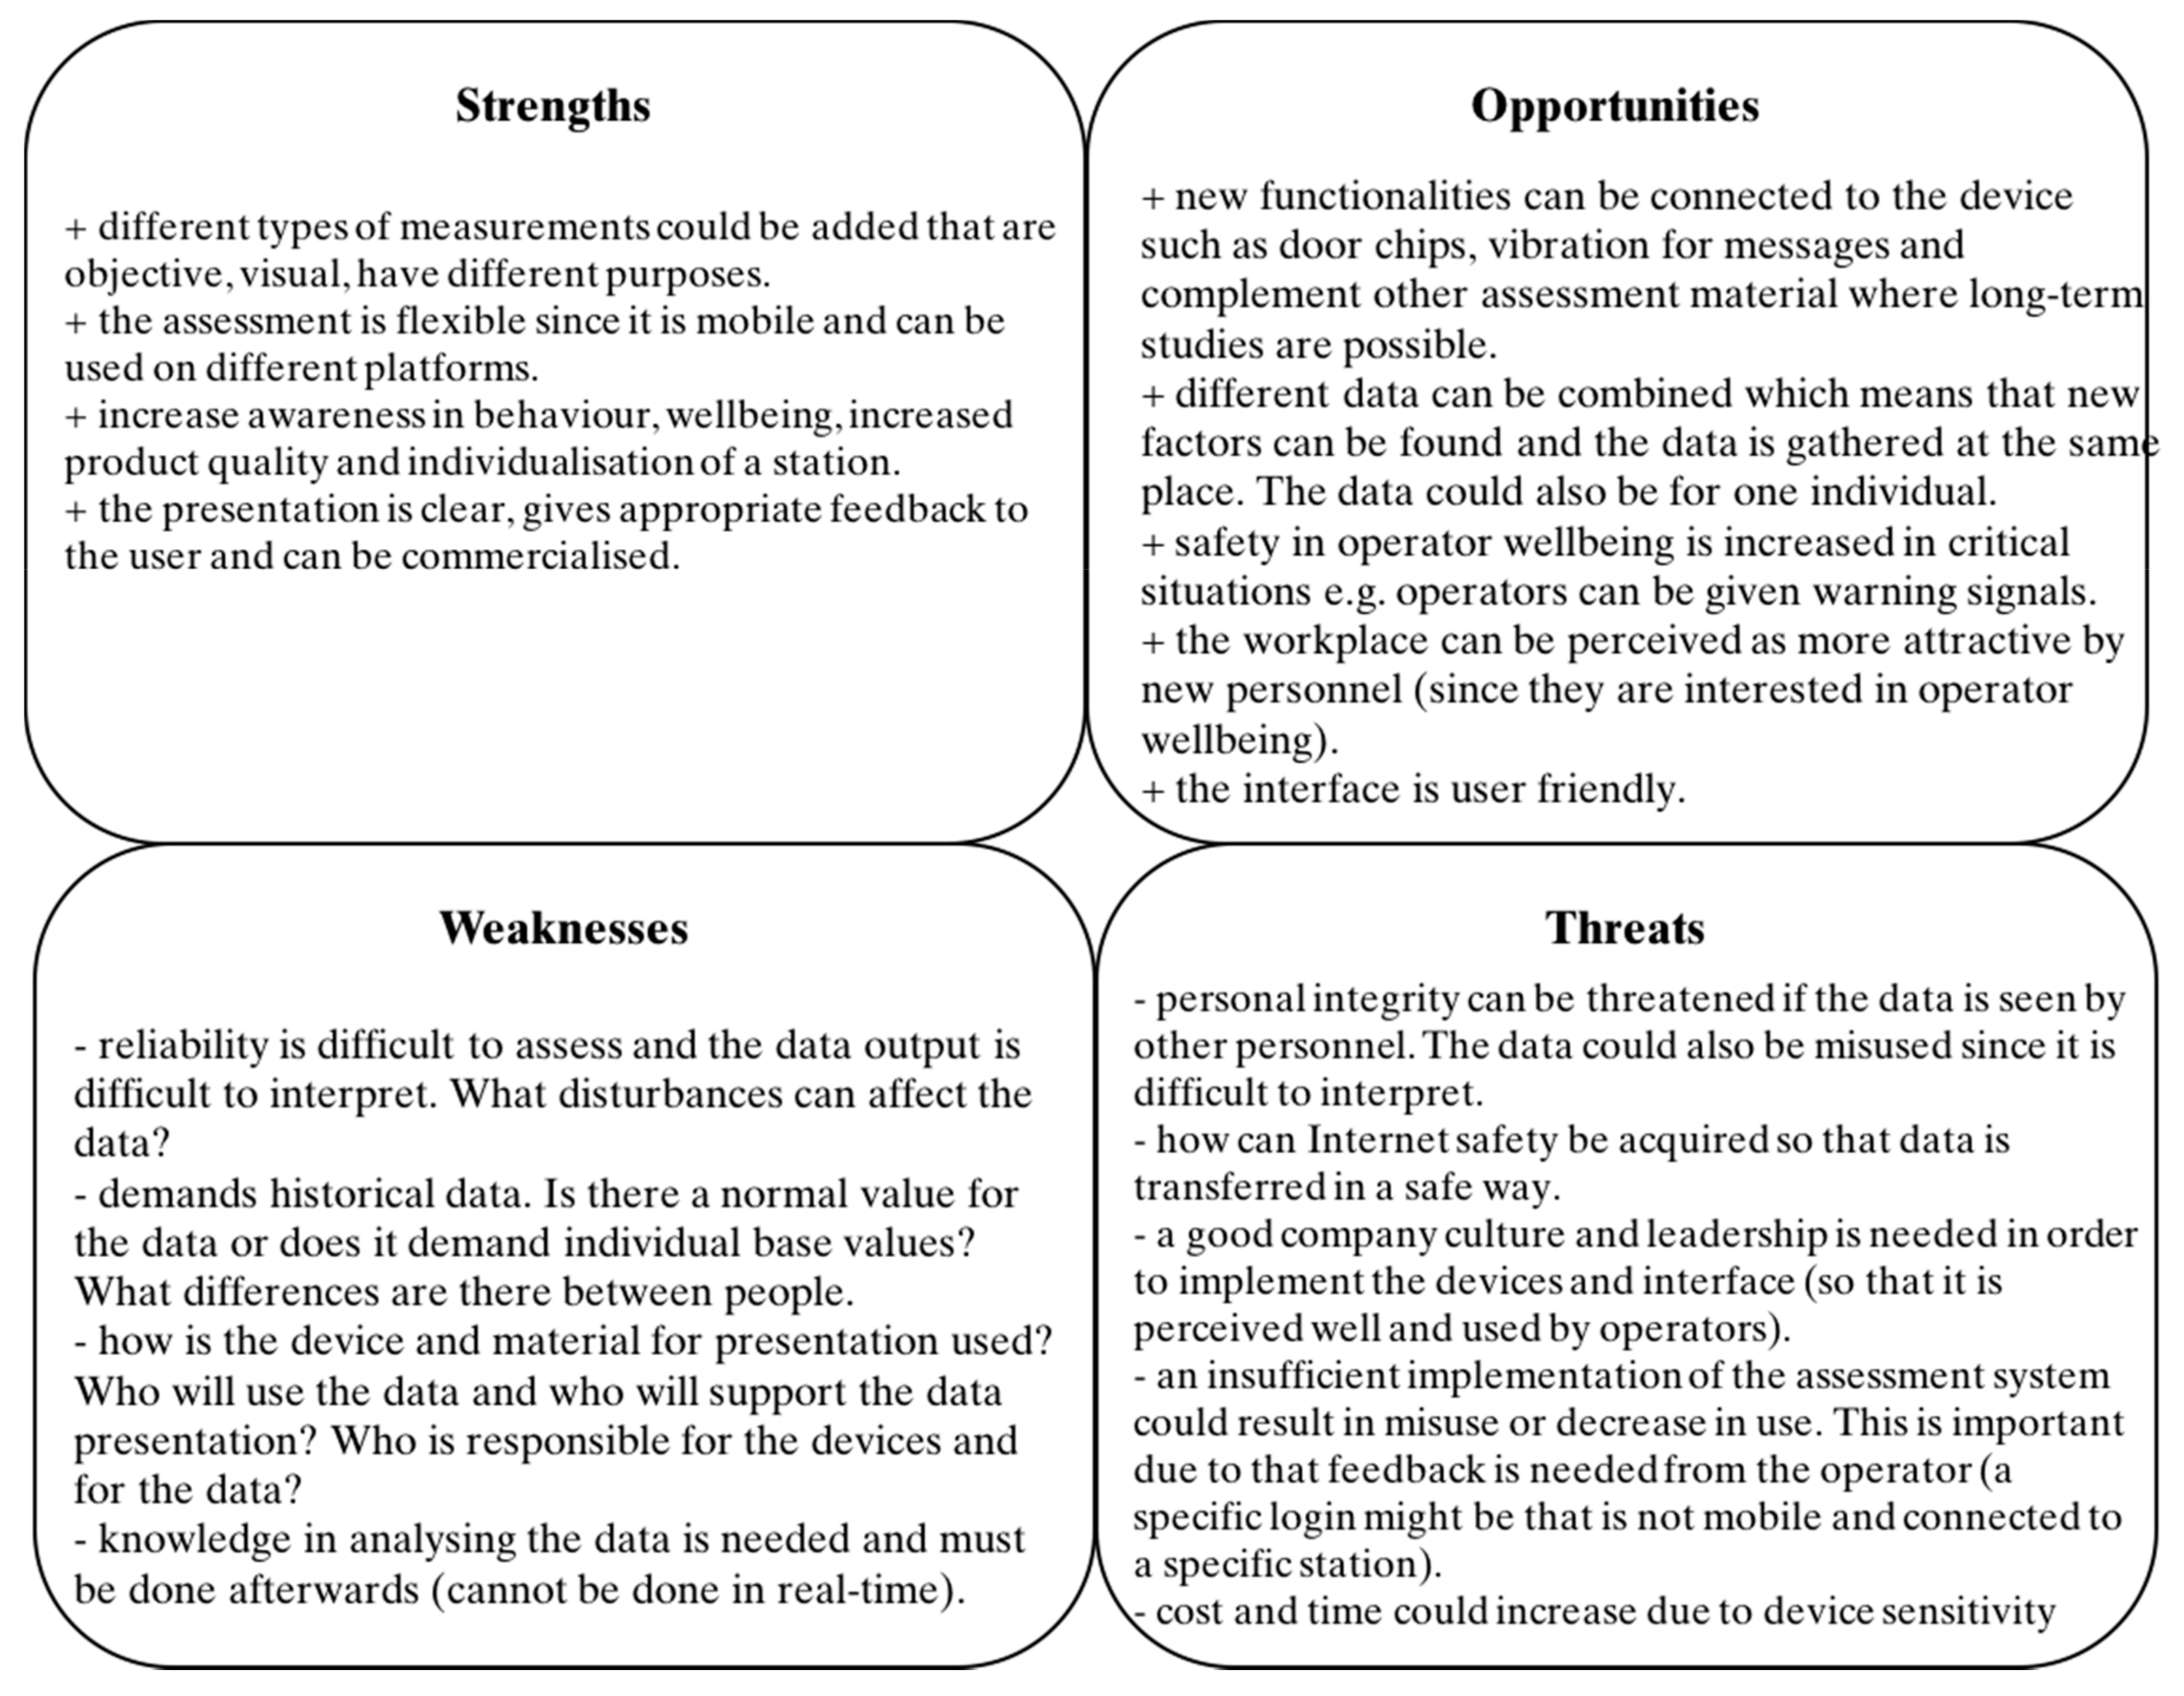
2.5. Workshop on Risks and Possibilities with a Prototype Assessing Operator Wellbeing in Real-Time

In order to understand how the device could be used in industry, a workshop was conducted with participants from industry and academy. The activity bracelet (measuring HRV, EDA, BVP and temperature, example in Figure 3) was built into a prototype and experts within the “People in Production Systems” from the Swedish strategic innovation programme, Produktion2030 (Production2030 is a strategic innovation programme supported by VINNOVA, Swedish Energy Agency and Formas), were invited to participate in a workshop to evaluate the prototype. The workshop was held in 2016 with 15 participants (eight researchers, three company representatives and four project participants). Workshop participants were divided into three groups to perform a Strengths, Weaknesses, Opportunities and Threats (SWOT) analysis, based on Kotler [57] and Osita et al. [58]. The prototype was an interface in which physiological data and four work environmental measurements (temperature, carbon dioxide level, light and sound levels) were presented in real-time (see Figure 4). The field below the work environment indicators was a comment field, where suggestions were given to the operator if threshold limits had been exceeded, e.g., if the temperature was above 23 degrees, a message was given together with a suggestion of what to change.

3. Results

First, findings regarding the physiological measurements that can be used to assess operator wellbeing are presented; then risks and possibilities connected with a real-time assessment in industry are given.
• Assessing operator wellbeing through physiological measurements
EDA, HRV, BVP and respiratory factors were identified as potential physiological measurements that can be used to assess operator wellbeing. They were tested empirically in laboratory and case studies. The usefulness of EDA, HRV and BVP were supported; findings are summarized in Table 4.
In Laboratory Test A, a weak–moderate positive relationship was seen between operator performance and the EDA flat peaks (r(45) = 0.43 (p < 0.01)) in the first assembly. Overall, it was seen that the six top-performing participants had average of 688 flat peaks per minute while the six bottom-performing participants had an average of 243 flat peaks per minute. This means that operators who assembled with a high performance also had a higher number of flat peaks, and that operators with lower performance rates, in general, had a lower number of flat peaks. No other significant correlations were found (including interaction effects), i.e., the flat peaks were not dependent on the cycle time (time A or B). The covariance results could be due to reactivation—the participants in the first assembly had to concentrate, to be able to learn, and to handle the stressful situation (thereby producing flat-peaks before reactivation). Because the reactivation of skin conductance has been connected to increased stress [59,60], some support for this was seen in the interviews, where, in general, the first assembly was perceived as stressful (40%) and difficult (28%) while the second was seen as better (35%) and less stressful (22%). The cause of the relationship, however, could not be seen in the experiment (e.g., the cause could be due to cognitive or physical reactivation). Because a relationship between operator performance and flat peaks was found, EDA was identified as a promising parameter that can be used in conjunction with other measurements to assess operators; this was investigated further in Laboratory Test B.
In Laboratory Test B, 50% of the participants thought that EDA was the most reliable physiological measurement and that HRV data was the least reliable. The other 50% thought that HRV data was the most reliable and that the Breathing Activity Device and the EDA data were the least reliable. Participants said that they preferred one device over the other based on their personal experiences, e.g., participants who did not sweat or who were very aware of their pulse thought that HRV was more reliable, and participants who had a low pulse thought that EDA was more reliable. The participants stated that the EDA data was reliable since it was detailed; however, they did not understand exactly what it measured. One reason that the Breathing Activity Device was not perceived as reliable was that its sample rate was too low (it did not show differences fast enough and could be more suitable for long-term assessments). These results indicate that both EDA and HRV are needed to assess operator wellbeing. In Laboratory Test B, no relationship between operator emotion and performance was found (including a relationship between flat peaks and operator performance) which could be because participants did not perceive the assembly as stressful or difficult. Fifty-four percent said that the second assembly was better and 31% said that the first assembly was good. Twenty-three percent said that it was stressful (in Laboratory Test A, 40% stated that it was stressful).
In the case studies, several physiological measurements were assessed (through the Empatica device). In Case Study A, operators perceived the logging of the physiological data positively and in Case Study B, the data was perceived as useful for the company, since it showed how the interaction affected the operators. This type of assessment had not been possible before, and therefore the physiological data could generate new insights (according to the project leader). The combined data (EDA and HRV, EDA and BVP) was used to discuss differences between the operators’ experience levels. The Case Study B results were used to start a new project that will assess operator emotion in human–cobot collaboration.
In conclusion, the results indicated that EDA could be used in combination with HRV or BVP to assess operator wellbeing.
• Risks and possibilities with assessing operator wellbeing in real-time in industry
Workshop participants identified risks and possibilities with the prototype, using a SWOT analysis (assessing EDA, BVP, HRV, temperature and four environmental data). The main identified risks were that the data was difficult to interpret and that there could be issues regarding personal integrity that need to be considered, e.g., who should have access to the data and who should interpret it. For instance, the assessments could be given to the company doctor (or similar) and not directly to the team leader. The possibilities were that the prototype was flexible, mobile-based and could be connected to many data types. It was considered to be the first step towards an increased awareness in operator wellbeing at the workplace. The results are presented in Figure 5.
Further, risks connected to data presentation were seen in the case studies. One of the operators thought that it would be inconvenient to see the data in real-time and that he would rather see the data after the order was completed, or in his free time. If physiological measurements were used at the station, operators thought that it should be voluntary to use them. Also, operators thought that if they were aware of their own stress levels, this would contribute to additional stress. In addition, they wanted notifications through either symbols or pre-selected text. Although the sample sizes of the case studies were small, the feedback from the operators are important. To design a system according to what the operators think can improve interaction and operator performance [61,62] and usability [63,64,65,66,67,68]. A number of questions were raised during the workshop, such as, who will support the device interface and whether data from devices were enough to assess operator wellbeing.

4. Discussion

The aim of this article was to investigate empirically how concurrent physiological measurements can be integrated in an industrial application, in order to increase both operator wellbeing and the productivity of the operator. The following research question was first investigated—which physiological measurements can be used to assess operator wellbeing in real-time? EDA was considered reliable and useful for assessing operators’ wellbeing at work; this was seen both in the experiments and the case studies. Although participants considered EDA to be reliable and useful, interpretation of the data was perceived as difficult (by participants in Laboratory Test B and the workshop). The EDA data is difficult to interpret since the physiological measures are connected to several activities (both cognitive and physical) [11,36]. EDA does not measure one exact emotion, but instead serves as a general indicator for arousal, attention, habituation, preferences and cognitive effort [11,36]. However, although EDA is perceived as difficult to understand by participants, the measurement is relevant because it can show otherwise hidden processes—such as how people make decisions [11]—and provide information about an emotion before it is conscious to the participant (thereby preceding a reaction) [69,70]. We suggest that EDA should be combined with other physiological measurements, such as those exemplified in the case studies (BVP or HRV), and that further studies are needed to identify the relationships between EDA, BVP, HRV and operator performance. The advantages of combining different types of data have been seen in several studies (e.g., EDA, HRV, self-ratings, behaviour and personality traits can be used to detect anomalies [71,72,73]). Apart from the already suggested measurements (i.e., EDA, HRV, respiratory factors and BVP), physiological measurements, such as eye-monitoring and/or pupil dilation could be further investigated. To capture operator wellbeing assessments, real-time assessments should also be combined with assessments of job satisfaction and motivation.
The second research question—What risks and possibilities are connected to assessing operator wellbeing in real-time in industry—was investigated with a workshop and case studies. The main risks were connected to data interpretation and personal integrity, which was identified in a similar SWOT analysis, e.g., the use of smart wearables was connected to personal integrity and support of the devices [8]. Regarding personal integrity, a technological solution, for an industrial application would also need to be integrated with current systems, which need interoperability with industry standards [74]. An Internet-centric solution, described by Li et al. [75], would be ideal for this type of measurement. The next generation of cellular networks, 5G, promises several advantages and should help solve many issues regarding mobility and security. The results showed that there are many possibilities connected to physiological measurements in real-time (e.g., wearables could increase health and safety as well as the attractiveness of the company (workshop results) [76]), which were also supported by the case study findings. In comparison with the SWOT analysis of wearables, similar findings in terms of opportunities were seen, (e.g., improved health and increased awareness [8]).
Although this research is exploratory, the findings are both relevant and useful for testing and designing future industrial applications. The empirical tests of physiological data are relevant results in themselves since today, operator wellbeing is often assessed through self-assessments (which takes time and is connected with bias). The results presented are seen as a first step in finding a suitable way to assess operator wellbeing in manufacturing. The data collection was carried out in a structured way (i.e., it can be repeated) which increases the reliability of the findings [77,78]. Since triangulation was used, the validity of the findings is increased [40,41,77].
The interpretation and combination of physiological data is an important topic for future research. More studies are needed to investigate how real-time assessments should be designed and how physiological data could be used in industry. Specifically, a social sustainability perspective that supports demography changes is needed, so that the developed smart technologies become efficient and support the operators’ physical and cognitive abilities [79,80,81]. Also, to ensure that wearable devices are implemented in a successful way, health regulations and standards are needed [8]. Future work includes further testing on how the activity bracelet can be combined with self-assessments to assess operator emotions in industry.

5. Conclusions

This study shows that reliable data can be collected, and several data types can be combined, to assess operator wellbeing in real-time. In this paper, EDA, BVP and HRV were identified as promising physiological measurements for assessing operator wellbeing in an industrial context. When implementing physiological measurements in industry, there are still many obstacles, e.g., standards and regulations are needed to ensure an efficient and secure implementation. Doing so will enable more informed, aware and safe operators, e.g., in terms of improved wellbeing at work, decreased cognitive load, increased social sustainability and increased operator performance.

Acknowledgments

The authors would like to thank VINNOVA and Production 2030 for financial support of the DIGitalized wellbeINg (DIG IN) project. This research has been carried out within the framework of the Sustainable Production Initiative, and the Production Area of Advance at Chalmers University of Technology. This support is gratefully acknowledged. In addition, the authors thank the companies were the studies were performed and the students who was involved in the empirical studies.

Author Contributions

Sandra Mattsson and Åsa Fast-Berglund conceived and designed the laboratory tests and the first industrial test. Åsa Fast-Berglund conceived and designed the second industrial tests. Laboratory tests and industrial tests were carried out in corporation with bachelor and master students. Magnus Åkerman contributed to the discussion and structure of the paper. Sandra Mattsson and Åsa Fast-Berglund wrote the paper. All authors have read and approved the final manuscript.

Conflicts of Interest

The authors declare no conflict of interest.

References

  1. Whitmore, A.; Agarwal, A.; Li, D.X. The Internet of Things—A survey of topics and trends. Inf. Syst. Front. 2015, 17, 261–274. [Google Scholar] [CrossRef]
  2. Guler, S.D.; Gannon, M.; Sicchio, K. A Brief History of Wearables. In Crafting Wearables: Blending Technology with Fashion; Apress: Berkeley, CA, USA, 2016; pp. 3–10. [Google Scholar]
  3. Carpanzano, E.; Jovane, F. Advanced automation solutions for future adaptive factories. CIRP Ann. Manuf. Technol. 2007, 56, 435–438. [Google Scholar] [CrossRef]
  4. Vogel-Heuser, B.; Legat, C.; Folmer, J.; Schütz, D. An Assessment of the Potentials and Challenges in Future Approaches for Automation Software. In Industrial Agents, Emerging Applications of Software Agents in Industry; Elsevier: Amsterdam, The Netherlands, 2015; pp. 137–152. [Google Scholar]
  5. Mattsson, S.; Partini, J.; Fast-Berglund, Å. Evaluating Four Devices that Present Operator Emotions in Real-Time. In Proceedings of the 26th CIRP Design Conference, Stockholm, Sweden, 15–17 June 2016. [Google Scholar]
  6. Mattsson, S.; Li, D.; Fast-Berglund, Å.; Gong, L. Measuring Operator Emotion Objectively at a Complex Final Assembly Station. In Advances in Neuroergonomics and Cognitive Engineering; Springer: Berlin, Germany, 2017; pp. 223–232. [Google Scholar]
  7. Kolbeinsson, A.; Lindblom, J.; Thorvald, P. Missing mediated interruptions in manual assembly: Critical aspects of breakpoint selection. Appl. Ergon. 2017, 61, 90–101. [Google Scholar] [CrossRef] [PubMed]
  8. Casselman, J.; Onopa, N.; Khansa, L. Wearable healthcare: Lessons from the past and a peek into the future. Telemat. Inf. 2017. [Google Scholar] [CrossRef]
  9. Schulte, P.; Vainio, H. Well-being at work: Overview and perspective. Scand. J. Work Environ. Health 2010, 36, 422–429. [Google Scholar] [CrossRef] [PubMed]
  10. European Agency for Safety and Health at Work. Well-Being at Work: Creating a Positive Work Environment; European Agency for Safety and Health at Work: Bilbao, Spain, 2013. [Google Scholar]
  11. Figner, B.; Murphy, R.O. Using Skin Conductance in Judgement and Decision Making Research. In A Handbook of Process and Tracing Methods for Decision Research; Psychology Press: New York, NY, USA, 2011; pp. 163–184. [Google Scholar]
  12. Kahneman, D.; Krueger, A.B. Developments in the Measurement of Subjective Well-Being. J. Econ. Perspect. 2006, 20, 3–24. [Google Scholar] [CrossRef]
  13. Posner, J.; Russell, J.A.; Peterson, B.S. The circumplex model of affect: An integrative approach to affective neuroscience, cognitive development, and psychopathology. Dev. Psychopathol. 2005, 17, 715–734. [Google Scholar] [CrossRef] [PubMed]
  14. Kallus, K.W.; Barbarino, M.; Van Damme, D. Integrated Task and Job Analysis of Air Traffic Controllers. Available online: https://www.eurocontrol.int/sites/default/files/content/documents/nm/safety/integrated-task-and-job-analysis-of-air-traffic-controllers-phase-1-development-of-methods.pdf (accessed on 21 September 2017).
  15. Diener, E.; Seligman, M.E.P. Beyond Money. Toward an Economy of Well-Being. Psychol. Sci. Public Interest 2004, 5, 1–31. [Google Scholar] [CrossRef] [PubMed]
  16. Schwarz, N.; Clore, G.L. Mood, misattribution, and judgments of well-being: Informative and directive functions of affective states. J. Personal. Soc. Psychol. 1983, 45, 513–523. [Google Scholar] [CrossRef]
  17. Frey, B.S.; Stutzer, A. Happiness and Economics: How the Economy and Institutions Affect Human Well; Princeton University Press: Princeton, NJ, USA; Oxford, UK, 2002. [Google Scholar]
  18. Health and Safety Executive. Reducing Error and Influencing Behaviour. Available online: http://www.hse.gov.uk/pubns/books/hsg48.htm (accessed on 21 September 2017).
  19. Mattsson, S.; Fast-Berglund, Å.; Thorvald, P. A Relationship between Operator Performance and Arousal in Assembly. Procedia CIRP 2016, 44, 32–37. [Google Scholar] [CrossRef]
  20. Wright, T.A.; Cropanzano, R. The Role of Psychological Well-Being in Job Performance: A Fresh Look at an Age-Old Quest. Org. Dyn. 2004, 33, 338–351. [Google Scholar] [CrossRef]
  21. Ford, M.T.; Cerasoli, C.P.; Higgins, J.A.; Decesare, A.L. Relationships between psychological, physical, and behavioural health and work performance: A review and meta-analysis. Work Stress 2011, 25, 185–204. [Google Scholar] [CrossRef]
  22. Wright, T.A.; Cropanzano, R.; Bonett, D.G. The moderating role of employee positive well being on the relation between job satisfaction and job performance. J. Occup. Health Psychol. 2007, 12, 93–104. [Google Scholar] [CrossRef] [PubMed]
  23. Ryan, R.M.; Deci, E.L. Self-determination theory and the facilitation of intrinsic motivation, social development, and well-being. Am. Psychol. 2000, 55, 68–78. [Google Scholar] [CrossRef] [PubMed]
  24. Grote, G. Uncertainty management at the core of system design. Ann. Rev. Control 2004, 28, 267–274. [Google Scholar] [CrossRef]
  25. Mavrikios, D.; Karabatsou, V.; Pappas, M.; Chryssolouris, G. An efficient approach to human motion modeling for the verification of human-centric product design and manufacturing in virtual environments. Robot. Comput. Integr. Manuf. 2007, 23, 533–543. [Google Scholar] [CrossRef]
  26. Muaremi, A.; Arnich, B.; Tröster, G. Towards Measuring Stress with Smartphones and Wearable Devices During Workday and Sleep. Bionanoscience 2013, 3, 172–183. [Google Scholar] [CrossRef] [PubMed]
  27. Li, D.; Landström, A.; Mattsson, S.; Karlsson, M. How changes in cognitive automation can affect operator performance and productivity. In Proceedings of the Sixth Swedish Production Symposium, Gothenburg, Sweden, 16–18 September 2014. [Google Scholar]
  28. Bohgard, M. Work and Technology on Human Terms; Prevent: Solna, Sweden, 2009; p. 726. [Google Scholar]
  29. Thorvald, P.; Brolin, A.; Högberg, D.; K. Case, U. Using Mobile Information Sources to Increase Productivity and Quality. In Proceedings of the 3rd International Conference on Applied Human Factors and Ergonomics, Miami, FL, USA, 17–20 July 2010. [Google Scholar]
  30. Bäckstrand, G.; Brolin, A.; Högberg, D.; Case, K. Supporting Attention in Manual Assembly and Its Influence on Quality. In Proceedings of the 3rd Applied Human Factors and Ergonomics (AHFE) International Conference, Miami, FL, USA, 17–20 July 2010. [Google Scholar]
  31. Mattsson, S.; Fast-Berglund, Å. How to Support Intuition in Complex Assembly? In Proceedings of the 26th CIRP Conference, Stockholm, Sweden, 15–17 June 2016. [Google Scholar]
  32. Tang, A.; Owen, C.; Biocca, F.; Mou, W. Comparative Effectiveness of Augmented Reality in Object Assembly. In Proceedings of the SIGCHI Conference on Human Factors in Computing Systems, Ft. Lauderdale, FL, USA, 5–10 April 2003; pp. 73–80. [Google Scholar]
  33. Thorvald, P.; Lindblom, J. Inital Development of a Cognitive Load Assessment Tool. In Proceedings of the International Conference on Applied Human Factors and Ergonomics, Krakow, Poland, 19–23 July 2014. [Google Scholar]
  34. Zanchettin, A.M.; Bascetta, L.; Rocco, P. Acceptability of robotic manipulators in shared working environments through human-like redundancy resolution. Appl. Ergon. 2013, 44, 982–989. [Google Scholar] [CrossRef] [PubMed]
  35. Forsman, M.; Hansson, G.-Å.; Medbo, L.; Asterland, P.; Engström, T. A method for evaluation of manual work using synchronised video recordings and physiological measurements. Appl. Ergon. 2002, 33, 533–540. [Google Scholar] [CrossRef]
  36. Mendes, W.B. Assessing Autonomic Nervous System Activity. In Methods in Social Neuroscience; Guilford Press: New York, NY, USA, 2009; pp. 118–147. [Google Scholar]
  37. Hermann, M.; Pentek, T.; Otto, B. Design Principles for Industrie 4.0 Scenarios: A Literature Review, Technische Universität Dortmund, Fakultät Maschinenbau; Audi Stiftungslehrstuhl Supply Net Order Management. Available online: http://www.snom.mb.tu-dortmund.de (accessed on 21 September 2017).
  38. Östlund, U.; Kidd, L.; Wengström, Y.; Rowa-Dewar, N. Combining qualitative and quantitative research within mixed method research designs: A methodological review. Int. J. Nurs. Stud. 2011, 48, 369–383. [Google Scholar] [CrossRef] [PubMed] [Green Version]
  39. Zohrabi, M. Mixed Method Research: Instruments, Validity, Reliability and Reporting Findings. Theory Pract. Lang. Stud. 2013, 3, 254–262. [Google Scholar] [CrossRef]
  40. Olsen, W. Triangulation in Social Research: Qualitative and Quantitative Methods Can Really Be Mixed. In Forthcoming as a Chapter in Developments in Sociology; Causeway Press: Ormskirk, UK, 2004. [Google Scholar]
  41. Denzin, N.K. The Research Act: A Theoretical Introduction to Sociological Methods; Aldine: Chicago, IL, USA, 1970. [Google Scholar]
  42. Saarni, C. Development of Emotional Competence; Guilford Press: New York, NY, USA, 1999. [Google Scholar]
  43. Russell, J.A. A Circumplex Model of Affect. J. Personal. Soc. Psychol. 1980, 39, 1161–1178. [Google Scholar] [CrossRef]
  44. Stamps, A.E. In search of dominance: The case of the missing dimension. Percept. Motor Skills 2005, 100, 559–566. [Google Scholar] [CrossRef] [PubMed]
  45. Mehrabian, A.; Russel, J. An Approach to Environmental Psychology; MIT Press: Cambridge, MA, USA, 1974. [Google Scholar]
  46. Boucsein, W. Electrodermal Activity, 2nd ed.; Springer: New York, NY, USA, 2012. [Google Scholar]
  47. Malik, M. Heart Rate Variability: Standards of Measurement, Physiological Interpretation, and Clinical Use: Task Force of the European Society of Cardiology and the North American Society for Pacing and Electrophysiology. Ann. Noninvasive Electrocardiol. 1996, 1, 151–181. [Google Scholar] [CrossRef]
  48. Stauss, H.M. Heart rate variability. Am. J. Phys. 2003, 285. [Google Scholar] [CrossRef] [PubMed]
  49. Kreibig, S.D. Autonomic nervous system activity in emotion: A review. Biol. Psychol. 2010, 84, 394–421. [Google Scholar] [CrossRef] [PubMed]
  50. Braithwaite, J.J.; Watson, D.G.; Jones, R.; Rowe, M. A Guide for Analysing Electrodermal Activity (EDA) & Skin Conductance Responses (SCRs) for Psychological Experiments; Selective Attention & Awareness Laboratory (SAAL), Behavioural Brain Sciences Centre, University of Birmingham: Birmingham, UK, 2013. [Google Scholar]
  51. Taelman, J.; Vandeput, S.; Spaepen, A.; Huffel, S. Influence of Mental Stress on Heart Rate and Heart Rate Variability. In Proceedings of the 4th European Conference of the International Federation for Medical and Biological Engineering, Antwerp, Belgium, 23–27 November 2008; pp. 1366–1369. [Google Scholar]
  52. Peper, E.; Harvey, R.; Lin, I.-M.; Tylova, H.; Moss, D. Is there more to blood volume pulse than heart rate variability, respiratory sinus arrhythmia, and cardiorespiratory synchrony? Biofeedback 2007, 35, 54–61. [Google Scholar]
  53. Söderberg, C.; Johansson, A.; Mattsson, S. Design of Simple Guidelines to Improve Assembly Instructions and Operator Performance. In Proceedings of the Swedish Production Symposium, Gothenburg, Sweden, 16–18 September 2014. [Google Scholar]
  54. Bradley, M.M.; Lang, P.J. Measuring emotion: The self-assessment manikin and the semantic differential. J. Behav. Ther. Exp. Psychiatry 1994, 25, 49–59. [Google Scholar] [CrossRef]
  55. Korneliusson, M.; Christensson, K.L.; Saarelainen, A.; Sugumaran, S.; Zinad, E. Designing the Personal Assembly Station of the Future. Bachelor’s Thesis, Chalmers University of Technology, Gothenburg, Sweden, 2016. [Google Scholar]
  56. Jacobsson, J.; Nilsson, N.E. Operator-Robot Collaboration-Creation and Evaluation of a Collaborative Operator-Robot Workstation. Master’s Thesis, Chalmers University of Technology, Gothenburg, Sweden, 2017. [Google Scholar]
  57. Kotler, P. Marketing Management: Analysis, Planning, Implementation and Control, 6th ed.; Prentice-Hall International: Englewood Cliffs, NJ, USA, 1988. [Google Scholar]
  58. Ifediora, C.; Idoko, O.; Nzekwe, J. Organization’s stability and productivity: The role of SWOT analysis an acronym for strength, weakness, opportunities and threat. Int. J. Innov. Appl. Res. 2014, 2, 23–32. [Google Scholar]
  59. Fowles, D.C. The Three Arousal Model: Implications of Gray’s Two-Factor Learning Theory for Heart Rate, Electrodermal Activity, and Psychopathy. Psychophysiology 1980, 17, 87–104. [Google Scholar] [CrossRef] [PubMed]
  60. Bradley, M.M.; Lang, P.J. Emotion and Motivation, 2nd ed.; Cambridge University Press: Cambridge, UK, 2004; pp. 602–642. [Google Scholar]
  61. Rasmussen, J. Skills, Rules, Knowledge, Signals, Signs and Symbols and other Distinctions Human Performance Models. IEEE Trans. Man Syst. Cybern. 1983, SMC-13, 257–266. [Google Scholar] [CrossRef]
  62. Chui, M.; Manyika, J.; Bughin, J.; Dobbs, R.; Roxburgh, C.; Sarrazin, H. The Social Economy: Unlocking Value and Productivity through Social Technologies, McKinsey Global Institute. 2012. Available online: http://www.mckinsey.com/insights/high_tech_telecoms_internet/the_social_economy (accessed on 21 September 2017).
  63. Endsley, M.R. Designing for Situation Awareness: An Approach to User-Centered Design; CRC Press: Boca Raton, FL, USA, 2016. [Google Scholar]
  64. Ropohl, G. Philosophy of Socio-technical Systems. 1999. Available online: http://scholar.lib.vt.edu/ejournals/SPT/v4_n3html/ROPOHL.html (accessed on 21 September 2017).
  65. Trist, E. The Evolution of Socio-Technical Systems: A Conceptual Framework and an Action Research Program; Ontario Quality of Working Life Centre: Toronto, ON, Canada, 1981. [Google Scholar]
  66. Hendrick, H.; Kleiner, B. Macroergonomics: An Introduction to Work System Design; Human Factors and Ergonomics Society: Santa Monica, CA, USA, 2001. [Google Scholar]
  67. Trist, E.L.; Bamforth, K.W. Some Social and Psychological Consequences of the Longwall Method of Coalgetting. Hum. Relat. 1951, 4, 3–38. [Google Scholar] [CrossRef]
  68. Maguire, M. Methods to support human-centred design. Int. J. Hum.-Comput. Stud. 2001, 55, 587–634. [Google Scholar] [CrossRef]
  69. Picard, R. Affective Computing: Challenges. Int. J. Hum.-Comput. Stud. 2003, 59, 55–64. [Google Scholar] [CrossRef]
  70. Smith, C.A.; Kirby, L.D. Appraisal as a pervasive determinant of anger. Emotion 2004, 4, 133–138. [Google Scholar] [CrossRef] [PubMed]
  71. Hernandez Rivera, J. Towards Wearable Stress Measurement; Massachusetts Institute of Technology: Cambridge, MA, USA, 2015. [Google Scholar]
  72. Yan, H.; Xu, L.D.; Bi, Z.; Pang, Z.; Zhang, J.; Chen, Y. An emerging technology-wearable wireless sensor networks with applications in human health condition monitoring. J. Manag. Anal. 2015, 2, 121–137. [Google Scholar] [CrossRef]
  73. Sandulescu, V.; Andrews, S.; Ellis, D.; Bellotto, N.; Martinez-Mozos, O. Stress Detection Using Wearable Physiological Sensors. In Proceedings of the International Work-Conference on the Interplay between Natural and Artificial Computation, Elche, Spain, 1–5 June 2015. [Google Scholar]
  74. Åkerman, M.; Fast-Berglund, Å.; Ekered, S. Interoperability for a Dynamic Assembly System. In Proceedings of the 6th CIRP Conference on Assembly Technologies and Systems, CATS 2016, Gothenburg, Sweden, 2016; pp. 407–411. [Google Scholar]
  75. Li, S.; Xu, L.D.; Zhao, S. The internet of things: A survey. Inf. Syst. Front. 2015, 17, 243–259. [Google Scholar] [CrossRef]
  76. Brown, K.W.; Ryan, R.M. The benefits of being present: Mindfulness and its role in psychological well-being. J. Personal. Soc. Psychol. 2003, 84, 822–848. [Google Scholar] [CrossRef]
  77. Yin, R.K. Case Study Research: Design and Methods; SAGE: Thousands Oaks, CA, USA, 2009. [Google Scholar]
  78. Ihantola, E.-M.; Kihn, L.-A. Assessing the quality of case studies. In Proceedings of the 3rd Qualitative Research Conference, Vaasa, Finland, 1–3 June 2010. [Google Scholar]
  79. Romero, D.; Stahre, J.; Wuest, T.; Noran, O.; Bernus, P.; Fast-Berglund, Å.; Gorecky, D. Towards and operator 4.0 typology: A human-centric perspective on the fourth industrial revolution technologies. In Proceedings of the International Conference on Computers & Industrial Engineering CIE 46, Tianjin, China, 29–31 October 2016. [Google Scholar]
  80. Romero, D.; Bernus, P.; Noran, O.; Stahre, J.; Fast-Berglund, Å. Advances in Production Management Systems; Springer International Publishing: Basel, Switzerland, 2016; pp. 677–686. [Google Scholar]
  81. Earthy, J.; Jones, B.S.; Bevan, N. The improvement of human-centred processes-facing the challenge and reaping the benefit of ISO 13407. Int. J. Comput. Stud. 2001, 55, 553–585. [Google Scholar] [CrossRef]
Figure 1. Model for assessing changes in motivation and operator emotion adapted from the introduction, and ways to assess affect from Russell [43], Stamps [44], Mehrabian and Russel [45].
Technologies 05 00061 g001
Figure 2. The three types of Non-Specific Skin Conductance Responses (NSCR) peaks assessed in Laboratory Test A: down peak, flat peak and up peak (from left to right in figure).
Technologies 05 00061 g002
Figure 3. Example graph showing the output data from the activity bracelet: Electro Dermal Activity (EDA), Blood Volume Pulse (BVP), Heart Rate (HR), temperature and time (from top to bottom).
Technologies 05 00061 g003
Figure 4. Prototype evaluated in workshop.
Technologies 05 00061 g004
Figure 5. Results from the Strengths, Weaknesses, Opportunities and Threats (SWOT) analysis.
Technologies 05 00061 g005
Table 1. Mixed method design used to answer research questions.
Research QuestionMethodTriangulation TypeAim
Which physiological measurements can be used to assess operator wellbeing in real-time?Literature study, laboratory tests and case studiesData (literature and laboratory results), method (quantitative and qualitative), theory (different theories are combined in the literature study) and investigator triangulation (multiple researchers involved)Physiological measures are identified and tested
What risks and possibilities are connected to assessing operator wellbeing in real-time in industry?Case studies and workshop Data (case study and workshop data), method (two types of qualitative data) and investigator triangulation (multiple researchers involved)Risks and possibilities are identified
Table 2. Devices and physiological measurements used (connected to methods).
Device (Developed by Company Name)Physiological MeasurementUsed in Method
Qsensor (Affectiva)Electro Dermal Activity (EDA) and body temperatureLaboratory Tests A and B
Breathing activity device (Spire)Respiratory factors (by abdominal and chest movements)Laboratory Test B
SmartBand 2 (Sony)Heart Rate Variability (HRV)Laboratory Test B
Activity bracelet E4 (Empatica *)HRV, Blood Volume Pulse (BVP), EDA and body temperatureLaboratory Test B, workshop and case studies A and B
* The Qsensor was discontinued and the technology was further developed in the company Empatica.
Table 3. Participant data for Laboratory Tests A and B.
Laboratory TestA: Emotion AssessmentsB: Device Testing
Number of participants60 13
Percentage Male/Female (no.)52% male (31)70% men (9)
48% female (29)30% female (4)
Average age22 years35 years
Percentage education (no.)86% Bachelor level (52), Masters level 10% (6), Other 4% (2)Over-graduate 85% (11), Under-graduate 15% (2)
Percentage experience in assembling (category, no.)56% novice (assembled Lego 8–15 years ago, 33), 18% average (1–7 years ago, 11) and 26% experts (less than one year ago, 16)38% novice (5), 31% average (4) and 31% experts (4) in assembling that gearbox
Table 4. Summarized findings.
Physiological MeasurementsResearch MethodsFindingsSources
EDALiterature Study EDA was identified as being useful for assessing stress, changes in emotion and motivationLiterature data
Laboratory Study AWeak correlation with operator performance (significant correlation)Quantitative data
EDA and HRVLaboratory Study B50% of the participants thought it was the most reliable, 50% preferred HRVQualitative data
EDA and HRVCase Study AParticipants were positive about the graphsQualitative
EDA and BVPCase Study B Project leader thought it was crucial for understanding interactionQualitative

