Article

A Transportable Photovoltaic Power Generation System Utilizing a SiC Inverter and Spherical Si Solar Cells

1
Department of Materials Science, The University of Shiga Prefecture, 2500 Hassaka, Hikone, Shiga 522-8533, Japan
2
Collaborative Research Center, The University of Shiga Prefecture, 2500 Hassaka, Hikone, Shiga 522-8533, Japan
3
ArumoTech Corporation, 572 Sanboh-Nishinotohincho, Nakagyou-ku, Kyoto 604-8277, Japan
4
Clean Venture 21 Co., 38 Ishihara Douno-Ushirocho, Kissyouin, Minami-ku, Kyoto 601-8355, Japan
*
Author to whom correspondence should be addressed.
Technologies 2017, 5(2), 18; https://doi.org/10.3390/technologies5020018
Submission received: 10 March 2017 / Revised: 19 April 2017 / Accepted: 19 April 2017 / Published: 21 April 2017
(This article belongs to the Section Environmental Technology)

Abstract

:
This paper reports a 100-W class transportable photovoltaic (PV) power generation system built with SiC power devices. Conventionally, studies on SiC power converters have mostly focused on multi-kW applications. In this paper, we have verified the feasibility of the SiC power devices for sub-kW PV power generation systems. The developed PV power generation system consisted of a spherical Si solar cell module, a 150-W SiC PV-inverter unit with maximum power point tracking (MPPT) function, and a 12-V Li-ion battery. The total weight of the system was just 4.3 kg. Conversion efficiencies of the MPPT charge controller and the direct current-alternating current converter reached 98.0% and 88.4%, respectively. The developed system exhibited stable output power characteristics, even when the weather conditions were fluctuated. These compactness, high efficiencies, and excellent stability clearly indicated the feasibility of SiC power devices even for sub-kW class PV power generation systems. This kind of system would be available for the applications where compactness and transportability are of tremendous importance.

1. Introduction

In the modern power electronics, the electron device requirements include a high blocking voltage, a low ON resistance, a high switching frequency, and good reliability. These requirements have led to a great interest in power devices based on wide gap semiconductors such as GaN and SiC [1,2,3]. The main advantage of wide gap semiconductors is their very high electric field capability. Wide gap semiconductors possess high critical field strengths. This means that a thinner epi layer is required to block the same voltage compared with Si devices. Thus, switching devices with much lower ON resistances can be fabricated using GaN or SiC. A lower ON resistance improves the efficiency of inverters due to reduced conduction and switching losses, and also decreases the module size due to the increased power density. The high electron mobility of GaN allows switching operations with higher frequencies, which also decreases the module size because of the smaller passive components. The excellent thermal stability of SiC and GaN should enable devices based on these materials to operate at high temperatures.
Since the first photovoltaic (PV) inverter using SiC diodes by Phlippen and Burger [4] and that using SiC transistors by Stalter et al. [5], there have been considerable reports on the applications of SiC devices on power converters [6,7,8]. Concerning direct current (DC)-DC converters, interleaved boost converters built with SiC bipolar junction transistors (BJTs) and SiC Schottky barrier diodes (SBDs) were presented in [9] and [10], respectively. Ref. [10] reported a converter with a rated power of 2500 W built with 900-V advanced Si metal-oxide-semiconductor field-effect transistors (MOSFETs) and 1200-V SiC SBDs. In [9], the employment of 1200-V SiC BJTs realized a 5500-W converter. Concerning DC-alternating current (AC) converters, single-phase inverters using SiC junction field-effect transistors (JFETs) and SiC MOSFETs were presented in [11] and [12], respectively. Ref. [11] reported a 2500-W single-phase inverter built with 1200-V SiC JFETs. In [12], the employment of 1200-V SiC MOSFETs realized a 5000-W single-phase inverter. Three-phase inverters using SiC JFETs and SiC MOSFETs were reported in [13] and [14], respectively. Ref. [14] reported a 7000-W three-phase inverter built with 1200-V SiC MOSFETs. In [13], the employment of 1200-V SiC JFETs realized a 5000-W three-phase inverter with a high switching frequency of 144 kHz. Recently, [15,16] reported all SiC inverters. Some authors [17,18,19] also gave a comparative study of Si- and SiC-based power converters. Ref. [20] gave a comprehensive review on SiC-based PV-inverters. As mentioned above, several device structures were adopted as SiC-based active switches such as MOSFET, JFET, and BJT. The SiC MOSFET, the first SiC-based transistor to be commercially available, is a voltage-controlled normally-off device, which makes this device user-friendly. The SiC BJT and the SiC JFET are rather immature devices. However, these devices are expected to have the advantage of a low ON resistance, since they are free from the mobility degradation due to interface traps that is significant in the MOSFET. The SiC BJT is a normally-off device but being current-controlled, which requires a special driver circuit. The SiC JFET have a p-n junction at the gate, which conducts with a positive voltage swing corresponding to the bandgap (approximately 3 V). In the case of the normally-off JFET, it requires a significantly large gate voltage to turn on the device completely. Therefore, it also requires a special driver circuit.
In the literature, studies on power converters using SiC devices mostly focused on multi-kW class applications. The reason is that advantages of a lower ON resistance of SiC devices were considered lost in sub-kW class power converters. In addition, most of developed power converters were examined as a stand-alone equipment. Concerning PV applications, however, performances of the total system including PV-inverters and solar cells should also be investigated. Recently, we reported 300-W class power converters using SiC devices [21,22,23]. This kind of inverter would be available for the applications where compactness and transportability are of tremendous importance, such as mobile computing systems, security monitoring or sensing systems, auxiliary power supply systems for automobiles or drones, emergency power supply systems. More recently, we have developed a 150-W PV-inverter using SiC power devices [24,25]. An increase in the switching frequency of the inverter achieved a state-of-the-art combination of weight (1.3 kg) and size (250 mm × 180 mm × 28 mm) as this class inverter. Besides being compact, it exhibited an approximately 3% higher conversion efficiency as compared to commercial Si-based inverters.
The aim of this paper is to verify the feasibility of SiC power devices for sub-kW applications. For this purpose, we have constructed and characterized a 150-W transportable PV power generation system using the developed SiC inverter. The present system consisted of the SiC-based inverter unit, a spherical Si solar cell module, and a Li-ion battery. The spherical Si cell module [26] that is lightweight, flexible, and economical is suitable for transportable PV applications. To study the electrical power stability in the actual use condition, we have carried out the continuous operation measurements of the developed system including the solar cell module, the PV-inverter, and the storage battery. In addition, the battery duration time without the aid of the solar cell module was measured and compared with calculations.

2. Materials and Methods

Figure 1a,b is photographs of the developed PV power generation system taken from the top and bottom, respectively. A PV-inverter unit and a Li-ion battery were attached on the bottom side of a solar cell module. Figure 1c illustrates setup of this system. The PV-inverter unit contained a DC-AC converter and a maximum power point tracking (MPPT) charge controller. The MPPT controller was driven by the input voltage regulation [27]. The inverter circuit consisted of a front stage DC-DC converter followed by a second stage DC-AC converter. The DC-DC part was a push-pull converter built with four SiC SBDs (SCS210AJ, ROHM Semiconductor, Kyoto, Japan) [28]. The DC-AC part was a single-phase full-bridge inverter built with four SiC MOSFETs (SCT2120AF, ROHM Semiconductor, Kyoto, Japan) [29]. The rated output power was 150 W. Basically, the switching frequency of the pulse width modulation was determined to balance the compactness and the efficiency of the circuit. In addition, we took care of the charging time of the bootstrap circuit used in the gate drive of the high-side transistors. In the DC-AC part, the switching frequency was set to 100 kHz to insure sufficient time to charge the bootstrap capacitors. On the other hand, in the DC-DC part, the switching frequency was set to 200 kHz, since it included no bootstrap circuit. As the power source, a spherical Si solar cell module (CVFM-0540T2-WH, Clean Venture 21, Kyoto, Japan) was used. The maximum power point current and voltage were 3.34 A and 16.2 V, respectively. The rated output power was 54 W. The MPPT circuit not only controlled the load of the cell to maximize the PV output power, but also stabilized the electric power supplied to the DC-AC converter by charging and discharging Li-ion battery (Lifepo4, O’Cell Technology, Shenzhen, China). The rated voltage and capacity of the battery were 12 V and 3.3 Ah, respectively. Table 1 summarizes size and weight of the individual units and total system. To the best of our knowledge, the developed SiC inverter achieved a state-of-the-art combination of the weight (1.3 kg) and the volume (1260 cm3) for 150–250 W class inverters [30]. Weight of the total system including power cables and AC outlets was 4.3 kg.

3. Results

3.1. Conversion Efficiencies of the SiC Inverter

First, we have characterized conversion efficiencies of the individual circuits of the developed SiC inverter, separately. The conversion efficiency of the MPPT controller was measured by connecting an alternative power supply to the solar cell terminal of the inverter, while making the inverter circuit inactive. Losses of power cables were corrected by directly measuring their resistances. Resistance of the power cable was 89 mΩ between the solar cell terminal of the inverter and the power meter. This value was 20 mΩ between the battery terminal and the power meter. The loss of the cable between the AC terminal and the power meter was neglected since the current value was small. Figure 2a presents corrected and uncorrected MPPT efficiency with respect to DC input power. The corrected MPPT efficiency exceeded 97% when DC input power was over 24 W, and the peak efficiency reached 98.0%.
The conversion efficiency of the DC-AC converter was measured by changing the load power, while making the solar cell module inactive. Figure 2b presents corrected and uncorrected efficiencies with respect to AC output power. Corrected DC-AC conversion efficiency exceeded 85% when the output power was over 60 W, and the peak efficiency reached 88.4%. A commercial Si-based 300-W DC-AC converter (SXCD-300, Daiji Industry, Kashiwara, Japan) was also measured with the same equipment. The obtained conversion efficiency was approximately 3% higher in the SiC inverter than in the Si inverter [24,25]. In sub-kW class inverters, the ON resistance was considered to have little influence on the efficiency. The loss analysis [30,31] indicated this improvement was due to decreased DC-DC conversion loss and suppressed switching losses in SiC devices.

3.2. Electric Power Stability: Measurement Started from a Discharged Condition

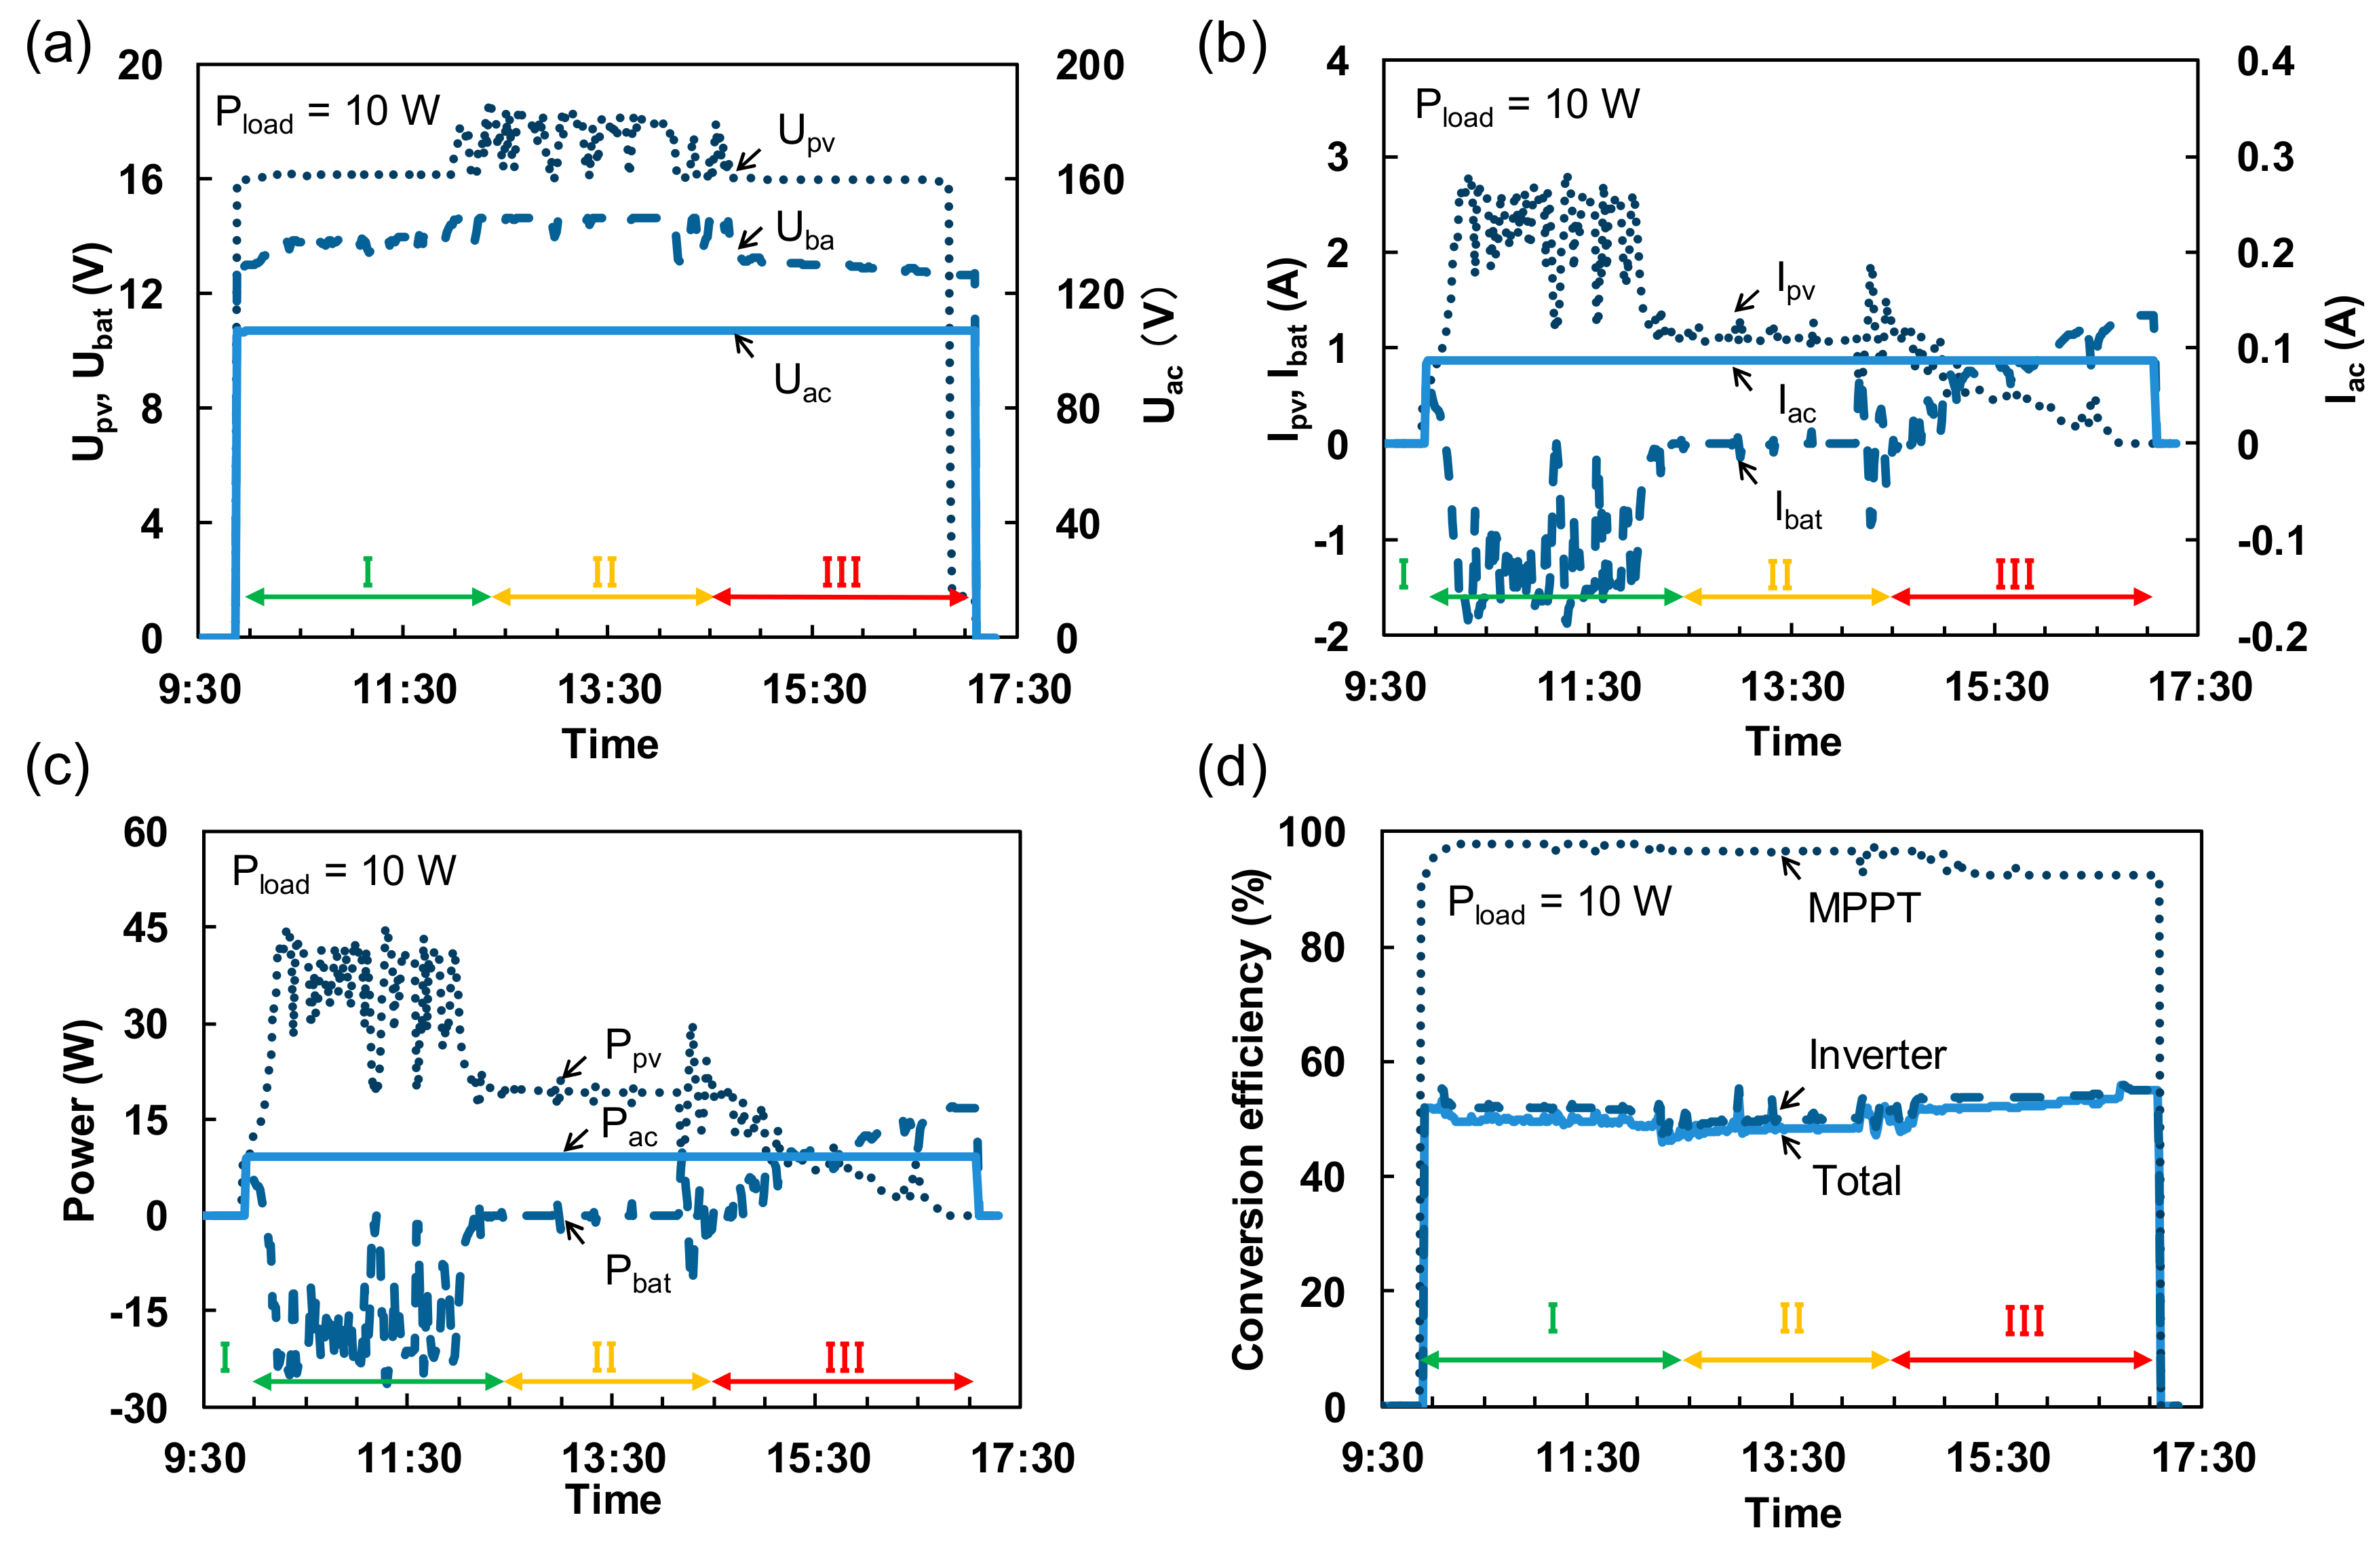
To investigate the electric power stability of this PV system, continuous operation measurements were performed with the solar cell active. Concerning the battery condition, we have tested two typical cases, those were, an exhausted condition and a fully charged condition. First, the measurement was carried out using an almost exhausted battery in the initial condition. The load power was set at 10 W. Figure 3a–c show variations in the voltage, current, and power values, respectively. In these figures, subscripts pv, bat, and ac to the voltage U, current I, and power P mean the solar cell, battery, and AC terminals of the inverter, respectively (see Figure 1c). In Figure 3d, variations in the conversion efficiencies of the MPPT controller, inverter, and total system are shown. Here, the total efficiency (ηtot) of the inverter was introduced by [24].
η t o t = P a c P p v + P b a t
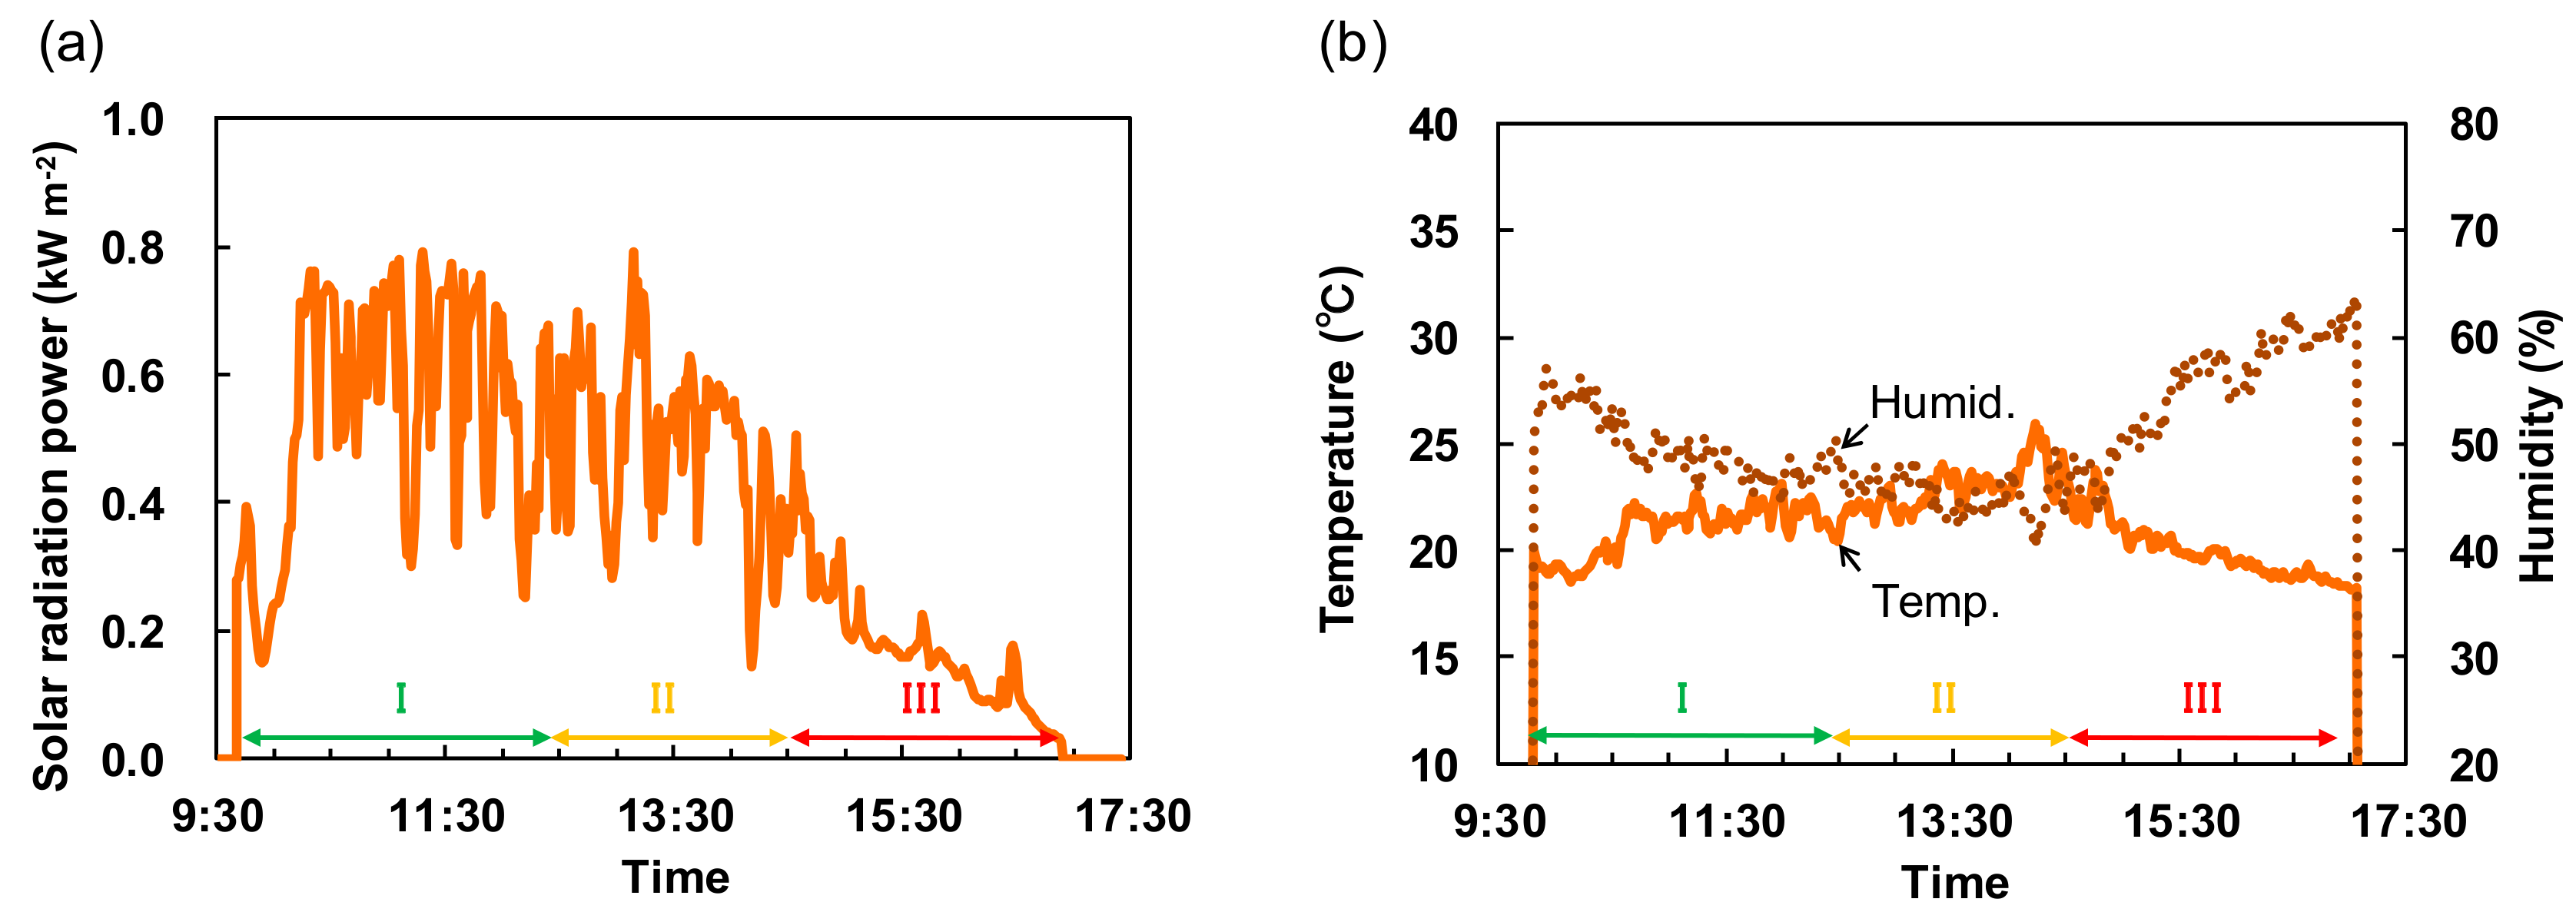
Figure 4a,b show corresponding variations in solar radiation power and those of temperature and humidity, respectively. The weather was cloudy.
Before 12:30 (the period I in Figure 3 and Figure 4), the output current of the battery (Ibat) ranged between −2 and 0 A, while that of the solar cell (Ipv) ranged between 1 and 3 A. In this period, the electric power provided by the solar cell (Ppv) was not only supplied to the load, but also used to charge the storage battery. From 12:30 to 14:30 (the period II), Ibat was almost zero, while Ipv was close to 1.1 A. In this period, the storage battery was fully charged, and the whole of Ppv was supplied to the load. After 14:30 (the period III), Ibat was increased from 0 to 1.3 A, while Ipv was decreased from 1.1 to 0 A. In this period, the solar radiation power (Psolar) fell below 0.3 kW·m−2, as shown in Figure 4a. The storage battery was discharging the electric power to compensate the decrease in Ppv. Throughout a whole measurement, considerable variations were observed in the solar radiation power, the temperature, and the humidity, as shown in Figure 4a,b. As a result, violent fluctuations were observed in the voltage (Upv, Ubat), current (Ipv, Ibat), and power (Ppv, Pbat) both at the solar cell and battery terminals. Concerning the AC output electricity, however, the voltage (Uac), current (Iac), and power (Pac) were very stable. In this measurement, the total efficiency ranged between 47 and 55%. This low efficiency value was attributed to the low output power of 10 W. In such a condition, the efficiency was predominantly determined by non-load losses due to transformers in DC-DC converter circuit, electrolytic capacitors of the filter circuit, and so on.
Correlation between the electric power and Psolar was analyzed based on these results. Figure 5a shows correlation between Ppv and Psolar, while Figure 5b shows correlation between Pbat and Psolar. Straight line fits show groups of data I, II, and III, which correspond to periods I (charging condition), II (fully charged condition), and III (discharging condition), respectively in Figure 3 and Figure 4. In the group II, Ppv was almost constant independently of variation of Psolar. This is because the battery was fully charged, and hence, Ppv was limited below sum of the load power (10 W) and the accompanying loss. The boundary between the group III and the other groups was located approximately at 0.3 kW·m−2. This indicated that the 10-W load system continuously operated without discharging the storage battery as long as Psolar exceeded 0.3 kW·m−2.

3.3. Electric Power Stability: Measurement Started from a Fully Charged Condition

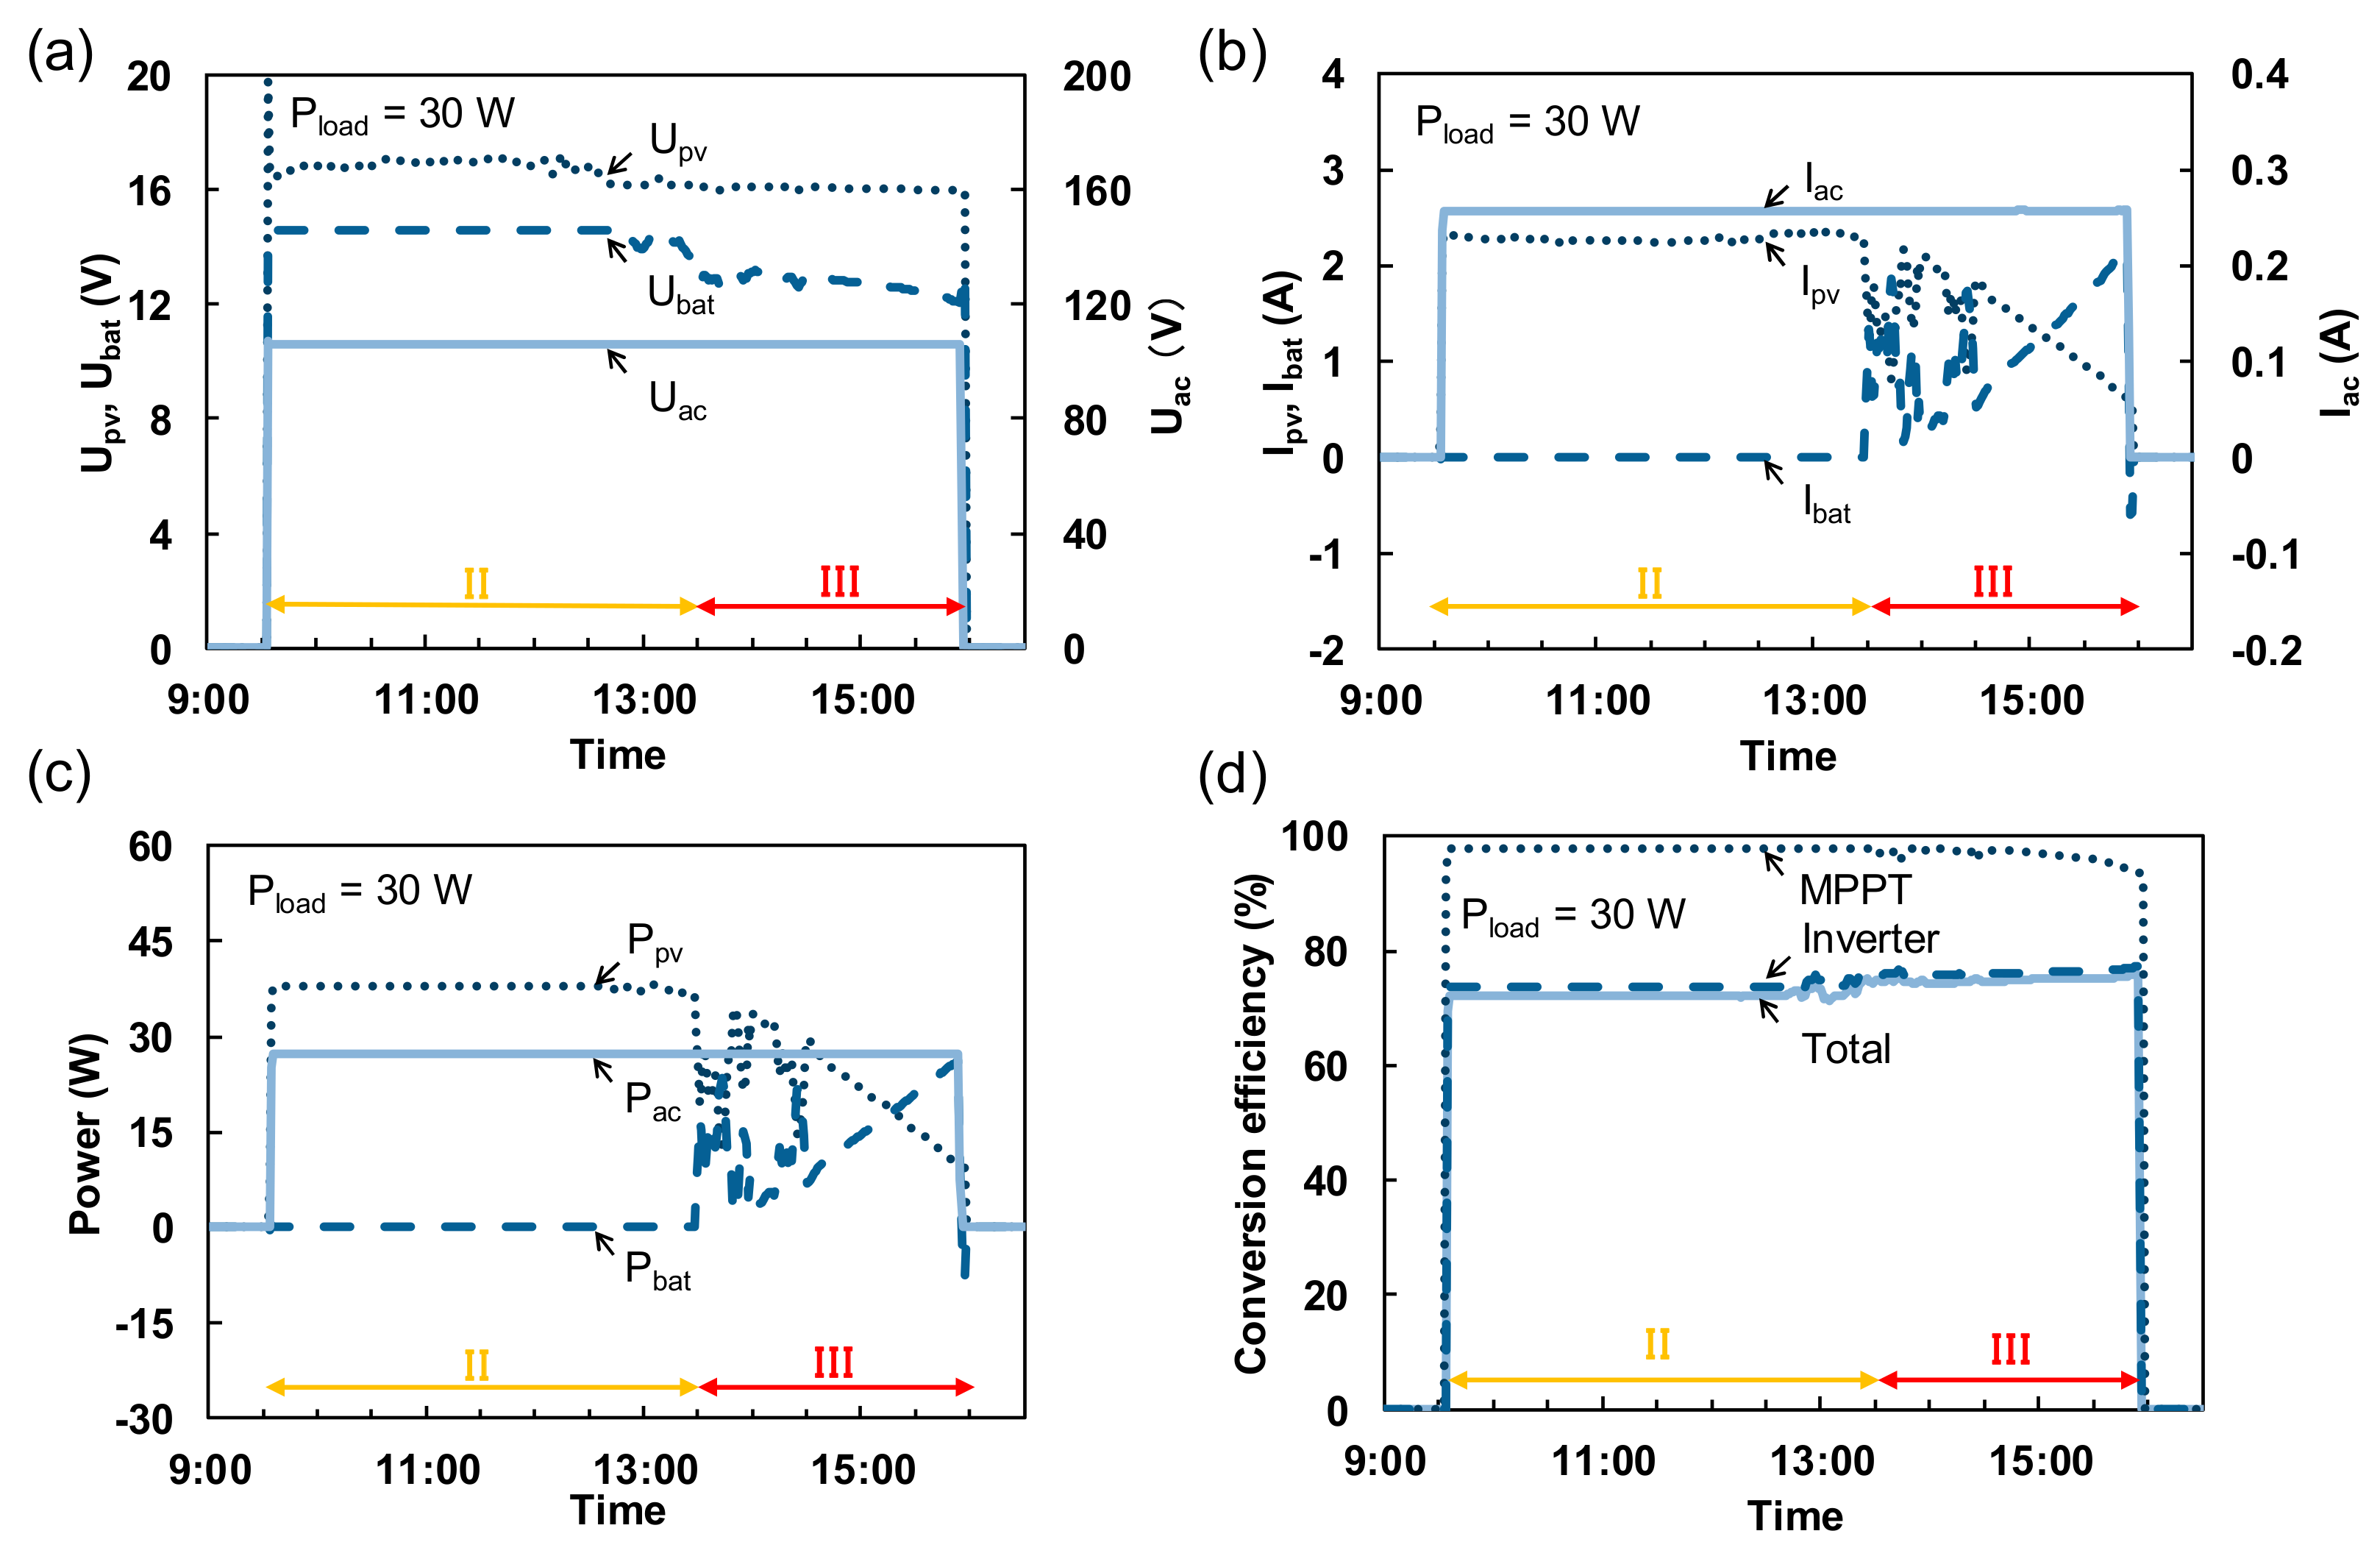
Next, we have carried out the measurement using a fully charged battery in the initial condition. The load power was set at 30 W. Figure 6a–c show variations in the voltage, current, and power values, respectively. In Figure 6d, variations in the conversion efficiencies of the MPPT controller, inverter, and total system are shown. Figure 7a,b show corresponding variations in solar radiation power and those of temperature and humidity, respectively. The weather was clear.
Before 13:30 (the period II in Figure 6 and Figure 7), Ibat was almost zero, while Ipv was close to 2.3 A. In this period, the storage battery was in a fully charged condition, and the whole of Ppv was supplied to the load. After 13:30 (the period III), Ibat was increased from 0 to 2.3 A, while Ipv was decreased from 2.3 to 0 A. In this period, Psolar fell below 0.5 kW·m−2, as shown in Figure 7a. The storage battery was discharging the electric power to compensate the decrease in Ppv. In this case, the period I (Ibat < 0) was seldom observed. From 13:30 to 14:30, considerable variations were observed in the solar radiation power, the temperature, and the humidity, as shown in Figure 7a,b. As a result, violent fluctuations were observed in the voltage, current, and power both at the solar cell and battery terminals. Concerning the AC output electricity, however, these variables were very stable. The total efficiency ranged between 72% and 76%.
Correlation between the electric power and Psolar was analyzed based on these results. Figure 8a shows correlation between Ppv and Psolar, while Figure 8b shows correlation between Pbat and Psolar. Straight line fits show groups of data II and III, which correspond to periods II (fully charged condition) and III (discharging condition), respectively in Figure 6 and Figure 7. In contrast with Figure 5, group I disappeared in this case. In the group II, Ppv was almost constant independently of variation of Psolar. This is because the battery was fully charged, and hence, Ppv was limited below sum of the load power (30 W) and the accompanying loss. The boundary between the groups III and II was located approximately at 0.5 kW·m−2. This indicated that the 30-W load system continuously operated without discharging the storage battery as long as Psolar exceeded 0.5 kW·m−2.

3.4. Battery Duration Time

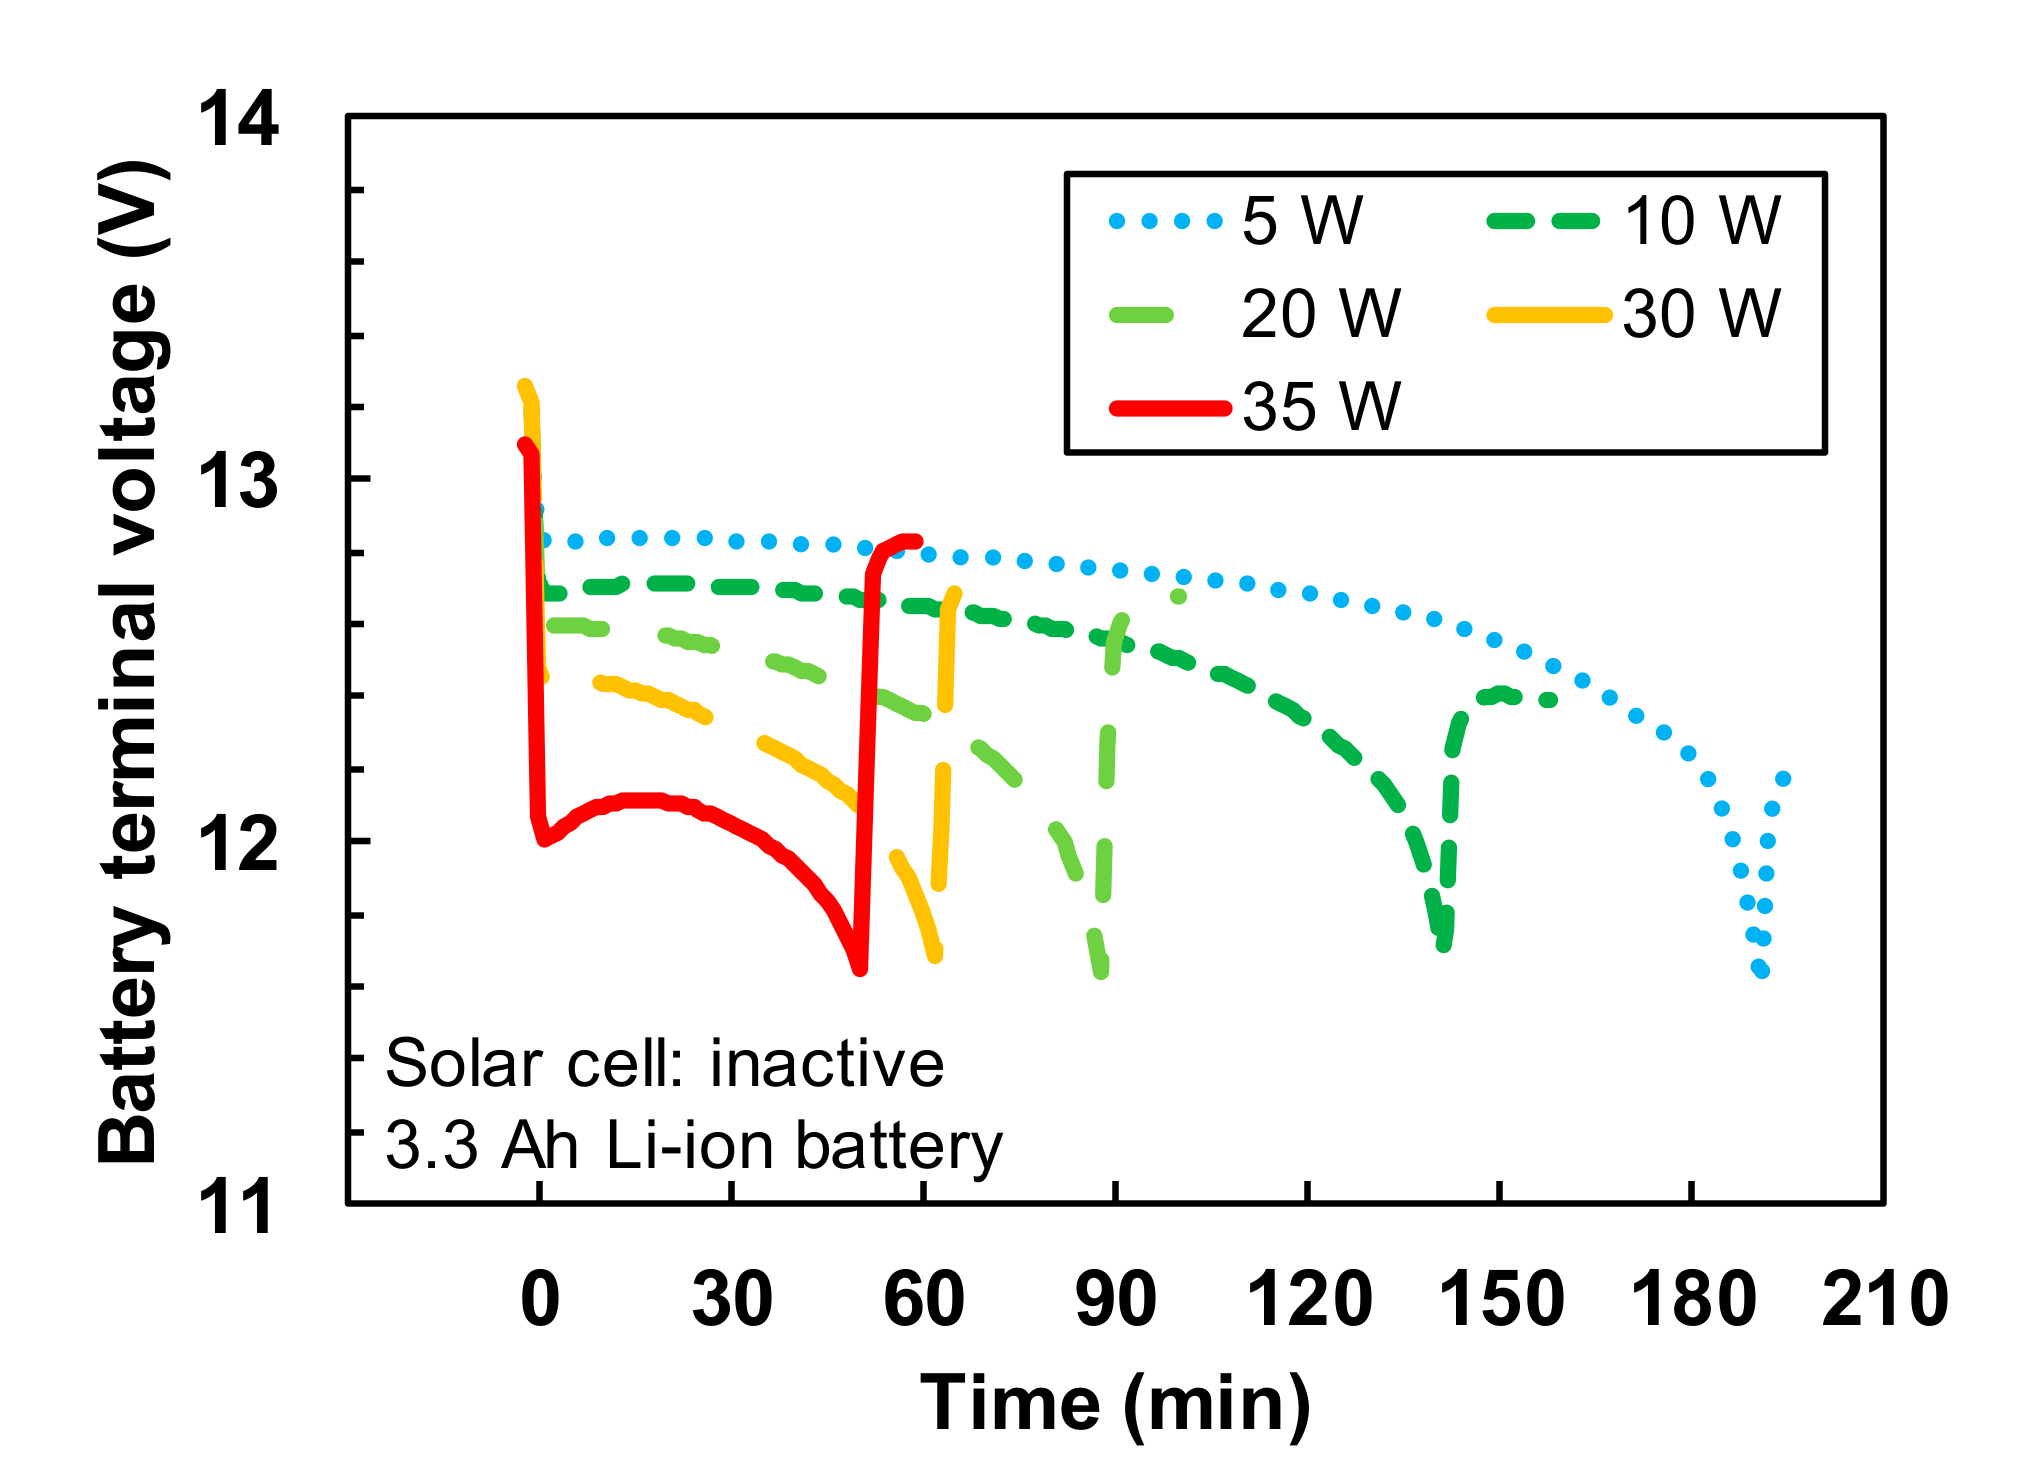
To estimate the battery duration time (tbat), we have performed continuous operation measurements with the solar cell inactive. Figure 9 shows variations in Ubat for different load power values. As the load was applied, Ubat dropped down from the open-circuit voltage, and then it was gradually decreased. As Ubat fell below 11.5 V, the under-voltage-lockout function turned off the inverter and Ubat rose to the open-circuit voltage. The tbat value was 2.4 h under a 10-W load, while it was just 1 h under a 30-W load. The relatively short duration times were due to the small battery capacity of 3.3 Ah. An increase in the battery capacity should extend the duration time.
To estimate the effect of the battery capacity, we have simply calculated tbat by
t b a t ( P a c , Q b a t ) = Q b a t V b a t η i n v ( P a c ) P a c
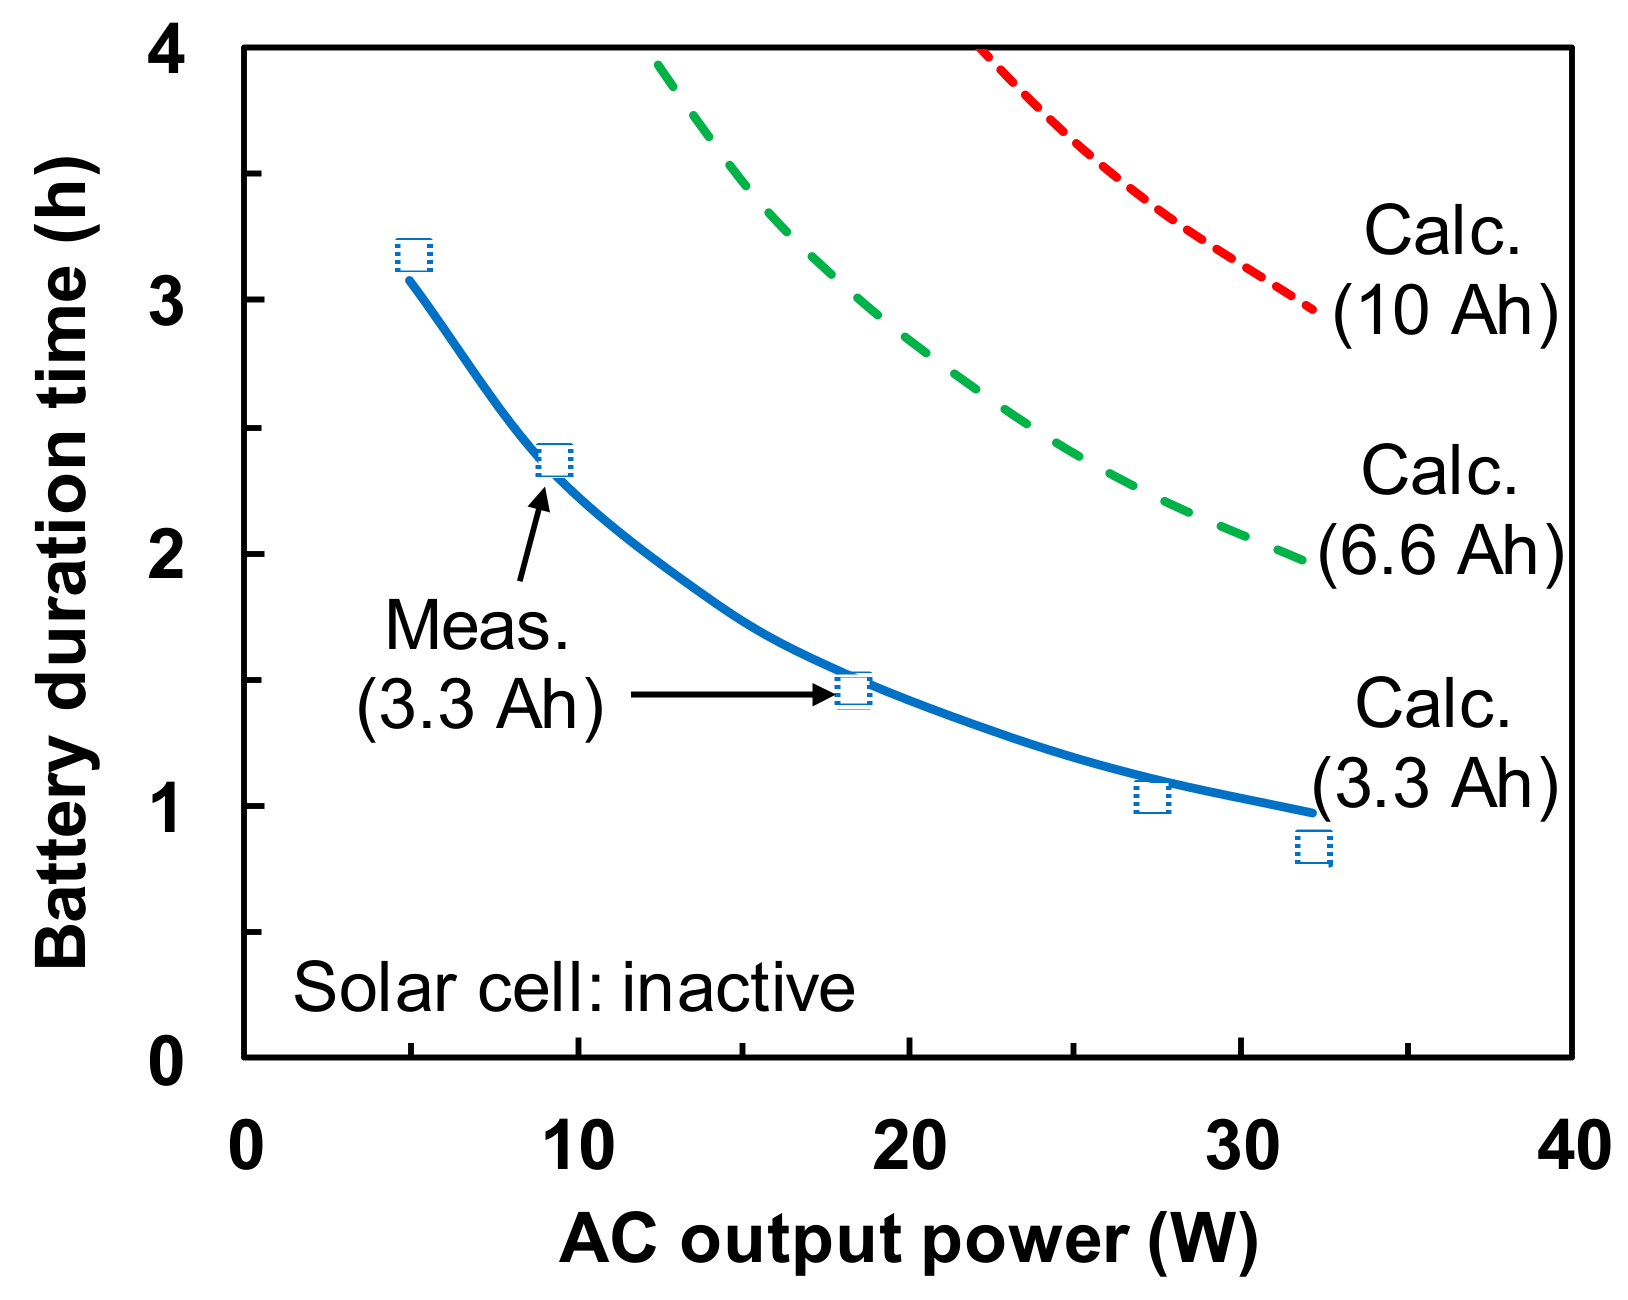
In this expression, Qbat is the battery capacity, Vbat is the battery voltage (12 V), and ηinv(Pac) is Pac dependence of the inverter efficiency that is shown in Figure 2b. Figure 10 plots calculated relationship between tbat and Pac, where Qbat was ranged from 3.3 to 10 Ah. Also plotted are measured results obtained from Figure 9. Satisfactory agreement was obtained between the measurement and the calculation for Qbat = 3.3 Ah. By increasing Qbat up to 10 Ah, the tbat values were estimated to be 7 and 3 h for 10-W and 30-W loads, respectively. In this case, the weight of the total system was estimated to be 5.1 kg.

4. Conclusions

To verify the feasibility of SiC power devices for sub-kW applications, we have constructed a transportable 150-W PV power generation system using the SiC inverter. The developed PV power generation system consisted of a spherical Si solar cell module (rated power: 54 W), a SiC-based PV-inverter unit with MPPT functions (rated power: 150 W), and a 12 V Li-ion battery (battery capacity: 3.3 Ah). The developed SiC inverter achieved a state-of-the-art combination of the weight (1.3 kg) and the volume (1260 cm3) for 150–250 W class inverters. The total weight of the PV power generation system was just 4.3 kg. The conversion efficiency of the DC-AC converter reached 88.4%, which was approximately 3% higher than the commercial Si-based inverter. The conversion efficiency of the MPPT charge controller reached 98.0%. Stabilities of the electric power and efficiency of this system were studied for two typical battery conditions; those were a fully charged condition and an almost exhausted condition. For both conditions, the system exhibited stable output power characteristics, even when the weather conditions were fluctuated. The battery duration time without the aid of the solar cell was estimated to be 3 h for a 30-W load operation, when the battery capacity was increased to 10 Ah. These compactness, high efficiencies, and excellent stability clearly indicated the feasibility of SiC power devices even for sub-kW class PV power generation systems. This kind of system is available for the applications where compactness and transportability are of tremendous importance, such as mobile computing systems, security monitoring or sensing systems, auxiliary power supply systems for automobiles or drones, and emergency power supply systems.

Acknowledgments

This study was supported by the Super Cluster Program of the Japan Science and Technology Agency (JST).

Author Contributions

Yuji Ando performed the experiments and analyzed the data; Yuji Ando and Takeo Oku wrote the paper; Takeo Oku and Masashi Yasuda designed the photovoltaic system; Kazufumi Ushijima developed the inverter circuit; and Mikio Murozono developed the solar cell module. All authors have read and approved the final manuscript.

Conflicts of Interest

The authors declare no conflict of interest.

References

  1. Labedev, A.A.; Chelnokov, V.E. Wide-gap semiconductors for high-power electronics. Semiconductors 1999, 33, 999–1001. [Google Scholar] [CrossRef]
  2. Monroy, E.; Omnès, F.; Calle, F. Wide-bandgap semiconductor ultraviolet photodetectors. Semicond. Sci. Technol. 2003, 18, R33–R51. [Google Scholar] [CrossRef]
  3. Okumura, H. Present status and future prospect of widegap semiconductor high-power devices. Jpn. J. Appl. Phys. 2006, 45, 7565–7586. [Google Scholar] [CrossRef]
  4. Phlippen, F.; Burger, B. A new high voltage Schottky diode based on silicon-carbide (SiC). In Proceedings of the 9th European Conference Power Electronics and Applications (EPE 2001), Graz, Austria, 27–28 August 2001; p. 00259. [Google Scholar]
  5. Stalter, O.; Burger, B.; Lehrmann, S. Silicon carbide (SiC) D-MOS for grid-feeding solar inverters. In Proceedings of the 12th European Conference Power Electronics and Applications (EPE 2007), Aalborg, Denmark, 2–5 September 2007; pp. 1–10. [Google Scholar]
  6. Chinthavali, M.; Zhang, H.; Tolbert, L.M.; Ozpineci, B. Update on SiC-based inverter technology. In Proceedings of the 2009 Brazilian Power Electronics Conference (COBEP 2009), Bonito, Mato Grosso do Sul, Brazil, 27 September–1 October 2009; pp. 71–79. [Google Scholar]
  7. Yamane, A.; Koyanagi, K.; Kozako, M.; Fuji, K.; Hikita, M. Fabrication and evaluation of SiC inverter using SiC-MOSFET. In Proceedings of the IEEE 10th International Conference Power Electronics and Drive Systems (PEDS 2013), Kitakyushu, Japan, 22–25 April 2013; pp. 1029–1032. [Google Scholar]
  8. Li, L.; Li, C.; Cao, Y.; Wang, F. Recent progress of SiC power devices and applications. IEEJ Trans. Electr. Electron. Eng. 2013, 8, 515–521. [Google Scholar] [CrossRef]
  9. Hensel, A.; Wilhelm, C.; Kranzer, D. Development of a boost converter for PV systems based on SiC BJTs. In Proceedings of the 14th European Conference on Power Electronics and Applications (EPE 2011), Birmingham, UK, 30 August–1 September 2011; pp. 1–7. [Google Scholar]
  10. Ho, C.N.M.; Breuninger, H.; Pettersson, S.; Escoba, G.; Coccia, A.; Oikonomous, N. Practical implementation of an interleaved boost converter using SiC diodes for PV applications. Proceedings of IEEE 8th International Conference Power Electronics & ECCE Asia (ICPE 2011-ECCE Asia), Jeju, Korea, 30 May–3 June 2011; pp. 372–379. [Google Scholar]
  11. Kranzer, D.; Wilhelm, C.; Reiners, F.; Burger, B. Application of normally-off SiC-JFETs in photovoltaic inverters. In Proceedings of the 13th European Conference Power Electronics and Applications (EPE 2009), Barcelona, Spain, 8–10 September 2009; pp. 1–6. [Google Scholar]
  12. Burger, B.; Kranzer, D.; Stalter, O. Cost reduction of PV-inverters with SiC-DMOSFETs. In Proceedings of the 2008 5th International Conference on Integrated Power Electronics Systems (CIPS 2008), Nuremberg, Germany, 11–13 March 2008; pp. 1–5. [Google Scholar]
  13. Stalter, O.; Kranzer, D.; Rogalla, S.; Burger, B. Advanced solar power electronics. In Proceedings of the 22nd International Symposium Power Semiconductor Devices & IC’s (ISPSD 2010), Hiroshima, Japan, 6–10 June 2010; pp. 3–10. [Google Scholar]
  14. Burger, B.; Kranzer, D.; Stalter, O. Efficiency improvement of PV inverters with SiC-DMOSFETs. Mater. Sci. Forum 2009, 600–603, 1231–1234. [Google Scholar] [CrossRef]
  15. De, D.; Castellazzi, A.; Solomon, A.; Trentin, A.; Minami, M.; Hikihara, T. An all SiC MOSFET high performance PV converter cell. In Proceedings of the 15th European Conference on Power Electronics and Applications (EPE 2013), Lille, France, 2–6 September 2013; pp. 1–10. [Google Scholar]
  16. Nashida, N.; Hinata, Y.; Horio, M.; Yamada, R.; Ikeda, Y. All-SiC power module for photovoltaic power conditioner system. Proceedings of IEEE 26th International Symposium Power Semiconductor Devices & IC’s (ISPSD 2014), Waikoloa, HI, USA, 15–19 June 2014; pp. 342–345. [Google Scholar]
  17. Burkart, R.M.; Kolar, J.W. Comparative evaluation of SiC and Si PV inverter systems based on power density and efficiency as indicators of initial cost and operating revenue. Proceedings of IEEE 14th Workshop on Control and Modeling for Power Electronics (COMPEL), Salt Lake City, UT, USA, 23–26 June 2013; pp. 1–6. [Google Scholar]
  18. Sintamarean, C.; Blaabjerg, F.; Wang, H. Comprehensive evaluation on efficiency and thermal loading of associated Si and SiC based PV inverter applications. In Proceedings of the 39th Annual Conference IEEE Industrial Electronics Society (IECON 2013), Vienna, Austria, 10–13 November 2013; pp. 555–560. [Google Scholar]
  19. Ho, C.N.-M.; Breuninger, H.; Pettersson, S.; Escobar, G.; Canales, F. A comparative performance study of an interleaved boost converter using commercial Si and SiC diodes for PV Applications. IEEE Trans. Power Electron. 2013, 28, 289–299. [Google Scholar] [CrossRef]
  20. Kim, T.; Jang, M.; Agelidis, V.G. Current status of Silicon Carbide power devices and their application in photovoltaic converters. Proceedings of IEEE ECCE Asia Downunder (ECCE Asia), Melbourne, Australia, 3–6 June 2013; pp. 555–559. [Google Scholar]
  21. Oku, T.; Matsumoto, T.; Hiramatsu, K.; Yasuda, M.; Shimono, A.; Takeda, Y.; Murozono, M. Construction and characterization of spherical Si solar cells combined with SiC electric power inverter. AIP Conf. Proc. 2015, 1649, 79–83. [Google Scholar]
  22. Matsumoto, T.; Oku, T.; Hiramatsu, K.; Yasuda, M.; Shirahata, Y.; Shimono, A.; Takeda, Y.; Murozono, M. Evaluation of photovoltaic power generation system using spherical silicon solar cells and SiC–FET inverter. AIP Conf. Proc. 2016, 1709, 020023. [Google Scholar] [CrossRef]
  23. Oku, T.; Matsumoto, T.; Hiramatsu, K.; Yasuda, M.; Ohishi, Y.; Shimono, A.; Takeda, Y.; Murozono, M. Construction and evaluation of photovoltaic power generation and power storage system using SiC field-effect transistor inverter. AIP Conf. Proc. 2016, 1709, 020024. [Google Scholar] [CrossRef]
  24. Ando, Y.; Oku, T.; Yasuda, M.; Shirahata, Y.; Ushijima, K.; Murozono, M. A compact SiC photovoltaic inverter with maximum power point tracking function. Solar Energy 2017, 141, 228–235. [Google Scholar] [CrossRef]
  25. Oku, T.; Ando, Y.; Yasuda, M.; Shirahata, Y.; Ushijima, K.; Murozono, M. Construction of photovoltaic power generation-storage system using an inverter with SiC FET and SBD. Adv. Energy Power 2017, 5, 7–12. [Google Scholar]
  26. Oku, T.; Kanayama, M.; Ono, Y.; Akiyama, T.; Kanamori, Y.; Murozono, M. Microstructures, optical and photoelectric conversion properties of spherical silicon solar cells with anti-reflection SnOx:F thin films. Jpn. J. Appl. Phys. 2014, 53, 05FJ03-1-7. [Google Scholar] [CrossRef]
  27. Texas Instruments. Datasheet of BQ24650—Synchronous Switching-Mode Battery Charge Controller for Solar Power with Maximum Power Point Tracking. 2016. Available online: http://www.ti.com/lit/ds/symlink/bq24650.pdf (accessed on 21 April 2017).
  28. ROHM Semiconductor. Datasheet of SCS210AJ–SiC Schottky Barrier Diode. 2015. Available online: http://rohmfs.rohm.com/en/products/databook/datasheet/discrete/sic/sbd/scs210aj-e.pdf (accessed on 21 April 2017).
  29. ROHM Semiconductor. Datasheet of SCT2120AF–N-Channel SiC Power MOSFET. 2015. Available online: http://rohmfs.rohm.com/en/products/databook/datasheet/discrete/sic/mosfet/sct2120af-e.pdf (accessed on 21 April 2017).
  30. Ando, Y.; Oku, T.; Yasuda, M.; Shirahata, Y.; Ushijima, K.; Murozono, M. Comparative study of SiC- and Si-based photovoltaic inverters. AIP Conf. Proc. 2017, 1807, 020020. [Google Scholar] [CrossRef]
  31. Ando, Y.; Shirahata, Y.; Oku, T.; Matsumoto, T.; Ohishi, Y.; Yasuda, M.; Shimono, A.; Takeda, Y.; Murozono, M. Comparison between SiC- and Si-based inverters for photovoltaic power generation systems. J. Power Eng. 2017, 5, 30–40. [Google Scholar] [CrossRef]
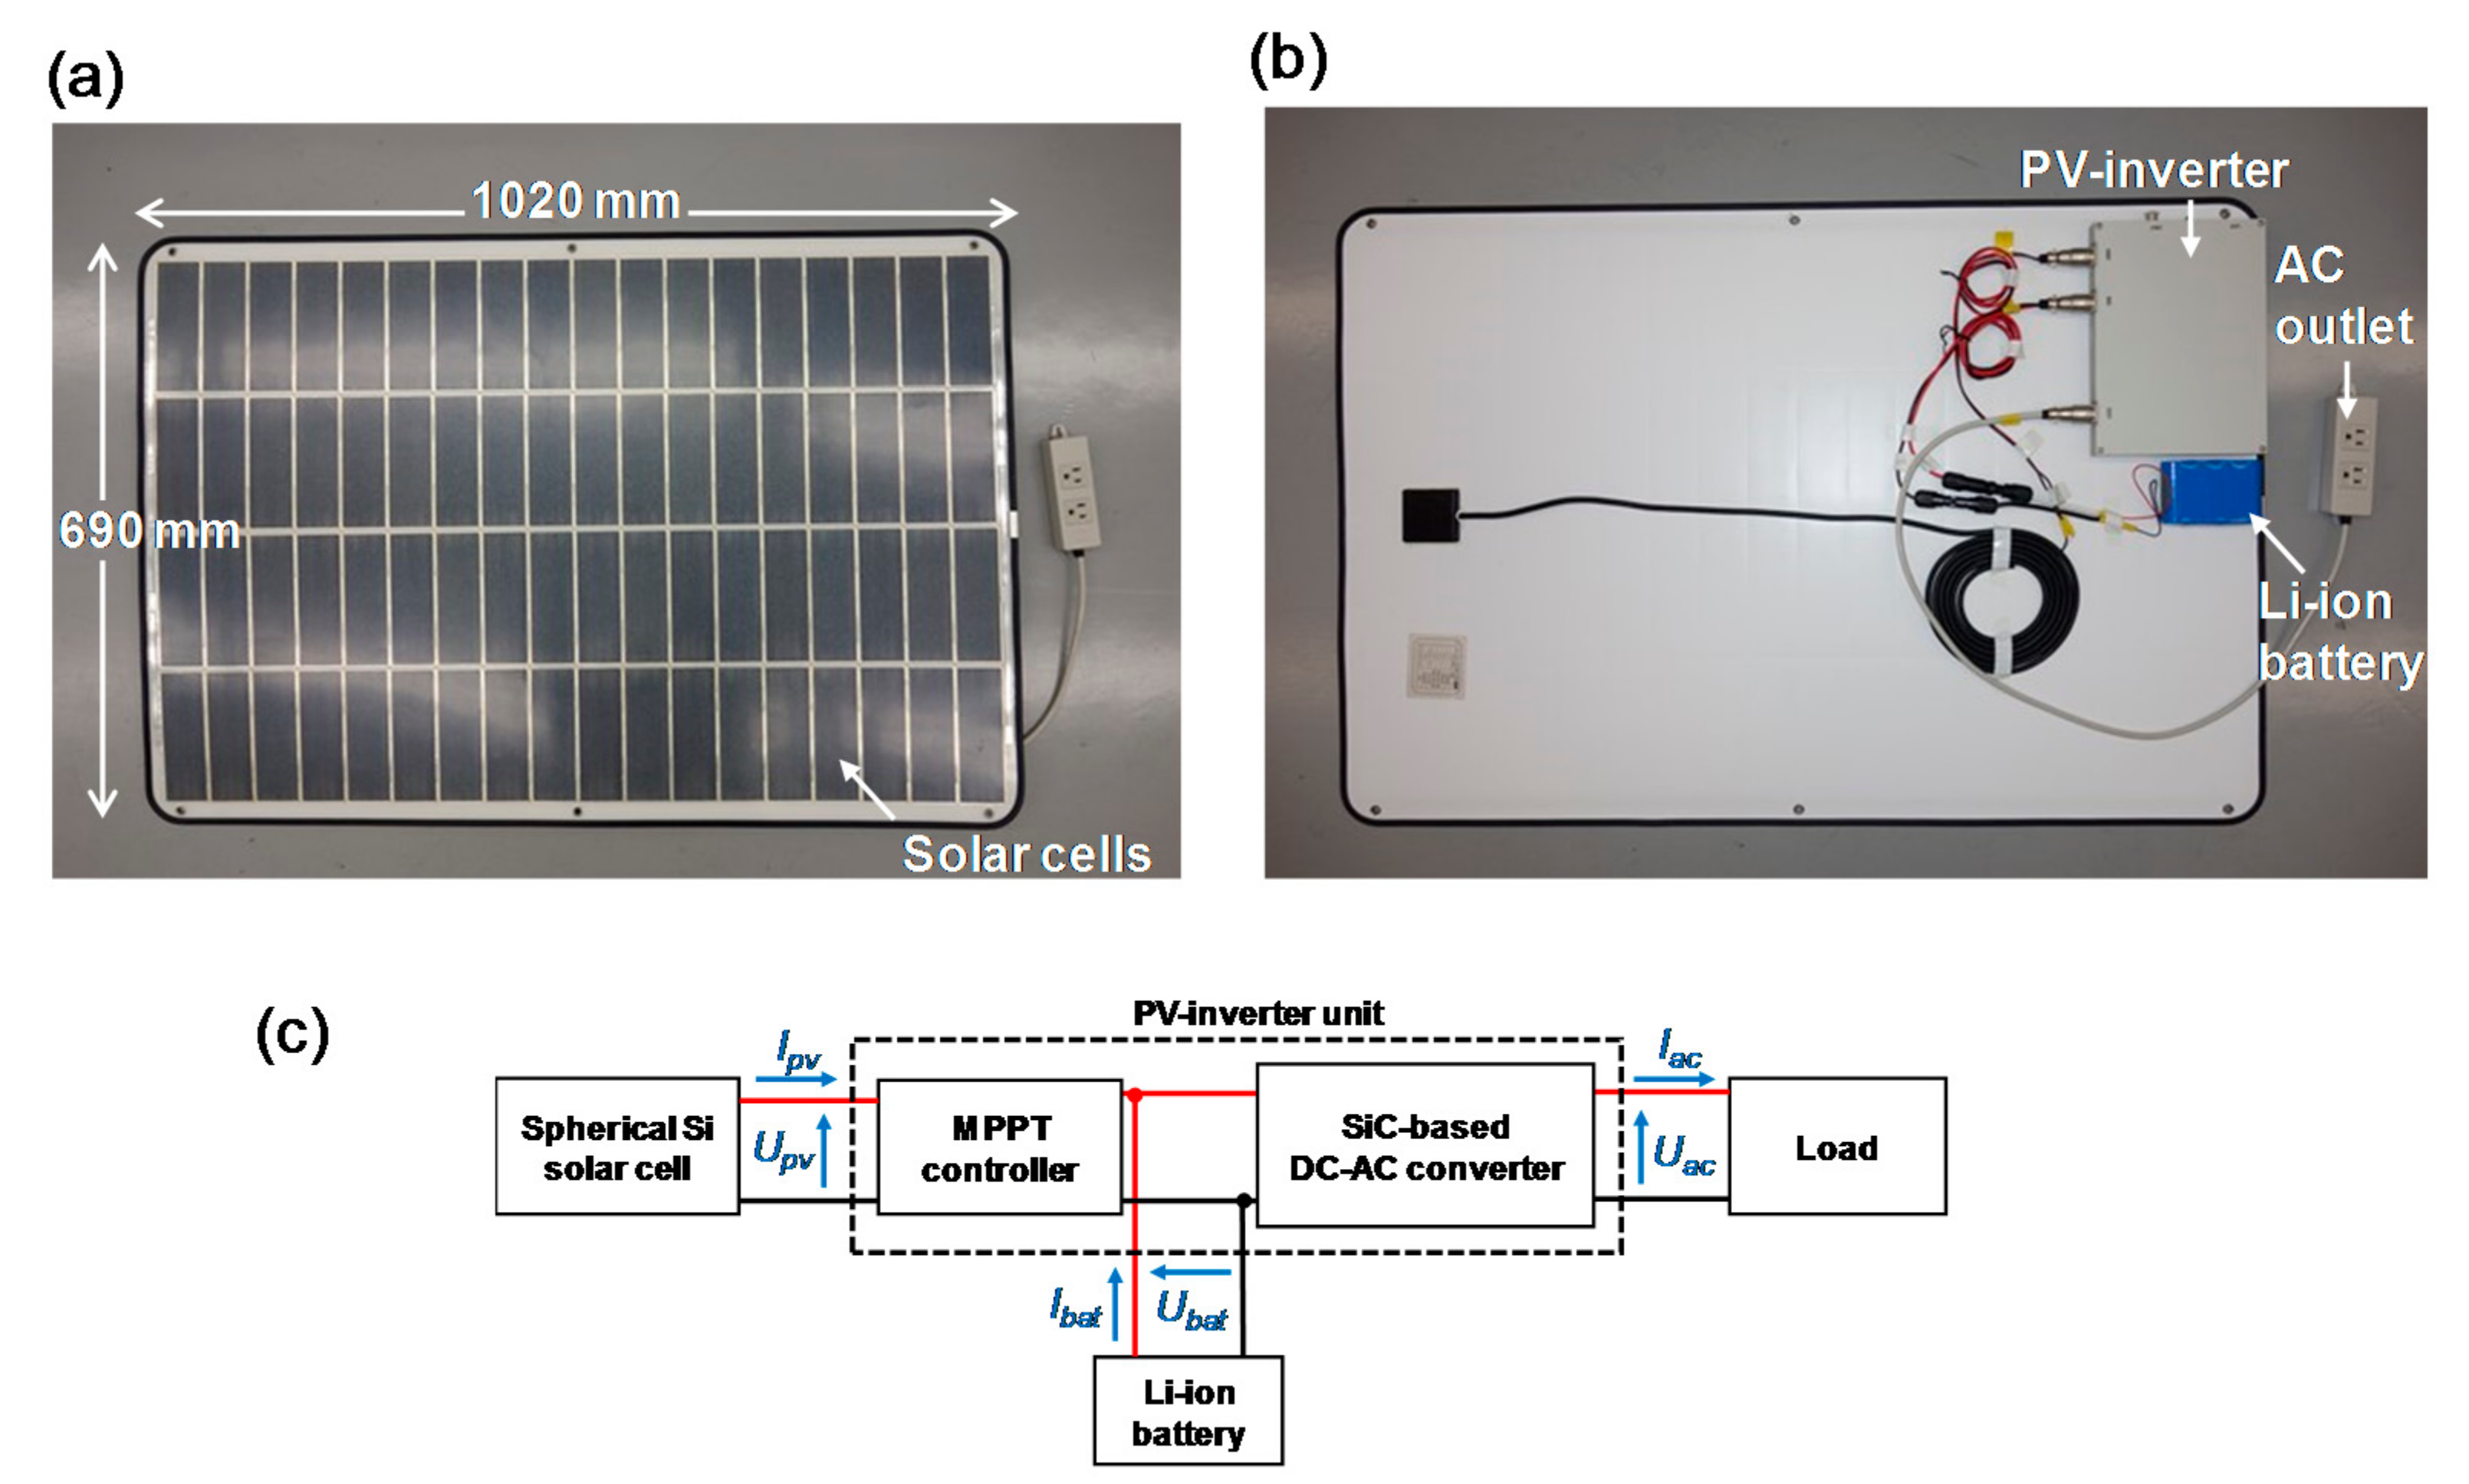
Figure 1. Photographs from (a) the top and (b) the bottom of the developed photovoltaic (PV) power generation system and (c) its block diagram.
Technologies 05 00018 g001
Figure 2. (a) Conversion efficiency of the maximum power point tracking (MPPT) controller vs. DC power and (b) conversion efficiency of the DC-AC converter vs. AC power. Results with (solid) and without (dotted) the correction of cable losses are shown.
Technologies 05 00018 g002
Figure 3. Variation in (a) voltage, (b) current, and (c) power at PV, battery, and AC terminals and (d) conversion efficiencies of MPPT controller, DC-AC converter, and total circuits. In the beginning of the measurement, the storage battery was almost exhausted. The load power was 10 W.
Technologies 05 00018 g003
Figure 4. Variation in (a) the solar radiation power and (b) the temperature and humidity during the measurements shown in Figure 3.
Technologies 05 00018 g004
Figure 5. (a) Correlation between the PV output power and the solar radiation power and (b) that between the battery output power and the solar radiation power. These data were collected from the measured data in Figure 3 and Figure 4.
Technologies 05 00018 g005
Figure 6. Variation in (a) voltage, (b) current, and (c) power at PV, battery, and AC terminals and (d) conversion efficiencies of MPPT controller, DC-AC converter, and total circuits. In the beginning of the measurement, the storage battery was fully charged. The load power was 30 W.
Technologies 05 00018 g006
Figure 7. Variation in (a) the solar radiation power and (b) the temperature and humidity during the measurements shown in Figure 6.
Technologies 05 00018 g007
Figure 8. (a) Correlation between the PV output power and the solar radiation power and (b) that between the battery output power and the solar radiation power. These data were collected from the measured data in Figure 6 and Figure 7.
Technologies 05 00018 g008
Figure 9. Variation in the voltage at the battery terminal measured for different load power values. In these measurements, the solar cell was inactive.
Technologies 05 00018 g009
Figure 10. Calculated battery duration time versus the AC output power with the battery capacity ranging from 3.3 to 10 Ah (Lines). Measured battery duration time with the battery capacity of 3.3 Ah (squares). In these calculations and measurements, the solar cell was inactive.
Technologies 05 00018 g010
Table 1. Size and weight of the individual units and total system.
UnitSize (mm3)Weight (kg)
Inverter250 × 180 × 281.3
Solar cell1020 × 690 × 52.2
Battery110 × 66 × 280.4
Total system---4.3 *
* The total system includes power cables and AC outlets.