Article

Evaluating Traffic Conflicts and Congestion Based on Right-Turning Driving Behaviour Using Evasive Actions Driven PET via UAV Video Analysis: A Case Study of Uncontrolled Heterogeneous T-Intersection in India


1
School of Engineering and Applied Science, Ahmedabad University, Ahmedabad 380009, Gujarat, India
2
Department of Computing, Imperial College London, London SW7 2AZ, UK
3
Road Safety Automotive Management, Ahmedabad 380052, Gujarat, India
*
Author to whom correspondence should be addressed.
Technologies 2026, 14(7), 442; https://doi.org/10.3390/technologies14070442

Submission received: 9 June 2026 / Revised: 9 July 2026 / Accepted: 15 July 2026 / Published: 18 July 2026

Abstract

Adherence to right-of-way (RoW) rules at uncontrolled T-intersections helps avoid accidents and alleviate congestion. In non-uniform traffic, right-turning behaviour can be characterised by distinct driving traits, such as non-compliance (failure to yield), a nonchalant attitude, and competitive behaviour. This paper presents a cost-effective computer vision framework using UAV videos to analyse right-turning behaviour and assess safety and operational performance (congestion) at uncontrolled T-intersections. A conflict cone of a vehicle is defined to automatically detect a right-of-way violation (RoWV) and yield. The impact of driving-related parameters and external traffic on non-compliant behaviour is analysed using the Tweedie generalised linear model. This paper proposes an aggregated surrogate safety measure, condPET, and a novel parameter, congValue, to identify critical conflicts and congestion due to non-compliant behaviour. Lateral evasive action is used to detect a constrained path because of nonchalant and competitive behaviours. The results indicate that only 7.50% of vehicles yielded, 6.25% of conflicts were critical (compared to 38.94% using PET alone and 11.05% using CS), and localised congestion occurred for 44.00% of the total video time. Overall, 45.34% of vehicles created a constrained path, and 26.00% committed RoW violations, causing congestion and increasing the average travel time on major roads by 2.0 and 3.5 times, respectively. Our methodology enables computer vision-based automated assessments of both road traffic safety and operational performance at uncontrolled T-intersections under non-uniform traffic conditions, providing a valuable tool for road-traffic-monitoring systems.

1. Introduction

With rapid economic growth in developing, densely populated countries such as India, vehicle density has doubled over the last decade [1]. However, the road infrastructure has not been proportionally scaled to support increasing road traffic [1,2]. In addition, non-compliant (due to inadequate knowledge of driving regulations), nonchalant attitude towards other road users, and competitive and non-uniform (caused by lane indiscipline and heterogeneous traffic conditions) behaviours of drivers in such countries increase the risk of road accidents. More than 4.87 lakh accidents were reported according to the road accident report of the Indian Ministry of Road Transport and Highway (MoRTH), 2024 [1], in which rear-end (hit-from-back), head-on, hit-from-side, and angled (hit-and-run) collisions contributed 23.40%, 17.30%, 15.80%, and 14.10% in the total road accidents, respectively. Moreover, the highest number of road accidents occurred at T-intersections and uncontrolled crossings, accounting for 8.00% and 13.90% of the total road accidents, respectively [1], and warranting further investigation at such intersections.
In India, not all T-intersections are equipped with traffic control systems and may lack proper road markings [3,4]; even when systems and markings are present, drivers may not consistently follow traffic rules (non-compliant driving behaviour) or safe driving practices [2]. Moreover, past research shows that drivers often compete for time and space (competitive driving behaviour), have reduced risk perception [5], and disregard other vehicles (nonchalant attitude) on the roads [3], which results in non-uniform (chaotic) driving conditions and increases unsafe interactions (decreases safe distance [2]) between vehicles in longitudinal and lateral directions.
For developing countries, researchers use traffic conflict techniques (TCTs) as a proactive surrogate measure to assess road traffic safety rather than relying on historical crash records because of under-reporting and inconsistent recording of reported road accidents [6,7]; the post-encroachment time (PET) is a widely used time-based surrogate safety measure (SSM) for assessing crossing conflicts. However, on its own, it measures the likelihood of a collision but not its severity. In non-uniform (lane indiscipline and heterogeneous) traffic conditions, such as in India and China, frequent close interactions are common due to their driving cultures; therefore, relying solely on time-based SSM is insufficient for identifying critical conflicts [8]. Various researchers [8,9] have used yaw rate and jerk profiles [10] to detect evasive actions in lateral (intentionally changing lanes) and longitudinal (sudden braking) directions under non-uniform traffic conditions mainly in China, and have accurately identified critical conflicts. Evasive actions are the driver’s actions or manoeuvres to decelerate or lane-change to avoid a collision with the lead vehicle. Meanwhile, the existing TCT-based analyses of Indian road traffic have significantly neglected drivers’ evasive actions when evaluating conflicts [2,7]. Therefore, some researchers suggested developing an aggregated conflict indicator that combines time-based and evasive action-based SSMs to reflect traffic safety under non-uniform traffic conditions [8,9].
In left-hand traffic (i.e., right-hand drive) countries, such as India, right-turning drivers are at higher risk of accidents because of right-of-way (priority) rules and possible conflicts with other vehicles. Right-turning drivers must give way to the vehicles on the major road and should enter the major road only when the way ahead is clear [11,12]. Also, cutting corners is a prevalent problem on Indian roads during right turns [13]; many drivers fail to follow the proper procedure and cut corners, posing a threat to traffic safety.
Right-of-Way Violations (failed to yield) (RoWVs) at uncontrolled T-intersections under non-uniform driving conditions could lead to various collisions, such as angled (crossing conflicts), head-on, and rear-end collisions [14]. Further, the bursty and intermittent RoWVs could create a bottleneck for the conflicting-through vehicles (CTVs) on major roads. Therefore, RoWVs could result in either conflicts or localised congestion. Reviewing the existing studies on Indian road traffic reveals that researchers have mainly focused on TCT-based safety assessments and have not considered evasive actions executed by CTVs while identifying critical conflicts.
Though right-turning vehicles (RTVs) yield to traffic on major roads, they often fail to yield fully, creating a constrained path for CTVs due to nonchalant, impatient, and competitive driving behaviour. Such behaviours of RTVs could also create a bottleneck for the CTVs on major roads and lead to localised congestion.
Thus, it is essential to study the right-turning behaviour at uncontrolled T-intersections in the context of conflict and congestion, as conflicts can lead to accidents and congestion can degrade operational performance (i.e, increased travel time). Right-turning behaviour under non-uniform traffic conditions can be evaluated based on non-compliant, nonchalant, and competitive driving behaviours, and their impacts (conflict and congestion) on traffic on major roads.
A traffic conflict is defined as “a situation involving one or more vehicles where there is imminent danger of a collision if the vehicle (or another road user) movement continues unchanged”. Meanwhile, a critical conflict is defined as “a situation where two vehicles are approaching each other in such a manner that demands evasive actions to avoid a collision” [15,16].
For TCT-based safety assessments, a literature review [7] reveals that many researchers have used semi-automatic tools such as Kinovea, T-analyst, and the AVS video editor to estimate the parameters (e.g., traffic flow, speed of the vehicles, lateral movement) and SSMs (e.g., PET), which require human efforts and are a time-consuming process. Additionally, some researchers used DataFromSky viewer software (paid services) to estimate such data [17,18] from traffic videos. Recent studies have explored the potential applications of computer vision (CV) techniques and UAVs in road traffic monitoring systems (e.g., U-UTM [19] and TAU [20]), especially for tasks such as automating the estimation [19,20] of road traffic parameters [3] (e.g., traffic violations, the speed of vehicles), the estimation of SSMs [2] (e.g., WSD, WRA), and driving behaviour modelling [21]. Also, various UAV-captured vehicle trajectory datasets, such as highD [22], CitySim [23], and TJRD-TS [24], are publicly available, but they primarily depict uniform traffic conditions prevalent in developed nations rather than non-uniform, dense traffic conditions. The authors of [25] used the CitySim vehicle trajectory dataset captured using UAVs and extracted important variables from it. Then, using TTC and Delta-V SSMs, the conflict likelihood and its severity were assessed.
Hence, in light of the present studies, this paper presents a case study on evaluating right-turning behaviour at an uncontrolled T-intersection based on various driving behaviours (i.e., non-compliant, nonchalant, and competitive) and their impact (conflict and congestion) on the traffic on major roads, with the help of CV techniques and UAV videos. To the best of the authors’ knowledge, no prior studies have proposed such methodology in the context of Indian road traffic. The main contributions of this paper (along with the results of this case study) are as follows:
  • Developed an automated computer vision (CV)- and UAV-based methodology for evaluating right-turning behaviour under non-uniform traffic conditions, characterising non-compliant, nonchalant, impatient, and competitive driving behaviours.
    Only 7.50% of RTVs respected the right-of-way of CTVs, 26.00% of RTVs were involved in bursty and intermittent RoWVs, and 45.34% of RTVs forced CTVs to follow a constrained path.
  • Defined a “conflict cone” (a zone) of a vehicle to automatically detect RoWV and yield under non-uniform traffic conditions.
  • Modelled non-compliant behaviour (RoWVs as count data) using a Tweedie generalised linear model (GLM), and observed that increased traffic on major roads and abnormal turning paths increase RoWVs (all predictors p < 0.01 ).
  • Proposed a novel evasive action-based aggregated SSM, condPET, to identify critical conflicts under non-uniform traffic conditions, which identified 6.25% of interactions as critical conflicts, compared to 38.94% using PET alone and 11.05% using CS.
  • Detected and quantified localised congestion due to bursty and intermittent RoWVs using the novel parameter congValue and clustering, resulting in an average CTV travel time 3.5 times that under unhindered traffic conditions.
  • Detected and quantified localised congestion (constrained paths) caused by nonchalant and competitive driving behaviours using lateral evasive actions and clustering, resulting in an average CTV travel time 2.0 times that under unhindered traffic conditions.

Terms and Definitions

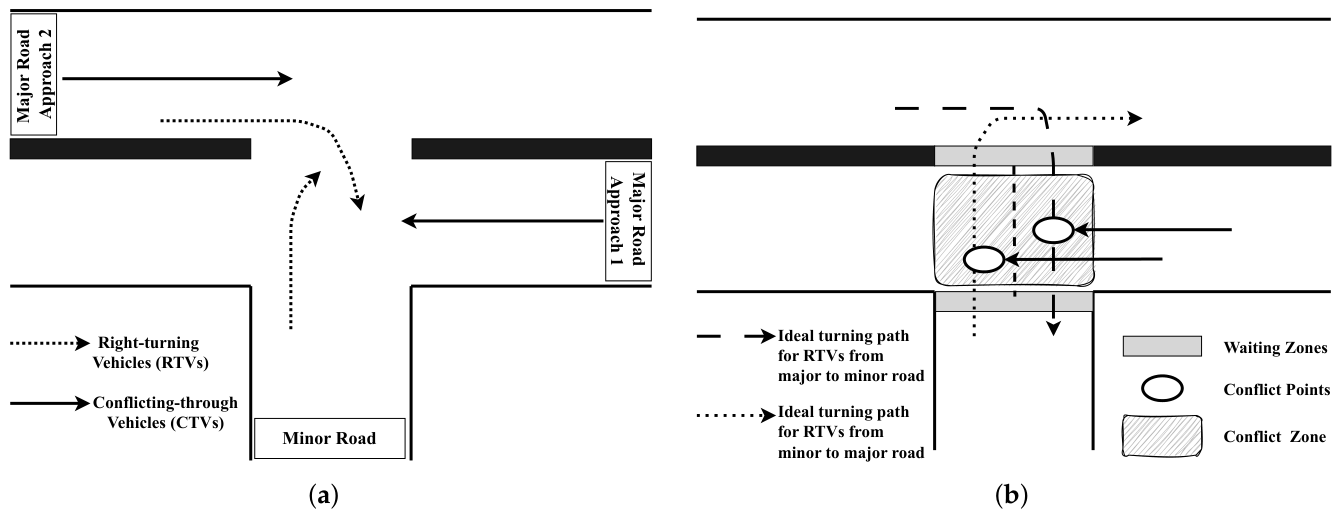
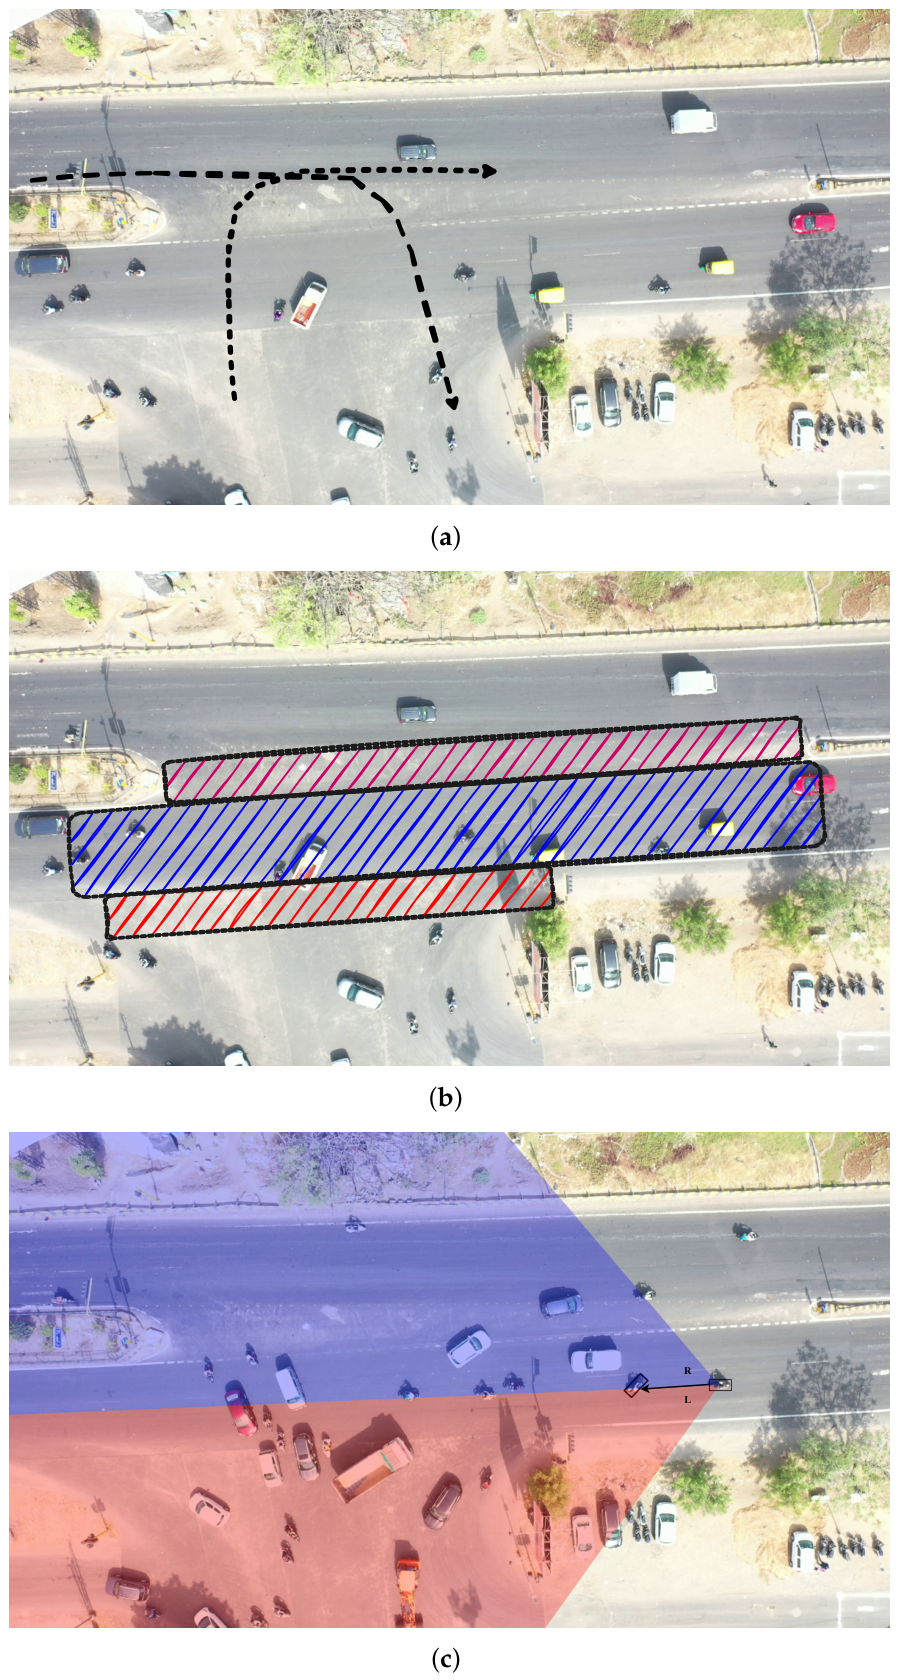
For clarity and ease of reference, the terms and definitions used in this study are explained in Appendix A and Figure 1.

2. Related Work

Researchers have primarily focused on risk assessment associated with right-turning behaviour at uncontrolled T-intersections in Indian road traffic [7,26]. However, the adverse impact, localised congestion, of right-turning behaviour, including nonchalant, competitive, and impatient behaviours, has not been explored yet. Therefore, this paper reviews vision-based research on road traffic safety at uncontrolled T-intersections using traffic conflict techniques. The existing studies can be broadly categorised into two areas: first, non-compliant behaviour modelling using various SSMs and influencing parameters, as shown in Table 1; second, evasive actions-based road traffic safety studies.

2.1. Non-Complaint Behaviour Modelling

Most studies have used either critical conflicts (CCs) as count data or SSM values as continuous data to model non-compliant behaviour at uncontrolled T-intersections in India, examining the impact of various influencing parameters on road traffic safety. Researchers have broadly categorised the various parameters influencing road traffic safety into five categories: vehicle-related (i.e., category, condition), driving-behaviour-related (i.e., waiting time, crossing time, adherence to priority rules, turning path), traffic-related (i.e., traffic volume, traffic composition, non-uniform traffic), road-related (i.e., number of lanes on the major/minor road, presence of central island (CI), intersection area) and environment-related (time of the day), which are used as predictor variables in non-compliant behaviour modelling [38]. For count data, generalised linear models (GLMs) are employed. First, they cumulated the number of CCs and various predictors over a specific period and then modelled them to examine the impact of the predictors (i.e., influencing parameters) on the number of CCs. For continuous SSM data, a generalised extreme value (GEV) distribution is fitted to the extracted SSM data to predict the likelihood of a crash as the probability that SSM is less than zero or lies within a certain range. The fitted GEV model provides the mean location of extreme SSM values, which are then examined across different parameter types to investigate road traffic safety.
Researchers in [27] used PET for modelling and observed that 2Ws have a significant impact on road safety. Also, they classified critical conflicts using PET and the CTV’s speed, which was then validated against field-recorded accident data. In [28], it was observed that varying levels (one-to-one vs. one-to-many) of vehicle interactions (i.e., queueing) impact road safety differently; the probability of a crash decreases with an increase in the number of RTVs. Speed bumps at intersections help improve road safety, as observed in [37]; the VISSIM 7.0 simulation model was used to generate extensive PET data under varying non-uniform traffic conditions for sensitivity analysis.
Also, researchers conducted studies to determine appropriate thresholds for SSMs to identify CCs. In [32], using the frequency distribution of CCs based on various PET values and crash data, a PET value less than 2 s is identified as a threshold across all vehicle categories. A study in [33] employed a support vector machine to derive PET threshold values to identify CC based on different RTV speeds; a conflict is identified as CC if the PET value related to the conflict is found to be more than the threshold defined for that particular speed of RTV. Researchers [34] introduced a braking-distance-based SSM, a critical speed (CS), to estimate the severity of a resulting collision, as PET alone cannot measure conflict severity. The critical speed of each PET value is calculated using the stopping sight distance. If the speed of a CTV exceeds the corresponding CS, the conflict is identified as a CC. Similarly, in [36], a critical relative speed (CRS) was proposed to measure severity, defined as the speed difference between RTV and CTV.
Researchers [29] modelled CCs (PET values between −1 and 1 s) using GLM and observed that the CCs with negative PET values are more severe than positive PET values. In [30], researchers found that 2Ws and 3Ws were the most vulnerable road users at T-intersections. In [31], the number of CCs seen increases as traffic volume and proportion of 2Ws and 3Ws increase. Also, a central island at a T-intersection improves road safety, and more CCs were observed during peak hours. In [35], critical speed (CS) is also employed along with PET to model CCs, and TTC was employed for rear-end conflicts. They observed that a TTC value below 1.15 s is appropriate for identifying rear-end conflicts. Researchers in [38] used TTC to identify CCs and found that the number of CCs decreases as the waiting time of RTVs increases.
The aforementioned studies captured traffic videos using a camera mounted on a high-rise building and then employed a semi-automatic method to estimate PET and the CTV’s speed from the videos. They first divided the conflict area into equally sized square grids of 3.5 or 2.5 m. The smaller the grid size, the more precise the physical location of the conflict is, and the greater the effort required to estimate the parameters. They created such grids in software such as AutoCAD and then overlaid them on the video using Corel VideoStudio. Finally, a small team of skilled persons (to reduce human error) plays the video using a tool like AVS software at 25 or 30 fps (frames per second) and records the timings ( T 1 and T 2 ) related to each crossing conflict between RTV and CTV. PET values can be positive or negative, depending on whether the RTV’s departure precedes the CTV’s arrival at the conflict zone (grid cell). Further, to estimate the CTV’s speed, the time it takes to traverse the grids is measured, and the speed is then calculated using a known distance within the grid area.

2.2. Evasive Actions-Based Studies

Some researchers have demonstrated the potential of evasive action-based SSMs for identifying critical conflicts in countries other than India. In [8], the yaw rate, jerk, and deceleration are shown to be more appropriate for identifying CCs than TTC, whereas in [9], the yaw rate is shown to be a better SSM than jerk and TTC for powered 2Ws. However, both studies [8,9] highlighted the need for an aggregated SSM including evasive actions and proximity-based SSMs. In [10], jerk was used to identify CCs and suggested class-wise jerk behaviour analysis. Deviation in driving paths with respect to a set of unhindered vehicle trajectories can also be used to identify evasive actions, but using additional SSM, such as speed, is advised to identify CCs, as concluded in [39]. In the Indian context, researchers in [40] have used a shift in lateral position and vehicle speed to classify yield behaviour on an undivided highway.
The shortcomings of the existing research are summarised below in Table 1:
  • SSMs (e.g., PET and CS) are estimated using semi-automatic tools that require human effort, making the process time-consuming.
  • Not considered evasive actions executed by CTVs during intersection with RTVs while identifying critical conflicts.
    The development of an aggregated SSM that integrates evasive action-based and other SSMs for identifying critical conflicts remains unexplored [8,9].
    Class-wise evasive actions-based study has not been investigated [10].
  • Limited focus on the pre-crash behaviour (e.g., waiting time, queuing), crossing time, and abnormal turning paths of RTVs while assessing road traffic safety.
  • The alternate side of (bursty and intermittent) right-of-way violations, a bottleneck, has not been explored yet.
  • Have not explored the effect of nonchalant (towards CTVs) and competitive driving behaviours of RTVs on the CTVs, a constrained path on the major road.
  • Automated road traffic analysis using UAVs and CV techniques in developing countries has been less explored.
Hence, this paper proposes a novel CV-based methodology (with a case study) to evaluate the right-turning behaviour at an uncontrolled T-intersection. It starts with data collection of road traffic at an uncontrolled T-intersection using a UAV, followed by the estimation of various parameters and SSMs using a zone-based approach and CV techniques. This paper examines non-compliant, nonchalant, and competitive driving behaviours in relation to conflict and congestion. Ultimately, right-turning behaviour is evaluated based on the critical conflicts and congestion level.

3. Methodology

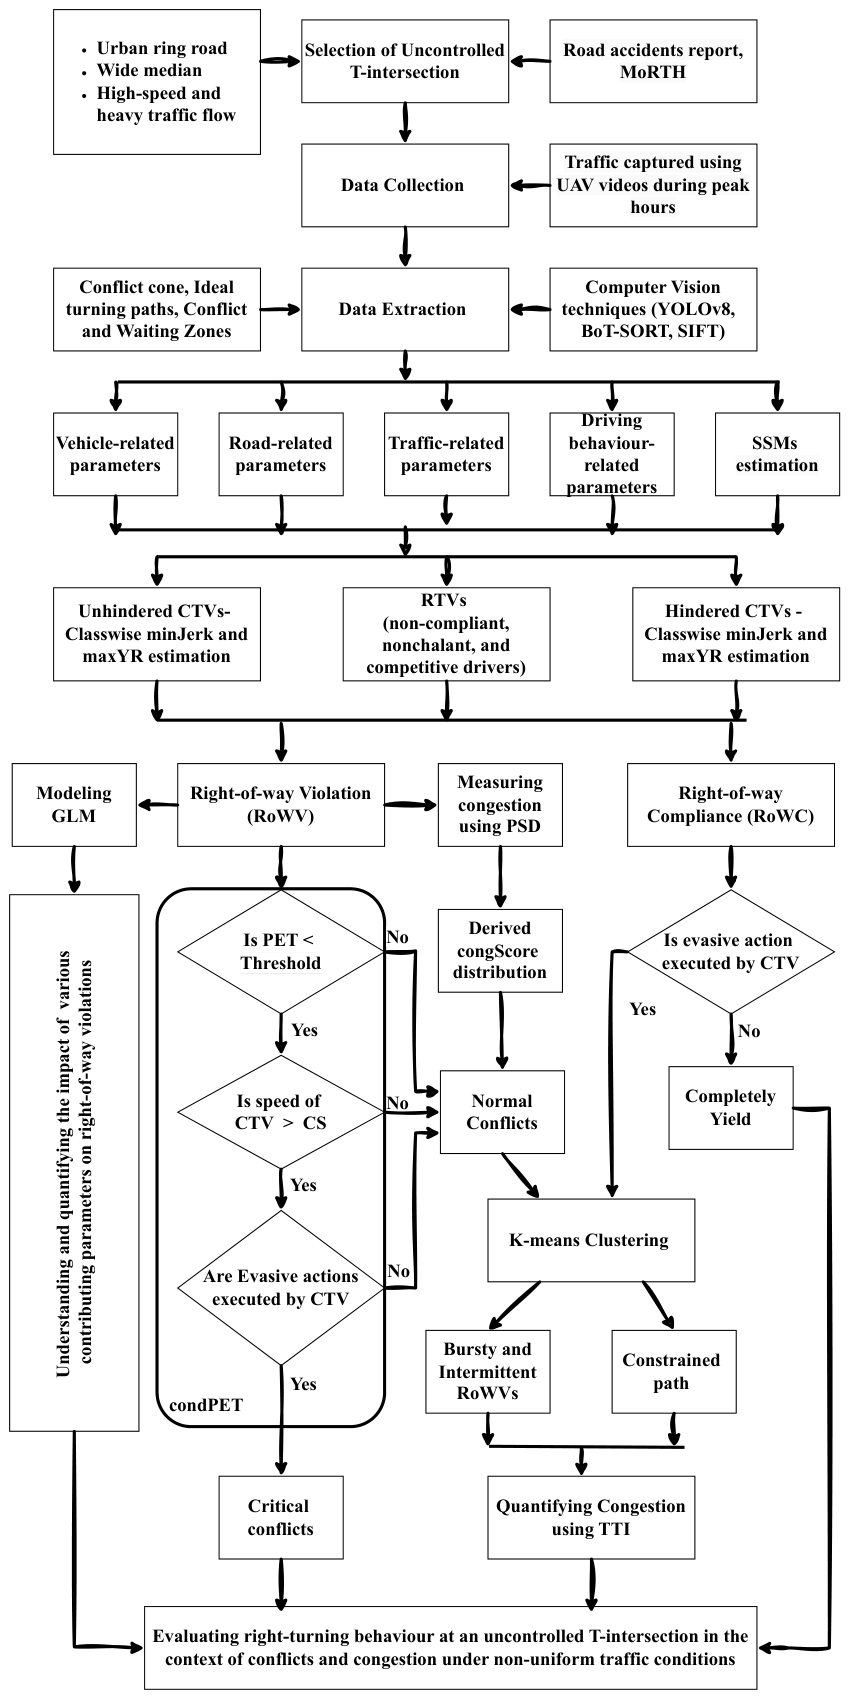
The flowchart of the proposed methodology for evaluating right-turning behaviour is shown in Figure 2, which describes the overall process, including UAV-based data collection, CV-based data extraction, parameter and SSM estimation, the modelling of non-compliant behaviour, studying nonchalant and competitive behaviours, and quantifying conflicts and congestion. This section discusses the various modules of the proposed methodology.

3.1. Selection of Study Site and Data Collection

As per the Road Accidents Report of MoRTH [1], uncontrolled crossings and T-intersections experience the highest number of road accidents. As a result, this study chose an uncontrolled T-intersection on the Sardar Patel (SP) ring road of Ahmedabad City (one of India’s million-plus cities (population-wise) [1]), Gujarat. The SP ring road experiences high traffic and congestion at intersections. The geometric features of this T-intersection are mentioned here: (a) multi-lane major and minor roads, (b) a wide median opening, (c) yield signs are absent, and (d) service roads are present on the side of the minor road; refer to the images shown in Figure 3.
Road traffic videos were captured from 9.00 a.m. to 10.00 a.m. (peak hour) using a UAV at a resolution of 3840 × 2160 pixels, at a flight height of 80 to 85 m (to cover a complete intersection). Traffic videos were recorded at 30 frames per second (FPS) and geometrically corrected to compensate for UAV ego motion (using SIFT [41]). The road surface was dry, and the weather was clear.

3.2. Vehicle Trajectories and Data Extraction

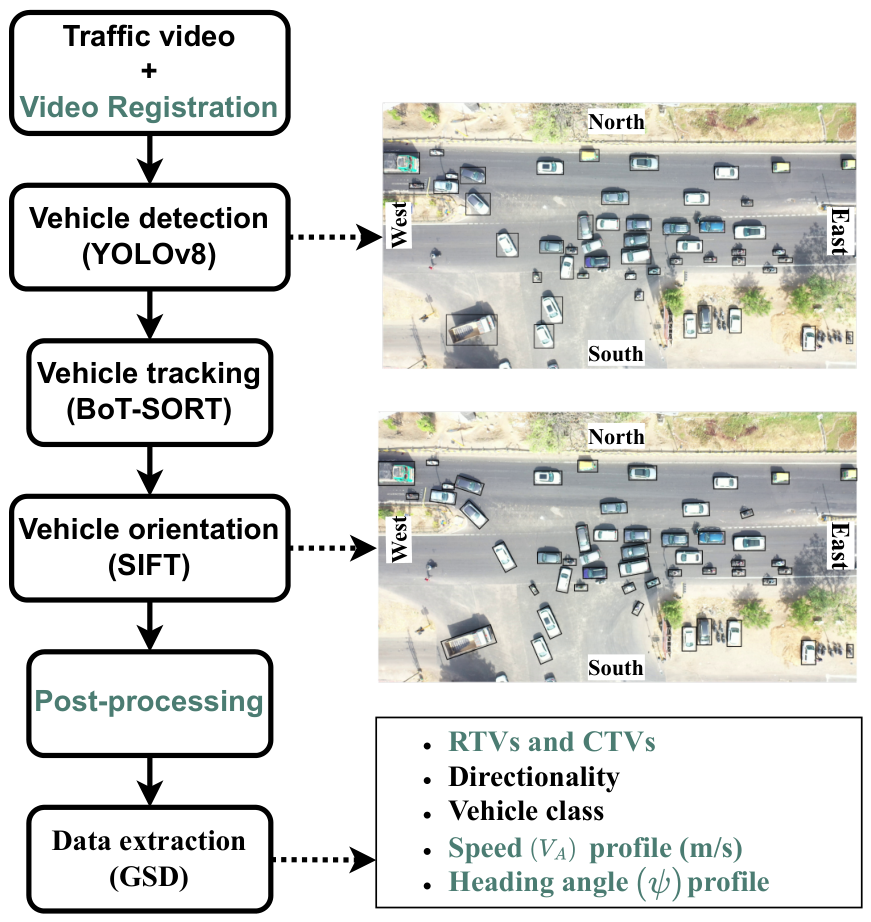
A vehicle’s complete movement (a trajectory) throughout the intersection is important to study for evaluating driving behaviour. To automatically extract vehicle trajectories from a UAV video, our previous studies [2,3,19] employed various CV techniques. This paper extends that procedure (by introducing a post-processing module) and improves it to accurately extract vehicles’ trajectories and other data; see Figure 3.
Two preliminary tasks are involved in any automated CV-based traffic analysis: vehicle detection and tracking. This methodology uses the YOLOv8 model for vehicle detection, the BoT-SORT algorithm for vehicle tracking, and the SIFT feature extractor for vehicle orientation measurement (vehicle heading angle and direction of travel). The YOLOv8 model was developed by the Ultralytics Company in 2023, and its implementation supports the BoT-SORT tracking algorithm. The YOLO detection model provides a rectangular bounding box (BB) that encloses a vehicle. After extracting the vehicles’ trajectories, the SIFT feature extractor is used to capture the heading angle of the vehicle based on the difference (in consecutive frames) between the centroids of a detected vehicle (a rectangle BB). We use the VisDrone 2019 dataset [42] to train YOLOv8. This dataset contains images of two-wheelers, buses, cars, three-wheelers, and vans; class-wise distribution is shown in [3]. We chose the YOLOv8x model and set the image size to 1280 × 1280 for model training. We enable mosaic data augmentation and other transformations, such as scaling and translation, for better training. The YOLO model is trained on NVIDIA Quadro RTX 6000/8000 GPU and achieves 60% mAP@0.5. We set various hyperparameters of the BoT-SORT algorithm, such as track _ high _ thresh = 0.25 , track _ low _ thresh = 0.1 , new _ track _ thresh = 0.25 , track _ buffer = 30 , match _ thresh = 0.8 , and gmc _ method = s p a r s e O p t F l o w . These modules have been described in detail in our previous study [2].
With the existing procedure [2], it is difficult to accurately determine the vehicle’s heading angle and direction when detections are missing, or the vehicle is momentarily stopped. Hence, this paper develops a post-processing module that reiterates each trajectory and interpolates missing values. Further, it identifies valid trajectories (starting from entry and ending in exit) and classifies them into RTVs (from major to minor roads and from minor to major roads) and CTVs (from approach 1 and 2) based on vehicle directionality, as shown in Figure 1a.
In the end, the vehicle’s speed and heading angle profiles are estimated using the centroid difference between two consecutive frames and the Ground Sample Distance (GSD) (derived in our previous study [19]). The GSD is the mapping between pixel and actual ground distance. Also, this methodology uses 1D Kalman filters to smooth continuous values (e.g., vehicle speed and heading angle) and the Boyer–Moore voting algorithm to smooth categorical values (e.g., vehicle class and travel direction). The vehicle trajectory numbers (RTVs and CTVs) help uniquely identify vehicles in further analysis.

3.3. Right-of-Way Violation and Yield Detection

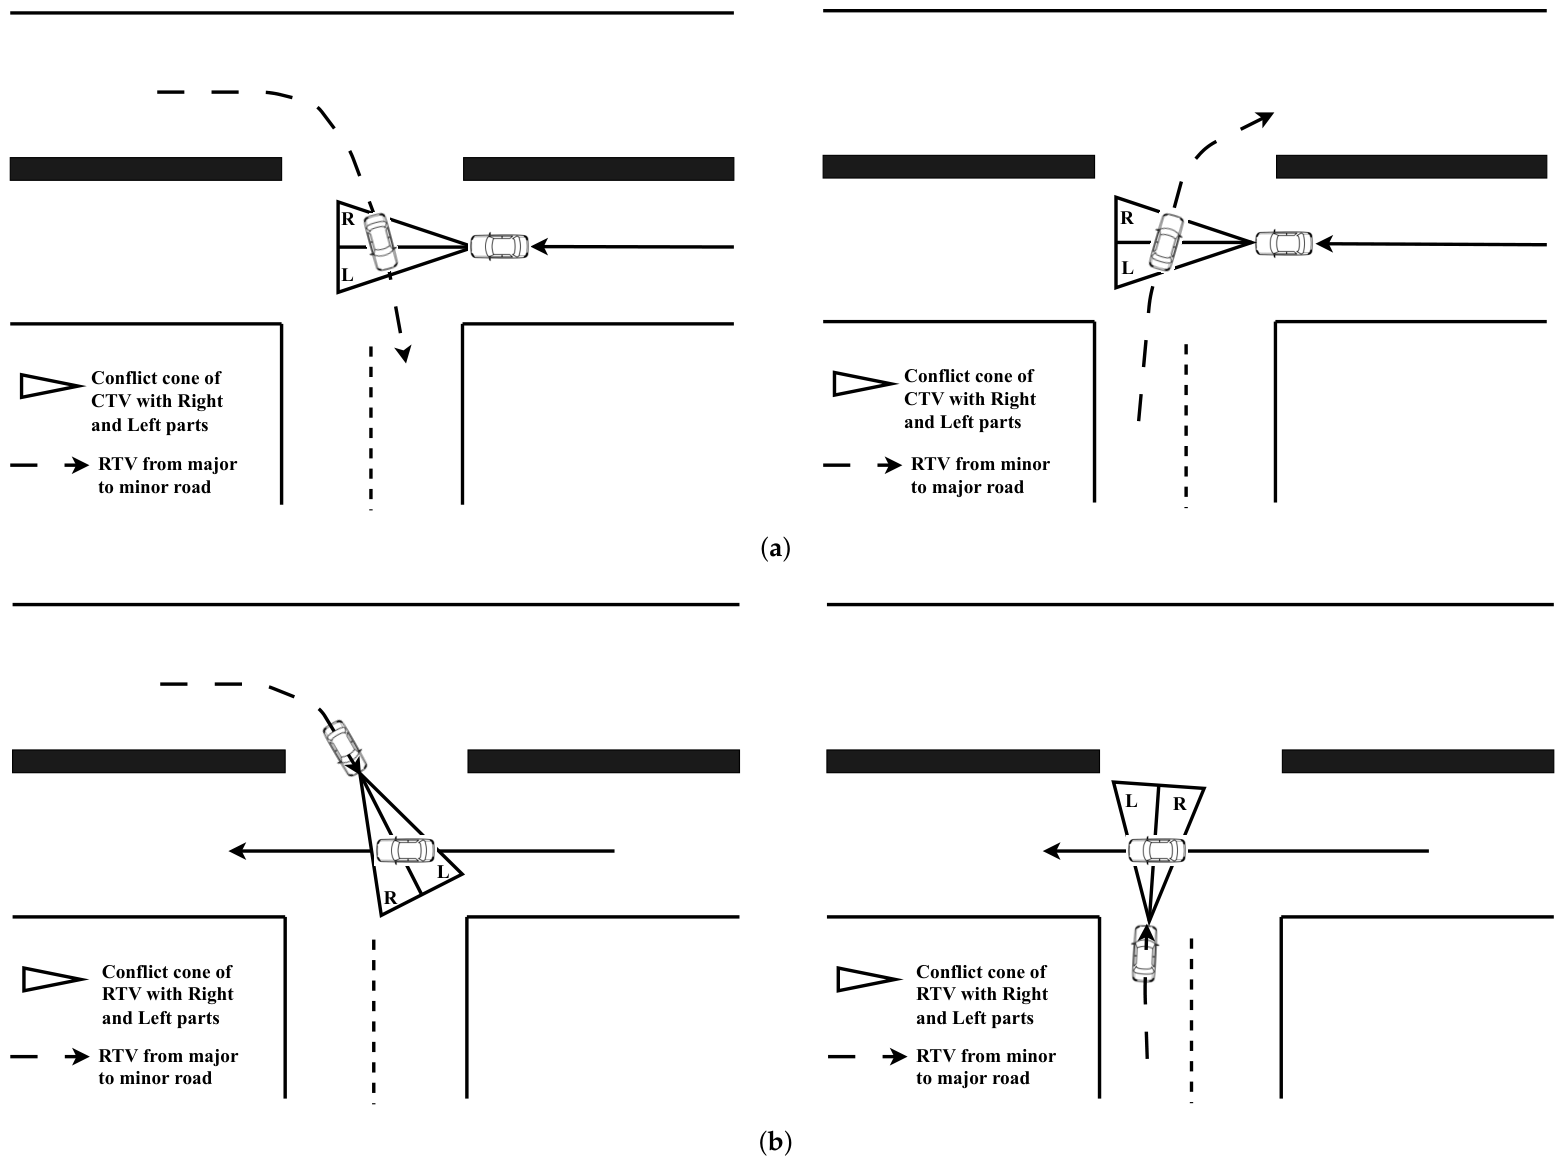
Under non-uniform traffic conditions, it is challenging to automatically detect a RoWV or a complete yield (also referred to as a ‘Give Way’ in India). Hence, this paper defines a conflict cone (a zone for CV-based study) for a vehicle, inspired by the driver’s field of view, to detect RoWV and yield, as shown in Figure 4.
The conflict cone of a vehicle is conceptually similar to a driver’s field of view. However, the angle is fixed to 120° rather than varying according to the vehicle’s speed [43,44], considering the speed of vehicles approaching a high-density T-intersection. The length of the conflict cone is extended up to the road scene (image boundaries). The conflict cone differs from the field of view, as it is unaffected by any obstruction. The sole purpose of defining a conflict cone in this CV-based study is to automate the detection of RoWV and yield under non-uniform traffic conditions, and count (quantify) the right-of-way violations irrespective of the obstructed/unobstructed field of view. Further, this will also help in the automatic detection of localised congestion due to bursty and intermittent RoWVs. This paper defines a conflict cone for each vehicle and divides the cone into “Right” (R) and “Left” (L) parts according to the direction of the vehicle, as shown in Figure 4.
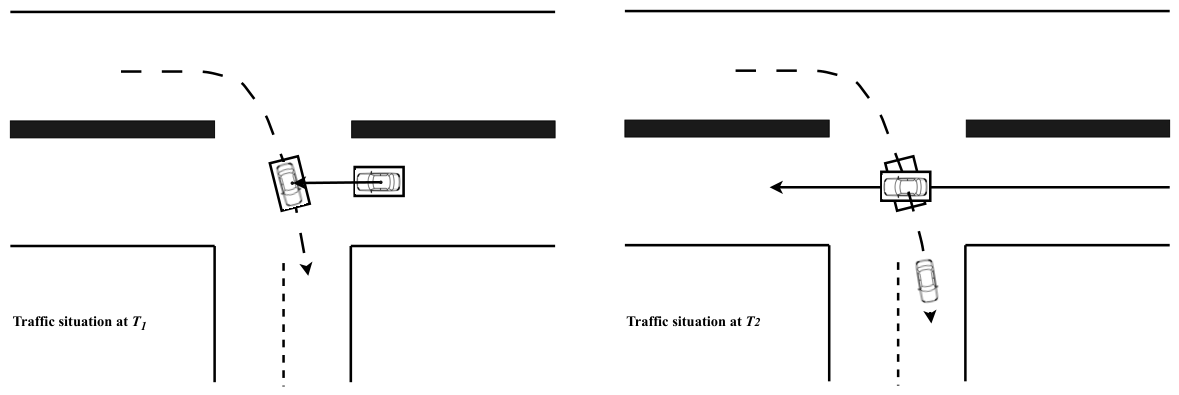
The RoWV or yield detection depends on who (RTV or CTV) passes the conflict zone first in the presence of another vehicle (CTV or RTV), as shown in Figure 4. This paper develops an algorithm to automatically detect RoWV and yield based on who passes the conflict zone first, using the conflict cone and the vehicle’s BB. The steps are outlined below:
1.
Each pair of RTV and CTV (irrespective of the clear or obstructed field of view) is considered for RoWV and yield detection.
2.
During the journey of the vehicle (RTV or CTV), the overlap between the conflict cone (of RTV or CTV), conflict zone, and bounding box (of CTV or RTV) is measured using Intersection over Union (IoU) metric and sequence of the interaction (in terms of “R” and “L”) is derived for both the vehicles (RTV and CTV). Here, the conflict zone is also used to eliminate any false-positive interactions.
3.
If the sequence of the interaction of the RTV (if it passes first) with the CTV is “R…RL…L” (refer to Figure 4a (left)) or “L…LR…R” (refer to Figure 4a (right)), then it is considered as RoWV. If it is “L…LR…R” (refer to Figure 4b (left)) or “R…RL…L” (refer to Figure 4b (right)) for the CTV (if it passes first) with the RTV, then it is considered as a yield.
4.
Only a single transition (frame number) from “R” to “L” or “L” to “R” (in case of RoWV) or “L” to “R” or “R” to “L” (in case of yield) is recorded as a frame of RoWV or yield; otherwise, it is discarded from further analysis.
5.
The RTV could have multiple interactions with CTVs (could be RoWV or yield) under non-uniform traffic conditions. So, record all the frames of RoWV or yield for the RTV with the different CTVs.
In the end, all RTVs and CTVs are segregated into two groups according to the adherence to the priority rules: one group in which RTVs (RoWV-RTVs) violate the right-of-way of other vehicles (RoWV-CTVs) and the second group in which RTVs (RoWC-RTVs) comply with right-of-way rules and yield to other vehicles (RoWC-CTVs).
In Figure 4, an illustration of RoWV and yield detection for the RTVs and CTVs (from approach 1) is given. Also, refer to the Figure 5c, for real implementation of the conflict cone.

3.4. Parameters and SSMs Estimation

The vehicle-related (i.e., category), driving behaviour-related (i.e., waiting time, crossing time, adherence to priority rules, turning path), and traffic-related (i.e., non-uniform traffic) parameters influence the road traffic safety and hence play an important role in evaluating right-turning behaviour. The driving behaviour-related parameters help understand an RTV’s driving style [2], whereas the vehicle-related and traffic-related parameters help describe surrounding traffic conditions. Hence, this paper employs a zone-based approach to measure the waiting time (before entering the conflict zone) and crossing time (time to traverse the conflict zone) of an RTV. Additionally, this paper measures the error (turn error) in the turning path of an RTV with respect to the ideal turning path.
As shown in Figure 1b, this paper defines waiting zones (at the median and the entry/exit of the minor road) and a conflict zone (see Figure 5b). These zones help measure the waiting time and crossing time of RTVs. The overlap between the BB of an RTV and the waiting zone, depending on the RTV’s directionality, is measured using the IoU metric. Then, the number of frames with nonzero overlap is counted to estimate the waiting time of an RTV using video recording speed ( FPS ), as shown in Equation (1). Similarly, the nonzero overlap between the BB of an RTV and the conflict zone is counted to estimate the crossing time of an RTV.
T RTV = 1 FPS f = 1 F journey δ ( f ) , δ ( f ) = 1 , IoU ( B B RTV ( f ) , Zone ) > 0 , 0 , otherwise .
Cutting corners is a prevalent problem on Indian roads during right turns due to inadequate knowledge of driving regulations and competitive driving behaviour, which increases road crashes [12]. According to the standard practices [13], an RTV should first move to the centre of the major/minor road and then drive to the right side to enter the minor/major road, as shown in Figure 1b and Figure 5a. This paper quantifies the turning behaviour of an RTV by measuring its deviation from the ideal turning path using its direction and the root-mean-square error (RMSE). At each frame (f), the difference between the centroid of an RTV ( c ( f ) ) and the nearest point on the ideal path ( p ( f ) ) is calculated, and at the end, the RMSE ( TurnError RTV ) is derived; refer to Equation (2). The higher the RMSE, the higher the deviation from the ideal path.
d ( f ) = c ( f ) p ( f ) 2 , TurnError RTV = 1 F journey f = 1 F journey d ( f ) 2 .
Traffic-related parameters can affect the decisions an RTV makes (e.g., RoWV or yield). Therefore, it is essential to define traffic-related parameters specific to the RTV to understand the turning behaviour. This paper derives interacted CTVs and early-yielded CTVs as novel traffic-related parameters to describe the surrounding traffic conditions for the specific RTV. The first parameter, interacted CTVs, accounts for the total traffic that the RTV both passes and obstructs. It is calculated as the sum of CTVs whose right-of-way was respected (RoWC-CTVs) and those whose right-of-way was violated (RoWV-CTVs) by that RTV. Conceptually, it is similar to the traffic flow, but in reference to the particular RTV. Moreover, it is observed that RTVs exhibit mixed behaviour (alternating between RoWV and yield) under non-uniform traffic conditions because of nonchalant and competitive driving behaviours. Hence, this paper introduces another parameter, early-yielded CTVs, which measures the total traffic yielded by the RTV before committing its first right-of-way violation. It is computed by sorting the yield and RoWV frames specific to the RTV, then counting the number of CTVs it yielded before the first right-of-way violation.
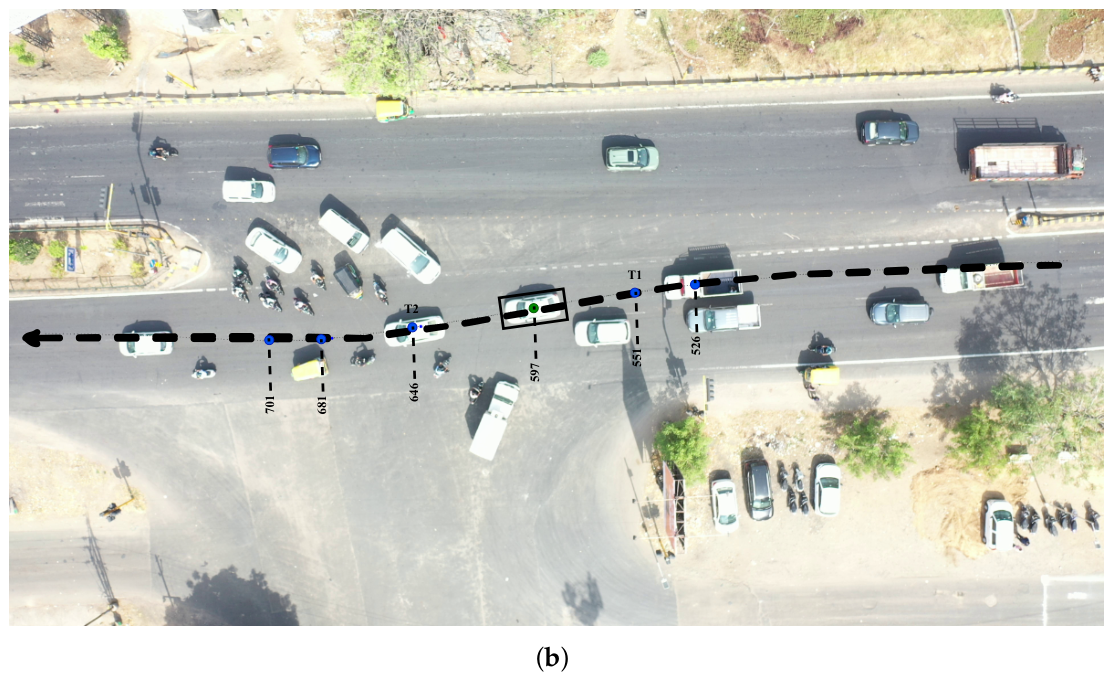
Each right-of-way violation results in a conflict, as shown in Figure 6. To assess the severity of the conflict, various SSMs, such as PET and CS of the CTV, are widely used in existing research. However, there are no fixed locations of the conflict points, and multiple conflicts could be related to an RTV due to non-uniform driving behaviour. Hence, this paper uses the conflict zone and BBs (of RTV and CTV) to automatically estimate the PET value. As shown in Figure 6, when an RTV crosses the conflict zone in the presence of a CTV, the time T 1 (frame of RoWV) and the BB of an RTV are recorded (Figure 6 (left)). Then, time T 2 (Figure 6 (right)) is recorded when the CTV arrives at the exact location (determined by the overlap using IoU). Finally, PET is estimated using the difference between T 2 and T 1 , as shown in Equation (3) below. Moreover, there could be multiple PET values regarding an RTV; therefore, only the lowest PET value is considered for identifying a conflict for that RTV [31]. Further, the average speed of a CTV is estimated over the interval from its arrival time to T 1 . The CS for a CTV related to the specific PET value is calculated using Equation (4). The values of the coefficient of friction (f) and acceleration due to gravity (g) are set to 0.8 and 9.8 m / s 2 according to the Indian road conditions [2].
P E T = T 2 T 1
C S = 2 g f × P E T
While the CS metric, in conjunction with PET, measures the severity of the conflict, it does not account for the evasive actions (such as intentionally changing lanes or speed to avoid collision) executed by CTVs [2,7]. Therefore, it is essential to include evasive actions in TCT-based analysis to assess the severity of the conflict. The jerk [10] and yaw rate [45] profiles are widely used SSMs for detecting evasive actions in the longitudinal and lateral directions, respectively [8].
The jerk represents the derivative of the acceleration and helps quantify the amount of evasive action (powerful braking) in the longitudinal direction. It is derived from the speed of a vehicle ( V A ), as shown in Equation (5).
j e r k t = d 2 V A t d t 2
The yaw rate (YR) represents the rate of change of the heading angle and helps quantify evasive action (changing lanes or swerving) in the lateral direction. The YR is calculated using the Equation (6), where ψ is the heading angle.
Y R t = d ψ d t
The critical conflicts could result in accidents, whereas the normal (non-critical) conflicts (bursty and intermittent RoWVs) could lead to localised congestion. This congestion arises from the evasive actions (slowdowns) taken by CTVs in response to bursty, intermittent RoWVs. Hence, this paper uses the proportion of stopping distance SSM to detect the localised congestion. It is a well-suited measure for congestion, as it is inversely proportional to the CTV’s stopping distance. If the CTV slows down (evasive action), the PSD shows a higher value; otherwise, it shows a lower value. This paper measures PSD at time T 1 using the distance (d) between RTV and CTV (shown as an arrow in Figure 6 (left)) and the speed of a CTV, as shown in the following Equations (7) and( 8). The values of f and perception-reaction time ( T R ) of the driver(in seconds) are set according to Indian road conditions and drivers’ characteristics [2].
S D = V A × T R 3.6 + V A 2 250 × f
P S D = d S D

3.5. Modelling Non-Compliant Driving Behaviour of RTVs

The generalised linear models (GLM) are commonly used to model critical conflicts (count data) and understand the impact of various parameters, such as vehicle-related, driving behaviour-related, traffic-related, road-related, and environment-related, on the critical conflicts. In this paper, a GLM model is employed to model non-compliant driving behaviour (using the number of RoWVs—a count data) and explores the impact of driving behaviour-related parameters (i.e., waiting time, crossing time, turning path) and traffic-related (i.e., interacted CTVs, early-yielded CTVs, non-uniform traffic) on the number of RoWVs.
The GLM has three components: the response variable distribution, linear predictor ( β X ), and link function (g()). It allows the choice of appropriate distributions (e.g., Poisson, Negative Binomial, Gamma, Tweedie) to capture the variability in count data. The link function helps to fit the linear predictor by transforming the mean of the response variable. The GLM can be expressed in Equation (9) as:
g ( μ i ) = β i X i
This paper uses the Tweedie distribution with the log link function to model RoWVs, as shown in Equation (10). The Y i is the number of RoWVs committed by an RTV, and the model can be expressed statically as given in Equation (11).
Y i Tweedie ( μ i , ϕ i , p )
log ( Y i ) = β 0 + β 1 X i 1 + + β k X i k
where μ i = mean parameter, ϕ i = dispersion parameter, p = Tweedie power parameter, Y i = predicted RoWVs, X i 1 , X i k = driving behaviour-related and traffic-related parameters, β 0 , β 1 , β k = model parameters.
Further, to determine how well a model fits given data, several frequently used goodness-of-fit metrics [33], such as Akaike’s Information Criteria (AIC), Bayesian Information Criteria (BIC), Log-Likelihood (LL), and McFadden pseudo- R 2 , are employed. Lower AIC/BIC scores and higher LL suggest the model fits the data well [33]. Also, a McFadden pseudo- R 2 in the range of 0.2 to 0.4 suggests a good fit [33].

3.6. Non-Compliant Driving Behaviour of RTVs and Localised Congestion

Under non-uniform traffic conditions, it is observed that once an RTV initiates a right-of-way violation, other previously waiting RTVs also begin violating the right-of-way, leading to a slowdown of traffic on major roads. Moreover, traffic on major roads (CTVs) experiences such bursty RoWVs intermittently. Hence, the bursty and intermittent RoWVs could lead to localised congestion, which degrades the operational performance of the T-intersection. Also, due to bursty and intermittent RoWVs, a group of RTVs encounters multiple, yet largely the same, CTVs within that duration, resulting in similar PSD values.
This paper proposes a novel parameter, congValue, related to an RTV to estimate localised congestion using PSD values, as shown in Equation (12), where N is the number of RoWVs committed by the RTV. The congValue of an RTV gives a quantitative measure of the localised congestion. In the end, the distribution of the congValue for all RTVs (RoWV-RTVs) is derived, and an appropriate threshold is selected to detect congestion and the RTVs involved. This threshold-based approach effectively detects localised congestion by ignoring RTVs with congValue values below the threshold.
c o n g V a l u e = log i = 1 N P S D i
This methodology employs the widely used [35,38] K-means clustering algorithm [46] to automatically detect localised congestion (due to bursty and intermittent RoWVs) using RoWV frames, PSD values, and trajectory numbers of CTVs (RoWV-CTVs). Here, the frames of RoWV exploit temporal proximity, whereas PSD values and trajectory numbers (group of RoWV-CTVs) describe the localised congestion. Therefore, this methodology can effectively detect localised congestion, its duration, and the vehicles involved (RoWV-LC-RTVs and RoWV-LC-CTVs). Also, the Elbow method is used to identify the optimal number of clusters (localised congestion). Ultimately, the localised congestion caused by bursty and intermittent RoWVs is quantified using the travel time index (TTI).

3.7. Detecting Evasive Actions

Evasive actions help identify critical conflicts and a constrained path. This paper uses jerk and yaw rate profiles to detect evasive actions executed by CTVs. There are no universally accepted thresholds for jerk and the yaw rate in standard practice to determine whether evasive actions were executed. Moreover, these values depend on traffic conditions and vehicle types. Strong braking indicates a large negative jerk, whereas significant lane deviation indicates a high yaw rate. Hence, this paper uses minJerk (the minimum value of jerk) [10] and maxYR (the maximum value of yaw rate) [45] to detect evasive actions and also proposes a novel approach to derive class-wise threshold values for minJerk and maxYR from unhindered traffic.
First, the traffic (CTVs) from approach 2 (refer to Figure 1a) is considered unhindered: some CTVs driving close to the median may be hindered by RTVs from minor to major roads. Therefore, this paper screens out the affected CTVs using travel time and clustering and excludes CTVs with higher travel times. Then, the minJerk and maxYR values for each CTV are estimated from their profiles. Further, the class-wise distributions of these values are derived, and the average values are used as thresholds. Finally, to detect a constrained path, the class-wise threshold values for maxYR are used as the RoWC-CTVs change lanes to follow a constrained path available; if a maxYR value of the CTV is greater than its relative (class-wise) threshold, then it is concluded that its lane has been changed. After that, the RoWC-CTVs are segregated into two groups according to the constrained path: one group in which RTVs force the other vehicles (RoWC-CP-CTVs) to follow a constrained path, and the second group in which RTVs yield completely to other vehicles (RoWC-CY-CTVs).
Then, in a similar way, the class-wise average values of maxYR and minJerk of unhindered CTVs (RoWC-CY-CTVs) from approach 2 are used as thresholds to detect evasive actions executed by RoWV-CTVs to avoid conflicts; if the minJerk or maxYR value of a CTV is less than or greater than its relative (class-wise) threshold value, then it is concluded that it has executed an evasive action in longitudinal or lateral direction, to avoid a conflict. However, this is not sufficient to detect evasive actions during conflicts. It is essential to validate that these evasive actions were executed in response to the realisation of the conflict situation and are not false positives (part of driving style or due to other reasons). Therefore, this paper employs the offline change point detection (CPD) algorithm [47] to identify the time window related to minJerk or maxYR and, based on that, validates the evasive actions.
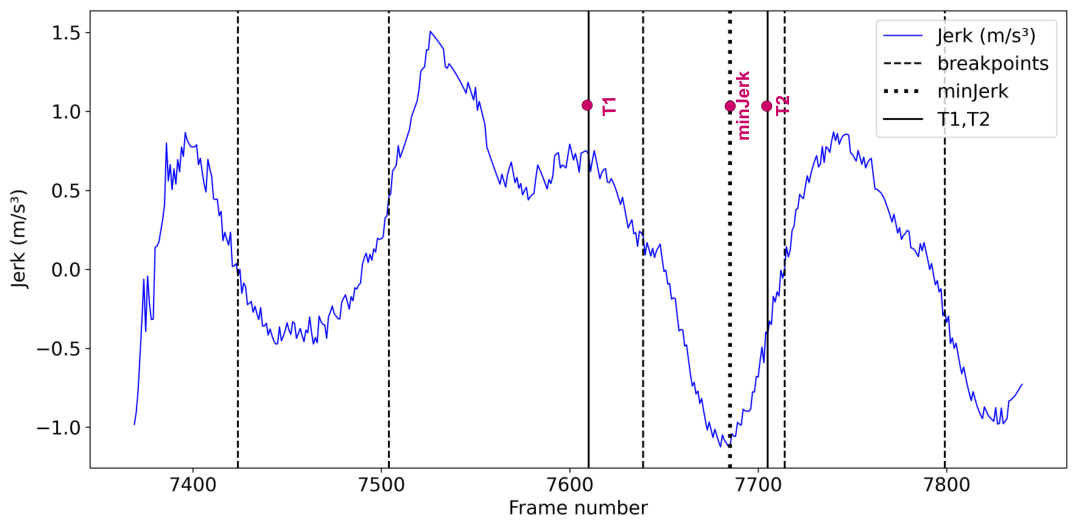
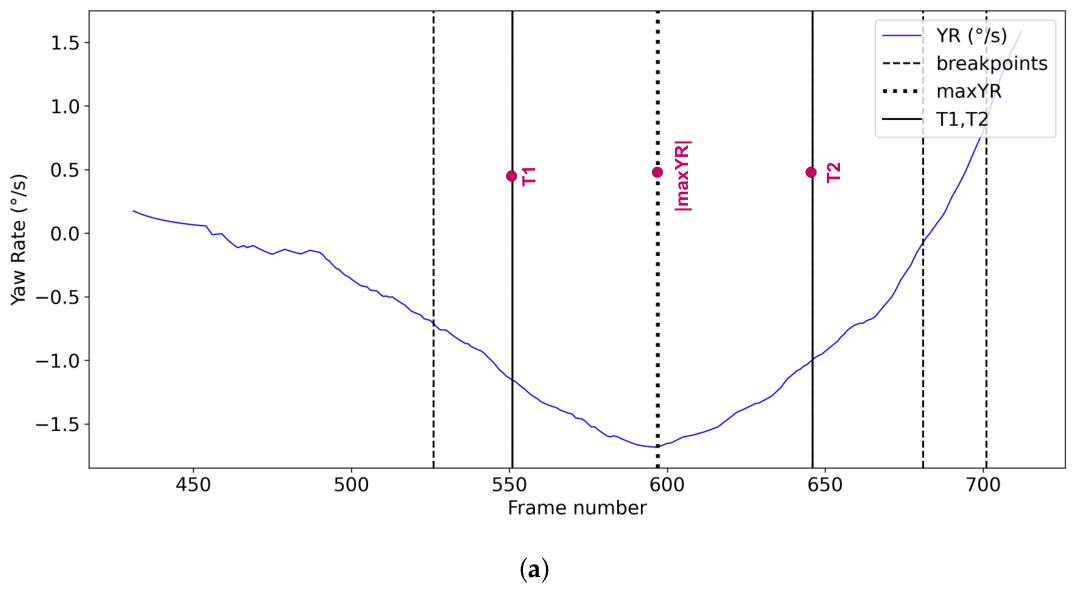
The offline CPD algorithm [47] first searches for the changes in a given signal by looking at the whole signal and then divides the signal into several breakpoints related to those changes. These breakpoints help identify a time window for each change point in the signal. This paper uses jerk and yaw-rate profiles as signals and applies the CPD algorithm to identify a time window related to the change point (minJerk and maxYR). In Figure 7, the jerk profile of a CTV with detected breakpoints (frame numbers) and a frame number related minJerk is shown. Similarly, the yaw rate profile of a CTV and its marked trajectory (with related frame numbers) are shown in Figure 8.
After detecting the evasive actions using threshold values, their time responses are used to validate them; if a time window (related to minJerk or maxYR) starts on or after T 1 and overlaps with duration ( T 1 to T 2 ), then that evasive action considered valid; refer to Figure 6 and Figure 7. This paper uses binary segmentation-based CPD (number of breakpoints = 5) with the “L2” cost model to detect time windows associated with these parameters.

3.8. condPET and Conflicts

Relying on the critical speed SSM, in conjunction with PET, to identify critical conflicts can lead to inaccurate results due to the neglect of evasive actions [39]. Hence, this paper proposes a novel aggregated SSM, condPET, a variant of PET conditioned on evasive actions and the severity of the conflict to identify critical conflicts; if the PET value is below the threshold, the speed of the RoWV-CTV is more than the corresponding CS, and RoWV-CTV executed evasive actions, then that conflict is considered CC; otherwise, it is considered a normal conflict.
For every conflict, this paper compares the SSM values (PET, CS, minJerk, and maxYR) against their threshold values and identifies it as a critical or normal conflict, as shown in the Figure 2. In this paper, a threshold value for PET is set to 1.5 s [36], and the corresponding CS value (for a specific PET) is calculated using Equation (4).

3.9. Nonchalant and Competitive Driving Behaviours of RTVs and Their Impact

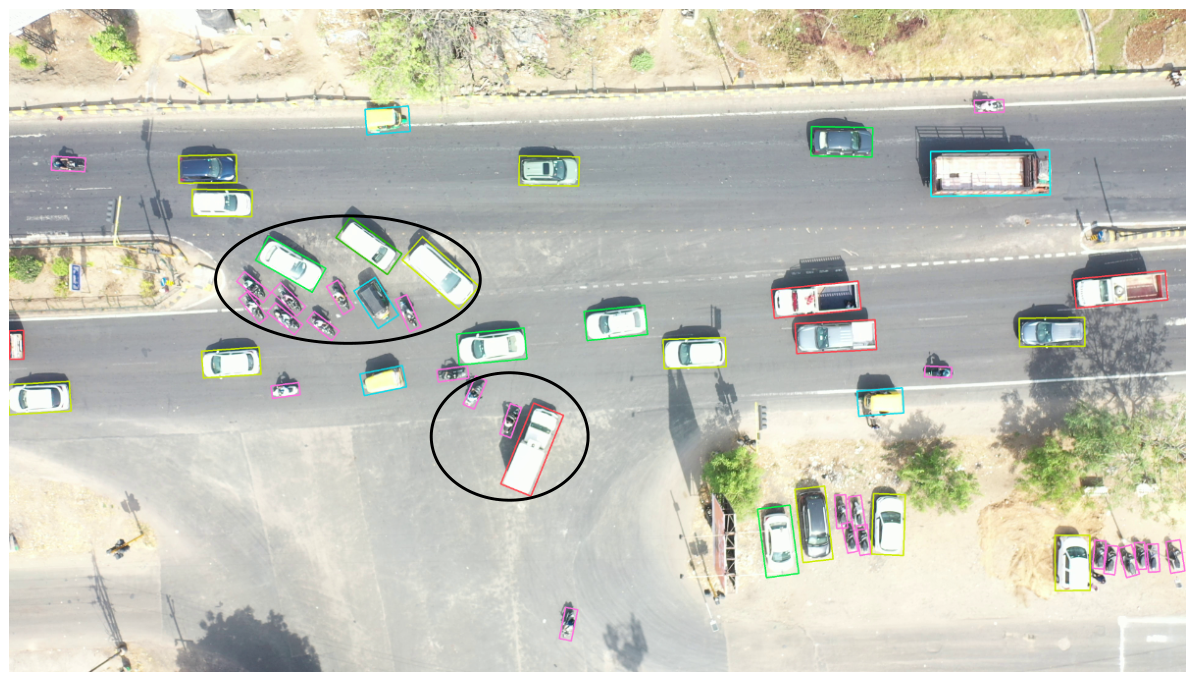
It has been observed that, before violating the right-of-way, RTVs initially encroach onto major roads and then attempt to push traffic on these roads (RoWC-CTVs) farther away from them. This behaviour results in a constrained path for the RoWC-CTVs; refer to Figure 9. This happens mainly because of waiting on major roads (rather than at the median or before the stop line), long waits, and increased RTVs, which are traits of nonchalant and competitive driving behaviours. This constrained path for RoWC-CTVs limits the traffic flow on major roads and creates localised congestion.
As discussed earlier, the non-compliant behaviour of RTVs contributes to critical conflicts and localised congestion. However, compliant behaviour can also lead to congestion when combined with the nonchalant and competitive driving behaviours of RTVs under non-uniform traffic conditions. This paper uses evasive actions to detect a constrained path, as discussed in Section 3.7, and identifies those CTVs and RTVs as RoWC-CP-CTVs and RoWC-CP-RTVs, respectively.
Then, this methodology again employs the K-means clustering algorithm [46] to automatically detect localised congestion (due to the constrained path) using a different set of features, such as RTV yield frames and RTV trajectory numbers. Here, the frames of yield exploit temporal proximity, whereas the trajectory numbers of RTVs help detect the constrained path created by the same set of RTVs; these help detect localised congestion, its duration, and the vehicles (RoWC-CP-RTVs and RoWC-CP-CTVs) involved effectively. Also, the Elbow method is used to identify the optimal number of clusters (localised congestion). Ultimately, the localised congestion due to the constrained path is quantified using the TTI metric. Also, the impact of RoWC-CP-RTVs on the operational performance of the T-intersection is shown using a travel-time-based indicator, the Operational Performance Index (OPI), calculated using Equation (13).
O P I = T T U n h i n d e r e d T T C P

4. Results and Discussion

The presented right-turning behaviour evaluation methodology is tested and validated using traffic video from a multi-lane uncontrolled T-intersection (lat 23°02′35.5″ N, long 72°28′48.3″ E) in Ahmedabad, India, approximately 25 min in length, collected between 9.00 a.m. and 10.00 a.m. (peak hour) during 2021–2022. Only motorised vehicles were considered in the evaluation. Also, the present study has not included interactions (merging behaviour) between RTVs from minor roads and CTVs from approach 2.

4.1. CV-Based Traffic Data Extraction and Estimation of SSMs

The CV-based procedure to extract traffic data discussed in Section 3.2 has used various algorithms such as YOLOv8, along with the BoT-SORT for trajectories of vehicles, SIFT features for the heading angle (orientation) of the vehicle, UAV calibration for GSD calculation, Kalman filters and Boyer–Moore voting algorithm for smoothing continuous categorical data, respectively. Their applications in automated traffic data extraction have already been validated in prior research [2].
A total of 2406 vehicles’ trajectories were extracted from 25 min of road traffic videos. Out of the total vehicles (1912) on major roads, 52.00% were from approach 1 (CTVs), and 48.00% were from approach 2 (unhindered traffic), whereas out of the total (494) RTVs, 77.00% were from major to minor roads and 23.00% were from minor to major roads. Our results indicate that 92.50% of RTVs (RoWV-RTVs) have violated the right-of-way of 58.44% of CTVs (RoWV-CTVs), and only 7.50% of RTVs (RoWC-RTVs) have respected the right-of-way of 35.76% of CTVs (RoWC-CTVs), out of the total RTVs. This paper has considered four significant types of vehicles, such as a car (or a van), a 2W (a two-wheeler), a 3W (a three-wheeler), and a truck (or a bus), in the analysis. The distributions of other parameters and SSMs have been discussed in the relevant sections.

4.2. Model Calibration, Validation, and Inferences

The Tweedie GLM model with a power parameter of 1.5 was developed to model non-compliant driving behaviour (RoWVs). The descriptive statistics of the predictor and response variables are given in Table 2. 90% of the data were used for model development, and the remaining 10% for model validation. Also, a Poisson model with the same variables was developed to verify the Tweedie model’s goodness-of-fit and predictive performance. The RMSE and mean percentage error (MPE) were calculated to assess the model’s accuracy on the test data. The comparison of both models using valid metrics is shown in Table 3. This comparison shows that both models capture the variability in the response variable (McFadden pseudo- R 2 ) very well. Further, the lower AIC and BIC values and the higher LL value for the Tweedie model compared to the Poisson model suggest that Tweedie is the best choice. Moreover, the validation metrics (RMSE and MPE) reveal that the Tweedie model is more accurate than the Poisson model.
Table 4 presents the summary of the developed Tweedie model. All predictors have p-values < 0.01, indicating a meaningful impact on the RoWVs. Hence, Equation (11) can be rewritten as follows:
log ( R o W V s ) = 0.8857 0.0255 ( waiting time ) 0.0334 ( crossing time ) + 0.0125 ( turn error ) + 0.0862 ( interacted CTVs ) 0.0617 ( early yielded CTVs )
The waiting time, crossing time, and early-yielded CTVs are negatively associated with RoWVs, whereas turn error and interacted CTVs are positively associated.
More cautious and yielding behaviours described by waiting time and early-yielded CTVs of RTVs reduce the RoWVs; one unit increase in waiting time or early-yielded CTVs reduces the expected RoWVs by 2.50% or 6.00%, respectively. The RTVs waiting in a conflict zone reduce the RoWVs but introduce a constrained path for CTVs, and such RTVs have higher crossing time. Therefore, the model shows that a one-unit increase in crossing time reduces the RoWVs by 3.30%.
Not following an ideal turning path increases RoWVs and could influence traffic safety [12]; a one-unit increase in turn error increases RoWVs by 1.30%. Increasing traffic on major roads also increases the RoWVs; a one-unit increase in interacted CTVs increases RoWVs by 9.00%.

4.3. Class-Wise Thresholds for Evasive Actions Detection

The K-means clustering (number of clusters = 2) and estimated travel time were used to identify a set of unhindered CTVs (from approach 2). The average travel time of unhindered CTVs (from approach 2) was approximately 6 s. Finally, the class-wise average values of maxYR (as shown in Table 5) were derived and chosen as thresholds to classify RoWC-CTVs into RoWC-CP-CTVs and RoWC-CY-CTVs.
Next, similar class-wise averages of minJerk and maxYR for the RoWC-CY-CTVs were derived and used as thresholds to identify critical conflicts. The class-wise average values of both variables minJerk and maxYR are given in Table 6.

4.4. Critical and Normal Conflicts

An RTV could interact (conflict) with multiple CTVs, and vice versa, due to non-uniform driving behaviour [31]. Therefore, this paper selected unique pairs of vehicles (RTVs and CTVs) with the lowest PET value among their interactions and identified 45.50% of unique pairs (from 92.50% of RoWV-RTVs). In Table 7, a comparison of the number of critical and normal conflicts based on existing and proposed SSMs is shown. From the results, it is evident that PET-based conflicts are more numerous (38.94%); however, they do not adequately reflect truly critical road user interactions under non-uniform driving conditions, as proposed in [8,9]. The number of critical conflicts reduces substantially (11.05%) when conflicts are identified using critical speed (CS), reflecting critical interactions; these findings corroborate those of [34] for heterogeneous traffic conditions. However, our condPET further improves the detection of actual critical conflicts (6.25%) by including evasive actions. The resultant conflicts were manually validated through videos.
Out of all unique interactions, only 6.25% of critical conflicts were observed based on condPET: this happened because RTVs feel risk-free at the larger median and perform two-stage crossing, which increases waiting and crossing times (as discussed in a prior study [48]) and reduces the number of critical conflicts. However, these waiting RTVs later become impatient, resulting in increased encroachment (on major roads), bursty, and intermittent RoWVs, causing localised congestion (discussed in Section 3.6 and Section 3.9), which degrade the operational performance of the T-intersection.
Further, more than half of the vehicles (53.57%) involved in critical conflicts were 2Ws, and they primarily changed lanes to avoid collisions; this is self-explanatory, as 2Ws can easily change lanes due to their high manoeuvrability. These findings corroborate with earlier research [35,45].
Table 7. Comparison of the number of critical and normal conflicts based on PET, CS, and condPET SSMs.
Type of ConflictPET [49]CS [34]condPET (Ours)
critical (%)38.9411.056.25
normal (%)61.0688.9593.75

4.5. Localised Congestion Detection

It is observed that localised congestion at uncontrolled T-intersections is caused by bursty and intermittent RoWVs (non-compliant driving behaviour) as well as a constrained path (nonchalant, impatient, and competitive driving behaviours) under non-uniform traffic conditions. This methodology uses the K-means clustering algorithm, a congValue, and different feature sets (for both cases) to detect congestion. The results were manually validated.
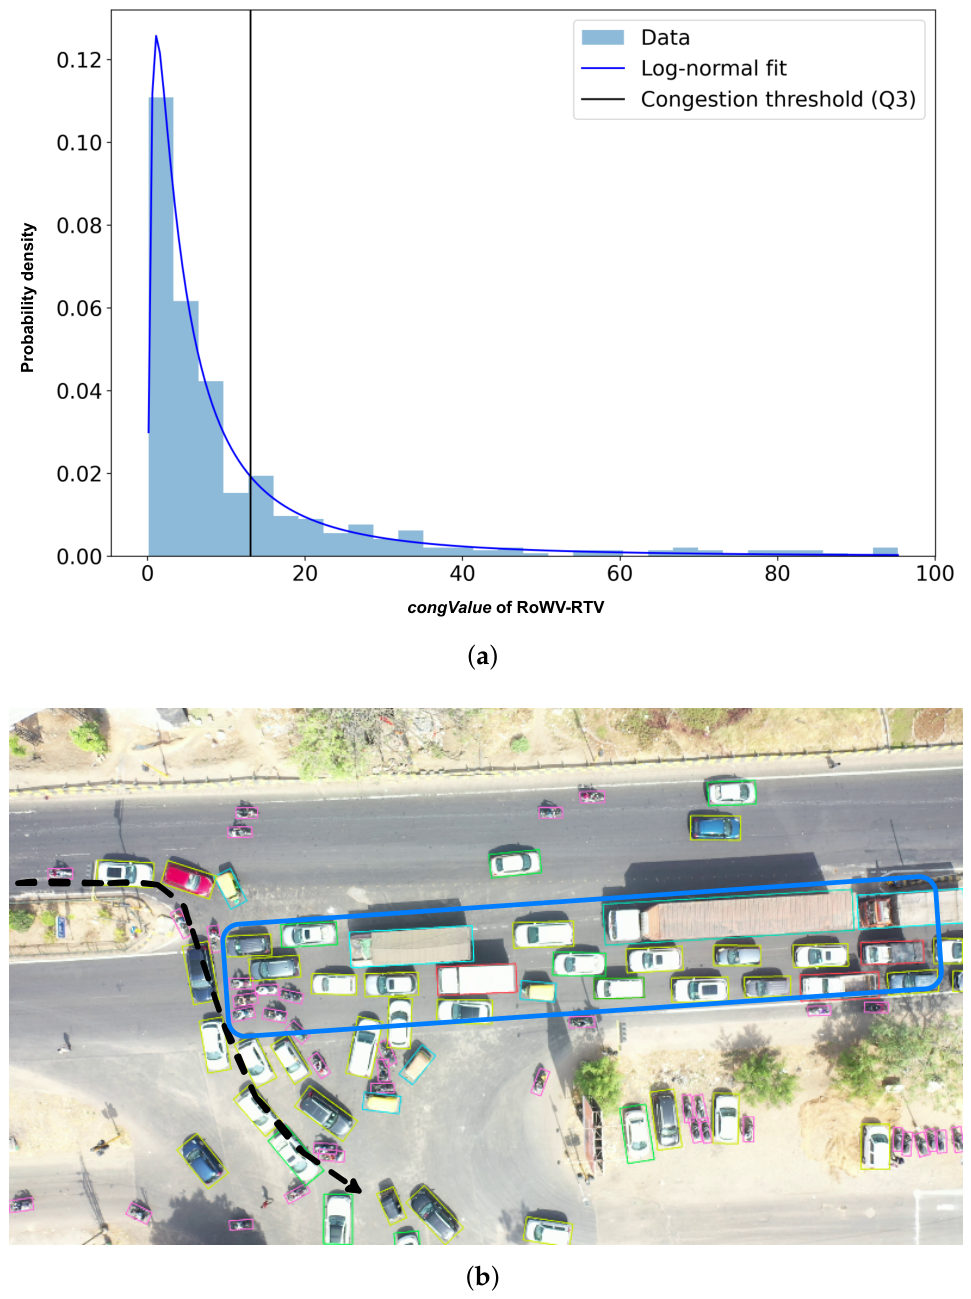
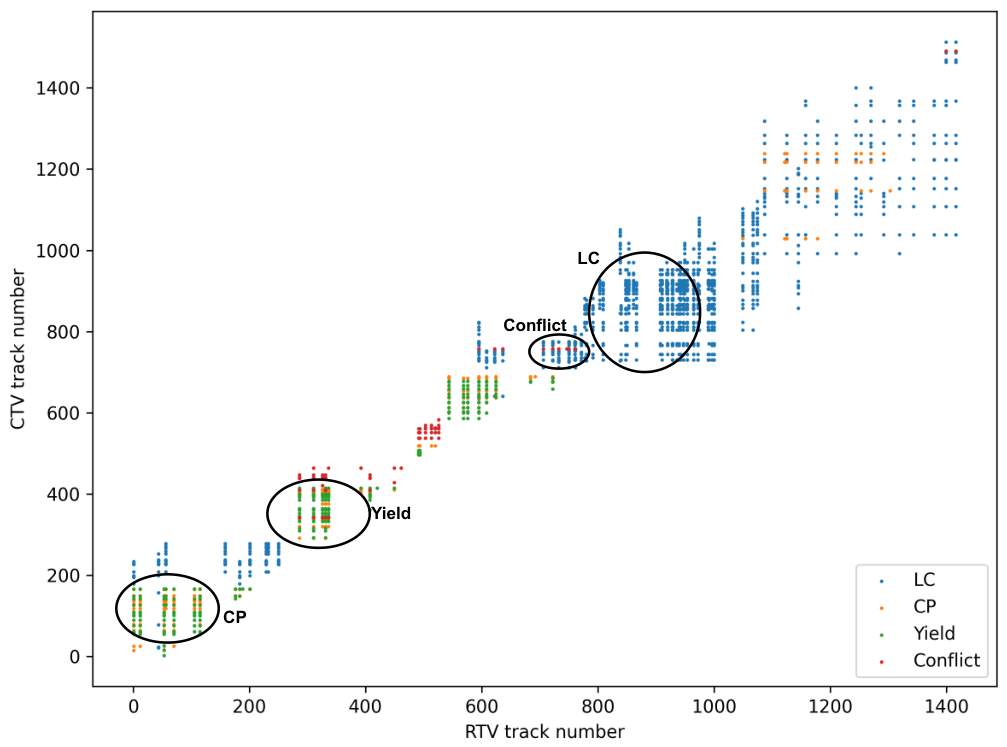
The distribution of the congValue of all RoWV-RTVs was derived, and then a log-normal distribution was used to describe the congValue, as shown in Figure 10a. Then, as the threshold for congestion, the upper quartile (Q3) was selected to identify vehicles (RoWV-LC-RTVs) involved in it; the higher the threshold, the stronger the congestion. Further, the K-means clustering algorithm was applied to identify clusters (according to the Elbow method) related to congestion. Figure 10b depicts the localised congestion due to bursty and intermittent RoWVs. This study found that 26.00% of RTVs (RoWV-LC-RTVs) among total RoWV-RTVs caused localised congestion, and that 48.54% of CTVs (RoWV-LC-CTVs) among total RoWV-CTVs were slowed down.
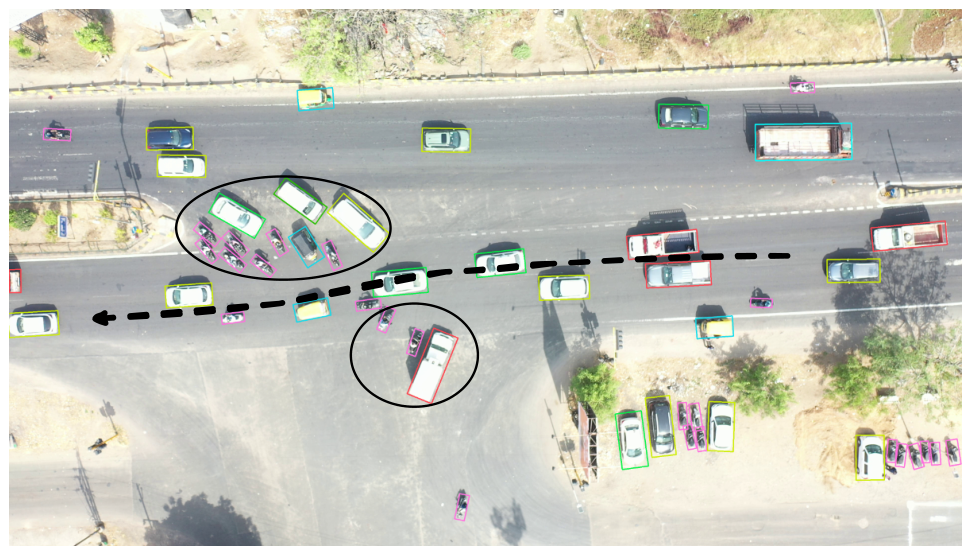
Similarly, clusters related to congestion (due to a constrained path) were identified using a different set of features (given in Section 3.9) and the K-means clustering algorithm. A sample image of localised congestion caused by the constrained path is shown in Figure 11. This study found that 45.34% of RTVs forced 16.28% of CTVs (RoWC-CP-CTVs) to follow a constrained path.

4.6. Quantify Localised Congestion

This paper has quantified localised congestion using the travel time index. It is defined as a ratio of the average travel time of CTVs during congestion to the average travel time of CTVs in unhindered traffic (from approach 2). The descriptive statistics of the estimated travel times of different types of CTVs involved in congestion and related TTI values are shown in Table 8. The congestion duration is also shown in Table 8. The findings show that various driving behaviours of RTVs caused severe congestion (44.00% of the total recorded video time); the average travel time of CTVs doubled while they were forced to follow a constrained path (14.00% of the total time), and this value increased by 3.5 times in the case of bursty and intermittent RoWVs (30.00% of the total time). The pairwise Kolmogorov–Smirnov (K-S) test was also performed to assess differences in travel time distributions for RoWC-CP-CTVs and RoWV-LC-CTVs, yielding a KS statistic of 0.5977 and a p-value well below the 1% significance level and indicating that these traffic flows differ.
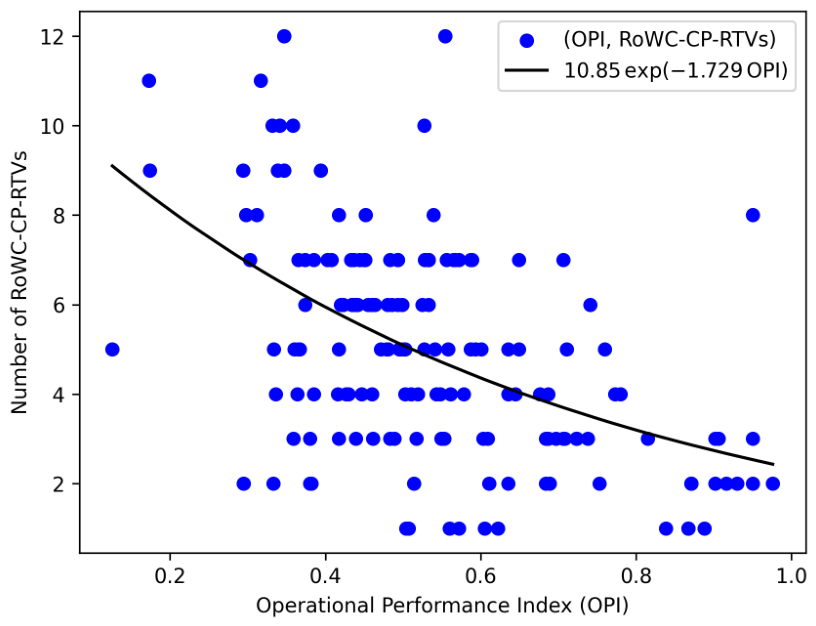
It is evident that the duration of the bursty and intermittent RoWVs directly impacts the operational performance of the T-intersection; the more RoWs, the longer the congestion on the major road; refer to Figure 10. Further, to demonstrate the impact of RoWC-CP-RTVs (RTVs forcing traffic on major roads to follow a constrained path) on the operational performance of the T-intersection, we derived a relationship between RoWC-CP-RTVs and OPI (value of T T U n h i n d e r e d is set to 5.951, refer to Table 8) related to each RoWC-CP-CTV, as shown in Figure 12. This confirms that the number of RoWC-CP-RTVs (impatient RTVs waiting safely) has an adverse effect on the operation performance of the traffic on major roads.

4.7. Visual Analysis and Validation

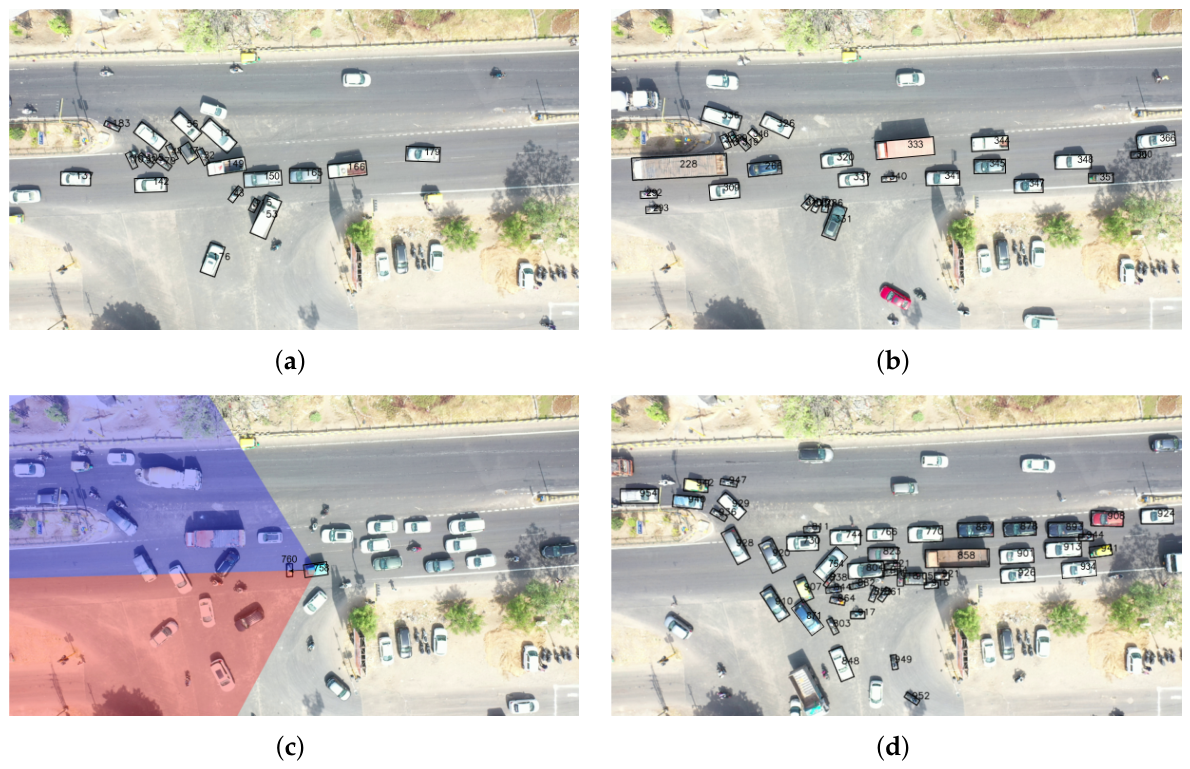
To visually validate the results of our methodology, we plotted each pair of RTV and CTV, along with the associated traffic event (see Figure 13). The vehicles of interest (RTVs and CTVs) related to traffic events, such as constrained path, yield, conflict, and congestion, are shown with their track numbers in Figure 14a, Figure 14b, Figure 14c and Figure 14d, respectively.
Figure 14a,b show compliant driving behaviours of RTVs. However, RTVs’ nonchalant, impatient, and competitive driving behaviours lead to encroachment onto major roads (see Figure 14a), resulting in a constrained path for CTVs. This shows a trade-off between road safety and operational performance of the T-intersection. Whereas Figure 14c,d show non-compliant driving behaviour of RTVs, resulting in conflicts and/or localised congestion (bursty and intermittent RoWVs). Also, it is important to note that the impact of congestion is greater under non-compliant driving behaviour than under compliant driving behaviour, which corroborates the results presented in Table 8.

4.8. Comparison

In the absence of a similar methodology for direct comparison, the proposed methodology is judged in terms of its ability to evaluate right-turning behaviour (non-compliant and compliant behaviour) at uncontrolled T-intersections, as shown in Table 9 and further summarised below:
  • Non-compliant behaviour: The existing studies mainly focus on the identification and modelling of critical conflicts (CCs) only, whereas this paper models non-compliant behaviour using RoWVs as count data, proposes an aggregated SSM for identifying CCs, and quantifies the adverse impact of such behaviour, i.e., a localised congestion (LC).
    Compared two generalised linear models (GLMs) for modelling non-compliant behaviour using RoWVs and identified the Tweedie GLM as the better model for explaining the effects of the influencing parameters.
    CCs are correctly identified as 6.25% using condPET, compared to 38.94% (using PET) and 11.05% (using CS).
    Detected localised congestion due to bursty and intermittent RoWVs using a novel parameter, congValue, and quantified it using TTI, with the average travel time reaching 3.5 times that under unhindered traffic conditions.
  • Compliant behaviour: None of the existing studies explored the impact of compliant behaviour along with nonchalant and competitive behaviour, whereas this paper detects and quantifies such behaviours.
    Detected a constrained path (CP) using lateral evasive actions and quantified the localised congestion using TTI, with the average travel time reaching 2.0 times that under unhindered traffic conditions.
    Proposed a novel parameter, OPI, to quantify the trade-off between road safety and the operational performance of a T-intersection under constrained-path conditions, demonstrating that an increase in RTVs (waiting safely) adversely affects traffic operations on the major road.

5. Conclusions

This paper has presented a case study (and the methodology) for evaluating right-turning behaviour based on PET and evasive actions using UAV videos of an uncontrolled T-intersection in India. This paper characterised right-turning behaviour based on distinct driving traits: non-compliant (failed to yield), nonchalant (toward CTVs), and competitive (for time and space). This CV-based methodology introduced various innovative approaches (using conflict cone, bounding box of vehicle, ideal turning path, waiting zones, and CV techniques) and derives novel parameters (interacted CTVs, early-yielded CTVs, turn error, and congValue) related to right-turning behaviour, relative thresholds for minJerk and maxYR, and an aggregated SSM (condPET), to automatically detect and quantify the above-mentioned driving traits under non-uniform (due to lane indiscipline and heterogeneous traffic) driving conditions. This paper used a zone-based approach (waiting zone, conflict zone), the BB and conflict cone of a vehicle, the IoU function, and the CPD algorithm to account for spatio-temporal (detection and tracking) errors during the calculation of different SSMs and parameters. Also, this paper developed the Tweedie model to understand the impact of driving behaviour-related and traffic-related (specific to an RTV) parameters on non-compliant driving behaviour. Critical conflicts, bursty and intermittent RoWVs, and a constrained path are identified using the above-mentioned parameters, resulting from right-turning behaviours. Finally, it quantifies localised congestion using the TTI metric. The findings of this study are summarised below:
(a)
Only 7.50% of RTVs (RoWC-RTVs) have respected the right-of-way of 35.76% of CTVs (RoWC-CTVs), whereas 92.50% of RTVs (RoWV-RTVs) have violated the right-of-way of 58.44% of CTVs (RoWV-CTVs), out of the total RTVs.
(b)
The RTVs waiting patiently at waiting zones or on major roads tend to reduce the RoWVs, but they force the CTVs to follow a constrained path. In contrast, increased traffic on major roads increases RoWVs. Additionally, abnormal turning paths increase RoWVs.
(c)
Considering the evasive actions of CTVs helped in identifying the critical conflicts correctly. 6.25% of critical conflicts were observed, whereas the remaining conflicts (bursty and intermittent RoWVs) led to extreme congestion.
(d)
26.00% of RTVs (bursty and intermittent RoWVs) slowed down 48.54% of CTVs and increased their average travel time by approximately 3.5 times.
(e)
More than half of the vehicles involved in critical conflicts were 2Ws, and they primarily changed their lanes to avoid collisions.
(f)
With the help of evasive actions in the lateral direction, a constrained path (due to the nonchalant and competitive driving behaviours of RTVs) is successfully detected, and because of that, traffic on major roads slows down.
(g)
45.34% of RTVs forced 16.28% of CTVs to follow a constrained path and nearly doubled their average travel time.
(h)
CTVs suffered due to localised congestion for 44.00% of the total recorded video time, which shows poor operational performance of the uncontrolled T-intersection.
(i)
The proposed methodology uses emerging technologies (UAV, CV), offering a cost-effective solution (reducing human efforts) to evaluate road traffic safety (critical conflicts) and operational performance (localised congestion) at an uncontrolled T-intersection under non-uniform traffic conditions.
Overall, our methodology demonstrates the potential of computer vision and UAVs for the automated assessment of both road traffic safety and operational performance at uncontrolled T-intersections under non-uniform traffic conditions, thereby supporting the development of road traffic monitoring systems, such as U-UTM [19] and TAU [20]. Still, several limitations require further exploration: The data collection using UAVs is only periodic because of limited battery time [3]; To derive class-wise thresholds in our methodology, at least one trajectory with unhindered traffic flow is needed for each vehicle class; video registration may be required (in case of UAV ego motion) because our methodology relies on pre-defined zones (conflict, waiting, ideal turning path); tracking inconsistencies (broken tracks) restrict road traffic data extraction in the case of small objects (2Ws and 3Ws) and further may impact identification of clusters related to localised congestion. Moreover, this paper has treated RTVs and CTVs equally, without accounting for the obstructed field of view during RoWV and yield detection. Future adaptations of the proposed methodology for individual driver risk assessment should treat RTV-CTV interactions differently for obstructed and unobstructed fields of view.

Future Work

This paper relied on CV techniques for traffic data extraction, but they sometimes fail to detect and track small objects (2W and 3W) in certain scenarios. Therefore, there is scope to improve these modules. Deep learning detection models can be trained on our DRASHTI-HaOBB vehicle dataset [5] to improve vehicle detection in Indian traffic conditions. Also, it is possible to segment traffic videos based on the critical conflicts and (count and duration of) the congestion and classify the uncontrolled T-intersections regarding road traffic safety and operational performance. The zones and ideal turning paths have been defined manually in the present study, which can be detected automatically using the computer vision techniques described in [19]. This methodology can be modified to rate individual right-turning drivers based on violations, conflicts, and congestion at the intersection. Further, the parameters and SSMs (condPET, congValue) derived using our methodology can serve as predicates to strengthen the knowledge base of logic-based accident-prediction frameworks, such as the categorical-logic approach [50].

Author Contributions

Conceptualization, Y.M.B., M.S.Z. and S.B.Z.; methodology, Y.M.B. and M.S.Z.; software, Y.M.B.; validation, Y.M.B., M.S.Z. and S.B.Z.; formal analysis, Y.M.B. and M.S.Z.; investigation, Y.M.B., M.S.Z., M.S.R. and S.B.Z.; resources, M.S.Z. and M.S.R.; data curation, Y.M.B. and M.S.Z.; writing—original draft preparation, Y.M.B.; writing—review and editing, Y.M.B., M.S.R., M.S.Z. and P.S.; visualization, Y.M.B., M.S.Z. and M.S.R.; supervision, M.S.Z. and M.S.R.; project administration, M.S.Z. and M.S.R.; funding acquisition, M.S.Z., M.S.R. and P.S. All authors have read and agreed to the published version of the manuscript.

Funding

The UAV used in this work was purchased through funding from the seed grant (URBSEASI21A3), by the University Research Board, Ahmedabad University. The work is also supported by the workstation with a GPU purchased under the grant GUJCOST/STI/2021–22/3858 by the Gujarat Council of Science and Technology, Government of Gujarat, India. The APC was funded by the Imperial Open Access Fund.

Data Availability Statement

Dataset available on request from the authors.

Acknowledgments

We thank the Joint Commissioner of Traffic Police, Ahmedabad City (Gujarat, India), for the permission (under application number G/725/Traffic/3186/2021) to fly a UAV. We express gratitude to Ahmedabad University for providing access to its Stepwell High Performance Computing (HPC) facility for this research.

Conflicts of Interest

The authors declare no conflicts of interest.

Appendix A. Terms and Abbreviations

  • Major and minor roads: Roads with right-of-way are considered major roads, whereas roads with low priority are considered minor roads. Traffic from minor roads must yield (give way) to traffic on major roads
  • Right-turning vehicles (RTVs): Vehicles taking right turns from either minor or major roads and merging onto major or minor roads. In some of the literature, these RTVs are also referred to as offending vehicles. In this paper, RTV refers to both the vehicle and its associated driver, depending on the context.
  • Conflicting-through vehicles (CTVs): Vehicles taking a straight path on major roads. In some of the literature, these are also referred to as conflicting vehicles. In this paper, CTV refers to both the vehicle and its associated driver, depending on the context
  • Right-of-way violation (RoWV) and yield: Right-turning drivers must give way to the vehicles on the major road and should enter the major road only when the way ahead is clear; if a driver fails to yield/give way, then it is considered a RoWV; otherwise, it is considered a yield.
  • Traffic conflict: A traffic conflict is defined as “a situation involving one or more vehicles where there is imminent danger of a collision if the vehicle (or another road user) movement continues unchanged.”
  • Post-encroachment time (PET): The time between the moment an RTV leaves the conflict point and a CTV enters the same point; the lower the PET values, higher the chance of crossing conflicts
  • Proportion of stopping distance (PSD): The ratio of the gap between the vehicles (RTV and CTV) to the stopping distance of the CTV; lower PSD values represent closer proximity between vehicles.
  • Critical speed (CS): a speed parameter related to CTV based on braking distance and a specific PET value; a higher value of CTV speed than the corresponding CS indicates a serious conflict
  • Evasive actions: An intentional behaviour, such as a lane change or deceleration, executed by CTVs to avoid a collision
  • Conditioned PET (condPET) and critical conflict (CC): An aggregated SSM, a variant of PET conditioned on evasive actions (executed by CTVs to avoid collision with RTVs) and the severity of the conflict; if the PET value is below the threshold, the speed of the CTV is more than the corresponding CS, and the CTV executed evasive actions, then that conflict is considered a critical conflict (CC)
  • Constrained path (CP): A major road with limited passage because of nonchalant and competitive driving behaviours of RTVs, which restricts the flow of CTVs.
  • Localised congestion (LC): It is a congestion caused by non-compliant (bursty and intermittent RoWVs) as well as nonchalant and competitive driving behaviour (a constrained path) of RTVs at an uncontrolled T-intersection.
  • early-yielded CTVs: CTVs for which the RTV yielded before committing its first RoWV.
  • interacted CTVs: The total CTVs passed and obstructed by the RTV while taking a right turn.
  • RoWV-RTVs and RoWV-CTVs: RoWV-RTVs are those RTVs that violate the right of way of CTVs (RoWV-CTVs).
  • RoWV-LC-RTVs and RoWV-LC-CTVs: RTVs and CTVs involved in localised congestion due to bursty and intermittent RoWVs.
  • RoWC-RTVs and RoWC-CTVs: RoWC-RTVs are those RTVs that comply with the right of way of CTVs (RoWC-CTVs).
  • RoWC-CP-RTVs, RoWC-CP-CTVs, and RoWC-CY-CTVs: RoWC-CP-CTVs are those RoWC-CTVs that follow a constrained path (due to RoWC-CP-RTVs), whereas RoWC-CY-CTVs are those for which RTVs yield completely.

References

  1. Ministry of Road Transport and Highways. Road Accidents in India 2024; Technical Report; Government of India: New Delhi, India, 2026. [Google Scholar]
  2. Bhavsar, Y.M.; Zaveri, M.S.; Raval, M.S.; Zaveri, S.B. Evaluating Defensive Driving Behaviour Based on Safe Distance Between Vehicles: A Case Study Using Computer Vision on UAV Videos at Urban Roundabout. Multimodal Transp. 2025, 4, 100227. [Google Scholar] [CrossRef]
  3. Bhavsar, Y.M.; Zaveri, M.S.; Raval, M.S.; Zaveri, S.B. Vision-based investigation of road traffic and violations at urban roundabout in India using UAV video: A case study. Transp. Eng. 2023, 14, 100207. [Google Scholar] [CrossRef]
  4. Dutta, M.; Jena, S.; Korat, B.; Bhandari, S.; Lyngdoh, G.K. Anticipated buffer time—An evasive surrogate safety indicator for risk assessment of unsignalized intersections under heterogeneous traffic and aggressive driving conditions. Accid. Anal. Prev. 2024, 208, 107796. [Google Scholar] [CrossRef] [PubMed]
  5. Bhavsar, Y.M.; Zaveri, M.S.; Raval, M.S.; Patel, K.R.; Zaveri, S.B. Descriptor: Drone Nadir-view Annotated Images of Vehicles Detection Dataset for India with Heading-angle Oriented Bounding Box (DRASHTI-HaOBB). IEEE Data Descr. 2026, 3, 192–202. [Google Scholar] [CrossRef]
  6. Mahmud, S.M.; Ferreira, L.; Hoque, M.; Hojati, A. Reviewing traffic conflict techniques for potential application to developing countries. J. Eng. Sci. Technol. 2018, 13, 1869–1890. [Google Scholar]
  7. Bonela, S.R.; Kadali, B.R. Review of traffic safety evaluation at T-intersections using surrogate safety measures in developing countries context. IATSS Res. 2022, 46, 307–321. [Google Scholar] [CrossRef]
  8. Tageldin, A.; Sayed, T.; Wang, X. Can Time Proximity Measures Be Used as Safety Indicators in All Driving Cultures? Transp. Res. Rec. J. Transp. Res. Board 2015, 2520, 165–174. [Google Scholar] [CrossRef] [PubMed]
  9. Guo, Y.; Sayed, T.; Zaki, M. Exploring Evasive Action–Based Indicators for PTW Conflicts in Shared Traffic Facility Environments. J. Transp. Eng. Part A Syst. 2018, 144, 04018065. [Google Scholar] [CrossRef]
  10. Zaki, M.; Sayed, T.; Shaaban, K. Use of Drivers’ Jerk Profiles in Computer Vision–Based Traffic Safety Evaluations. Transp. Res. Rec. J. Transp. Res. Board 2014, 2434, 103–112. [Google Scholar] [CrossRef]
  11. Ministry of Road Transport and Highways. Motor Vehicle Driving Regulations. Available online: https://morth.gov.in/backend/documents/uploaded/Motor-Vehicle-Driving-Regulation-2017.pdf (accessed on 24 February 2023).
  12. Bonela, S.; Kadali, R. Analysis of right-turn vehicular driving paths at uncontrolled T-intersections. Int. J. Inj. Control Saf. Promot. 2022, 30, 91–105. [Google Scholar] [CrossRef] [PubMed]
  13. Haryana Police, Police Headquarter. Haryana Driving Manual, 2nd ed.; Haryana Police, Police Headquarter: Panchkula, Haryana, India, 2014. [Google Scholar]
  14. Paul, M.; Ghosh, I. Development of conflict severity index for safety evaluation of severe crash types at unsignalized intersections under mixed traffic. Saf. Sci. 2021, 144, 105432. [Google Scholar] [CrossRef]
  15. Amundsen, F.H.; Hydén, C. (Eds.) Proceedings of the First Workshop on Traffic Conflicts; Institute of Transport Economics: Oslo, Norway, 1977. [Google Scholar]
  16. Hydén, C. The Development of a Method for Traffic Safety Evaluation: The Swedish Traffic Conflict Technique. Ph.D. Thesis, Lund Institute of Technology, Department of Traffic Planning and Engineering, Lund, Sweden, 1987. [Google Scholar]
  17. Zhang, C.; Ma, Y.; Sayed, T.; Guo, Y.; Chen, S. A cross-sectional safety evaluation approach using generalized extreme value models: A case of right-turn safety treatment. Accid. Anal. Prev. 2024, 211, 107907. [Google Scholar] [CrossRef] [PubMed]
  18. Zhang, C.; Ma, Y.; Sayed, T.; Guo, Y.; Chen, S.; Fu, Y. Exploring the impact of right-turn safety measures on E-bike-heavy vehicle conflicts at signalized intersections. Accid. Anal. Prev. 2024, 206, 107722. [Google Scholar] [CrossRef] [PubMed]
  19. Bhavsar, Y.M.; Zaveri, M.S.; Raval, M.S.; Zaveri, S.B. U-UTM: A Cyber-Physical System for Road Traffic Monitoring Using UAVs. In Proceedings of the 2024 IEEE International Conference on Vehicular Electronics and Safety (ICVES), Ahmedabad, India, 17–19 December 2024; pp. 1–6. [Google Scholar] [CrossRef]
  20. Benjdira, B.; Koubaa, A.; Azar, A.T.; Khan, Z.; Ammar, A.; Boulila, W. TAU: A framework for video-based traffic analytics leveraging artificial intelligence and unmanned aerial systems. Eng. Appl. Artif. Intell. 2022, 114, 105095. [Google Scholar] [CrossRef]
  21. Liu, Z.; Zhong, N.; Chen, J.; Gao, B. A modeling method for two-dimensional two-wheeler driving behavior during severe conflict interaction at intersections. Accid. Anal. Prev. 2024, 205, 107668. [Google Scholar] [CrossRef] [PubMed]
  22. Krajewski, R.; Bock, J.; Kloeker, L.; Eckstein, L. The highD Dataset: A Drone Dataset of Naturalistic Vehicle Trajectories on German Highways for Validation of Highly Automated Driving Systems. In Proceedings of the 2018 21st International Conference on Intelligent Transportation Systems (ITSC), Maui, HI, USA, 4–7 November 2018; pp. 2118–2125. [Google Scholar] [CrossRef]
  23. Zheng, O.; Abdel-Aty, M.; Yue, L.; Abdelraouf, A.; Wang, Z.; Mahmoud, N. CitySim: A drone-based vehicle trajectory dataset for safety-oriented research and digital twins. Transp. Res. Rec. 2024, 2678, 606–621. [Google Scholar]
  24. Wang, J.; Fu, T.; Shangguan, Q. Wide-area vehicle trajectory data based on advanced tracking and trajectory splicing technologies: Potentials in transportation research. Accid. Anal. Prev. 2023, 186, 107044. [Google Scholar] [CrossRef] [PubMed]
  25. Jin, Q.; Abdel-Aty, M.; Wang, C.; Tang, S. Assessing conflict likelihood and its severity at interconnected intersections: Insights from drone trajectory data. Accid. Anal. Prev. 2025, 213, 107943. [Google Scholar] [CrossRef] [PubMed]
  26. Ray Sarkar, D.; Ramachandra Rao, K.; Chatterjee, N. A review of surrogate safety measures on road safety at unsignalized intersections in developing countries. Accid. Anal. Prev. 2024, 195, 107380. [Google Scholar] [CrossRef] [PubMed]
  27. Goyani, J.; Paul, A.; Gore, N.; Arkatkar, S.; Joshi, G. Investigation of Crossing Conflicts by Vehicle Type at Unsignalized T-Intersections under Varying Roadway and Traffic Conditions in India. J. Transp. Eng. Part A Syst. 2020, 147, 05020011. [Google Scholar] [CrossRef]
  28. Goyani, J.; Nishant, P.; Ninad, G.; Jain, M.; Arkatkar, S. Investigation of Traffic Conflicts at Unsignalized Intersection for Reckoning Crash Probability Under Mixed Traffic Conditions. J. East. Asia Soc. Transp. Stud. 2019, 13, 2091–2110. [Google Scholar] [CrossRef]
  29. Paul, A.B.; Gore, N.; Arkatkar, S.; Joshi, G. Investigating and modeling the influence of PET-types on crossing conflicts at urban unsignalized intersections in India. Int. J. Inj. Control Saf. Promot. 2023, 30, 239–254. [Google Scholar] [CrossRef] [PubMed]
  30. Paul, A.B.; Goyani, J.; Arkatkar, S.; Joshi, G. Modeling the Effect of Motorized Two-Wheelers and Autorickshaws on Crossing Conflicts at Urban Unsignalized T-Intersections in India using Surrogate Safety Measures. Transp. Res. Procedia 2022, 62, 774–781. [Google Scholar] [CrossRef]
  31. Goyani, J.; Gore, N.; Arkatkar, S. Crossing conflict models for urban un-signalized T-intersections in India. Transp. Lett. 2024, 16, 829–837. [Google Scholar] [CrossRef]
  32. Paul, M.; Ghosh, I. Post encroachment time threshold identification for right-turn related crashes at unsignalized intersections on intercity highways under mixed traffic. Int. J. Inj. Control Saf. Promot. 2020, 27, 121–135. [Google Scholar] [CrossRef] [PubMed]
  33. Bonela, S.; Kadali, R. Analysis of severity of right-turning vehicles conflicts at unsignalized T-intersections. Proc. Inst. Civ. Eng.-Transp. 2024, 178, 245–257. [Google Scholar] [CrossRef]
  34. Paul, M.; Ghosh, I. A Novel Approach of Safety Assessment at Uncontrolled Intersections using Proximal Safety Indicators. Eur. Transp. 2017, 65, 1–14. [Google Scholar]
  35. Singh, D.; Das, P.; Ghosh, I. Conflict-Based safety evaluations at unsignalized intersections using surrogate safety measures. Heliyon 2024, 10, e27665. [Google Scholar] [CrossRef] [PubMed]
  36. Hasain, N.M. Safety evaluation of unsignalized intersection with heterogeneous traffic using Post Encroachment Time and conflicting vehicle speed. Eur. Transp./Trasp. Eur. 2022, 88, 1–14. [Google Scholar] [CrossRef]
  37. K.A., S.R.; Chepuri, A.; Arkatkar, S.S.; Joshi, G. Developing proximal safety indicators for assessment of un-signalized intersection—A case study in Surat city. Transp. Lett. 2020, 12, 303–315. [Google Scholar] [CrossRef]
  38. Bonela, S.R.; Kadali, B.R. Examining the effect of vehicle type on right-turn crossing conflicts of minor road traffic at unsignalized T-intersections. IATSS Res. 2023, 47, 545–556. [Google Scholar] [CrossRef]
  39. Johnsson, C.; Laureshyn, A. Identification of evasive manoeuvres in traffic interactions and conflicts. Traffic Saf. Res. 2022, 3, 000012. [Google Scholar] [CrossRef]
  40. Raj, A.; Chilukuri, B.; Subramanian, S. Modelling Yielding of Slow-Moving Vehicles: Application of Drone Data. IFAC-PapersOnLine 2024, 58, 279–284. [Google Scholar] [CrossRef]
  41. Lowe, D.G. Distinctive Image Features from Scale-Invariant Keypoints. Int. J. Comput. Vis. 2004, 60, 91–110. [Google Scholar] [CrossRef]
  42. Zhu, P.; Wen, L.; Du, D.; Bian, X.; Fan, H.; Hu, Q.; Ling, H. Detection and tracking meet drones challenge. IEEE Trans. Pattern Anal. Mach. Intell. 2021, 44, 7380–7399. [Google Scholar] [CrossRef]
  43. Dharmasena, S.; Suresh, E.A. Impact of Roadside Landscape to Driving Behaviour; Lessons from Southern Highway, Sri Lanka. Cities People Places 2018, 3, 66. [Google Scholar] [CrossRef]
  44. Barbu, D.M. Visual Field Evaluation Method Of The Automobile Drivers In Traffic. Ann. Fac. Eng. Hunedoara 2016, 14, 163. [Google Scholar]
  45. Kar, P.; Kumar, S.; Shivasai, S.; Chunchu, M.; Ravi Shankar, K. Exploratory analysis of evasion actions of powered two-wheeler conflicts at unsignalized intersection. Accid. Anal. Prev. 2023, 194, 107363. [Google Scholar] [CrossRef] [PubMed]
  46. MacQueen, J. Some methods for classification and analysis of multivariate observations. In Proceedings of the Fifth Berkeley Symposium on Mathematical Statistics and Probability; University of California Press: Oakland, CA, USA, 1967; Volume 1, pp. 281–297. [Google Scholar]
  47. Truong, C.; Oudre, L.; Vayatis, N. Selective review of offline change point detection methods. Signal Process. 2020, 167, 107299. [Google Scholar] [CrossRef]
  48. Kota, R.B.; Mehar, A. Effect of two-stage crossing of right-turning vehicles on capacity of urban uncontrolled intersections under mixed traffic conditions. Case Stud. Transp. Policy 2022, 10, 2546–2555. [Google Scholar] [CrossRef]
  49. Allen, B.L.; Shin, B.; Cooper, P. Analysis of traffic conflicts and collisions. Transp. Res. Rec. 1978, 667, 67–74. [Google Scholar]
  50. Koutsaki, E.; Vardakis, G.; Papadakis, N. Event Prediction Using Spatial-Temporal Data for a Predictive Traffic Accident Approach Through Categorical Logic. Data 2025, 10, 85. [Google Scholar] [CrossRef]
Figure 1. Schematic of terminology and crossing conflicts at an uncontrolled T-intersection (left-hand traffic): (a) Classification of approaching roads and vehicles at T-intersection. (b) Zones and ideal turning paths for parameter estimation at T-intersection.
Technologies 14 00442 g001
Figure 2. Flowchart of the proposed methodology for evaluating traffic conflicts and congestion based on right-turning driving behaviour.
Technologies 14 00442 g002
Figure 3. Revised CV-based pipeline for vehicles’ trajectories and data extraction, derived from our previous study [2]. (Revised work is highlighted.)
Technologies 14 00442 g003
Figure 4. Schematic illustration of right-of-way violation (RoWV) and yield detection using a conflict cone: (a) Right-of-way violation (RoWV) detection when an RTV passes the conflict zone first in the presence of a CTV. (b) Yield detection when a CTV passes the conflict zone first in the presence of an RTV.
Technologies 14 00442 g004
Figure 5. Example showing superimposed zones: (a) An ideal turning path (large dotted line—ideal turning path from major to minor road; small dotted line—ideal turning path from minor to major road). (b) Waiting zones (red—at median and pink—at entry/exit of minor road) and conflict (blue) zone. (c) A conflict cone of the vehicle (blue is “R” and red is “L” parts, respectively).
Technologies 14 00442 g005
Figure 6. Schematic illustration of conflict and estimation of SSMs (PET and PSD).
Technologies 14 00442 g006
Figure 7. Example of detection of change points using the offline CPD algorithm applied on the jerk profile.
Technologies 14 00442 g007
Figure 8. Example of detection of change points using the offline CPD algorithm: (a) Applied on the yaw rate. (b) A marked trajectory (with frame numbers) of the respective vehicle.
Technologies 14 00442 g008aTechnologies 14 00442 g008b
Figure 9. Example of a constrained path (limited passage) created by RTVs because of nonchalant and competitive driving behaviours.
Technologies 14 00442 g009
Figure 10. Localised congestion detection using congValue: (a) The congValue distribution with the fitted log-normal distribution. (b) The sample image of localised congestion (shown as a blue polygon) due to bursty and intermittent RoWVs (shown as a dotted line).
Technologies 14 00442 g010
Figure 11. The sample image of localised congestion-constrained path (shown as a directional arrow) and involved RTVs are shown in a circle.
Technologies 14 00442 g011
Figure 12. Trade-off between road safety and operational performance of the T-intersection in the case of a constrained path.
Technologies 14 00442 g012
Figure 13. Traffic events associated with each RTV and CTV pair; corresponding example images are shown in Figure 14.
Technologies 14 00442 g013
Figure 14. Example images of traffic events (see Figure 13) derived through our proposed methodology on a sample video: (a) A constrained path (CP). (b) Yield behaviour. (c) A conflict. (d) Localised congestion (LC).
Technologies 14 00442 g014
Table 1. Typical parameters and SSMs used to study non-compliant behaviour at uncontrolled intersections under non-uniform traffic conditions in India.
RefTraffic Data Extraction ToolsSSMsInfluencing ParametersModelData
Vehicle TypesTraffic VolumeTraffic CompositionQueueingTime of the DayVehicle SpeedVehicle GapWaiting TimeCentral IslandSpeed BumpsAbnormal Path
 [27]AutoCAD, Avidemux,
Corel VideoStudio
PET (−6 s to 6 s) GEVPETs
 [28]AutoCAD, Avidemux,
Corel VideoStudio
PET (−6 s to 6 s) GEVPETs
 [29]Corel VideoStudioPET (−1 s to 1 s) GLMCCs
 [30]AutoCAD, AVS,
Corel VideoStudio
PET (−1 s to 1 s) GLM
(TNB)
CCs
NCCs
 [31]AutoCAD, AVS,
Corel VideoStudio,
Avidemux
PET (−1 s to 1 s) GLM
(Tweedie)
CCs,
NCCs
 [32]-PET (<3.5 s) * CDFPETs
 [33]KinovaPET * BLMCCs
 [34]Autodesk,
Corel VideoStudio
PET (<2.5 s), CS ** --
 [35]KinovaPET (<6 s), TTC (<5 s),
CS
GLMCCs
 [36]Adobe CS6PET (<1.5 s), CRS ** --
 [37]AutoCAD,
Corel VideoStudio,
Movie maker
PET (<8 s) GEVPETs
 [38]Kinova, MPCTTC (<1.41 s) GPRMCCs,
NCCs
oursCustom programming
using CV and zones
- ✓ † GLM
(Tweedie)
RoWVs
Note: * studies are related to identifying appropriate PET threshold values; ** proposes novel speed-based SSMs based on PET, and CRS refers to as critical relative speed; † also uses crossing time. NCCs refers to non-critical conflicts.
Table 2. Descriptive statistics of selected variables related to RTVs.
VariablesMinimumMeanMaximumStandard Deviation
RoWVs1.006.4428.005.34
waiting time (s)1.277.5741.477.30
crossing time (s)1.003.8934.674.27
turn error4.7818.3934.385.70
interacted CTVs1.0012.7746.0010.01
early-yielded CTVs0.003.6427.005.31
Table 3. Cross-comparison of the Tweedie model with the Poisson model.
ModelAICBICLLLL(0)McFadden Pseudo- R 2 RMSEMPE
Tweedie1872−2292−930−12710.272.02−18%
Poisson1946−1872−967−16240.402.00−27%
Table 4. Tweedie model summary.
VariablesCoefficientStd. Errorp-Value
Intercept0.88570.0860.000
waiting time−0.02550.0050.000
crossing time−0.03340.0060.000
turn error0.01250.0040.002
interacted CTVs0.08620.0040.000
early-yielded CTVs−0.06170.0050.000
Table 5. Class-wise average values of maxYR °/s parameter related to unhindered traffic from approach 2.
ClassAverage
car0.8159
2W1.7209
3W2.9826
truck0.8027
Table 6. Class-wise average values of minJerk  m / s 3 and maxYR °/s parameters related to unhindered traffic (RoWC-CY-CTVs) from approach 1.
ClassVariableAverage
carminJerk−2.6904
maxYR1.4283
2WminJerk−1.9505
maxYR2.0242
3WminJerk−2.1337
maxYR1.6644
truckminJerk−3.6614
maxYR1.5158
Table 8. Descriptive statistics of travel times of different types of CTVs and comparison using congestion duration and TTI metric.
Types of CTVsTravel Time (s)Congestion
Duration (min)
TTI
Mean Std Min Max
Unhindered5.9511.3512.1338.000--
(approach 2)
RoWC-CP-CTVs11.6703.5185.26720.2673.4611.961
RoWV-LC-CTVs20.6568.3447.86747.2007.5173.471
Table 9. Comparison with existing vision-based studies employing evasive actions (EA) for traffic analysis (conflicts, congestion) at intersections.
RefTraffic Data Extraction MethodsSiteParametersSSMs UsedNon-Compliant BehaviourCompliant BehaviourStudy Outcomes
ModalityToolsCV TechniquesCCLCCPYield
 [8]Mounted
camera
Feature-based
tracking (KLT)
Intersections †Vehicle heading
angle and speed
Yaw rate, Jerk,
Deceleration rate,
TTC
---Showed EA-based SSMs have high
correlation with CC than TTC
 [9]Mounted
camera
Feature-based
tracking (KLT)
Middle block
shared road †
Vehicle heading
angle and speed
Yaw rate, Jerk,
TTC
Showed yaw rate is better than TTC
and Jerk for measuring conflict
severity related to powered 2Ws
 [10]Mounted
camera
Feature-based
tracking (KLT)
IntersectionsVehicle speedJerk,
TTC
---Showed EA detection improves the
identification of CCs.
 [39]Mounted
camera
T-analyst,
MATLAB
Signalised
intersections
Vehicle trajectoriesDeviation in
driving path, TTC
---Demonstrated the feasibility of
detecting EA from unhindered
trajectories.
 [40]UAVSAVETRAXUndivided
highway †
- Δ y (lateral space),
Δ v (speed)
--EA help in classifying yield
behaviours (e.g., no yield, space,
speed, both)
oursUAVYOLOv8, SIFT,
BoT-SORT
Uncontrolled
T-intersections †
Vehicle heading
angle and speed,
congValue, OPI, TTI
Yaw rate, Jerk,
PET, CS, PSD
✓,
condPET
✓,
congValue
Presented a case study of evaluating
right-turning behaviour in terms of
CCs and localised congestion,
Proposed a novel aggregated
EA-based SSM, condPET,
for identifying CCs and a novel
parameter, congValue,
for congestion detection
Note: ♠ traffic data are extracted using CV techniques; ⟡ traffic data are extracted using tools; † study carried out for non-uniform traffic conditions.
Disclaimer/Publisher’s Note: The statements, opinions and data contained in all publications are solely those of the individual author(s) and contributor(s) and not of MDPI and/or the editor(s). MDPI and/or the editor(s) disclaim responsibility for any injury to people or property resulting from any ideas, methods, instructions or products referred to in the content.