Article

A Physical-Layer Threat Detection Framework for Secure IoT and Smart Grid Networks Using HHT-Based Multimodal Deep Learning


1
Hangzhou Applied Acoustics Research Institute, Hangzhou 310023, China
2
School of Computer Science, Central China Normal University, Wuhan 430079, China
*
Author to whom correspondence should be addressed.
Technologies 2026, 14(7), 423; https://doi.org/10.3390/technologies14070423
Submission received: 12 May 2026 / Revised: 3 July 2026 / Accepted: 8 July 2026 / Published: 11 July 2026
(This article belongs to the Special Issue Research on Security and Privacy of Data and Networks)

Abstract

Secure IoT and smart grid networks depend on reliable hardware operation to maintain continuous service and system availability. Physical-layer abnormalities such as partial discharge (PD) can weaken infrastructure components and disrupt connected systems before conventional monitoring methods detect the problem. PD is one of the earliest indicators of abnormal hardware activity in electrical infrastructure. If it is not detected in time, it can damage equipment, reduce system reliability, and increase the risk of service interruption in intelligent network environments. Existing detection methods often struggle with PD signals because these signals are non-stationary, vary over time, and frequently contain noise. This limits reliable physical-layer threat detection in secure IoT and smart grid networks. This study presents an integrated physical-layer threat-detection framework for secure IoT and smart grid networks that combines adaptive HHT-based signal decomposition with multimodal deep learning for early hardware threat identification. The framework first applies the Hilbert–Huang Transform (HHT) to decompose PD signals and extract time–frequency features that describe discharge behavior. A convolutional neural network with an attention-based fusion mechanism then learns patterns from electrical and acoustic signals. The model classifies hardware condition into normal operation, early abnormal activity, and critical discharge states associated with potential hardware threats. The framework is evaluated using two public datasets: the Dataset of Partial Discharge and Noise Signals and the Partial Discharge Localization (PD-Loc) dataset available through the IEEE DataPort. Experimental evaluation shows that the proposed framework achieves 97.8% detection accuracy, a 97.0% F1-score, and an average AUC of 0.98. The framework maintains 94.6% accuracy under severe noise conditions (10 dB SNR) and performs inference in approximately 12 ms per sample. Furthermore, component-wise analysis further shows that HHT-based feature extraction improves detection accuracy from 91.8% to 95.6%, while multimodal learning increases the final accuracy to 97.8%.

1. Introduction

Secure IoT systems, smart grids, and edge-enabled infrastructures increasingly rely on intelligent networks to maintain continuous and reliable operation. The growing interconnection of hardware devices improves automation and data exchange, but it also increases exposure to operational and physical-layer threats. Hardware abnormalities that remain undetected can gradually weaken infrastructure reliability and interrupt connected services. Partial discharge (PD) is one of the earliest indicators of abnormal hardware activity in electrical systems and often appears before major equipment failure occurs [1]. Early detection of PD is important for maintaining the operational integrity, availability, and reliability of intelligent network infrastructure. However, PD signals are nonlinear, non-stationary, and often contaminated by environmental noise. These characteristics cannot be fully captured by traditional signal-processing approaches, such as the Fourier transform and fixed time–frequency analysis [2]. This challenge reduces detection reliability, particularly in real-world monitoring environments where signal characteristics change continuously over time.
Recent studies have investigated data-driven methods to improve physical-layer monitoring and threat detection. Olasehinde et al. [3] proposed a multi-domain threat analysis framework (MM-AD) for cyber–physical power systems. It jointly examines vulnerabilities, threats, and control-structure anomalies. Harizaj et al. [4] addressed feature-drift modeling and privacy risks in radio-frequency fingerprinting for deployable physical-layer security. Adjewa et al. [5] introduced a lightweight edge-deployed Transformer model (Trans) that offloads embeddings for intrusion detection in IoT settings. Gao et al. [6] developed a lightweight multi-classification deep learning model (Edge-DL) for intrusion detection in resource-constrained edge IoT networks. These approaches learn patterns directly from data and can process large volumes of sensor information. Despite these improvements, two important challenges remain. First, many models struggle to capture the time–frequency behavior of PD signals. Second, practical monitoring systems still face difficulty integrating heterogeneous sensor information such as electrical and acoustic measurements.
To address these issues, researchers have started combining adaptive signal decomposition techniques with deep learning methods. The Hilbert–Huang Transform (HHT) is effective for analyzing nonlinear and non-stationary signals because it decomposes signals into intrinsic mode functions that reveal hidden discharge patterns [7]. When combined with multimodal learning, the model can capture both signal structure and cross-sensor relationships. However, a unified framework that combines HHT-based signal decomposition with multimodal deep learning for physical-layer threat detection in secure IoT and smart grid networks remains limited in current research. From a security perspective, abnormal PD activity can be viewed as a physical-layer anomaly that threatens the availability and reliability of connected infrastructure. Detecting such abnormalities at an early stage complements existing intrusion detection approaches by extending monitoring to include hardware-level threats in intelligent networks.
This paper presents an integrated physical-layer threat-detection framework for secure IoT and smart grid networks that combines adaptive HHT-based signal decomposition with multimodal deep learning for early hardware threat identification. The proposed framework processes PD signals and identifies abnormal hardware conditions at different operational stages. The method combines HHT-based feature extraction with a multimodal deep learning model that includes convolutional feature learning and attention-based sensor fusion. The system is designed to distinguish between normal operation, early abnormal activity, and critical discharge conditions associated with hardware threats. The framework is evaluated using recent public PD datasets and compared with modern deep learning baselines. The contribution lies not in individual signal-processing or deep-learning algorithms but in a unified framework integrating adaptive signal decomposition and multimodal learning for improving threat detection in intelligent network environments. The key contributions of this work are as follows:
  • An integrated physical-layer threat-detection framework that combines adaptive HHT-based signal decomposition, multimodal feature learning, and attention-guided fusion for early hardware threat identification in secure IoT and smart grid networks;
  • A unified multimodal learning pipeline that integrates synchronized electrical and acoustic sensing to improve physical-layer threat detection and abnormal hardware activity recognition;
  • A benchmarking evaluation using recent public PD datasets and modern deep learning baselines, showing that adaptive time–frequency analysis improves detection accuracy and robustness under noisy conditions;
  • A practical monitoring framework that supports early identification of hardware threats and strengthens the reliability and operational resilience of intelligent network infrastructure.
The rest of this paper includes four sections. Section 2 summarizes the latest research on PD detection, as well as new intelligent monitoring methods. Section 3 describes how the framework and model were developed. Section 4 outlines the datasets, test conditions, and evaluation parameters used for all experiments. Section 5 contains the experimental results, a comparison with previous PD detection research, and a discussion. Finally, Section 6 concludes the paper and outlines future research directions.

2. Related Work

Research on physical-layer monitoring in secure IoT and smart grid networks has increasingly focused on intelligent, data-driven approaches to early threat detection. Partial discharge (PD) analysis has become an important research direction because PD activity often represents an early indicator of abnormal hardware behavior in connected electrical infrastructure. Pioneering work was conducted on frequency-domain analysis to make sense of PD activity and detect abnormality in insulation systems. These studies were informative about discharge behavior but had difficulty capturing the non-stationary and short-duration nature of actual PD events [8].
To overcome this shortcoming, scientists developed time-frequency analysis techniques such as adaptive feature extraction and the wavelet transform. Such methods enhanced the interpretation of the PD signals since they depict localized variations in signal energy and transient behavior. Some recent research findings indicate that wavelet-based decomposition, coupled with statistical feature learning, enhances the classification performance of physical-layer monitoring systems [9,10]. Nevertheless, these methods also rely on predetermined basis functions, reducing their flexibility in adapting to changing signal characteristics across operating conditions.
Several benchmark methods are commonly used for PD diagnosis. One popular approach combines wavelet transforms with CNNs (Wavelet-CNN). Wavelet decomposition keeps the transient features of discharge pulses, and the CNN then learns useful patterns from these time-frequency representations. A related method uses the short-time Fourier transform (STFT) to generate spectrograms, which a CNN classifies into discharge types. This STFT-CNN approach works well under controlled lab conditions. Another common technique is empirical mode decomposition (EMD). Because PD signals are non-stationary, EMD breaks them into simpler oscillatory components before classification. Older but still widely used methods include SVM and Random Forest. These rely on handcrafted features, such as statistical or frequency-domain measures, rather than learning features automatically. More recent work has moved toward deep learning. Some PD-specific models now combine CNNs, recurrent networks, and transformers, sometimes with multimodal inputs, to improve accuracy and handle noisy conditions. Together, these methods form an important set of references for PD diagnosis and show how the field has shifted from handcrafted features toward adaptive, deep-learning-based approaches.
To improve physical-layer threat detection, researchers increasingly use deep learning techniques for PD pattern recognition. The use of convolutional neural networks (CNNs) and hybrid networks is on the rise, as they can learn discriminative features directly from signal representations such as spectrograms or time-frequency maps. Recent studies indicate that CNN-based and CNN-BiLSTM architectures can improve the accuracy of PD classification by accounting for the spatial and temporal patterns of signals [11,12,13]. More recent research examines transformer-based systems and enhanced neural networks to improve the analysis of complex monitoring measurements in intelligent sensing systems [14]. These methods minimize manual design of features and enhance generalization in other operating environments. Multimodal sensing is another direction. The modern physical-layer monitoring systems gather data from various sources, including electrical, acoustic, and environmental sensors. The combination of these heterogeneous signals enhances detection reliability and system resilience, as different sensors focus on different aspects of discharge activity. A number of recent works attest that multimodal fusion models enhance the detectability of the underlying system and reduce false alarm rates in complex monitoring scenarios [15,16,17]. These results highlight the importance of incorporating a combination of sensing modalities into an integrated learning system.
Simultaneously, there has been rapid developments in the field of anomaly detection in intelligent infrastructure and IoT systems. AI-based monitoring frameworks are widely used to analyze streams of operational data and detect abnormal behavior in networked systems. Recent research indicates that deep learning-based anomaly detection enhances system reliability by detecting early indicators of faults and performance degradation [18,19,20]. These advances show that intelligent monitoring can aid the sustainability of large-scale infrastructure and equipment.
Advances in intelligent network security increasingly rely on machine learning to identify abnormal behavior in connected environments. Reference [21] developed a learning framework for wireless sensor network security in IoT environments by combining data balancing, feature selection, and ensemble learning, reporting high detection accuracy for abnormal traffic patterns. Similarly, Ref. [22] introduces a hybrid deep learning architecture that improves feature discrimination for IoT intrusion detection through attention-based spatial learning. Beyond detection performance, recent reviews emphasize that explainable deep learning has become important for intrusion-detection systems, particularly in resource-constrained IoT environments where computational efficiency and model transparency must be balanced [23]. At the network edge, lightweight deep learning methods have also been proposed to support real-time intrusion detection under limited computational resources. The work in [24] develops an edge-oriented intrusion-detection model that reduces feature dimensionality while maintaining efficient performance in IoT deployments. Recent studies have also started extending anomaly detection to the physical layer. A study outlined in [25] demonstrates that machine learning can identify abnormal physical-layer behavior in 5G and 6G-enabled charging networks using signal-level characteristics rather than higher-layer communication protocols. Likewise, reference [26] shows that temporal deep learning models can detect early jamming activity in drone ad hoc networks before communication degradation becomes severe.
Despite these advances, an important gap remains. Many PD studies focus mainly on classification accuracy, while signal-processing studies emphasize detailed discharge analysis. Few studies combine adaptive signal decomposition and multimodal deep learning within a unified framework for physical-layer threat detection in secure IoT and smart grid networks. In addition, limited attention has been given to integrating electrical and acoustic sensing for early identification of abnormal hardware behavior in intelligent network environments. This study addresses these gaps by integrating HHT-based signal analysis with multimodal deep learning to improve physical-layer threat-detection and intelligent infrastructure monitoring.

3. Materials and Methods

3.1. Dataset

The proposed framework is evaluated using two publicly available datasets that capture real PD behavior and realistic monitoring conditions. This assists in evaluating both signal classification performance and multimodal detection capability. The selected datasets are intended to evaluate the proposed framework at the physical layer, where abnormal PD activity represents early hardware degradation in electrical assets commonly deployed in smart grids and industrial IoT systems. The datasets provide representative discharge behavior collected under controlled experimental conditions and enable reproducible evaluation of signal processing, multimodal feature learning, and threat classification. However, they are not intended to represent complete smart-grid deployments, heterogeneous IoT infrastructures, communication network traffic, or adversarial cyber–physical environments. Therefore, the experimental evaluation focuses on validating the proposed physical-layer threat-detection methodology rather than modeling every operational aspect of intelligent network deployments.
The mechanism represents an intelligent monitoring system deployed within the electrical infrastructure, where sensors continuously monitor equipment condition. The goal is to detect PD events early and distinguish them from normal electrical activity and environmental noise. To imitate this scenario, two recent public datasets are used. The first dataset is the Dataset of Partial Discharge [27] and Noise Signals available through IEEE DataPort. It contains labeled electrical measurements collected from controlled high-voltage laboratory experiments. The dataset includes multiple PD categories, such as internal discharge, surface discharge, corona discharge, and background electrical noise. Each record represents a time-series waveform shown in the equation below.
x ( t ) = { x 1 , x 2 , x 3 , , x N }
Here, N simply stands for the number of samples in that specific signal section. The signals in this dataset were recorded at 40 MHz, which is fast enough to catch those quick, fleeting PD pulses. This first dataset holds about 12,000 signal samples, covering a range of discharge types and noise conditions. Each sample provides several pieces of information, as follows: the time-domain waveform, a label for the discharge type, the signal’s duration, and its measurement setup details. We picked this one because it has really well-labeled discharge patterns, which are crucial for training and testing our detection models effectively. It looks into the ability of the proposed framework to distinguish different PD categories under controlled laboratory conditions. Its well-defined class labels enable reliable assessment of feature extraction, discharge classification, and robustness against measurement noise. Then there is the second dataset, known as the PD-Loc dataset [28]. This dataset provides a look at a real-world monitoring setup in which several sensors detect the same discharge event. It includes synchronized electrical and acoustic signals captured by sensors placed around the equipment. The sampling rate here is 2 MHz, which is good enough to capture both the electrical and sound-based PD signals. This dataset contains roughly 8500 multimodal signal samples, each with details such as the electrical waveform, the acoustic emission signal, sensor position coordinates, an event label, and time-synchronization information. It helps us check how well our system can learn from different kinds of signals. Unlike the first dataset, the PD-Loc dataset is used to evaluate multimodal sensing and feature fusion by combining synchronized electrical and acoustic measurements. This enables assessment of the proposed attention-based fusion strategy under representative monitoring conditions where multiple sensing modalities observe the same discharge event.
After preprocessing, the two datasets were organized into a unified evaluation framework while preserving their individual sensing characteristics. The PD Noise dataset was primarily used to learn discriminative discharge patterns from labelled electrical measurements, whereas the PD-Loc dataset was used to validate multimodal learning using synchronized electrical and acoustic observations. Although the datasets differ in sensing configuration and sampling frequency, combining them enables comprehensive evaluation of the proposed physical-layer threat-detection framework across both single-modal and multimodal monitoring scenarios. We then divided this dataset, as shown in Table 1 below.
This split ensures that the model learns patterns during training while the final evaluation remains unbiased. To simulate realistic operational conditions, noise is injected into selected samples at different signal-to-noise ratios. The noisy signal is generated as shown in the equation below.
x n ( t ) = x ( t ) + n ( t )
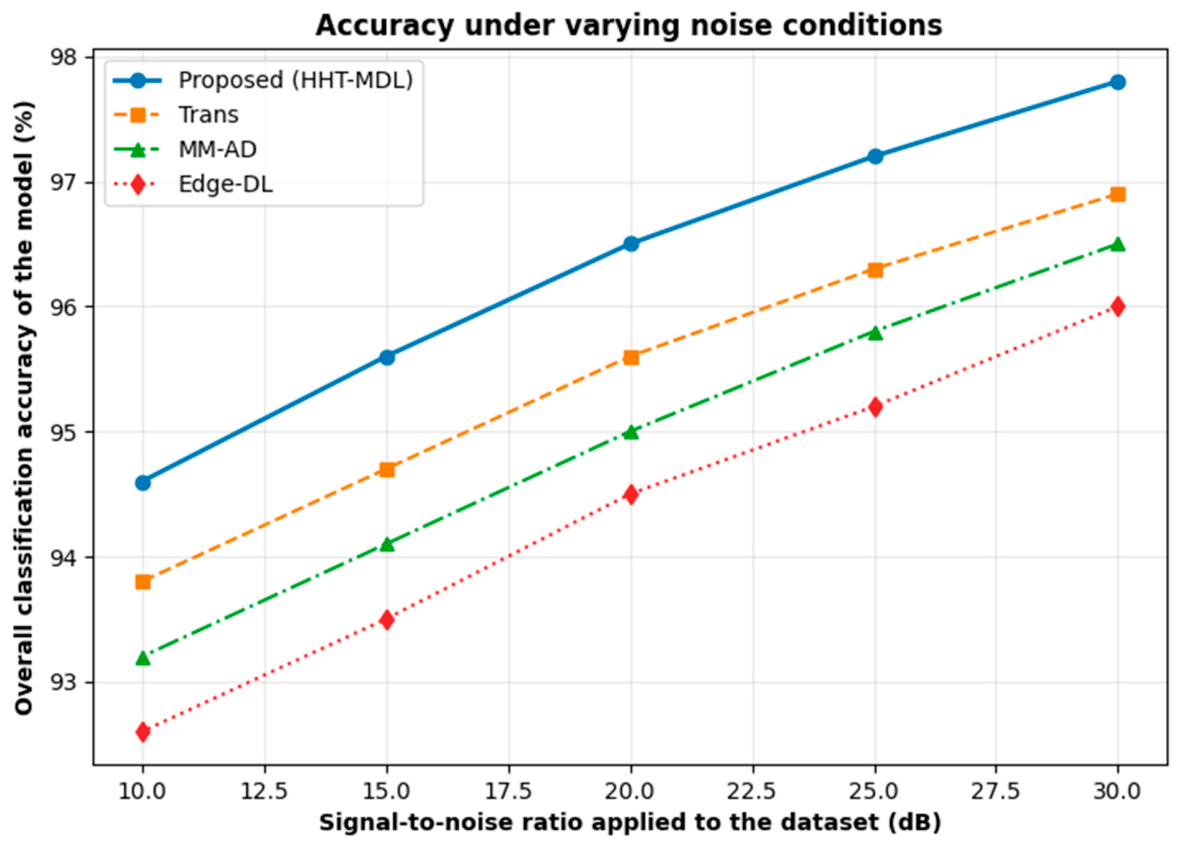
where n ( t ) represents Gaussian noise. The experiments consider SNR levels of 30 dB, 20 dB, and 10 dB, which reflect mild, moderate, and severe noise conditions typically observed in field monitoring systems.

3.2. Signal Preprocessing

After the monitoring signals are collected, they cannot be analyzed directly. Raw signals usually have measurement noise, amplitude variation, and sensor-specific distortions. These aspects may obscure critical patterns in discharge data and reduce the usefulness of machine learning models [29]. The preprocessing phase thus prepares the signals to enable the reliable extraction of meaningful features. The raw signals from the two datasets are initially normalized and ready for feature extraction. The preprocessing pipeline is set up with consideration of the nature of the dataset’s signals. PD signals tend to occur in the 300 kHz to 3 MHz Frequency range. Frequencies outside this range are typically attributed to environmental effects or measurement artifacts. A 4th-order Butterworth band-pass filter is used to isolate PD activity. The filtered signal is given as per the equation below.
x f t = x t h t
where h ( t ) is the impulse response of the band-pass filter with cutoff frequencies, as follows:
f l o w = 300 kHz
f h i g h = 3 MHz
This filtering process takes out both the slow, wavering parts of the signal and any fast, static-like noise. For the PD Noise data, this makes the signals much clearer by removing the high-frequency clutter from our measurements. With the PD-Loc data, filtering also helps us pinpoint the important sound patterns we are looking for. Signals recorded by different sensors can sometimes differ in strength, often due to slight hardware differences or the sensor’s distance from the discharge. To ensure all these signals are on an even footing when we feed them into our system, we normalize them using min-max normalization.
x n o r m ( t ) = x f ( t ) x m i n x m a x x m i n
where x m i n is the minimum signal value and x m a x is the maximum signal value. With normalization, all signals are guaranteed to be in the range [0,1]. It ensures the stability of the deep learning model during training. The PD events are short, transient pulses embedded within longer recordings. To ensure effective capture of these events, signals are split into fixed windows of 2048 samples in the first dataset and 1024 samples in the PD-Loc datasets due to their lower sampling frequency. A segment is represented mathematically as per the equation given below.
S i = x 1 , x 2 , x 3 , , x L
where L = 2048 in terms of the PD Noise dataset, and for PD-LOC, the value of L = 1024. This segmentation makes sure each input sample contains relevant discharging activity. Both electrical and acoustic signals from several sensors make up the PD-Loc dataset. To support multimodal learning, these signals need to be temporally aligned. Let S i e l e c   represent the electrical signal segment and S i a c o u s t i c represent the acoustic emission segment. The multimodal sample is constructed as
M i = S i e l e c , S i a c o u s t i c
This combination ensures that the two signals correspond to the same discharge event. Following preprocessing, each signal segment is sent to the HHT stage, where it is adaptively split into components. The cleaned signals, normalized amplitudes, segmented PD events, multimodal paired samples, and noise-controlled evaluation data are now available in the prepared dataset. This organized input helps the proposed framework capture key PD characteristics and identify hardware threats in intelligent networks. During preprocessing, the signals from both datasets are incorporated into the experimental pipeline, albeit with slightly different purposes, to test the framework as a whole. The Dataset of Partial Discharge and Noise Signals is primarily used to train the detection model, as it contains a substantial number of labeled electrical signal samples under various PD conditions and noise scenarios. These signals enable the model to learn the appearance of discharge patterns in different operating states. Instead, the PD-Loc dataset is used to assess the proposed framework’s multimodal capacity, as it comprises concurrent electrical and acoustic recordings collected by a variety of sensors. In experiments, both datasets are processed through an HHT-based feature-extraction stage using electrical signals, and multimodal PD-Loc samples are used to train and test the sensor-fusion component of the deep learning model. In practice, it implies that the framework is initially trained on generalized PD detection using the original dataset and subsequently tested for resilience and multimodal learning capacity on the PD-Loc dataset. This assessment plan is a means of ensuring that the recommended system not only works in the controlled environment but also in real-world intelligent network monitoring settings.

4. Proposed Hardware Threat-Detection Framework

The proposed framework operates under a well-defined goal, as follows: to transform sensor signals into meaningful decisions about the condition of the hardware components. This is achieved through the combination of adaptive signal processing along with multimodal deep learning approaches. In particular, the architecture aims to solve two critical challenges. The first challenge is that the PD signals are nonlinear and have temporal characteristics.

4.1. Framework Overview and Architecture

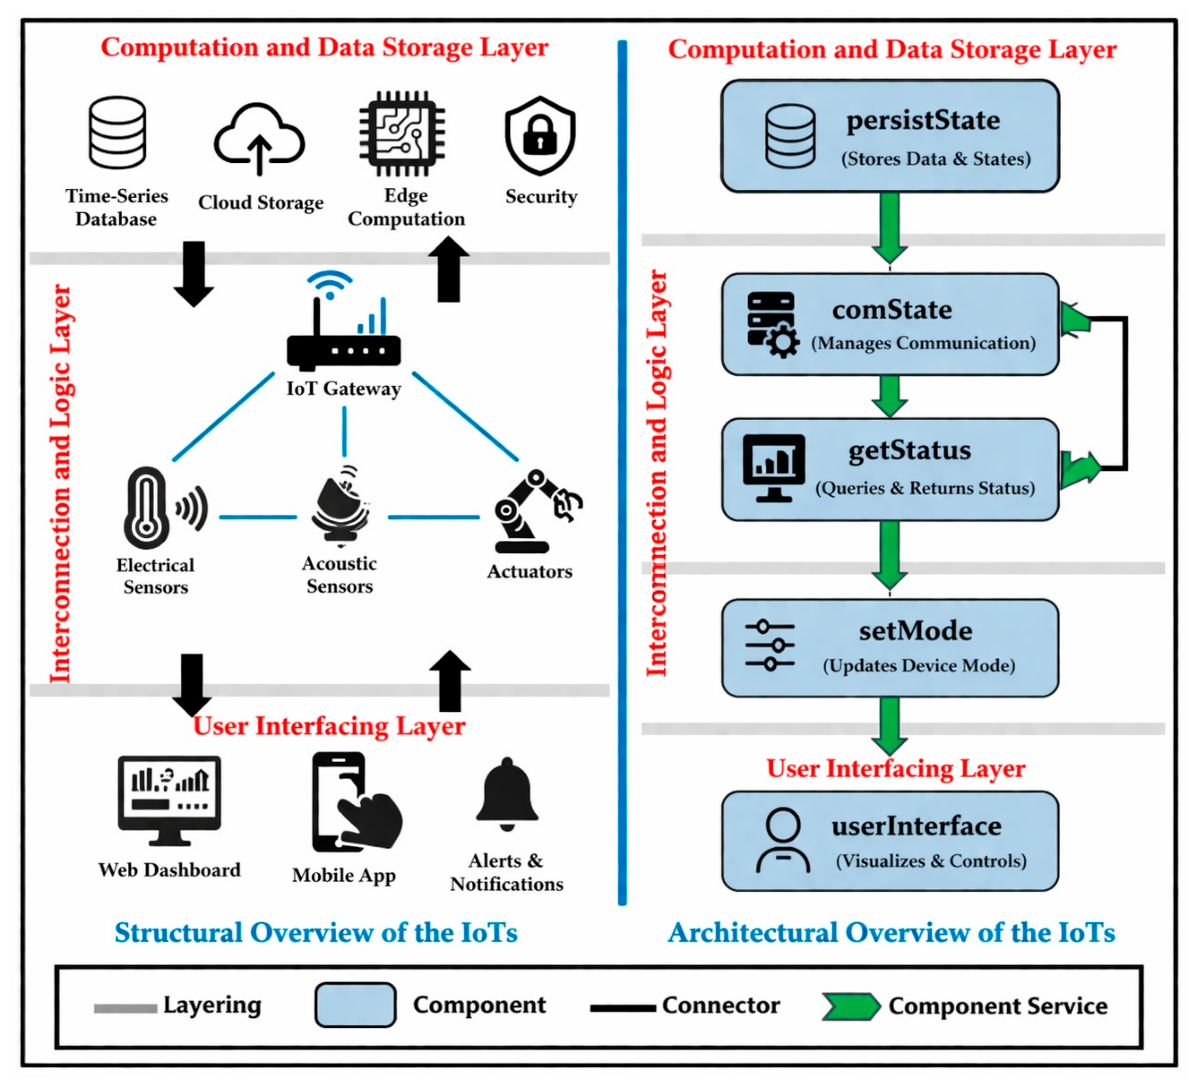
The suggested framework is an approximate model of a hardware monitoring system in which electrical equipment is continuously monitored using distributed sensing units. The system is indicative of a real implementation in intelligent networks such as substations and industrial IoT systems, where several sensors are mounted on critical assets.
There are two key devices in the sensing layer. Partial discharge activity is detected by high-frequency electrical sensors, such as ultra-high-frequency (UHF) sensors or current transformers, as fast transient pulses. Simultaneously, mechanical waves produced during discharge events are recorded by acoustic emission sensors, which are generally piezoelectric transducers. These two senses perceive the same physical phenomenon in various ways. The data acquisition unit captures the data of both sensor types at a high sampling rate. The sampling rates of electrical and acoustic signals are 40 MHz and 2 MHz, respectively, which are consistent with the datasets used in this study. The signal streams are time-stamped and stored as time-series waveforms. At this point, the collected signals are directly related to the structure of the Dataset of Partial Discharge and Noise Signals and the PD-Loc dataset above. These datasets, in other words, are captured outputs from such sensing environments and are used in the study to model real deployment conditions. The obtained signals are then fed into the preprocessing stage. Band-pass filters are used to eliminate noise from environmental interactions and measurement devices. Signals are z-scored to minimize sensor variation and are divided into fixed-length windows. This transformation converts raw sensor streams into structured signal samples and aligns the data format with that of the dataset to be trained and tested.
Following preprocessing, the HHT is used to derive adaptive time-frequency features using the framework. This step breaks down every signal into intrinsic components that depict discharge behavior. The resulting feature maps represent changes in PD activity over time and serve as input to the learning model. These features are processed by the deep learning module, which includes electrical and acoustic signal branches. The design maintains modality-specific features and allows joint learning. Convolutional layers detect spatial patterns; recurrent units learn temporal dependencies between signal segments.
The framework will then undergo multimodal fusion via an attention mechanism. This step assigns weights to each modality based on its contribution to the detection task. The system dynamically adjusts to focus on signal quality and discharge characteristics. Lastly, the merged attributes are sent to a single classification layer that predicts the system’s condition. The output indicates that the signal is either a normal operation or a specific type of partial discharge. What is taken as a threat indicator of hardware is this decision. The entire system works as a pipeline that is continuously described in Figure 1 below.
This design ensures that raw sensor measurements are progressively transformed into structured datasets, then into meaningful features, and finally into reliable detection decisions. By explicitly linking sensing hardware with dataset representation and learning models, the framework reflects both practical deployment and experimental evaluation.

4.2. HHT-Based Signal Modeling

At this point, each tiny piece of data is a neat, standardized record of electrical or sound activity. But these signals are still just raw recordings over time; they do not immediately reveal the changing patterns of PD. So, in the next step, specific details regarding changes in discharge signals are developed over time. PD signals are tricky, and they do not follow a straight line; they are constantly changing. Their frequency patterns can shift very quickly, even in short bursts, particularly when there is a lot of noise. Standard analytical methods cannot capture these rapid changes because they rely on fixed tools that do not adapt. The system uses HHT to correct the changes. This is because it adjusts itself to match the specific patterns in each part of the signal. We then decompose each component of the input signal using a method called EMD. This basically means the signal is broken down into several intrinsic mode functions that, when added together, reconstruct the original signal.
S i ( t ) = k = 1 K I M F k ( t ) + r ( t )
where I M F k ( t ) represents the k t h intrinsic component, and r ( t ) is the residual. Each IMF satisfies the following two conditions: the numbers of extrema and zero crossings differ by at most 1, and the local mean is 0. These properties ensure that each IMF captures a physically meaningful oscillatory mode.
This decomposition separates overlapping signal components that originate from different discharge mechanisms. For example, high-frequency IMFs often correspond to sharp PD pulses, while lower-frequency IMFs capture slower variations or noise remnants. This directly aligns with the filtered signals obtained, where unwanted frequency bands have already been removed. After decomposition, the Hilbert transform is applied to each IMF to extract instantaneous signal characteristics, as follows:
H k ( t ) = 1 π I M F k ( τ ) t τ d τ
The analytic representation of each component is then constructed as follows:
Z k ( t ) = I M F k ( t ) + j H k ( t ) = A k ( t ) e j ϕ k ( t )
where A k ( t ) is the instantaneous amplitude and ϕ k ( t ) is the instantaneous phase. These quantities describe the energy and temporal behavior of the signal. The instantaneous frequency is computed as follows:
f k ( t ) = 1 2 π d ϕ k ( t ) d t
This formulation provides a time-resolved frequency representation, which is essential for capturing short-duration discharge events. Unlike Fourier-based methods, this approach does not assume stationarity and therefore adapts to variations across different PD types and noise levels. The final feature representation is constructed by combining amplitude and frequency information across all IMFs, as follows:
F i = { A k ( t ) , f k ( t ) } k = 1 K
For multimodal samples defined in Equation (8). The HHT process is applied independently to each modality. This produces the following two feature sets:
F i e l e c   and   F i a c o u s t i c
These feature maps preserve modality-specific characteristics while maintaining a consistent representation format. Electrical features emphasize discharge intensity and waveform sharpness, while acoustic features reflect propagation patterns and event localization.
This stage converts preprocessed signal segments into structured time–frequency representations that are directly compatible with deep learning models. The output features retain the physical meaning of the original signals while reducing noise influence and dimensional redundancy. By linking modules, the framework shows a continuous transformation from raw sensor data to informative features. These features are then passed to the deep learning architecture, where higher-level patterns are learned for hardware threat detection. The HHT process is shown in Figure 2 below.

4.3. Deep Learning Architecture

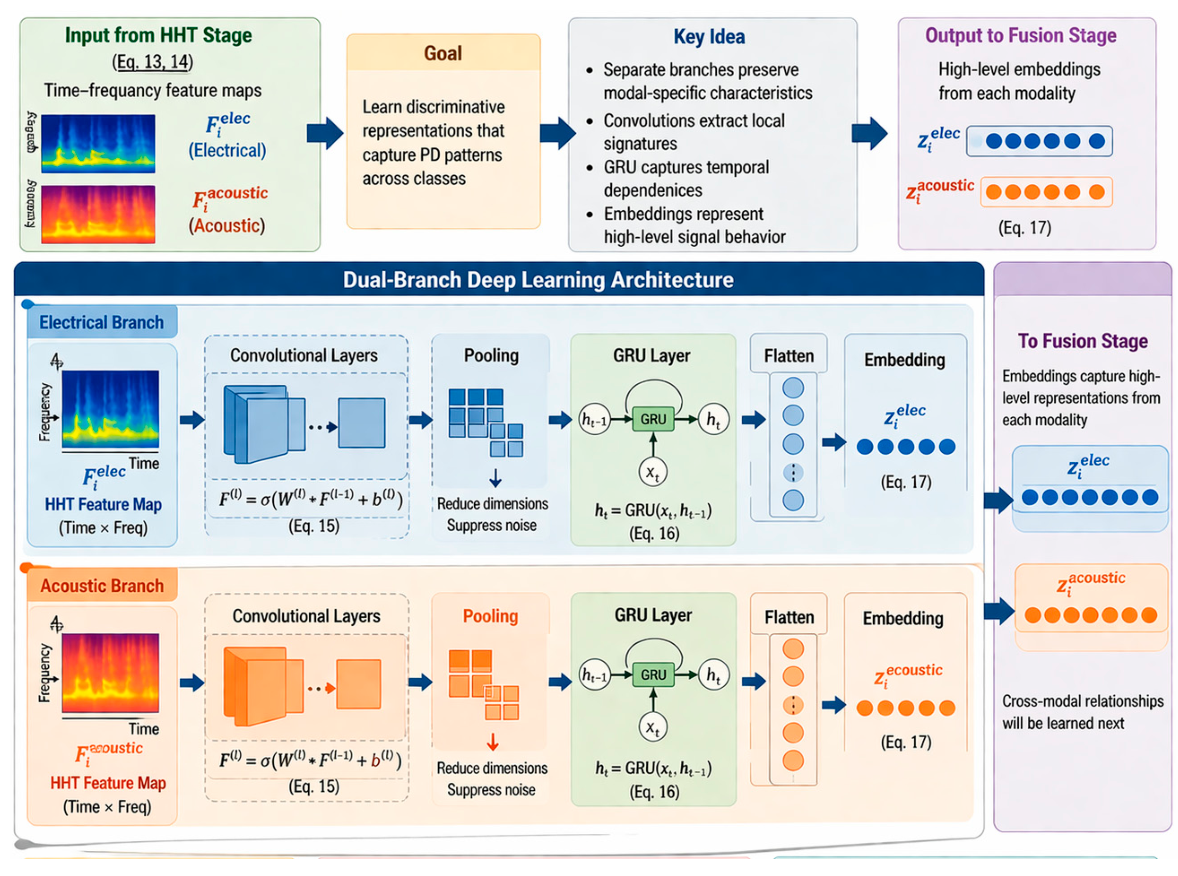
The HHT phase transforms each signal segment into regular time-frequency features, as in Equations (13) and (14). These features preserve the physical characteristics of the partial discharge (PD) activity but require a learning mechanism to recognize patterns between classes. The following step thus concerns acquiring discriminative representations from these features. The feature sets are considered two-dimensional inputs, with time and frequency as the feature space. In the case of multimodal samples, there are two inputs. A two-branch deep learning structure processes these inputs. The design isolates modalities at the first level to retain their peculiarities, and subsequently learns common representations gradually. Both branches start with convolutional layers that extract local patterns from HHT feature maps. Convolution operation can be defined as follows:
F l = σ ( W l F l 1 + b l )
where W l represents the kernel at the layer l , b l is the bias, and σ is the activation function. The input F 0 corresponds to the HHT feature map obtained in Equation (13). The convolutional layers capture patterns corresponding to discharges within each local region, using parameters such as pulse intensity and frequency changes. To further reduce the dimensions and eliminate noise from the convolutional output, pooling layers are used. By doing so, significant patterns can be captured efficiently. To capture the relationship between segments, the GRU layer is used in the proposed network. In particular, each segment vector sequence is computed as follows:
h t = G R U ( x t , h t 1 )
where x t is the input at time step t and h t is the hidden state. This step models how PD characteristics evolve across consecutive segments, which is important for distinguishing transient discharge events from persistent noise. The outputs from convolutional and recurrent layers are flattened into the following feature vectors:
z i e l e c   and   z i a c o u s t i c
These are the vector embeddings of electrical and acoustic signals at a very high level. At this point, the modality has been represented as an informative vector. The design of this architecture takes into account the structure of the dataset used. Samples without acoustic data from the PD Noise dataset will go through the electrical branch alone. However, samples from the PD-Loc dataset will go through both branches, as they contain information from two modalities. This allows the model to learn representations for both one-modality and multimodal inputs. The combination of feature extraction using convolutional layers and temporal modeling yields the instantaneous discharges of neurons and their evolution. This complements the adaptive features generated using HHT.
This design maintains continuity across the pipeline. Signals are first decomposed into meaningful components using HHT, then transformed into hierarchical representations using deep learning. The next stage builds on these embeddings to integrate information across modalities and improve detection accuracy. The Analysis of deep learning model architecture is shown in Figure 3 below.

4.4. Multimodal Feature Fusion

The deep learning stage produces modality-specific embeddings for each signal segment, as defined above. At this point, electrical features, z i e l e c , capture discharge intensity and waveform structure, while acoustic features, z i a c o u s t i c , capture propagation behavior and spatial cues. When considering the modalities individually, it does not account for the detection performance of the (event) as a whole because it is only part of the event. Thus, the next step is to combine all modalities so that the properties of each feature work together effectively to improve overall detection performance. Simply combining the features directly (concatenation) does not properly account for variances in signal quality across all conditions. For example, consider the low signal-to-noise ratio (SNR) conditions listed in Equation (2); in many cases, the electrical signals will degrade, while the acoustic signals will remain stable in amplitude. To address this issue, attention-based fusion has been employed to help determine the appropriate amount of weight to assign to each of the modalities when determining the overall confidence level for the detection of the event. The two feature vectors are first transformed into a joint feature representation.
z i = [ z i e l e c ; z i a c o u s t i c ]
where ; denotes concatenation. This combined vector forms the input for attention weight estimation.
Attention scores are computed using a learnable transformation, as follows:
α i = s o f t m a x ( W f z i + b f )
where W f and b f are trainable parameters. The softmax function ensures that the attention weights are normalized and sum to one. These weights determine how much each modality contributes to the final representation. The fused feature vector is then constructed as follows:
z i f u s i o n = α i e l e c z i e l e c + α i a c o u s t i c z i a c o u s t i c
This formulation allows the model to dynamically adjust its focus. When electrical signals provide clear discharge signatures. The increase in α i e l e c signifies a well-defined signal discharge signature as well as a change in model weights due to an increase in the strength of an acoustic signal’s data. The adaptive model yields robust performance across multiple signal states and noise levels. The new fusion mechanism is directly consonant with the structure of the dataset utilized in this study. For the PD-Loc dataset samples, both modalities (acoustic and electrical) are utilized and are fused together. Conversely, for the PD Noise dataset, only electrical samples exist, reducing the fusion to a single modality, as follows:
z i f u s i o n = z i e l e c
This guarantees uniform processing of datasets without creating artificial inputs. It is a small, informative embedding that captures the full behavior of every discharge event. This level is linked to the ultimate decision. The framework eliminates uncertainty and enhances classification reliability by integrating electrical and acoustic data in a controlled, adaptive manner. The resultant feature vector, z i f u s i o n , is then passed to the training objective. Here, the model learns to map fused features to hardware threat categories. It ensures the framework uses all available information and then produces a final prediction. The fusion stage gives a smaller representation that combines electrical and acoustic data. This representation codifies the intensity and the time behavior of PD events. The last step is to map this feature vector to a decision indicating the hardware’s condition. The formulation of the problem is a multi-class classification problem. The input samples are associated with one of the predefined classes. This involves regular functioning and various types of PD. The model gives a probability distribution of these classes by using a fully connected layer and then a SoftMax function, as follows:
y ^ i = s o f t m a x ( W c z i f u s i o n + b c )
where W c and b c are trainable parameters, and y ^ i shows the predicted class probabilities for the sample i . The training objective is defined using categorical cross-entropy loss, as follows:
L = i = 1 N c = 1 C y i , c l o g ( y ^ i , c )
where y i , c is the ground truth label, and y ^ i , c is the predicted probability for class c . This process of formulation penalizes incorrect predictions and encourages the model to assign high confidence to the correct class.
Regularization is used to improve generalization during training. For dropout, neurons will be deactivated with probability p = 0.5 in each fully connected layer. This way, the model does not rely on specific features and prevents overfitting due to the data’s structure.
The model parameters are trained using the Adam optimizer. The update equation is as follows:
θ t + 1 = θ t η m ^ t / ( v ^ t + ϵ )
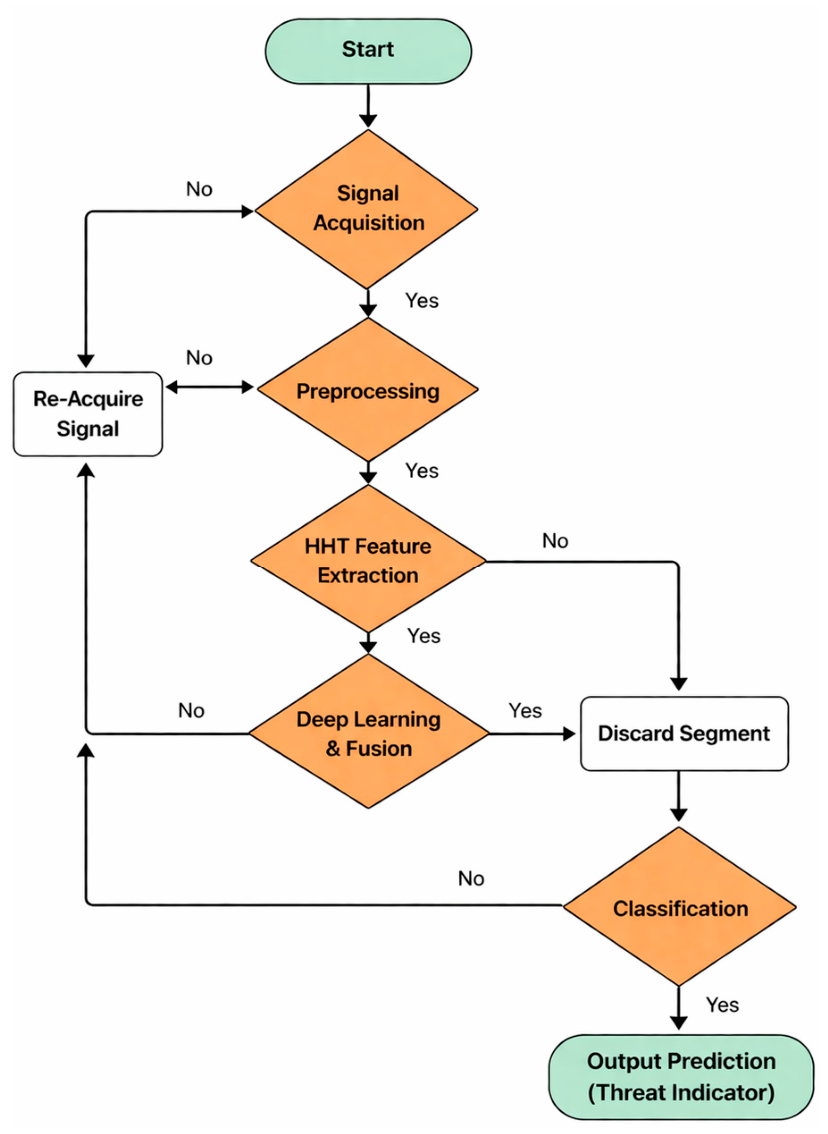
where θ represents model parameters, η = 10 4 is the learning rate, and m ^ t and v ^ t are bias-corrected moment estimates. The selected optimizer is Adam, because it dynamically adjusts the learning rates for each parameter. This property facilitates convergence for multimodal input. The training process uses mini-batches of 32 samples. Both training sets are mixed within each mini-batch, so that the model will learn patterns not only of single-modal, but also of multimodal type. An early stopping mechanism is used to avoid overfitting. Model training stops if there is no improvement for at least 10 epochs. As a result of optimization, the proposed model learns to distinguish between PD types and the presence of noise. Generated output may be considered as hardware threat indicators in smart network systems. Figure 4 illustrates the proposed framework algorithm.

5. Experiments and Results

5.1. Experimental Setup and Simulation Environment

The experiments evaluate the effectiveness of the proposed framework in detecting PD-based hardware threats using the datasets. The system is configured to reflect both controlled laboratory settings and realistic monitoring environments. The evaluation is carried out using two datasets. The Dataset of Partial Discharge and Noise Signals provide high-frequency electrical waveforms representing different discharge conditions under controlled laboratory settings. This dataset serves as the primary training source because it contains well-defined class labels and distinguishable discharge patterns. The Partial Discharge Localization (PD-Loc) dataset contains synchronized electrical and acoustic signals collected from multiple sensors. This dataset is used to evaluate multimodal learning capability and assess framework performance when heterogeneous sensing modalities are present.
The preprocessing pipeline described above is applied consistently to both datasets. The signals are filtered, normalized, and segmented into fixed-length windows before feature extraction and model training. The segmentation lengths are selected according to dataset characteristics, using 2048 samples for the PD Noise dataset and 1024 samples for the PD-Loc dataset. Once preprocessed, the datasets are organized into a unified experimental structure while preserving modality-specific characteristics required for multimodal analysis.
A 70–15–15 split is used to divide the datasets into training, validation, and testing subsets. The datasets were divided using a random training, validation, and testing strategy while maintaining class balance across the three subsets. This evaluation protocol measures the ability of the proposed framework to learn and classify PD patterns contained within the available benchmark datasets. The experiments are intended to evaluate classification performance under representative benchmark conditions rather than to establish generalization across different equipment types, sensing configurations, or independent deployment environments. The PD Noise dataset is primarily used for model training because it enables the framework to learn clear discharge characteristics from labeled electrical signals. The PD-Loc dataset is then used to evaluate multimodal performance and model generalization under more realistic sensing conditions involving synchronized electrical and acoustic measurements. The proposed framework was implemented in Python (Version 3.14)using deep learning libraries and trained on a GPU-enabled workstation to accelerate model optimization. Table 2 summarizes the key simulation parameters and dataset configuration used throughout the experiments.
Noise is injected into both datasets at controlled SNR levels to simulate realistic monitoring interference. Three SNR levels, namely, 30 dB, 20 dB, and 10 dB, are considered to represent mild, moderate, and severe noise conditions. Although these datasets capture realistic discharge behavior and synchronized sensing information, they do not include operational substations, heterogeneous IoT devices, communication-layer attacks, or adversarial cyber–physical scenarios. Consequently, the reported results demonstrate the effectiveness of the proposed detection methodology at the physical layer rather than serving as a complete validation of all smart-grid or IoT deployment conditions. This setup ensures that model evaluation reflects practical monitoring environments rather than ideal signal conditions. The experimental configuration, therefore, enables assessment of detection accuracy, multimodal learning performance, robustness to noise, and computational efficiency under realistic operating scenarios.

5.2. Hardware Threat Modeling and Detection Mechanism

The proposed framework is designed to detect physical-layer hardware threats that appear as abnormal partial discharge (PD) activity within electrical equipment operating in secure IoT and smart grid networks. In this study, a physical-layer threat is defined as any abnormal operating condition that gradually weakens the insulation system of network-connected electrical equipment and, if left undetected, may reduce system reliability, interrupt service availability, or lead to equipment failure. Unlike conventional intrusion detection systems that monitor network traffic or communication protocols, the proposed framework identifies threats directly from physical sensing measurements before significant hardware damage occurs.
The threat model considered in this work includes both unintentional and intentional threat sources. Unintentional threats originate from natural insulation ageing, electrical overstress, manufacturing defects, environmental conditions, improper installation, or long-term equipment deterioration. These conditions gradually increase PD activity and represent the most common causes of hardware degradation in electrical infrastructure. Intentional threats refer to physical tampering or deliberate damage that modifies the insulation characteristics of equipment and consequently produces abnormal discharge behavior. Regardless of their origin, all threat sources are represented through changes in the measured PD signals and are therefore treated as physical-layer threats by the proposed framework.
The framework assumes that a threat source influences the physical condition of the monitored equipment rather than the internal operation of the detection model. Consequently, abnormal operating conditions alter the electrical and acoustic characteristics recorded by the sensing devices. The proposed model does not assume that an attacker can modify the trained neural network, manipulate the HHT processing stage, or compromise the decision-making module as shown in Table 3. Instead, the framework focuses on identifying changes in hardware behavior that become visible through abnormal PD measurements.
The experiments use two publicly available datasets containing authentic sensor measurements collected under controlled laboratory conditions. Therefore, the proposed framework assumes that the acquired electrical and acoustic signals are genuine measurements. Signal spoofing, false data injection, replay attacks, and adversarial manipulation of sensor data are not represented in the available datasets and are therefore outside the scope of the present study. These security scenarios represent important directions for future work involving cyber–physical attack detection.
The proposed framework distinguishes PD-related abnormalities from ordinary electrical faults and environmental sensor noise by analyzing their characteristic signal behavior. Partial discharge produces localized transient pulses with distinctive time-frequency characteristics that appear during the early stages of insulation degradation. These patterns are effectively represented through HHT-based signal decomposition and remain observable even under moderate noise conditions. In contrast, ordinary electrical faults generally produce sustained waveform disturbances associated with more advanced equipment failures rather than localized discharge activity. Environmental noise is typically random, lacks the repetitive transient pulse structure of PD events, and does not exhibit the multimodal consistency observed between synchronized electrical and acoustic measurements.
To improve detection reliability, the framework analyses both electrical and acoustic sensing information simultaneously. Electrical measurements provide detailed information about discharge intensity and waveform characteristics, while acoustic measurements confirm that the observed event originates from a physical discharge rather than environmental interference. The attention-based multimodal fusion module combines these complementary sensing modalities before final classification. This reduces false alarms caused by noise and improves confidence in detected hardware threats.
The hardware operating conditions represented in the datasets are summarized in Table 4. These classes are directly obtained from the labelled PD Noise dataset and further validated using synchronized multimodal observations available in the PD-Loc dataset.
During inference, electrical and acoustic signals are continuously collected from the monitoring sensors and processed using the preprocessing pipeline described in Section 3. The HHT module decomposes each signal into adaptive time-frequency components, allowing the framework to capture the transient characteristics of PD activity. The extracted features are then processed by the multimodal deep learning architecture, where convolutional feature extraction, temporal learning, and attention-based feature fusion generate a unified representation of the monitored equipment condition. Finally, the classification layer assigns each signal segment to one of the predefined operating conditions. Any detected discharge activity is interpreted as an indicator of abnormal hardware condition and physical-layer threat severity, enabling early maintenance decisions before hardware degradation develops into equipment failure or service interruption.

5.3. Baseline Methods and Benchmarking Strategy

Benchmarking is done using the same datasets and conditions of testing. All baseline models are trained and tested on the PD Noise dataset and benchmarked for multimodality on the PD-Loc dataset, under the same preprocessing and data-splitting conditions. The chosen baselines consist of recent approaches based on deep learning, like detection transformers, multimodal anomaly detectors, and neural networks optimized for the edge. These approaches currently represent state-of-the-art techniques in intelligent monitoring systems, but usually require either a fixed feature representation or a weak multimodal representation. Every baseline model uses the same input signals obtained from the datasets. For the electrical only models, the PD Noise dataset is used, while for multimodal models, both PD Noise and PD-Loc datasets are used. Identical noise conditions are used to benchmark each approach against the proposed framework. For benchmarking, the same signal-to-noise ratio values are used during testing.
The advance deep learning methods are selected because our framework combines adaptive signal decomposition with multimodal feature learning. We chose four baselines for this reason. Transformer-based models represent modern sequence learning. VAE-based methods represent deep anomaly detection. MM-AD represents multimodal anomaly detection. Edge-DL represents lightweight monitoring for resource-constrained devices. Classical PD diagnosis methods include Wavelet-CNN, STFT-CNN, EMD-based classifiers, and SVM/RF with features. The proposed framework is tested against the four deep-learning baselines above, using the same preprocessing, training, and evaluation steps for all of them.

5.4. Performance Indicators

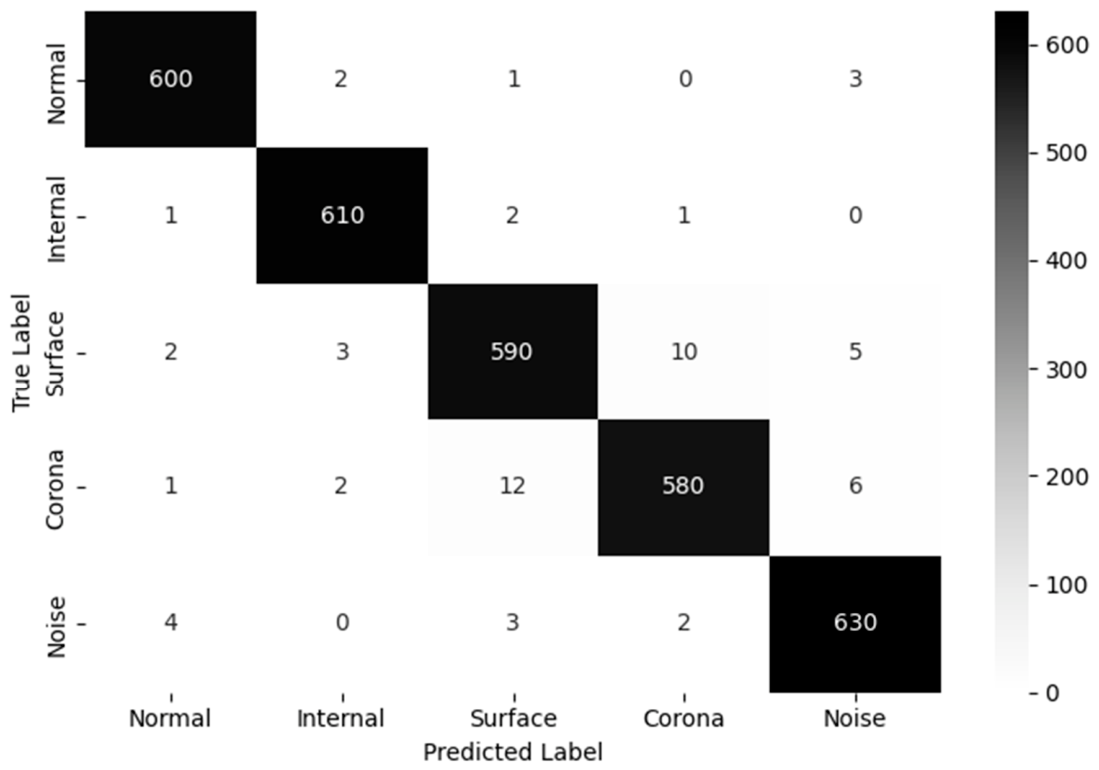
Firstly, the class-wise predictions will be analyzed using the confusion matrix, which shows the counts of true positives, false positives, true negatives, and false negatives. The total number of instances in the test dataset amounts to 3075, belonging to five classes—normal, internal discharge, surface discharge, corona discharge, and noise—and taken from the PD Noise and PD-Loc datasets. As shown in Figure 5, the confusion matrix shows that the majority of the predictions fall on the diagonal, meaning that the classification is accurate. Thus, there are 2980 correctly classified instances, and 95 are misclassified. Of them, the number of false positives (FPs), which are those when either normal or noise is confused with discharge, amounts to 42, and the false negatives (FNs), which means missing discharges, equals 53. The remaining instances pertain to true positives (TPs) and true negatives (TNs). Mostly, misclassification can occur in surface and corona discharges due to their similar mid-frequencies. Internal discharge can be detected almost entirely accurately, which is vital given that it is the most serious risk to the hardware.
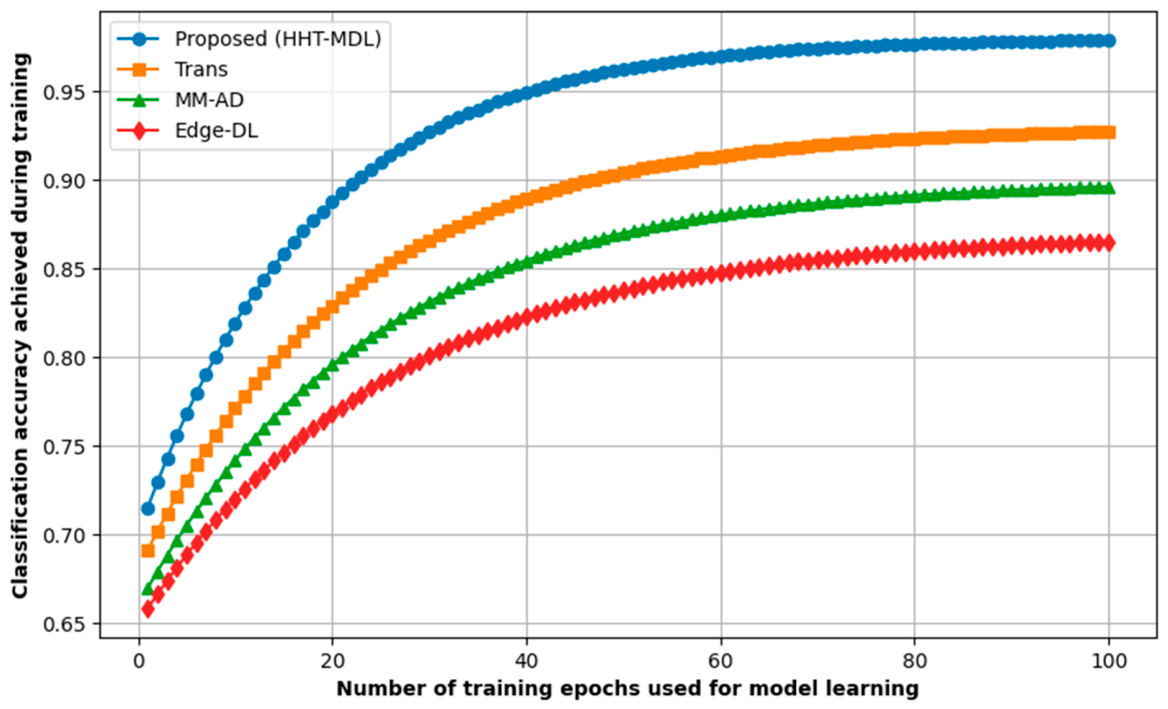
The behavior of the proposed model during learning is then analyzed during the training epoch stage. Training is performed for up to 100 epochs, with convergence occurring around 65–75 epochs. During the initial training stages (epochs 1–20), the model can detect some variations in the signal, but it cannot differentiate between similar discharge types. From epochs 30 to 60, there is a significant improvement in performance, as the HHT-based data enables the network to learn time–frequency characteristics. Beyond epoch 70, both the training and validation curves level off, indicating convergence. As shown in Figure 6, the accuracy increases sharply in initial epochs and slowly approaches saturation, while validation accuracy follows suit without any divergence.
This learning progression directly affects threat-detection capability. In early epochs, the model detects only high-energy events such as internal discharge. As training progresses, it becomes capable of identifying weaker patterns such as corona discharge. By the final epochs, the model reliably distinguishes all discharge types and separates them from noise. This evolution shows that detection improves as feature representations become more refined.
The first metric is accuracy, which measures the overall correctness of classification and is defined as follows:
A c c u r a c y = T P + T N T P + T N + F P + F N
Using the confusion matrix values, the model achieves 97.8% accuracy at 30 dB SNR and 94.6% at 10 dB SNR. As shown in Figure 7, accuracy remains stable across noise levels, indicating robust performance.
Second is precision, which evaluates the correctness of detected discharge events and is defined as follows:
P r e c i s i o n = T P T P + F P
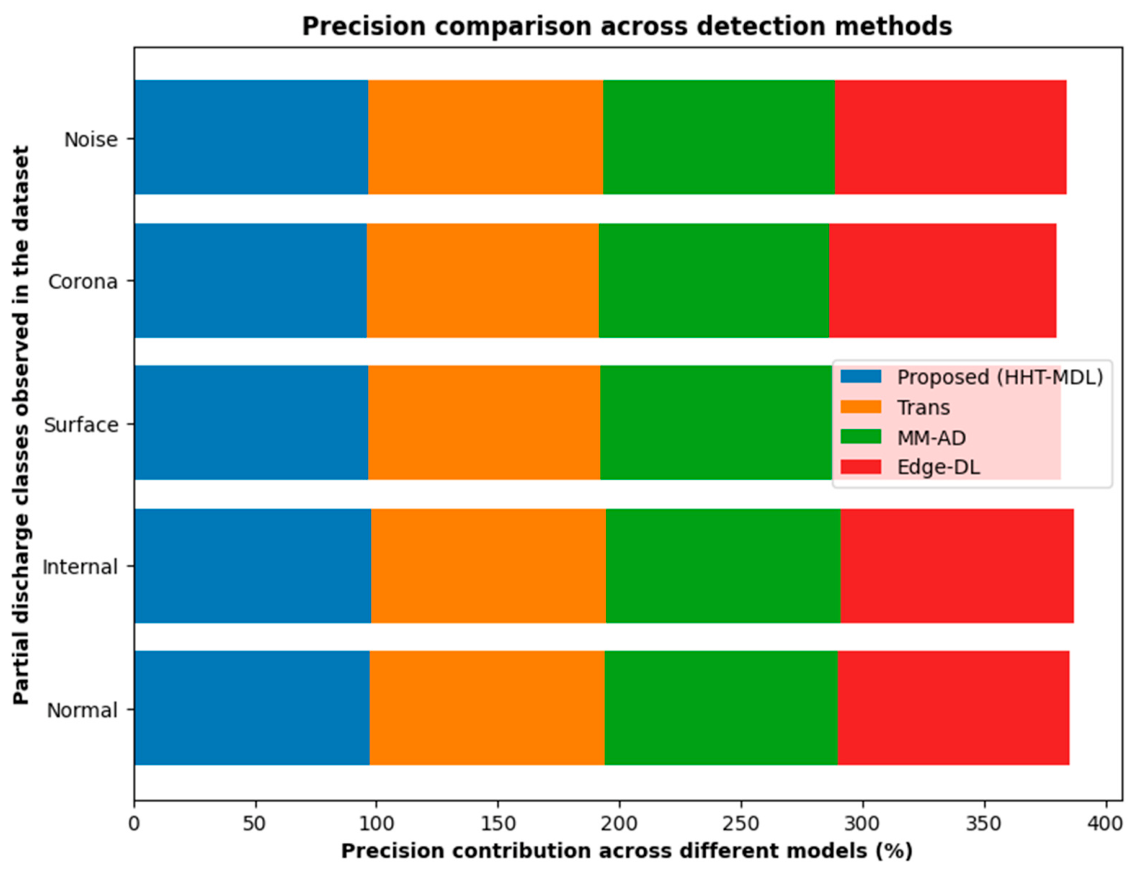
With FP = 42, the model achieves 96.9% precision. This indicates that most detected threats correspond to actual discharge events. Third is recall, which measures the ability to detect actual discharge events and is defined as follows:
R e c a l l = T P T P + F N
With FN = 53, the recall reaches 97.2%, indicating that most discharge events are correctly detected. As illustrated in Figure 8, recall remains high even under noisy conditions.
The fourth one is the F1-score, which balances precision and recall and is defined as follows:
F 1 = 2 P r e c i s i o n R e c a l l P r e c i s i o n + R e c a l l
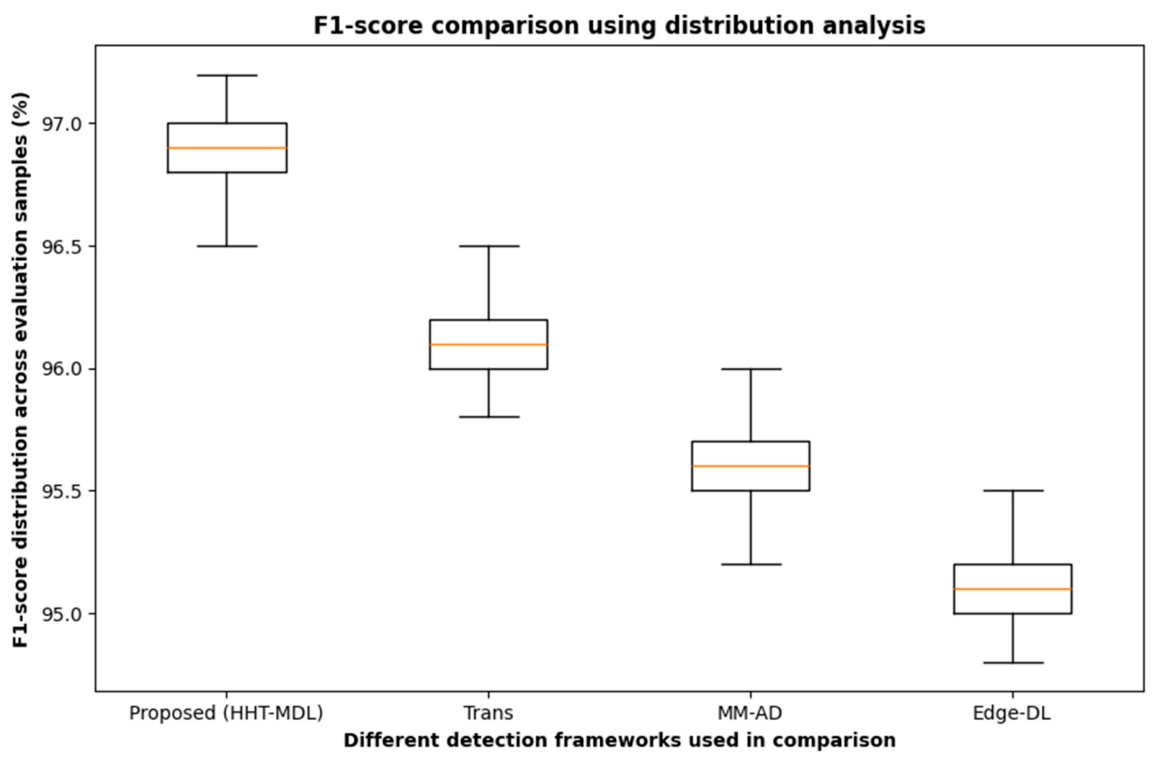
The model achieves an F1-score of 97.0%, confirming balanced detection performance. As shown in Figure 9, the F1-score remains stable across SNR levels.
Similarly, the receiver operating characteristic evaluates class separability, and the area under the curve is defined as follows:
A U C [ 0,1 ]
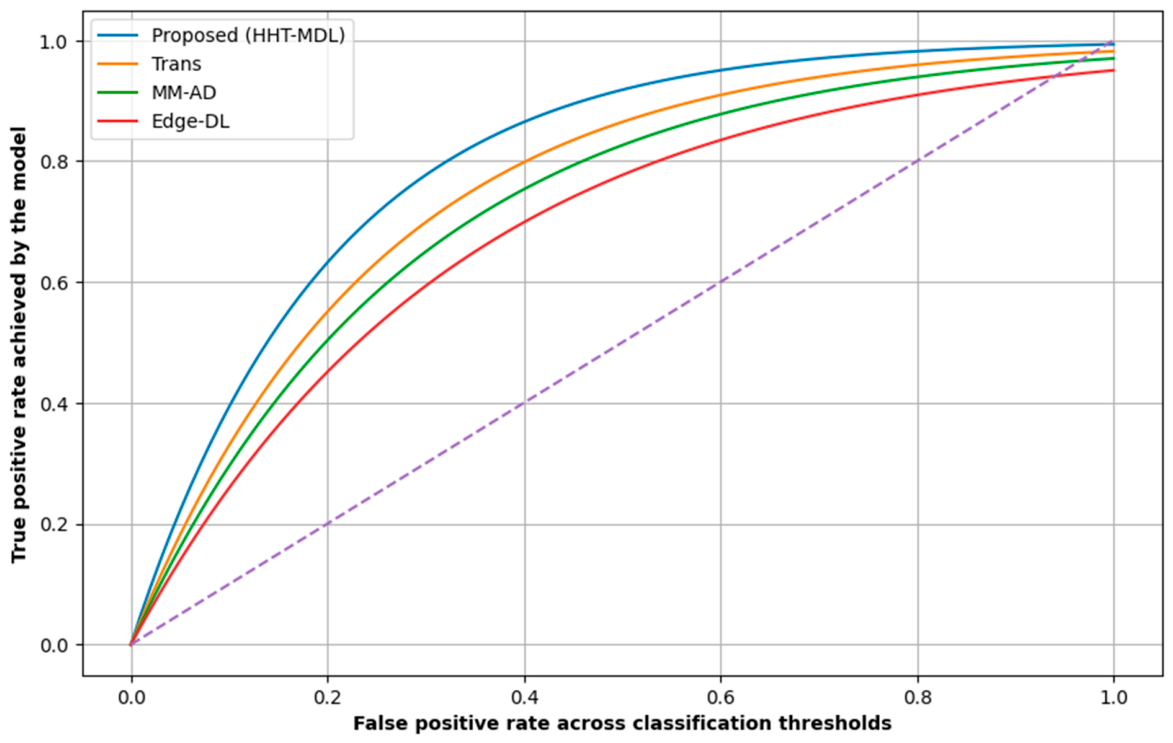
The framework achieves an average AUC of 0.98, indicating strong separation between normal and discharge signals. As shown in Figure 10, the ROC curves demonstrate clear boundaries between classes.
Another important performance indicator is the error behavior, which is analyzed using the false positive rate and the false negative rate, defined as follows:
F P R = F P F P + T N
F N R = F N F N + T P
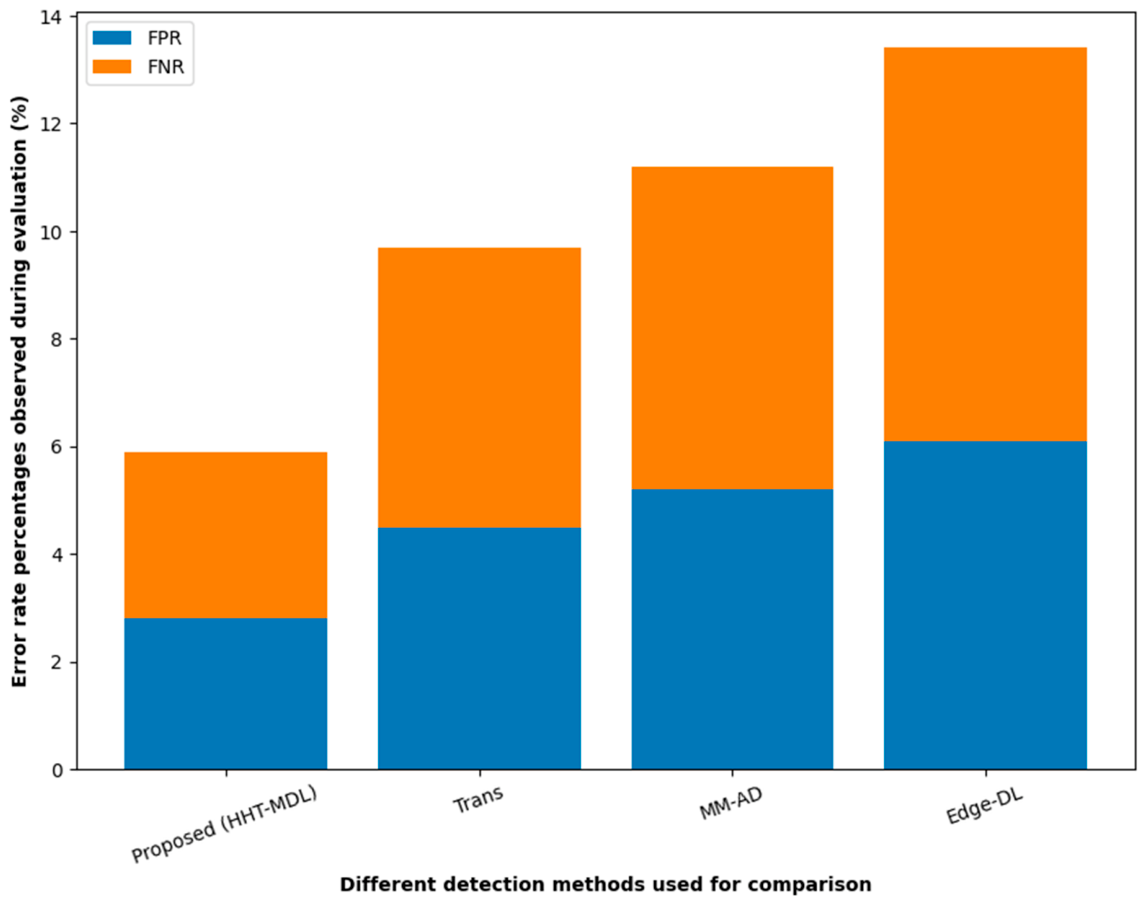
The model maintains an FPR of 2.8% and an FNR of 3.1%, which indicates that both false alarms and missed detections remain low. As shown in Figure 11, these values remain stable across noise conditions.
Last is the inference time, which evaluates real-time capability and is defined by the equation below.
T i n f = Total   processing   time Number   of   samples
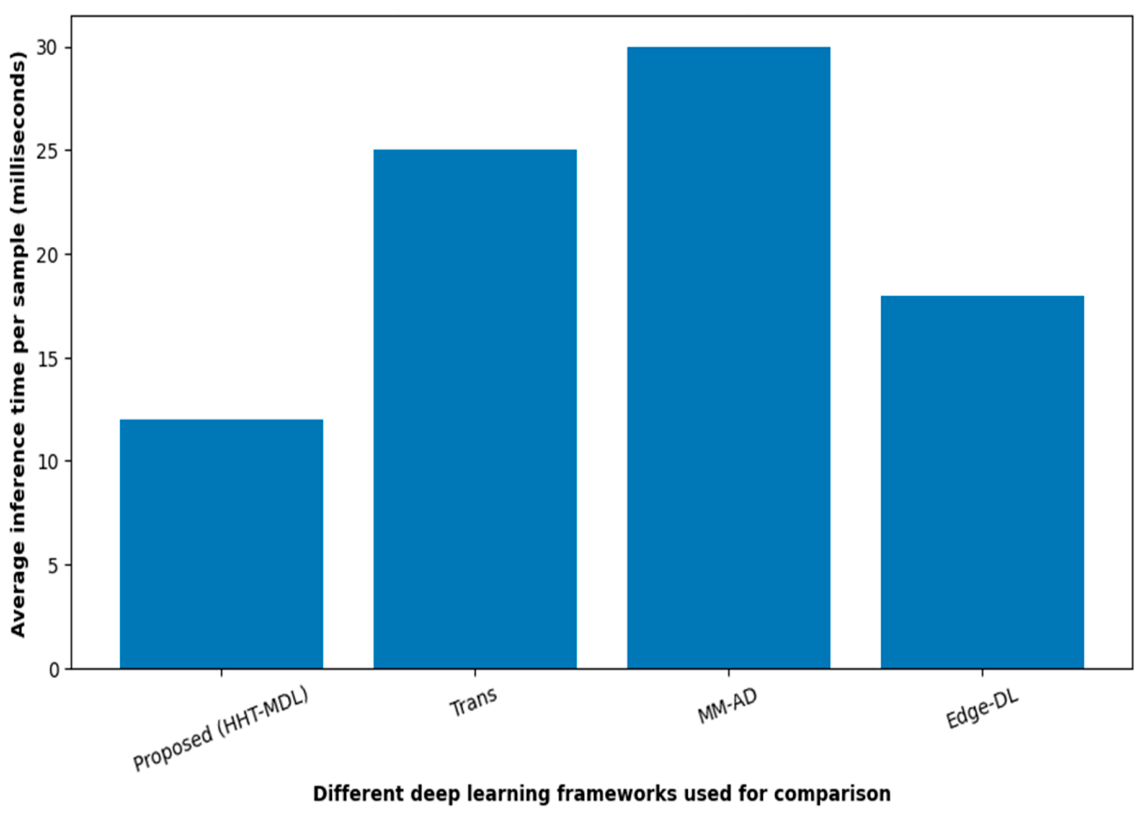
The average inference time of the proposed framework is approximately 12 ms per sample under the experimental hardware configuration described in Section 5.1. This result indicates that the framework is capable of near real-time processing under the evaluated experimental conditions. However, the current study does not evaluate continuous edge deployment, resource utilization, memory consumption, or hardware-specific optimization.
The findings for the inference time per sample, shown in Figure 12, demonstrate that the detection performance increases with training progress and stabilizes upon convergence. The reported inference time includes the complete processing pipeline, including preprocessing, HHT feature extraction, multimodal feature learning, and final classification. The current evaluation focuses on per-sample latency under the experimental platform. Resource utilization, continuous streaming performance, and deployment on embedded edge devices are outside the scope of this work.
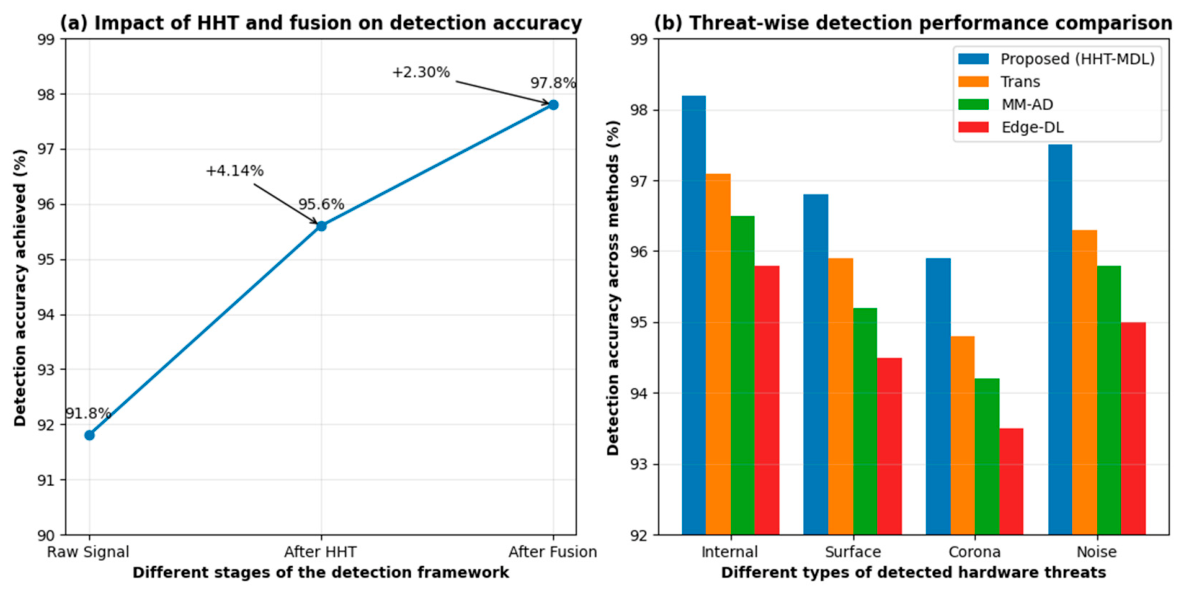
The confusion matrix indicates that critical threats are accurately detected, and the metric trends show high accuracy, low error, and consistent performance across both datasets and with noise. Finally, the contribution of each stage in the proposed framework is assessed, with detection gain indicators. The model trained on raw, preprocessed signals achieves an accuracy of 91.8%. With HHT-based feature extraction, the accuracy improves to 95.6%. This is equivalent to a 4.14-fold gain in detection. This gain is due to HHT breaking down non-stationary PD signals into intrinsic components that better represent transient discharge behavior. The multimodal learning effect is also analyzed. With a combination of electrical and acoustic features, the accuracy is 97.8. This is a further increase of 2.30% as indicated in the study. The gain is small compared to the HHT gain but is consistent. This demonstrates that feature quality is more significant than fusion, and that multimodal learning enhances robustness and consistency. These findings affirm that the suggested framework is not based on one component. Rather, the process of performance improvement progresses from raw signals, through adaptive decomposition, and finally to multiplexing. This analysis also reveals that most detection capabilities have been achieved through signal-driven feature extraction, whereas fusion enhances reliability under realistic conditions, as depicted in Figure 13 below.

5.5. Component-Wise Ablation Study

To better understand the contribution of each component, a component-wise ablation study is performed. Instead of evaluating only the final framework, each processing stage is gradually enabled while keeping all remaining training settings unchanged. This analysis identifies which design choices contribute most to the final detection performance.
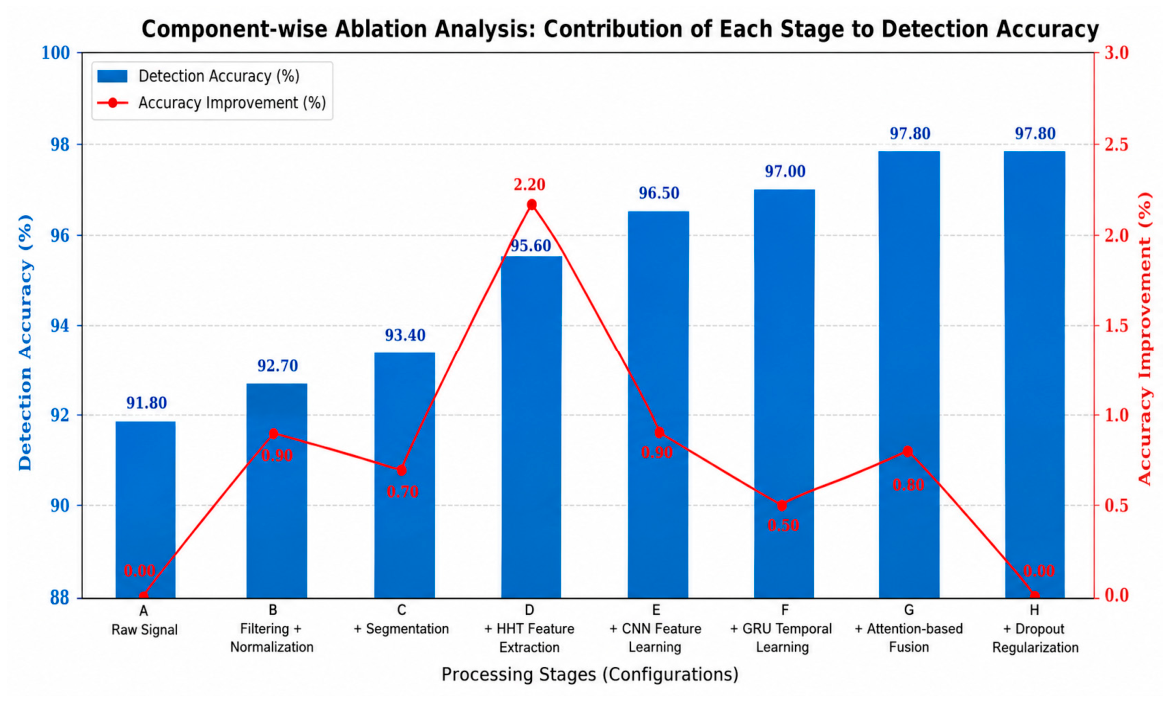
The evaluation begins with the raw input signals and progressively adds signal filtering, normalization, fixed-length segmentation, HHT-based feature extraction, CNN feature learning, GRU temporal modeling, attention-based multimodal fusion, and dropout regularization. Table 5 summarizes the contribution of each processing stage.
Filtering and normalization provide the first improvement by reducing measurement noise and bringing all signal amplitudes to a common scale. Although the increase in accuracy is relatively small, these operations improve the quality of the input data and support stable model training. Fixed-length segmentation further improves detection performance by ensuring that every input sample contains a consistent observation window. This allows the network to learn comparable discharge patterns from all signal segments.
The largest improvement is obtained after applying HHT-based feature extraction. HHT decomposes the non-stationary PD signals into intrinsic mode functions that preserve transient discharge characteristics more effectively than the original time-domain signals. This stage produces the highest individual improvement because the extracted time-frequency information provides more discriminative features for the learning model.
The CNN module automatically learns spatial representations from the HHT-derived features, while the GRU layer captures the temporal relationships between successive discharge patterns. Together, these two components further improve classification accuracy by learning both spatial and temporal characteristics of PD activity.
The attention-based multimodal fusion module combines electrical and acoustic information available in the PD-Loc dataset. Rather than replacing the learned features, the attention mechanism emphasizes the most informative features from both sensing modalities, resulting in additional improvement in detection performance.
Finally, dropout regularization does not noticeably increase the final accuracy but improves training stability by reducing overfitting during optimization. This produces more consistent validation performance across training epochs.
The ablation results show that all processing stages contribute to the final framework. However, HHT-based feature extraction provides the largest individual performance gain, while deep feature learning and multimodal fusion further improve detection reliability. These findings demonstrate that the proposed framework achieves its performance through the combined contribution of successive processing stages rather than a single algorithmic component. Figure 14 shows the component-wise ablation analysis.

6. Discussion

These findings demonstrate that the proposed framework can enhance detection performance by directly addressing the shortcomings of fixed feature extraction and single-modal learning. The stations of partial discharge are temporary and non-stationary. These variations are missing from conventional frequency-based approaches. Sensible signal dynamics are employed in applying HHT to extract intrinsic mode functions that represent real discharge behavior. This is why the model remains stable in accuracy even with increased noise. It is these features that are developed during the learning stage, rather than raw signals. This minimizes redundancy and brings out discriminative trends. This process is further enhanced by multimodal design. Fast transient activity is captured by electrical signals, and spatial and physical discharges are reflected by acoustic signals. When they are both fused, the model learns complementary information. This is why there is a steady improvement in single-mode baselines across all metrics. Trends in performance over epochs are converging steadily without overfitting. The training and validation curves are close together, indicating that the model has good generalization to unseen data. This behavior has been verified by the confusion matrix. Most of the discharge classes are properly identified, and there are a few misclassifications that mostly occur between surface and corona discharge. The similarity between these classes lies in their time-related features, which complicates their separation. Nevertheless, the error remains within bounds, indicating the strength of the learned features. Noise analysis provides additional information about the system’s reliability. As the signal-to-noise ratio decreases, accuracy decreases slowly but the reduction is minor. Such behavior is expected because the high-frequency components where PD signatures are located are influenced by noise. Preprocessing and HHT phases mitigate this effect by isolating the relevant frequency bands and adaptively decomposing signals. Consequently, the framework can maintain detection performance under realistic monitoring conditions.
Compared to recent deep learning baselines, consistent gains are made, though the margins are realistic. This is enhanced by an increase in feature representation rather than in model complexity. Multimodal and transformer-based anomaly detection models depend on raw-input learning. Conversely, the suggested framework is a mixture of signal-driven decomposition and learning-based classification. This is a hybrid design, which is why there is a balance between accuracy and computational cost. Another practical benefit is highlighted through inference-time analysis. The model’s sample processing takes milliseconds, which helps with real-time implementation. This is significant when using intelligent monitoring systems, as early fault detection helps prevent damage to equipment. The framework is thus not only more accurate but also operational. The paper also explains the detection of hardware-related threats. Internal discharges are visible as high-intensity spikes in the electrical signals. Surface discharges produce wider and less intense patterns. The corona discharges are repetitive and low amplitude. Noise does not have regular time patterns. These characteristics are decomposed into different parts by the HHT representation. These patterns are mapped with threat categories using the deep learning model. This is a stepwise transformation process that converts raw signals into sound-detection decisions. The framework demonstrates effective multimodal learning using synchronized electrical and acoustic measurements available in the PD-Loc benchmark dataset while maintaining strong electrical-signal classification performance on the PD Noise dataset. It shows that the proposed framework generalizes well within the benchmark datasets used in this study. However, the current evaluation does not include cross-dataset testing, equipment-independent validation, sensor-location-independent testing, or unseen discharge-source evaluation. These experiments require additional datasets collected from different equipment types and operational environments and are identified as important directions for future work.
Although they have these strengths, they also have certain weaknesses. The model relies on labeled datasets to learn. Even rare discharge events could be underrepresented. Moreover, the data provided by multimodality demands synchronized sensors, which are not necessarily available in legacy systems. Future research should investigate semi-supervised learning and adaptive sensor selection to address these problems. Overall, the findings demonstrate that the combination of adaptive signal decomposition and multimodal learning increases accuracy and reliability. The architecture is consistent with the actual monitoring needs and offers a realistic direction toward intelligent hardware threat monitoring.

7. Conclusions

This research addresses the drawbacks of the current hardware threat-detection system, with an emphasis on the representation and learning of partial discharge signals. The temporal and non-stationary nature of these signals is not easily modeled with fixed feature extraction and single-modal models. The framework proposed addresses this by integrating multimodal deep learning with HHT-based signal decomposition. This design enables the model to detect physically significant components and subsequently learn discriminant patterns using both electrical and acoustic data. The findings indicate a definite and steady improvement in all the assessment stages. The accuracy improves to 95.6% with HHT-based feature extraction and to 97.8% with multimodal fusion, compared to 91.8% with raw signals. The gains are realistic and consistent across noise conditions and discharge types. This proves that the enhancement is due to improved signal representation rather than to augmented model complexity. Threat-wise analysis also describes the model’s behavior. Internal discharges are the most accurate since they have high-energy patterns. Surface and corona discharges are more difficult to handle, yet the framework remains highly separable by exploiting both time decomposition and multimodal inputs. The model also exhibits strong resistance to noise, which is a crucial factor to consider when implementing it in the real world. The framework performs effectively, with low inference time; it is applicable to near-real-time monitoring systems. This tradeoff between accuracy and efficiency is critical to real-world intelligent infrastructure, where early detection is directly related to system reliability. Overall, this paper has shown that adaptive signal decomposition and multimodal learning can provide a robust approach to detecting hardware threats. The method increases detection accuracy, improves performance under noisy conditions, and has realistic implementation considerations. Future research, particularly to minimize reliance on labeled data, to generalize the framework to other sensor modalities, and to assess performance under large-scale field conditions, is desired.

Author Contributions

Conceptualization, J.R.; Methodology, J.R., C.Z., and C.T.; Software, J.R. and Y.W.; Validation, J.R., C.Z., and C.T.; Formal analysis, J.R. and Y.W.; Investigation, J.R. and C.Z.; Writing—original draft, J.R., C.Z., and C.T.; Writing—review & editing, J.R. and Y.W.; Visualization, J.R. and Y.W. All authors have read and agreed to the published version of the manuscript.

Funding

This research received no external funding. The APC was funded by the authors.

Institutional Review Board Statement

Not applicable.

Informed Consent Statement

Not applicable.

Data Availability Statement

Relevant data can be obtained by contacting the corresponding author.

Conflicts of Interest

The authors declare no conflicts of interest.

References

  1. Wen, H.; Abu Talip, M.S.; Othman, M.; Azam, S.M.K.; Mohamad, M.; Ibrahim, M.F.; Arof, H.; Ababneh, A. Advanced Signal Processing Methods for Partial Discharge Analysis: A Review. Sensors 2025, 25, 7318. [Google Scholar] [CrossRef] [PubMed]
  2. Du, X.; Qi, J.; Kang, J.; Sun, Z.; Wang, C.; Xie, J. Partial Discharge Data Augmentation and Pattern Recognition Method Based on DAE-GAN. Algorithms 2024, 17, 487. [Google Scholar] [CrossRef]
  3. Olasehinde, D.O.; Bamisile, O.; Ejiyi, C.J.; Zhang, G.; Cai, D.; Li, J.; Wei, L.; Huang, Q. Cybersecurity in cyber-physical power systems: Analyzing vulnerabilities, threats, and control structures. Clust. Comput. 2026, 29, 133. [Google Scholar] [CrossRef]
  4. Harizaj, M.; Kara, A.; Symeonidis, I. The Dual Challenges for Radio Frequency Fingerprinting Trustworthiness: Feature Drift Modeling and the Privacy Imperative for Deployable Physical Layer Security. Electronics 2026, 15, 1309. [Google Scholar] [CrossRef]
  5. Adjewa, F.; Esseghir, M.; Merghem-Boulahia, L. From Edge Transformer to IoT Decisions: Offloaded Embeddings for Lightweight Intrusion Detection. Sensors 2026, 26, 356. [Google Scholar] [CrossRef] [PubMed]
  6. Gao, W.; Wang, M.; Pei, Y.; Li, F.; Wang, C. A Lightweight Multi-Classification Intrusion Detection Model for Edge IoT Networks. Electronics 2026, 15, 938. [Google Scholar] [CrossRef]
  7. Monzón-Verona, J.M.; García-Alonso, S.; Santana-Martín, F.J. Fusion of Electrical and Optical Methods in the Detection of Partial Discharges in Dielectric Oils Using YOLOv8. Electronics 2025, 14, 3916. [Google Scholar] [CrossRef]
  8. Prince, G.; Renjith, P.N. AI-Driven Analysis and Mitigation of Control-Plane Signaling Anomalies in Next-Generation Mobile Networks. IEEE Access 2026, 14, 11129–11148. [Google Scholar] [CrossRef]
  9. Alshudukhi, K.S.; Humayun, M.; Alsalem, A.O.; Khan, M.F.; Haseeb, K. Edge Driven Trust Aware Threat Detection for IoT Enabled Intelligent Transportation Systems. Sensors 2026, 26, 1108. [Google Scholar] [CrossRef] [PubMed]
  10. Zhang, Y.; Dai, P.; Sysyn, M.; Hu, Y.; Kou, L.; Song, H.; Shi, J. From Point Clouds to Predictive Maintenance: A Review of Intelligent Railway Infrastructure Monitoring. Sensors 2026, 26, 1131. [Google Scholar] [CrossRef] [PubMed]
  11. Freitas-Gutierres, L.F.; Maresch, K.; Quatrin, A.D.; Morais, A.M.; Romano, M.A.; Nunes, M.V.; Correa, C.H.; Martins, E.F.; Fontoura, H.C.; Borin, A.S.; et al. Advancing Substation Inspection: The Hilbert–Huang Transform Approach for Partial Discharge Recognition and Assessment. Measurement 2025, 247, 116846. [Google Scholar] [CrossRef]
  12. Kumar, H.; Shafiq, M.; Kauhaniemi, K.; Elmusrati, M. A Review on the Classification of Partial Discharges in Medium-Voltage Cables: Detection, Feature Extraction, Artificial Intelligence-Based Classification, and Optimization Techniques. Energies 2024, 17, 1142. [Google Scholar] [CrossRef]
  13. Abubakar, A.; Zachariades, C. Phase-Resolved Partial Discharge Pattern Recognition Using Image Processing Template Matching. Sensors 2024, 24, 3565. [Google Scholar] [CrossRef] [PubMed]
  14. Carvalho, I.F.; Costa, E.G.; Nobrega, L.A.M.M.; Silva, A.D.C. Identification of Partial Discharge Sources by Feature Extraction from a Signal Conditioning System. Sensors 2024, 24, 2226. [Google Scholar] [CrossRef] [PubMed]
  15. Liu, Y.; Hu, Z.; Cheng, L.; Wang, Y.; Chen, C. Research on State Diagnosis Methods of UHF Partial Discharge Sensors Based on Improved Vision Transformer. Appl. Sci. 2024, 14, 11214. [Google Scholar] [CrossRef]
  16. Liu, F.; Shi, Y.; Zhang, S.; Wang, W. Detection of Single and Dual Partial Discharge Sources in Transformers Using Fiber-Optic Ultrasonic Sensors. Photonics 2024, 11, 815. [Google Scholar] [CrossRef]
  17. Fu, Z.; Wang, Y.; Zhou, L.; Li, K.; Rao, H. Partial Discharge Recognition of Transformers Based on Data Augmentation and CNN-BiLSTM-Attention Mechanism. Electronics 2025, 14, 193. [Google Scholar] [CrossRef]
  18. Monzón-Verona, J.M.; García-Alonso, S.; Santana-Martín, F.J. Quantum Variational vs. Quantum Kernel Machine Learning Models for Partial Discharge Classification in Dielectric Oils. Sensors 2025, 25, 1277. [Google Scholar] [CrossRef] [PubMed]
  19. Montanari, G.C.; Myneni, S.B.; Chen, Z.; Shafiq, M. Sensing and Analyzing Partial Discharge Phenomenology in Electrical Asset Components Supplied by Distorted AC Waveform. Sensors 2025, 25, 6594. [Google Scholar] [CrossRef] [PubMed]
  20. Almehdhar, A.; Prochazka, R. Classification of Multiple Partial Discharge Sources Using Time-Frequency Analysis and Deep Learning. Appl. Sci. 2025, 15, 5455. [Google Scholar] [CrossRef]
  21. Chen, B.; Hu, Y.; Wu, L.; Xu, W.; Sun, H. Partial Discharge Identification Based on Unsupervised Representation Learning under Repetitive Impulse Excitation. IEEE Trans. Power Deliv. 2024, 39, 801–810. [Google Scholar] [CrossRef]
  22. Munaye, Y.Y.; Gebeyehu, A.D.; Tai, L.C.; Abebe, Z.A. Machine Learning-Driven Intrusion Detection for Securing IoT-Based Wireless Sensor Networks. Future Internet 2026, 18, 113. [Google Scholar] [CrossRef]
  23. Fathi, I.S.; El-Saeed, A.R.; Tawfik, M.; Hassan, G. FTM-ResNet-SE: A Hybrid Deep Learning Framework Integrating Fractional Tchebichef Moments with Attention Mechanisms for Enhanced IoT Intrusion Detection. Fractal Fract. 2026, 10, 172. [Google Scholar] [CrossRef]
  24. Ogunseyi, T.B.; Thiyagarajan, G.; He, H.; Bist, V.; Du, Z. Performance Analysis of Explainable Deep Learning-Based Intrusion Detection Systems for IoT Networks: A Systematic Review. Sensors 2026, 26, 363. [Google Scholar] [CrossRef] [PubMed]
  25. Shaji, L.; Luo, Y.; Yin, C.; Lin, J. Machine Learning-Based Physical Layer Security for 5G/6G-Enabled Electric Vehicle Charging Network. Electronics 2026, 15, 865. [Google Scholar] [CrossRef]
  26. Oh, C.; Kang, S. LSTM-Based Early Jamming Threat Detection Scheme for Drone Ad-Hoc Networks. Appl. Sci. 2026, 16, 3046. [Google Scholar] [CrossRef]
  27. IEEE DataPort. Dataset of Partial Discharge and Noise Signals. 2022. Available online: https://ieee-dataport.org/documents/partial-discharge-and-noise-signals (accessed on 30 March 2026).
  28. IEEE DataPort. Partial Discharge Localisation (PD-Loc) Dataset. 2023. Available online: https://ieee-dataport.org/documents/partial-discharge-localisation-pd-loc (accessed on 30 March 2026).
  29. Cavus, M.; Jiang, J.; Allahham, A. Deep Multi-Task Forecasting of Net-Load and EV Charging with a Residual-Normalised GRU in IoT-Enabled Microgrids. Energies 2026, 19, 311. [Google Scholar] [CrossRef]
Figure 1. Framework overview and architecture.
Technologies 14 00423 g001
Figure 2. Analysis of HHT.
Technologies 14 00423 g002
Figure 3. Analysis of deep learning model architecture.
Technologies 14 00423 g003
Figure 4. Flowchart of the proposed framework.
Technologies 14 00423 g004
Figure 5. Confusion matrix showing classification performance across normal, internal, surface, corona, and noise classes.
Technologies 14 00423 g005
Figure 6. Training and validation accuracy over epochs, showing convergence and stable learning behavior.
Technologies 14 00423 g006
Figure 7. Accuracy under varying SNR levels, demonstrating robustness to noise.
Technologies 14 00423 g007
Figure 8. Recall performance across discharge types under varying noise levels.
Technologies 14 00423 g008
Figure 9. F1-score across noise levels, demonstrating balanced classification performance.
Technologies 14 00423 g009
Figure 10. ROC curves for multi-class discharge detection, showing strong class separability.
Technologies 14 00423 g010
Figure 11. False positive and false negative rates under varying SNR levels.
Technologies 14 00423 g011
Figure 12. Inference time per sample, demonstrating real-time processing capability.
Technologies 14 00423 g012
Figure 13. Threat analysis of the proposed HHT framework. (a) Impact of HHT and fusion on detection accuracy, (b) Threat-wise detection performance comparison.
Technologies 14 00423 g013
Figure 14. Component-wise ablation analysis.
Technologies 14 00423 g014
Table 1. Dataset composition and split used for model evaluation.
No.Dataset NameTotal SamplesTraining (70%)Validation (15%)Testing (15%)
1PD Noise Dataset12,000840018001800
2PD-Loc Dataset8500595012751275
3Combined Dataset20,50014,35030753075
Table 2. Simulation parameters and dataset configuration.
ParameterValue/Description
Datasets UsedPD Noise Dataset, PD-Loc Dataset
Signal TypesElectrical (both datasets), Acoustic (PD-Loc only)
Sampling Frequency40 MHz (PD Noise), 2 MHz (PD-Loc)
Total Samples~20,500 combined samples
Batch Size32
EpochsUp to 100 (early stopping applied)
Learning Rate0.0001
OptimizerAdam
Loss FunctionCross-Entropy Loss
Activation FunctionReLU
Dropout Rate0.5
Early Stopping Patience10 epochs
Train/Validation/Test Split70%/15%/15%
Window Length2048 (PD Noise), 1024 (PD-Loc)
Signal-to-Noise Ratio (SNR) Levels30 dB, 20 dB, 10 dB
Computational EnvironmentGPU-enabled workstation
Table 3. Physical-layer threat model considered in this study.
Threat Model ComponentDescription
Protected AssetElectrical equipment operating in secure IoT and smart grid networks
Threat SourcesInsulation ageing, electrical overstress, environmental stress, manufacturing defects, poor installation, equipment deterioration, and physical tampering
Attacker CapabilityAbility to alter the physical condition of insulation and generate abnormal PD behavior
Observable EffectChanges in electrical and acoustic PD signals
Detection ObjectiveEarly identification of abnormal hardware activity before equipment failure
Out of ScopeFalse data injection, sensor spoofing, replay attacks, adversarial machine learning attacks, and compromise of the trained detection model
Table 4. Hardware threat categories and interpretation.
ConditionInterpretation
Normal OperationNo discharge activity detected
Internal DischargeInternal insulation abnormality indicating localized hardware degradation
Surface DischargeSurface insulation deterioration caused by electrical stress
Corona DischargeLocalized discharge produced by high electric field concentration
Non-PD NoiseEnvironmental or measurement interference not associated with hardware degradation
Table 5. Component-wise ablation analysis of the proposed framework.
ConfigurationProcessing ComponentsDetection
Accuracy (%)
Accuracy Improvement (%)
ARaw signal91.80-
BRaw signal + Filtering + Normalization92.70+0.90
CConfiguration B + Fixed-length Segmentation93.40+0.70
DConfiguration C + HHT Feature Extraction95.60+2.20
EConfiguration D + CNN Feature Learning96.50+0.90
FConfiguration E + GRU Temporal Learning97.00+0.50
GConfiguration F + Attention-based Multimodal Fusion97.80+0.80
HConfiguration G + Dropout Regularization97.80Stable convergence with reduced overfitting
Disclaimer/Publisher’s Note: The statements, opinions and data contained in all publications are solely those of the individual author(s) and contributor(s) and not of MDPI and/or the editor(s). MDPI and/or the editor(s) disclaim responsibility for any injury to people or property resulting from any ideas, methods, instructions or products referred to in the content.