1. Introduction
In recent decades, the availability of water for human use has become increasingly compromised by population growth, urbanization, and climate change, intensifying water scarcity and stress across regions of the world [
1,
2]. Recent studies indicate that global water demand will continue to increase in the coming years, and that this growth will directly impact urban and domestic water use, where strain in the water infrastructure is becoming increasingly evident [
3]. In particular, residential water consumption has shown increasing trends and changing usage patterns, highlighting the need to implement more efficient, better-informed strategies for water management at both urban and household levels [
4].
The detailed measurement of domestic water consumption remains limited in contexts where water supply is intermittent, and households rely on storage tanks to ensure water availability [
5]. Under these conditions, meters installed at the household connection record only the volume entering from the distribution network, but they do not allow the reconstruction of consumption associated with different indoor uses, nor do they capture the effects of intermediate storage in cisterns or rooftop tanks [
6]. This lack of granular information on water use patterns introduces uncertainty in the estimation of effective water use. It hinders the characterization of daily consumption patterns, underscoring the need for more detailed household-level monitoring [
7].
The incorporation of Internet of Things (IoT) technologies has become an effective alternative for improving water monitoring in the domestic context, as it enables the near-continuous acquisition of consumption data and their remote transmission to management platforms [
8,
9]. These systems allow variations in flow or water level to be recorded at higher temporal resolution than conventional mechanical meters, facilitating the identification of usage patterns and the detection of leaks or anomalous behavior [
10]. Furthermore, integrating sensors, communication nodes, and cloud services provides an infrastructure that supports data storage and advanced analysis, enabling applications to understand and optimize household water consumption [
11].
The continuous information generated by IoT systems enables the application of machine learning techniques to identify characteristic patterns of water consumption based on variations in water level or flow, facilitating the recognition of usage events and the separation of behaviors associated with different household activities [
12,
13]. These methods also allow the detection of anomalies or irregularities in demand and the extraction of relevant temporal features to describe domestic water-use behavior with greater accuracy [
14,
15].
In this context, this study presents a novel and integrated framework that combines IoT-based monitoring, domestic water-tank level data acquisition, and advanced machine learning techniques for the automated classification of residential water consumption patterns under intermittent supply conditions. Unlike existing approaches that rely primarily on flow-based measurements or aggregated demand analysis, the proposed method exploits water-level dynamics in storage tanks to infer end-use activities, a scenario that remains underexplored in the literature. The framework enables the identification of five representative household states and activities: tank refilling (indicating the arrival of water from the distribution network), stable state (absence of both consumption and refilling), toilet flushing, washing clothes, and taking a bath.
The novelty of this work lies in a comparative evaluation of multiple supervised algorithms including Decision Trees (DT), Random Forest (RF), Support Vector Machines (SVM), k-Nearest Neighbors (KNN), and Recurrent Neural Networks (RNN) using features derived directly from the dynamic behavior of water-level variations, demonstrating that the household activities can be reliably distinguished using machine learning models operating on level-based features, even in the presence of sensor noise, humidity, and intermediate storage effects.
This capability is particularly important for disentangling water availability from actual consumption in storage-dependent households, enabling data-driven demand management, supporting early leak detection and abnormal-use alerts, and providing actionable insights for demand management, user awareness, and the design of more efficient water distribution and conservation strategies.
The paper is organized as follows:
Section 2 reviews recent advances in residential water monitoring systems, with emphasis on IoT-based architectures and machine learning approaches for consumption classification.
Section 3 presents the sensing architecture and data acquisition framework.
Section 4 introduces the machine learning algorithms employed for water consumption classification.
Section 5 reports the experimental and classification results, while
Section 6 discusses the implications of the findings. Finally,
Section 7 summarizes the main conclusions and outlines future research directions.
2. Related Work
This section explores current water monitoring systems and discusses ways to improve them by leveraging data from different sources. The text presents the latest technological advancements in residential water management, focusing on IoT architectures, machine learning applications for consumption classification, and demand forecasting. This information is valuable for researchers seeking to optimize non-intrusive monitoring techniques and enhance the accuracy of automated water systems.
Authors in [
16] provided a comprehensive review of digital water metering, categorizing existing techniques into demand forecasting, end-use classification, and consumer feedback. Their analysis highlights a significant gap in personalized recommendation systems, emphasizing that while data collection is common, effective user engagement requires more intelligent processing. To address data standardization, the authors in [
17] introduced PyNIWM, an open-source framework for analyzing smart meter data that facilitates reproducible comparisons across algorithms using standardized metrics.
In the context of hardware implementation, authors in [
10] designed an IoT system for cistern monitoring in Mexico using ESP8266 microcontrollers and the Message Queuing Telemetry Transport (MQTT) protocol. By validating the system with a physical scale model, they achieved a usability score greater than 80% among participants, demonstrating the effectiveness of low-cost sensors. Similarly, in [
13], the authors utilized NodeMCU boards to transmit flow data with a 10-s sampling rate. Their study confirmed that identifying consumption events is feasible with affordable hardware, achieving reliable real-time transmission. Furthermore, authors in [
8] developed a leakage detection algorithm based on rules such as Minimum Night Flow (MNF). The results were notable, achieving 100% accuracy, Recall, and precision in leak detection scenarios, with a volumetric measurement error of only 4.63%.
Addressing the specific context of intermittent water supply, authors in [
5] analyzed domestic water consumption in Chihuahua, Mexico. They installed smart meters and pressure loggers to correlate consumption with demographic data. The findings revealed that pressure data is critical for validating service hours, as high pressure often indicates tank filling rather than immediate use. Regarding sensor limitations, authors in [
9] presented a comparative study using ultrasonic and hydrostatic sensors. Their dynamic estimation method yielded a Mean Absolute Percentage Error (MAPE) of 2.76%, which was comparable to the predefined rate method (2.73%), proving that robust estimation is possible even with sensor noise if advanced filtering is applied.
Regarding classification algorithms, the authors in [
12] conducted a comparative analysis of supervised learning models for residential end uses. They evaluated RF, SVM, and RNN. The results indicate that RF is the optimal choice, achieving F1-scores of 0.83–0.90 on balanced datasets and significantly outperforming SVM in unbalanced scenarios. Supporting this, the authors in [
11] applied a RF classifier to detect household water wastage, achieving 99% accuracy in distinguishing normal usage from anomalies. In [
18], a hybrid model combining Long Short Term Memory (LSTM) for feature extraction and RF for classification was proposed. Using a 5-min sampling resolution, the model achieved an overall F1-score of 0.89. Notably, the inclusion of electricity data improved the classification of specific activities, increasing the F1-score for bathing by 0.12 and laundry by 0.20.
In the field of forecasting, authors in [
19] implemented Deep Feedforward Neural Networks (DFFNNs) to predict urban water demand. Their model achieved a Mean Absolute Percentage Error (MAPE) of 2.99% and a coefficient of determination (
) of 0.987, significantly outperforming RF (MAPE = 3.69%) and KNN (MAPE = 5.20%). Similarly, authors in [
20] developed an LSTM-based prediction model that surpassed traditional Autoregressive Integrated Moving Average (ARIMA) methods, achieving a correlation coefficient of 89% and a lower Root Mean Squared Error (RMSE) of 5.60 m
3. In [
21], an LSTM model was also used within a micro-services architecture, showing superior prediction accuracy compared to Support Vector Regression (SVR). At the same time, the hardware meters maintained an error rate below 2%. Conversely, authors in [
22] showed that for particular datasets, Gradient Boosting Machines (GBM) achieved an
of 0.881, slightly outperforming RF (
= 0.872) and significantly surpassing SVM (
= 0.809).
Finally, regarding water quality, authors in [
23] applied six machine learning algorithms to classify potability. The results showed that RF and J48 achieved the highest accuracy of 99.3%, drastically outperforming IBk (KNN), which only reached 0.714. Similarly, authors in [
24] used DT for chlorine level assessment, achieving 92% accuracy and an Area Under the Curve (AUC) of 0.9108. However, authors in [
25] warned about experimental setups, noting that while supervised methods reached a precision of up to 0.99 for simple events, unsupervised clustering methods failed to identify categories, reinforcing the need for labeled datasets.
3. System Architecture
This section presents the methodology used to evaluate two sensing technologies for residential water-level monitoring and consumption pattern classification. While various methods exist for liquid level sensing, such as mechanical floats, which provide limited resolution and are prone to mechanical wear, or ultrasonic sensors, which often suffer from signal interference due to condensation and false echoes in narrow enclosed tanks, this study prioritizes the optical laser distance sensor and the submerged hydrostatic pressure transducer.
The laser sensor was selected for its high-precision, non-contact measurement capabilities; it uses a focused optical beam to determine distance, ensuring accurate readings without the beam divergence issues typical of acoustic sensors. Conversely, the hydrostatic pressure transducer was chosen for its robustness in submerged conditions; by measuring the pressure exerted by the water column, it remains immune to surface turbulence, foam, or steam, providing a reliable reference unaffected by air quality within the tank.
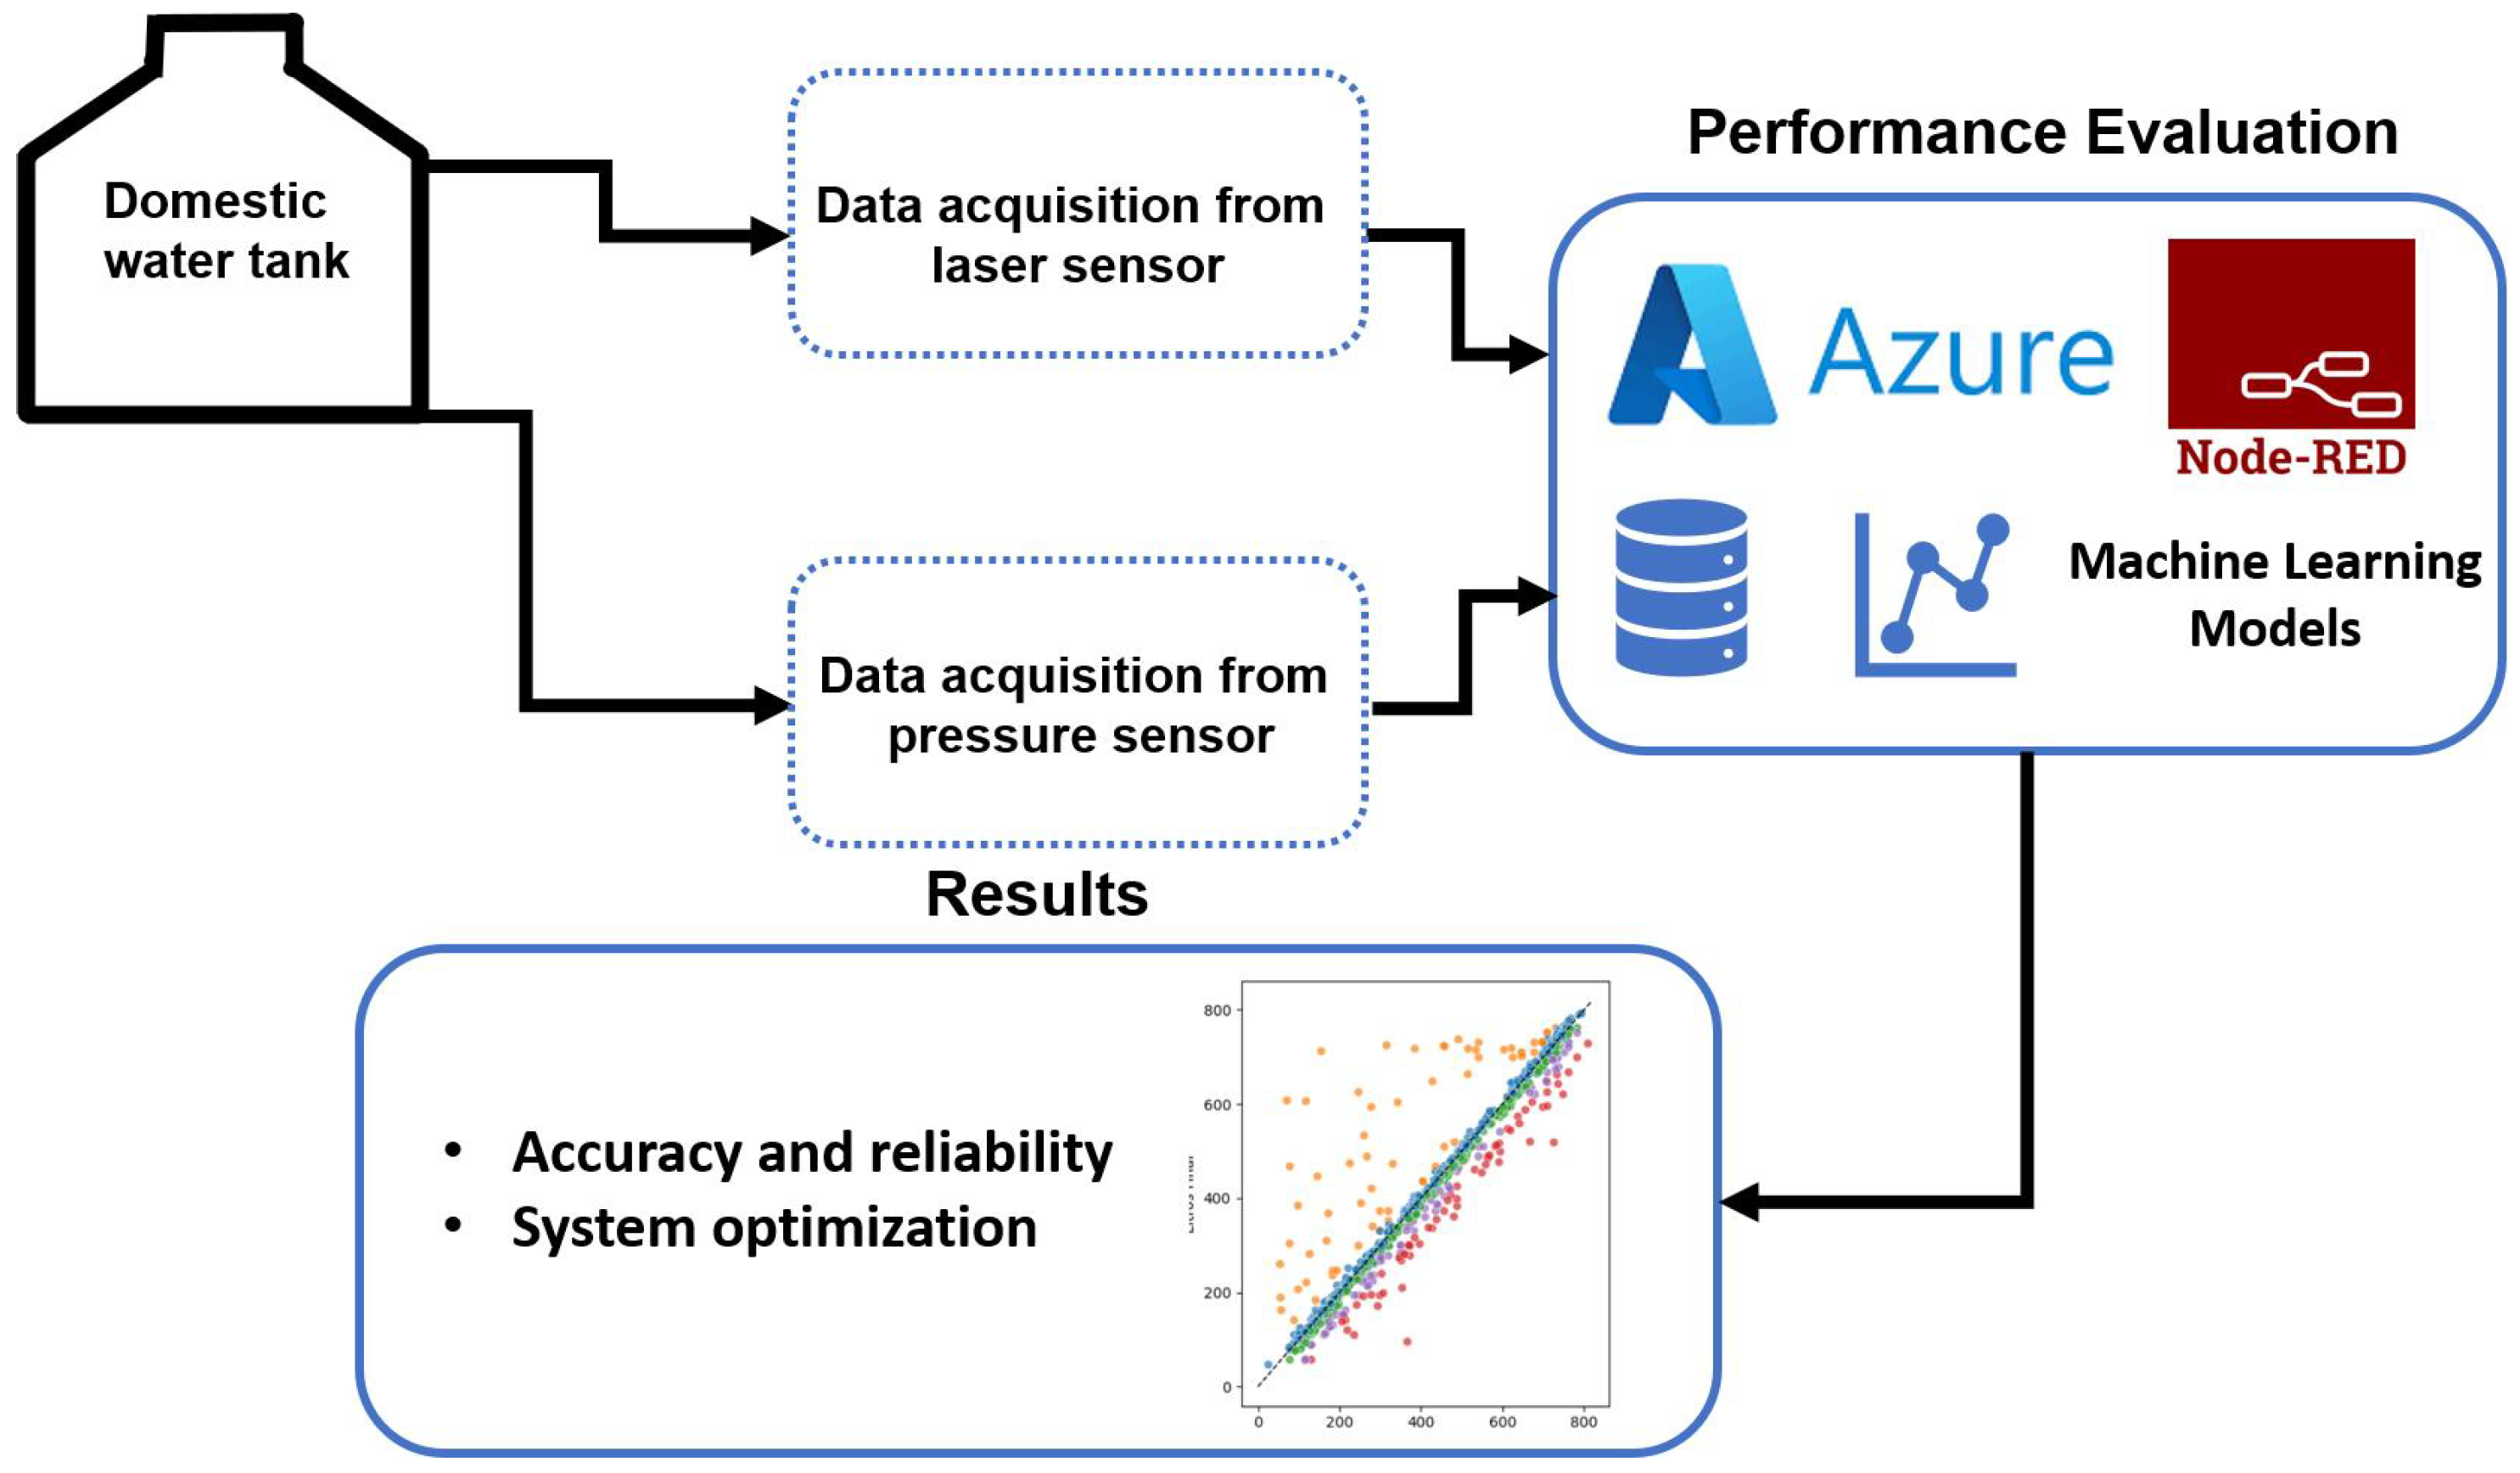
As shown in
Figure 1, the experimental framework integrates both sensors into a unified IoT architecture using ESP32 microcontrollers (Espressif Systems, Shanghai, China), Wi-Fi connectivity, Azure IoT Hub communication, and a structured data processing workflow designed to support downstream machine learning tasks. The methodology focuses on three core aspects: acquisition of raw water-level measurements, device behavior under realistic environmental conditions within the household tank, and the suitability of each sensing modality for long-term automated monitoring.
Both sensing devices were installed in the same water tank (
Figure 1) to ensure consistency across measurement scenarios. By standardizing the installation conditions and data flow, the study isolates differences attributable solely to the sensing principles and hardware characteristics of each device.
The following subsections describe the hardware architecture, installation procedure, and data-acquisition workflow for each sensor.
3.1. IoT Architecture for the Laser Sensor (WT53R-TTL)
The WT53R-TTL (WitMotion Shenzhen Co., Ltd., Shenzhen, China) is a distance-ranging sensor based on technology that calculates the distance to the water surface by measuring the absolute travel time of a laser pulse. The sensor is characterized by its narrow field of view, which prevents signal interference from the tank’s internal walls.
For data transmission, the device uses a Universal Asynchronous Receiver-Transmitter (UART) protocol, a serial communication standard that enables data exchange over two main lines: Transmit (TX) and Receive (RX). This interface allows the sensor to output processed distance readings in a digital format directly to the microcontroller. The specific operational parameters and accuracy ranges for this device are detailed in
Table 1.
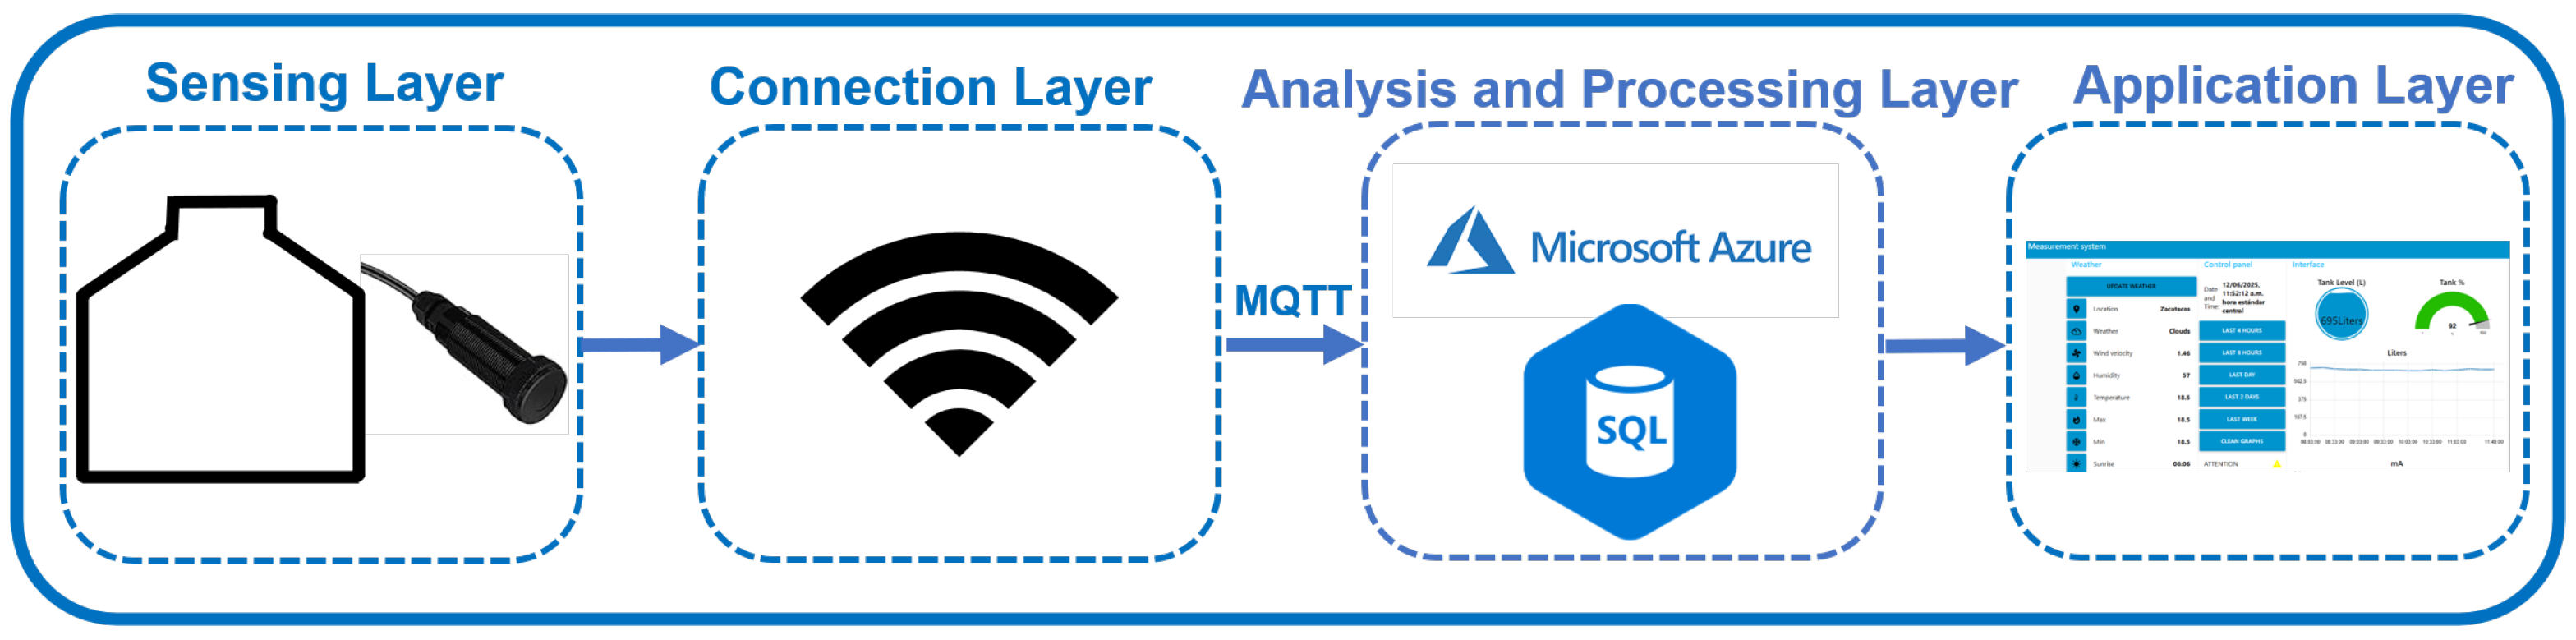
The overall IoT system architecture integrating this sensor is shown in
Figure 2.
The architecture is subdivided into four operational layers, described as follows:
Sensing Layer: This layer focuses on the physical measurement process using the WT53R-TTL laser sensor. The device is installed inside the household water tank, suspended from the top lid and oriented vertically to point toward the water column. By emitting a laser beam toward the water surface, the sensor estimates the distance through optical transduction.
Connection Layer: To manage data transmission, Wi-Fi was selected as the communication protocol. This choice leverages the widespread availability of wireless networks in residential environments. Additionally, the native Wi-Fi capabilities of the ESP32 microcontroller facilitate a direct and stable link between the sensing hardware and the local network router.
Analysis and Processing Layer: Telemetry data is transmitted via the MQTT protocol to the Microsoft Azure cloud platform. Within this environment, Node-RED acts as a flow based development tool to route messages to a structured MySQL database, also hosted on Azure. This setup ensures that water levels are logged with high precision, tracking measurements in centimeters (cm), millimeters (mm), and meters (m).
Application Layer: The raw distance measurements are processed into volumetric information. Using the specific dimensions of the water container, the system calculates the volume in liters based on Equation (
1):
where
V is the volume in liters,
r is the radius of the tank base, and
h is the height of the water column. Finally, this processed data is rendered onto a user dashboard, allowing residents to visualize real-time levels and historical consumption through interactive charts.
3.2. Pressure Sensor Architecture
The TL-136 pressure transducer is a device that outputs a standardized 4–20 miliamperes (mA) current signal proportional to the hydrostatic pressure exerted by the water column. This sensor requires placement at a fixed depth at the tank base to measure the weight of the water above it.
To interface this current signal with the ESP32’s analog-to-digital converter (ADC), an electrical conversion stage was implemented using a resistor-based current-to-voltage circuit. Because the sensing principle relies on hydrostatic pressure, the measurements are immune to surface sloshing, optical disturbances, or internal humidity factors that typically affect non submerged sensors.
The main technical specifications of the TL-136 sensor are detailed in
Table 2.
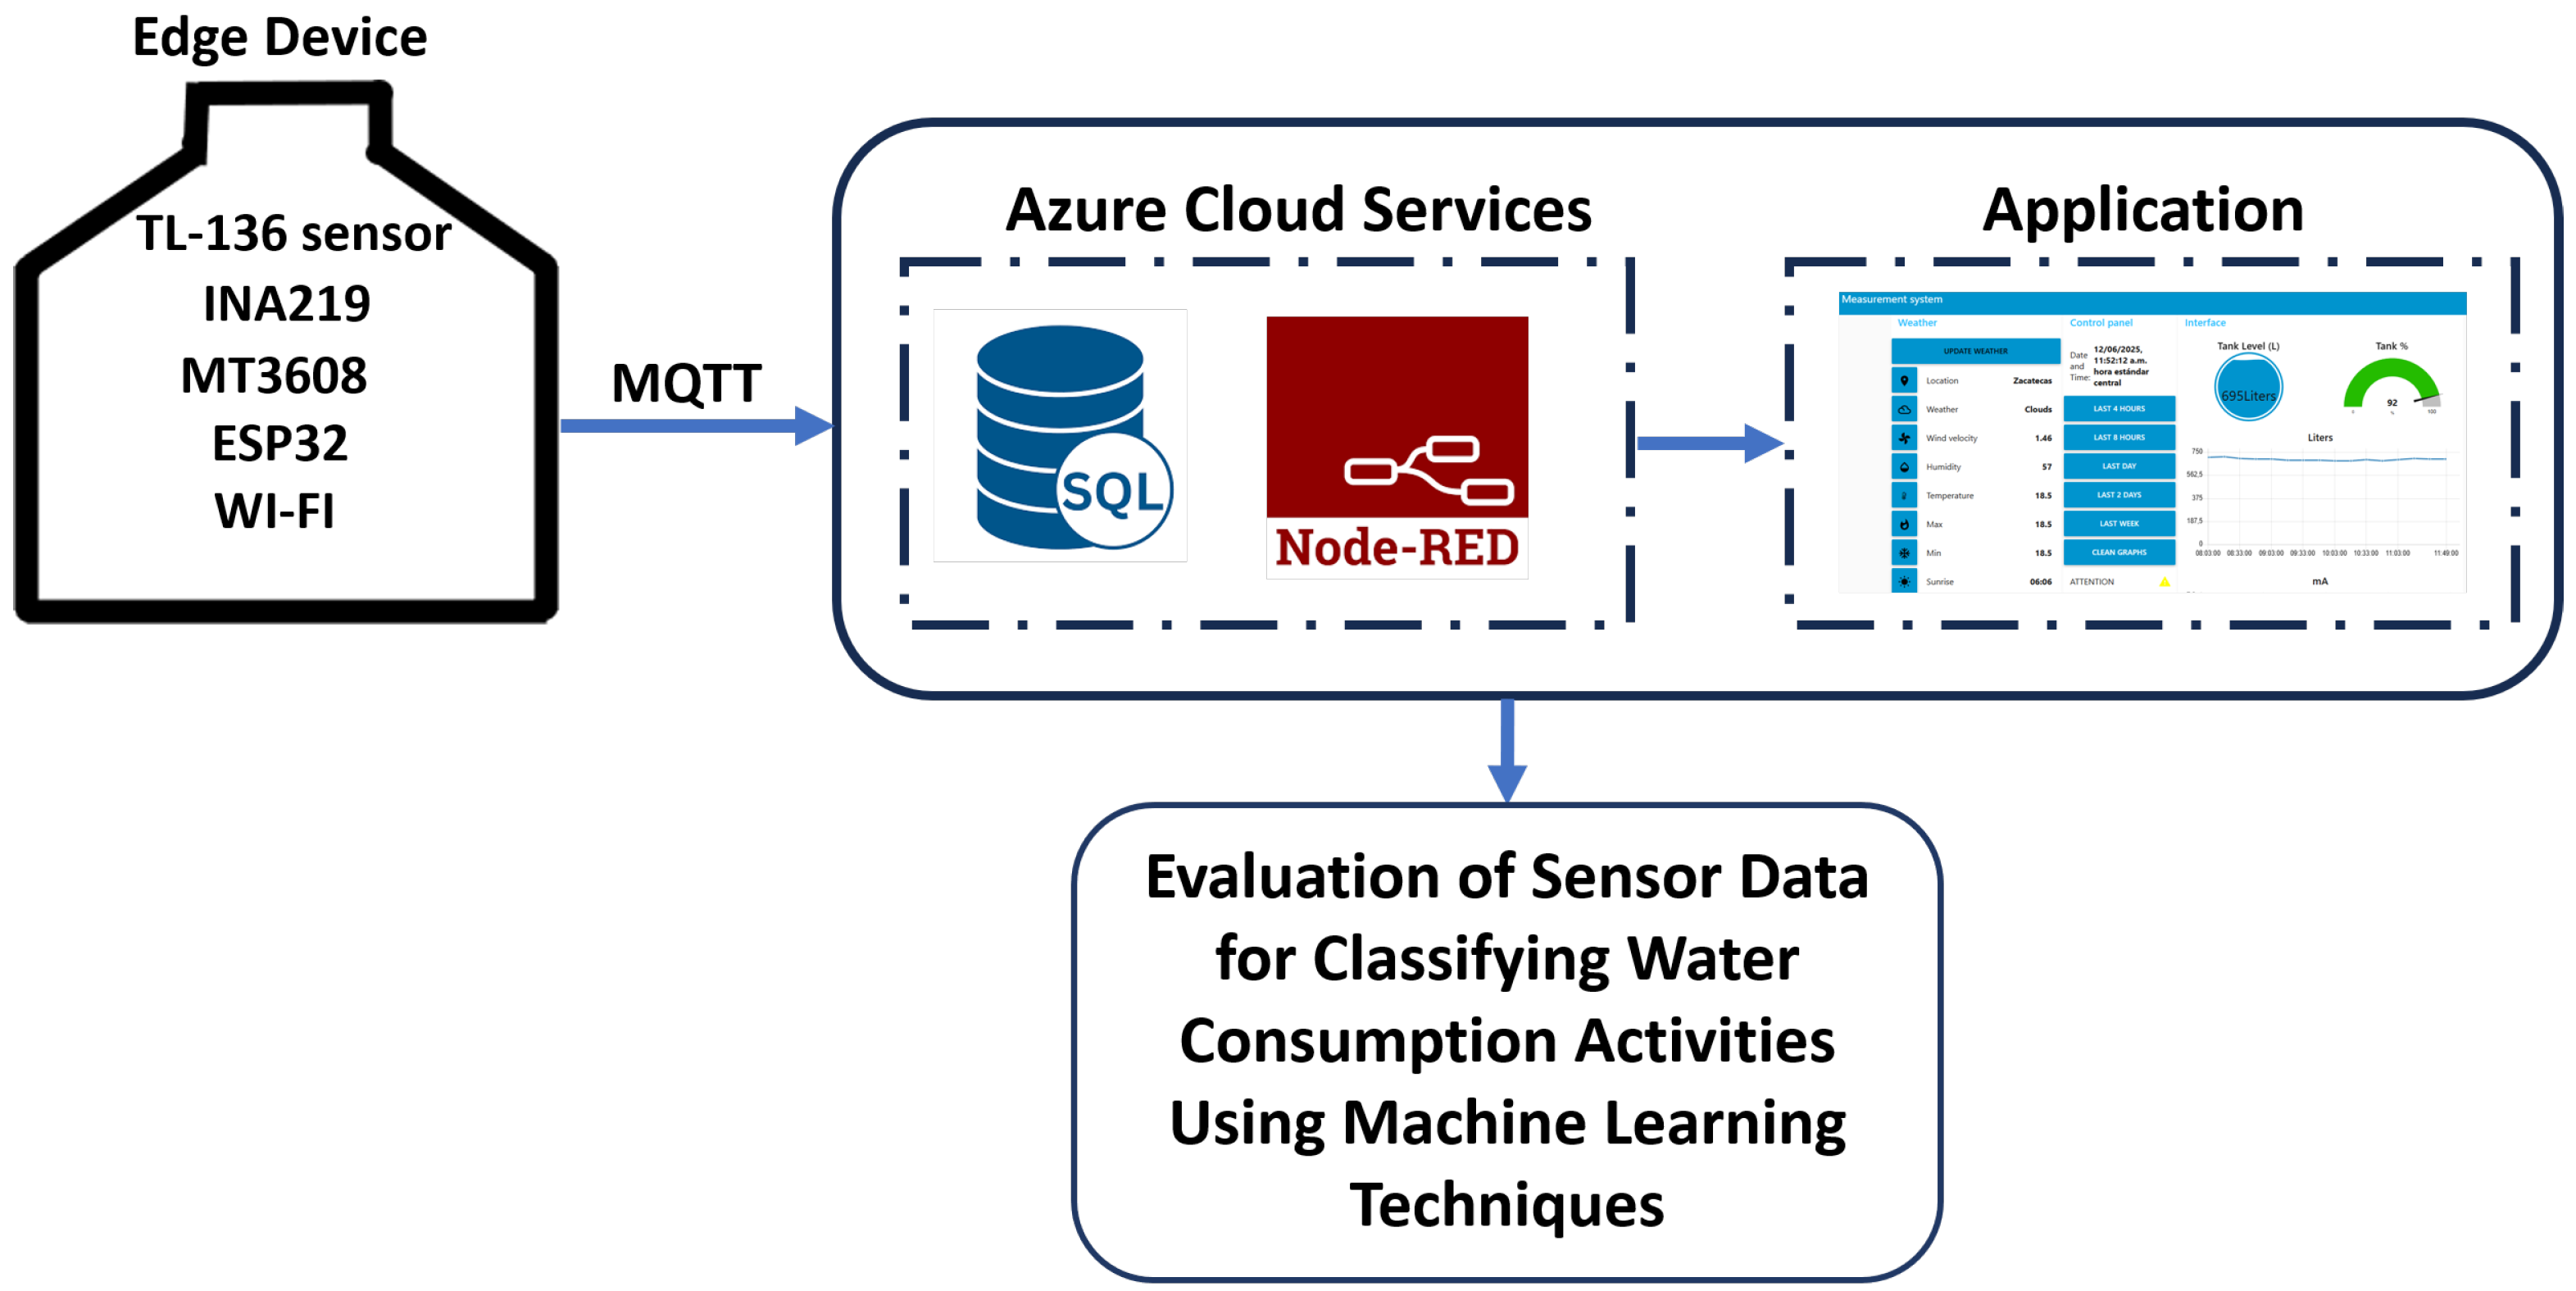
To achieve real time monitoring with the pressure sensor, the architecture shown in
Figure 3 was implemented.
The edge device integrates four key hardware components:
- 1.
ESP32-WROOM-32-N4: This microcontroller integrates a Wi-Fi module and a 12-bit ADC. It acquires the signal from the pressure sensor, converts it into digital values, and transmits the processed data to the cloud. It is powered via a household AC-DC adapter to ensure continuous, battery free operation.
- 2.
MT3608 DC-DC Step-Up Converter (Aerosemi Technology Co., Ltd., Xi’an, China): This boost converter steps up the 3.3 V from the ESP32 to approximately 12 V. This higher voltage is essential to provide a stable excitation voltage for the pressure sensor, ensuring a consistent 4–20 mA output.
- 3.
INA219 Current Monitor (Texas Instruments, Dallas, TX, USA): This component measures the 4–20 mA current generated by the sensor. It interfaces with the ESP32 via Inter-Integrated Circuit (I2C), allowing for high-precision real-time monitoring with a resolution of ±0.1 mA.
- 4.
TL-136 Hydrostatic Pressure Sensor (Anhui Qidian Automation Technology Co., Ltd., Huaibei, China): Installed at the base of the tank, this sensor provides a standardized 4–20 mA signal proportional to the water head. Its submerged principle makes the signal robust against transient surface motion (sloshing) or surface aeration, offering an accuracy of ±0.5% Full Scale.
Similar to the laser sensor modality, the telemetry from the pressure sensor is transmitted via MQTT to the Microsoft Azure cloud, where a Node-RED flow manages it. The system processes raw UART data by filtering out asynchronous status messages and extracting numerical values. To ensure measurement stability, the system averages consecutive samples.
The raw distance in millimeters (
) is obtained by the arithmetic mean of the sampled data
, as shown in Equation (
2):
Subsequently, the height is converted to centimeters (
) and meters (
) to ensure data persistence within a structured MySQL database, following these linear transformations as shown in Equations (
3) and (
4):
This multi-unit approach ensures high-resolution tracking of current in mA and calculated heights across a wide range of magnitudes.
To provide an interpretable format for real-time monitoring and downstream analytics, the analog output is processed through a specific volumetric conversion. Based on the calibrated characteristics of the water container, the following linear regression Equation (
5) is applied:
where
L represents the estimated water volume in liters and
I denotes the analog sensor output in milliamperes. This calculation allows the system to bypass intermediate distance conversions and directly estimate volume from current intensity. Finally, the resulting telemetry is visualized on a dedicated dashboard, displaying real-time level trends and historical usage through interactive charts and gauges.
3.3. Data Acquisition
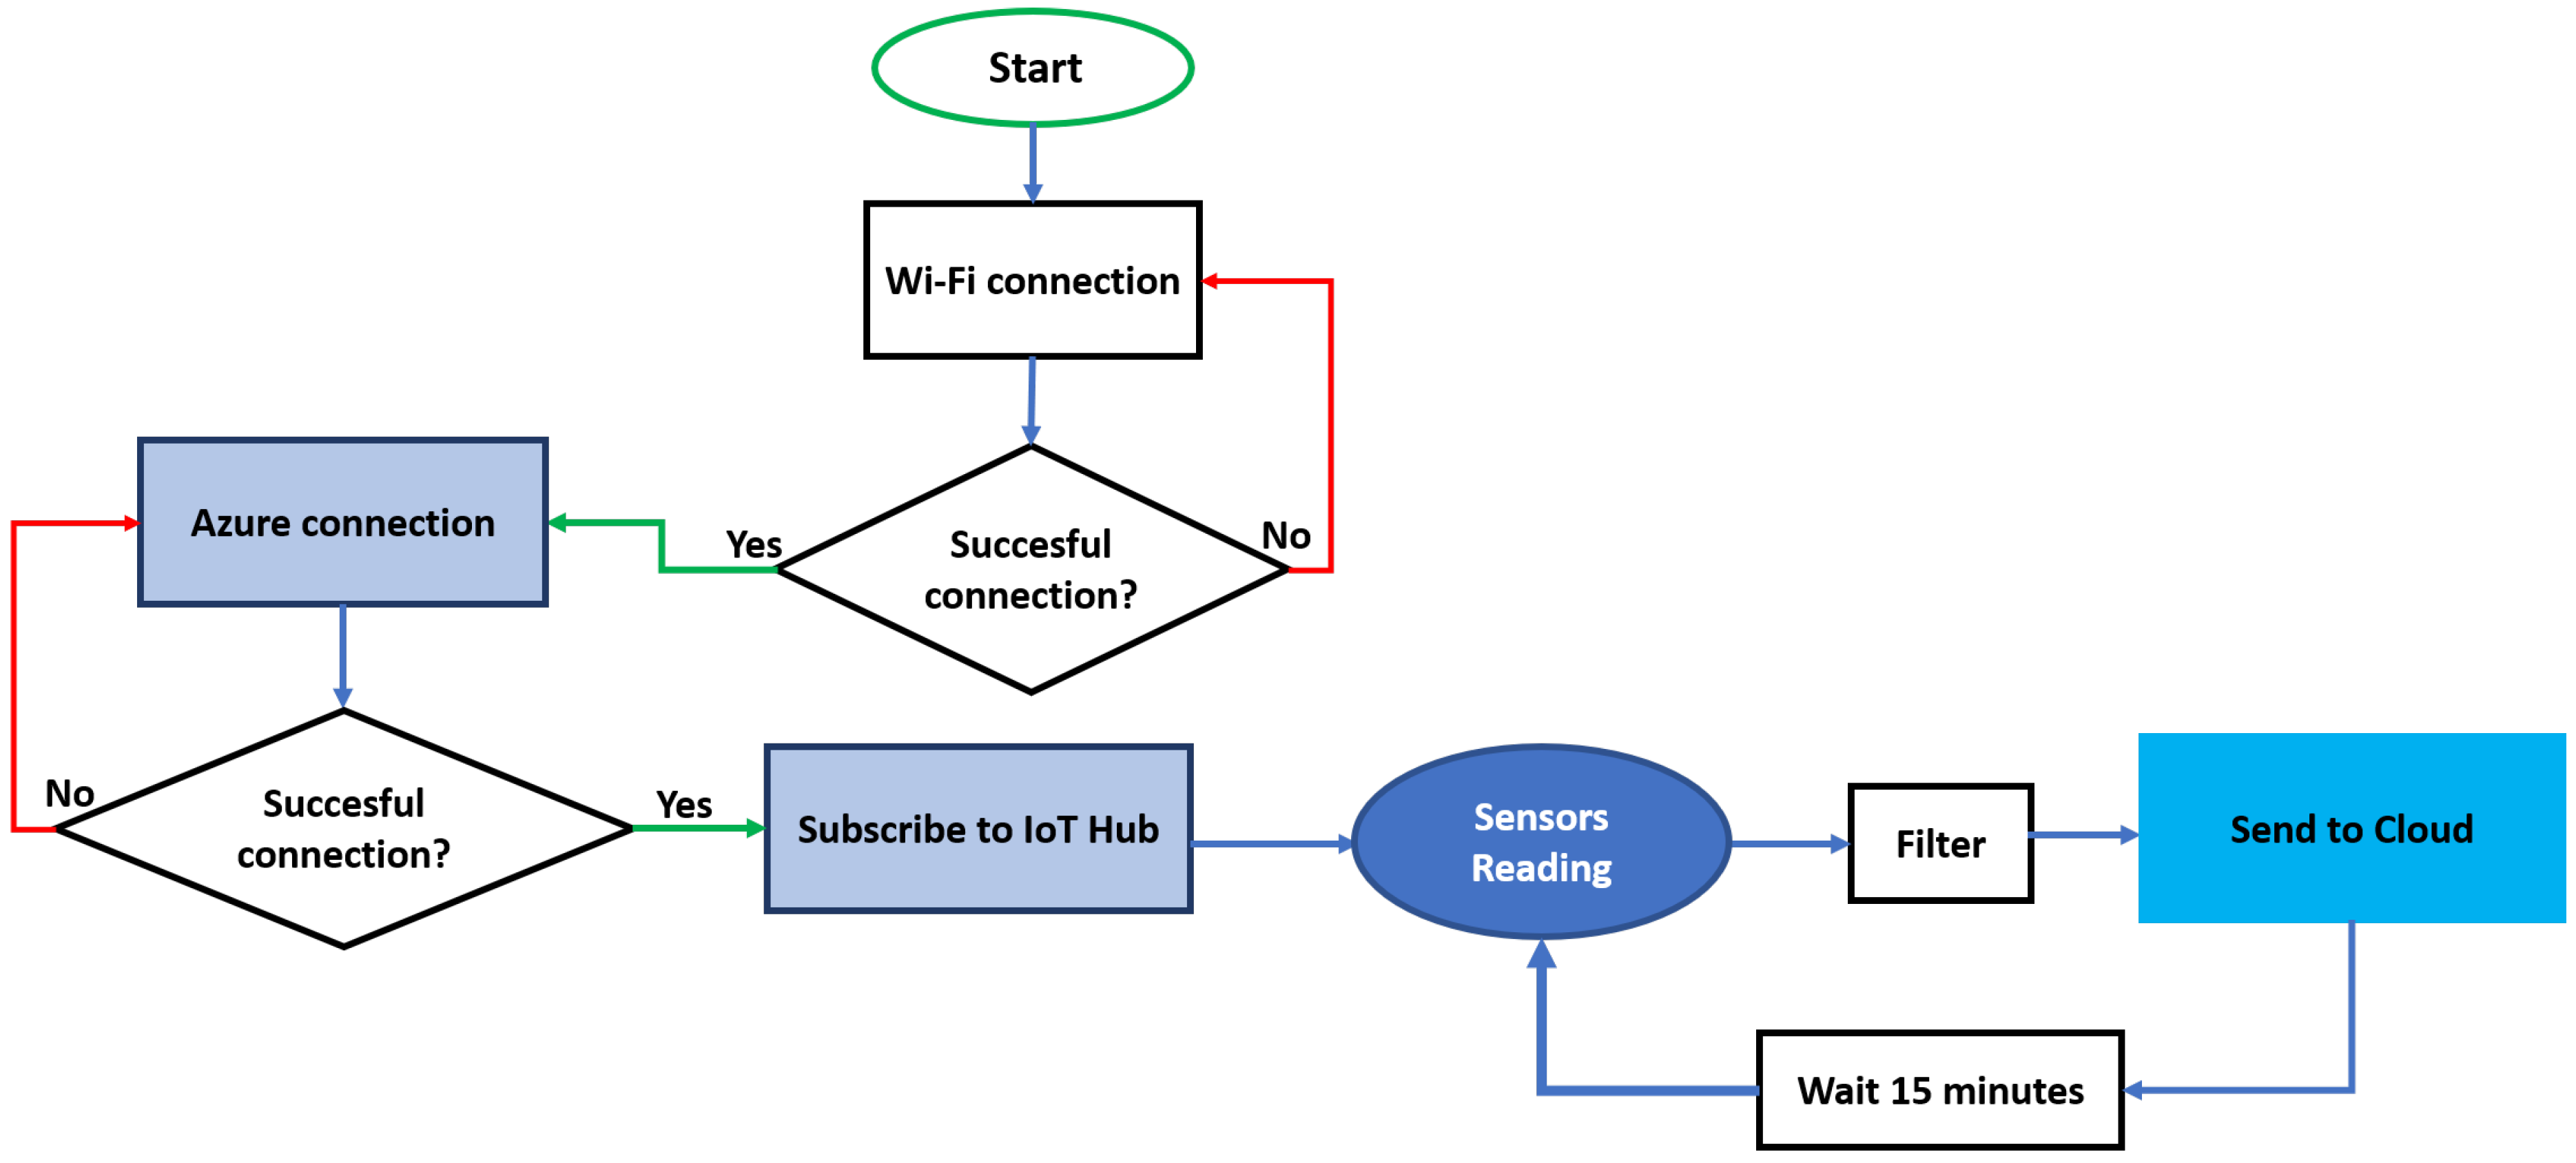
The embedded program developed for the microcontroller for data acquisition and cloud transmission followed a unified structured workflow for both sensing systems. The process begins with a start phase in which the ESP32 configures the necessary peripherals for both sensors.
A critical prerequisite is establishing a stable Wi-Fi connection; the system is programmed to continuously verify network availability, as subsequent connection to Azure cloud services depends entirely on this link. As illustrated in the workflow diagram (
Figure 4), once the network and Azure IoT Hub handshakes are successful, the system proceeds to the data acquisition stage.
Data acquisition is performed sequentially for both sensors connected to the same ESP32 device:
Sensors Reading: The microcontroller captures the respective signals from each device. For the pressure sensor, the analog current signal is digitized via an I2C monitor, while the laser sensor provides distance measurements through its digital interface.
Filtering: To ensure measurement integrity and eliminate transient noise, the system implements a filtering process. It collects 40 consecutive readings from each sensor and computes their average. This statistical smoothing produces stable water-level estimates by mitigating fluctuations caused by electrical noise or surface ripples.
Following filtering, the data from both measurement principles is organized into a structured JavaScript Object Notation (JSON) payload. This payload is transmitted to the Azure IoT Hub via MQTT. After transmission, the system enters a 15-min wait phase before looping back to the acquisition stage, maintaining a continuous automated monitoring cycle.
3.4. Laser Sensor Operational Issues and Experimental Mitigation
After the laser sensor was installed inside the water tank for level measurement, an unexpected and critical operational issue was observed during prolonged operation. The high humidity in the enclosed environment caused water droplets to form on the sensor surface. This phenomenon significantly compromised the accuracy and stability of the distance measurements, introducing noise and intermittent reading errors that rendered the sensor unreliable for continuous monitoring.
In addition to condensation effects, disturbances were observed during water-inflow events, with the incoming water jet inducing oscillations and splashing. However, the most persistent and degrading factor affecting the sensor’s optical components was moisture accumulation. Consequently, the priority was to develop a mitigation strategy to protect the sensor from the high-humidity environment.
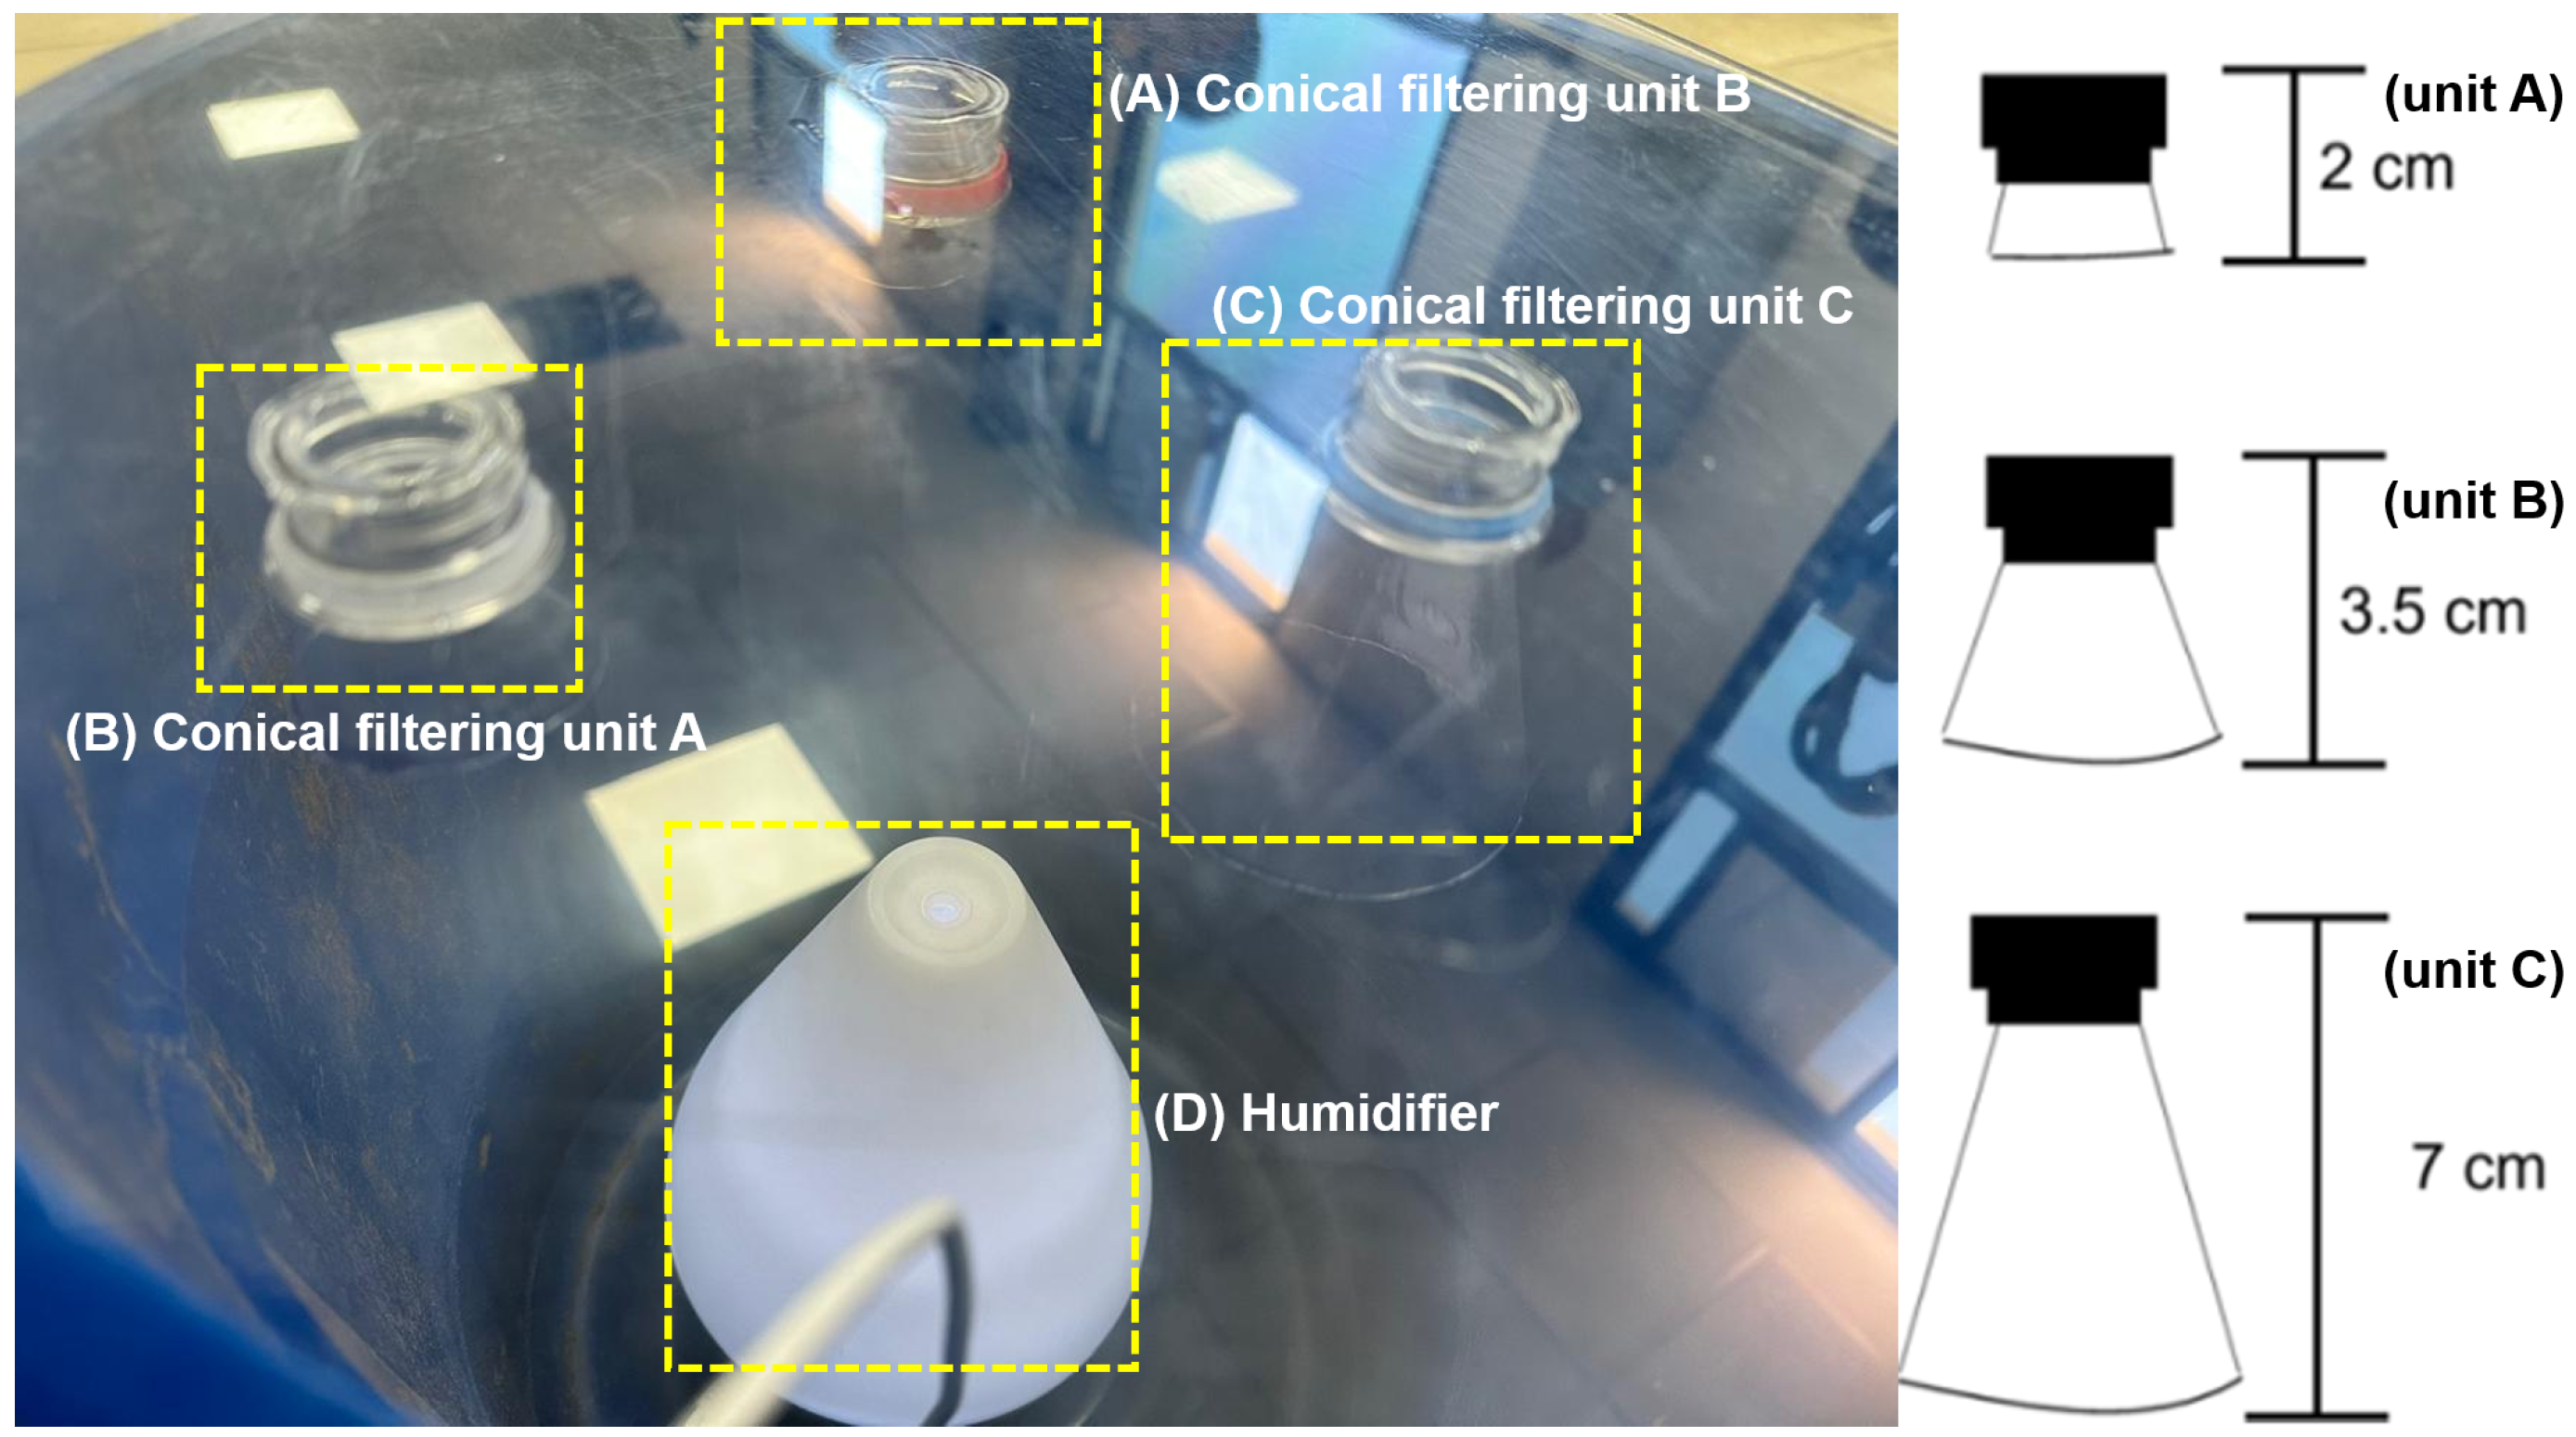
To address this specific challenge, a controlled experimental setup was designed and implemented to test different protective geometries against vapor accumulation. As illustrated in
Figure 5, the experimental setup comprised an acrylic platform supporting three conical filtering units of different sizes, a storage container used as a test chamber, and a humidifier to saturate the internal environment with vapor, thereby simulating the high-humidity conditions inside a domestic water tank. These filtering units were attached to the acrylic structure and designed to simulate protective mechanisms that reduce moisture accumulation on the sensor surface.
Each unit was specifically modified to represent different internal conditions, allowing a comparative evaluation of their effectiveness in preventing water droplets from forming on the sensor lens. This experimental approach aimed to isolate the laser sensor from direct humidity exposure while preserving its measurement capabilities. The configuration and implementation of this mitigation strategy are described in this subsection, whereas the quantitative evaluation of its impact on sensor performance is presented in
Section 5.
3.5. Internet of Things (IoT) for Data Processing
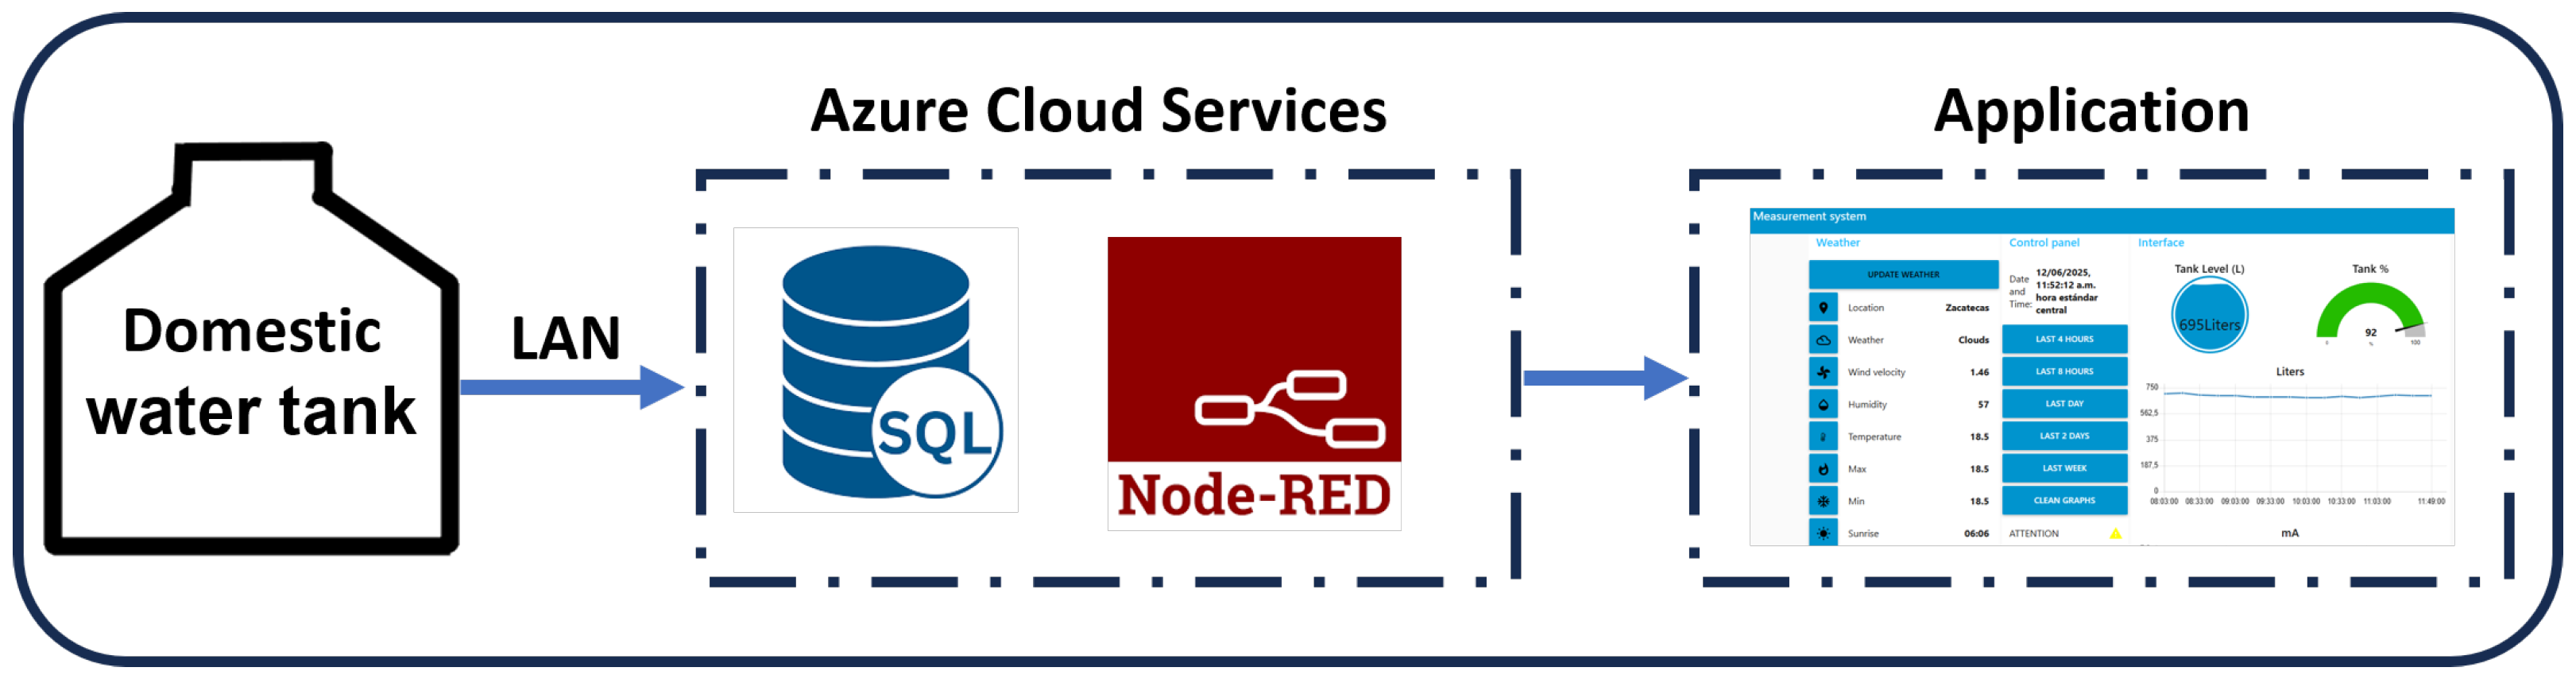
The system’s data acquisition flow, depicted in
Figure 6, utilizes Microsoft Azure services for robust processing and long-term storage. Telemetry generated by the edge microcontroller is streamed to the cloud using the MQTT protocol, an efficient messaging standard well-suited to environments with limited bandwidth or high communication latency.
Upon reaching the cloud, data streams are centralized and secured by the Azure IoT Hub. Acting as the primary message broker, the IoT Hub manages the secure, two-way exchange of data between the physical monitoring device and the Azure ecosystem. Its features encompass identity verification, intelligent telemetry routing, and comprehensive end-to-end security via advanced authentication (e.g., SAS tokens and X.509 certificates) and encryption. These protective measures ensure the integrity and confidentiality of the data throughout its entire journey.
Following ingestion, the Node-RED development platform takes control, handling and manipulating the incoming JSON payloads from the microcontroller. These payloads contain time-stamped current readings captured from the pressure sensor. The processed data is subsequently archived in a structured, cloud-hosted MySQL database, which is provisioned and managed directly within the Azure environment. This database provides a reliable repository for historical sensor readings, with a schema that includes fields for timestamp, raw current value, and calculated water volume. Furthermore, Azure’s managed database services facilitate seamless integration with advanced downstream analytics and ensure long-term data persistence through features like automated backups and high availability.
4. Machine Learning Algorithms
To classify residential water consumption events, five supervised learning models were selected: Decision Tree [
26,
27,
28], Random Forest [
29,
30,
31,
32,
33,
34,
35], Support Vector Machine [
36,
37,
38], k-Nearest Neighbors [
39,
40,
41], and Recurrent Neural Network with Long Short-Term Memory [
42,
43,
44]. These models were chosen to represent different learning paradigms, including rule-based, ensemble, distance-based, margin-based, and neural network baselines, which have been widely applied in classification tasks.
The selection was guided by the characteristics of the dataset, which consists of 4396 labeled events derived from water-level variations in a domestic storage tank. Given the relatively low dimensionality of the feature space, classical machine learning models such as DT, RF, SVM, and KNN have been shown to perform effectively in similar classification problems [
26,
27,
28,
29,
30,
31,
32,
33,
34,
35,
36,
37,
38,
39,
40,
41].
Additionally, the LSTM model was included to serve as a deep learning baseline evaluated on the exact same tabular feature set as the classical models [
42,
43,
44].
All models were trained using a supervised learning approach with an 80/20 train-test split to ensure a consistent evaluation framework. The input features included Initial_Liters, Final_Liters, Initial_mA, Final_mA, and Consumed_Liters, which capture both the system state and the magnitude of each consumption event.
Hyperparameters were selected through empirical tuning to balance model complexity and generalization performance. For the SVM, a radial basis function (RBF) kernel was used with optimized values of C and gamma [
36,
37,
38]. The RF model was configured with a defined number of trees and maximum depth to improve robustness and reduce overfitting [
29,
30,
31,
32]. The KNN model was evaluated using different values of k and distance metrics [
39,
40,
41], while the DT model was constrained through depth and splitting criteria [
26,
27,
28]. For the LSTM model, the architecture was adapted to process the identical aggregate feature set, ensuring a uniform comparative baseline [
42,
43,
44].
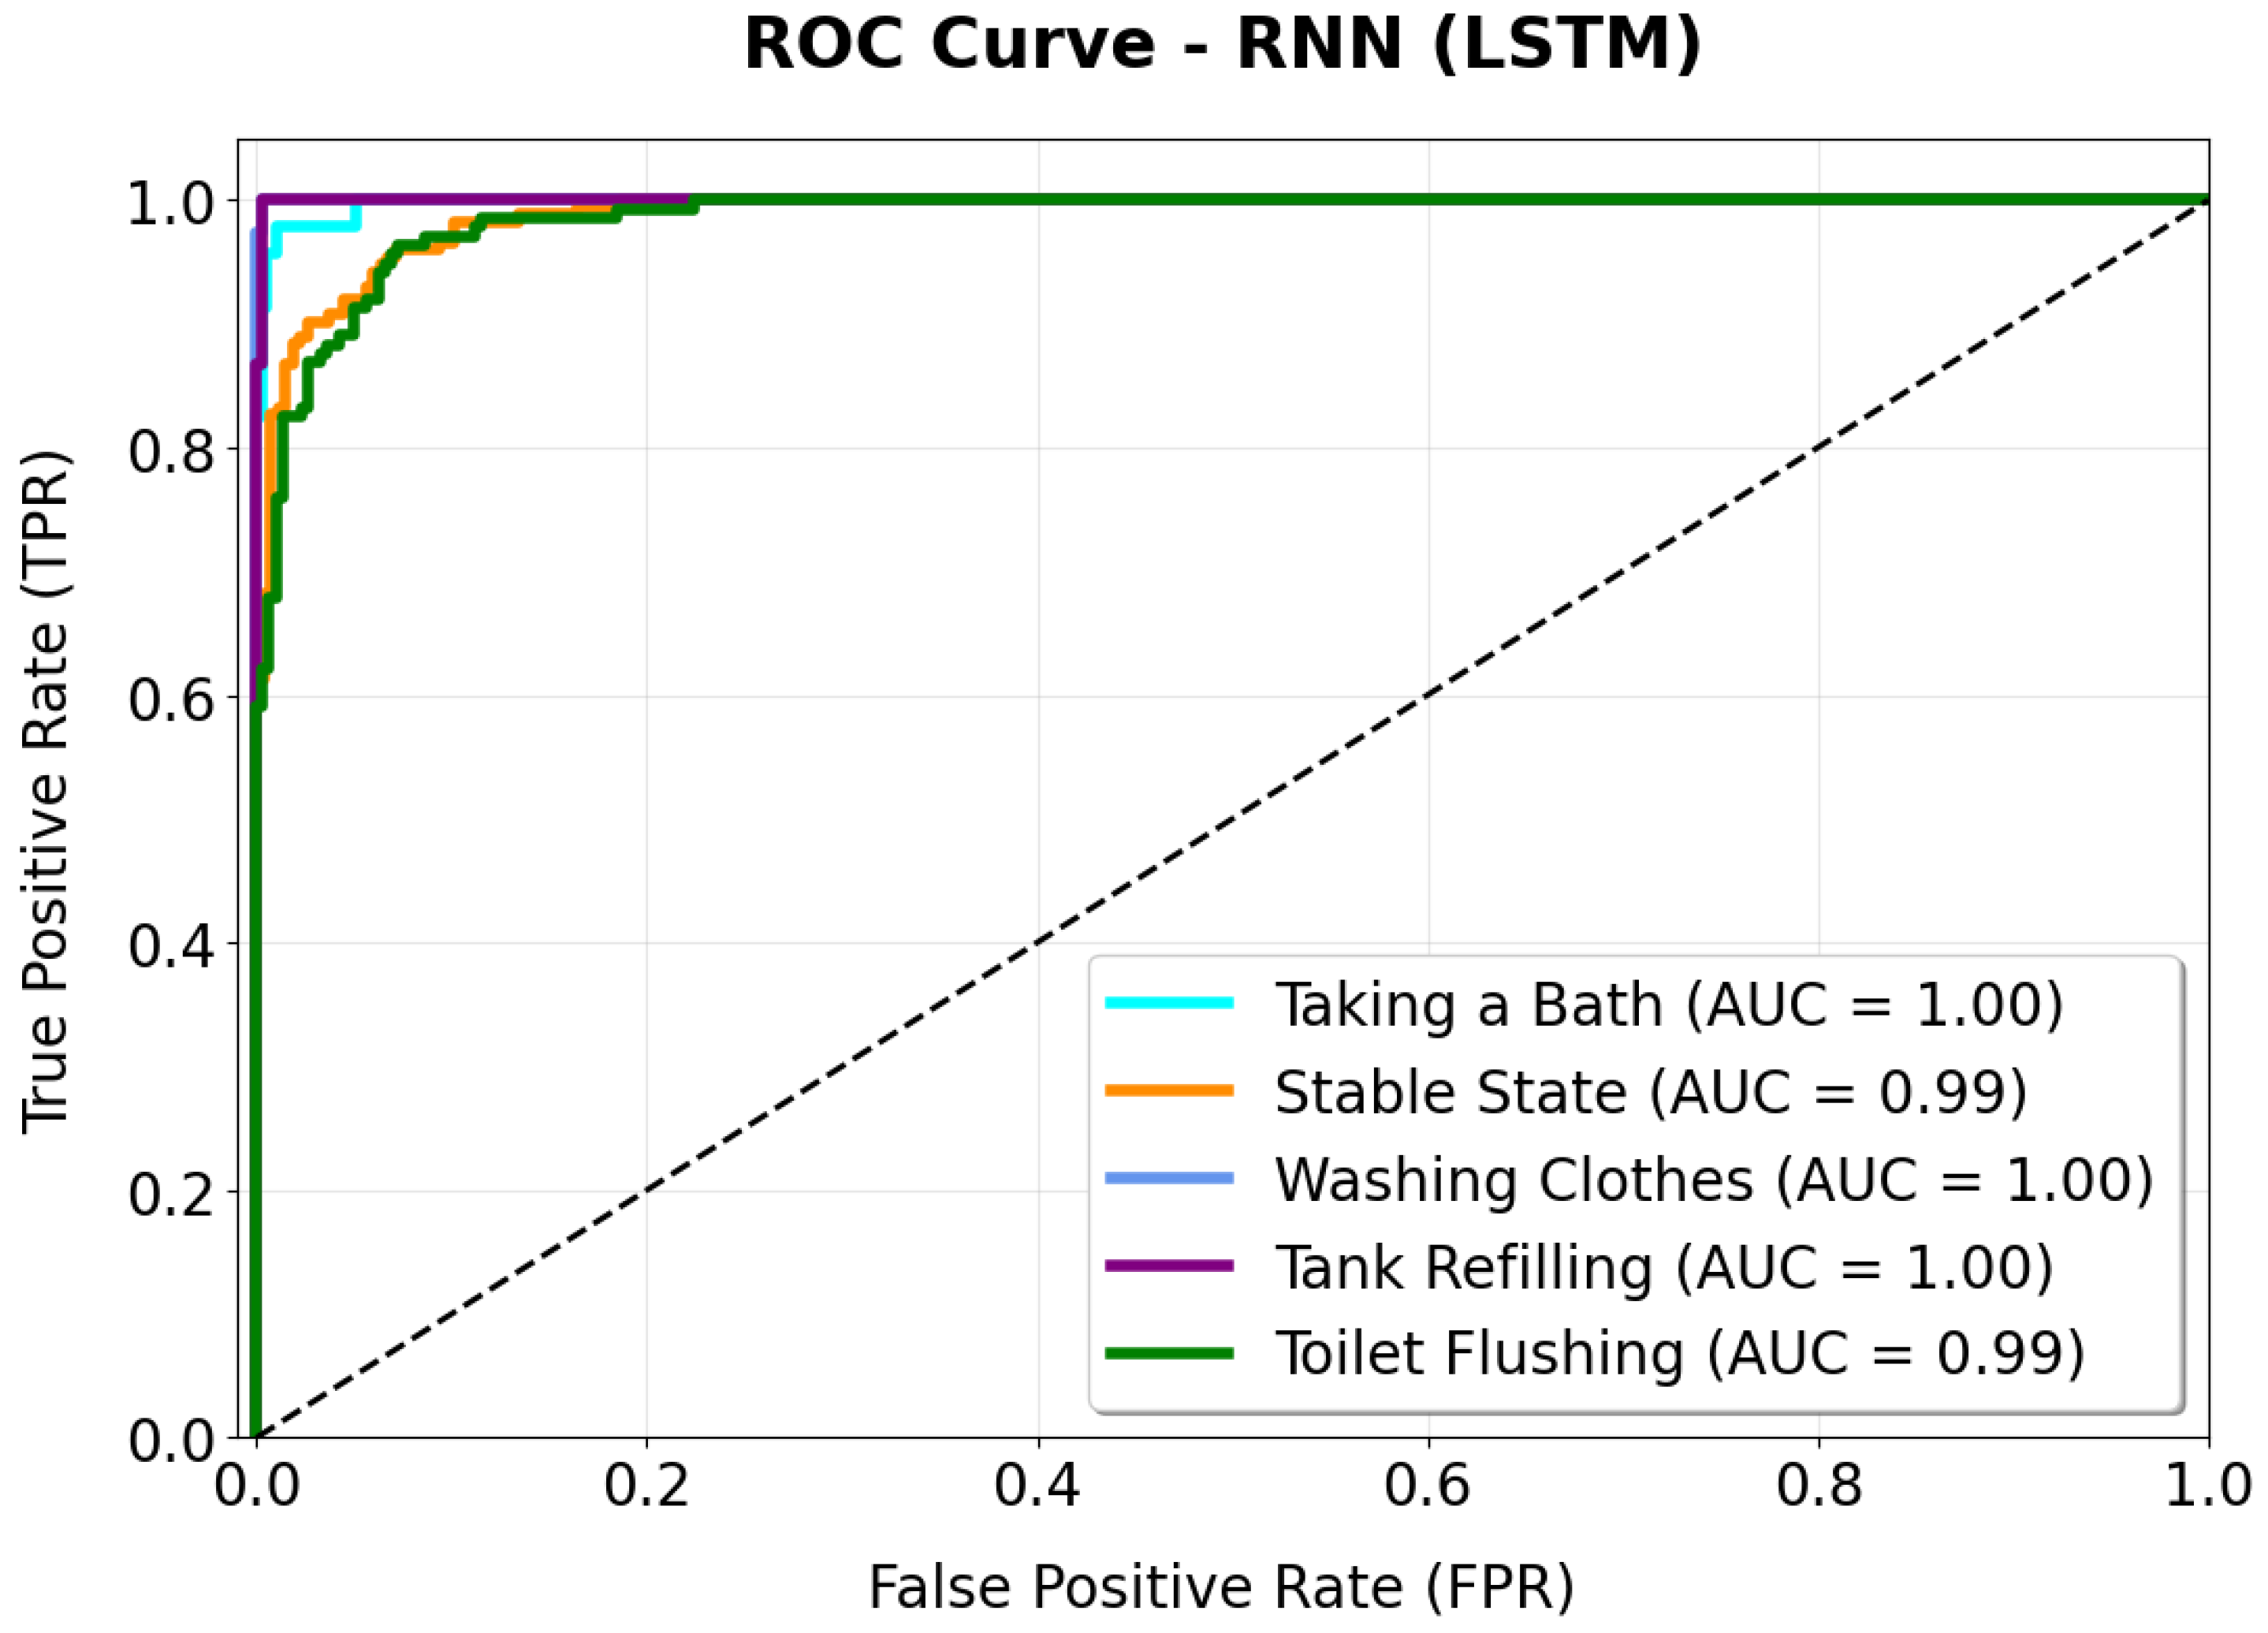
Model performance was evaluated using standard classification metrics, including accuracy, precision, recall, F1-score, and the Area Under the ROC Curve (AUC), which are commonly used to assess classification performance [
45,
46,
47].
Detailed theoretical descriptions of the algorithms and evaluation metrics are well established in the literature and are therefore not repeated here.
6. Discussion
The results obtained in this study demonstrate that residential water consumption activities can be reliably classified using tank-level dynamics combined with supervised machine learning, even under intermittent water supply conditions and non-ideal sensing environments. Unlike many previous studies that rely on flow-based measurements or assume continuous water availability, the proposed framework explicitly addresses the complexities introduced by household storage tanks, which significantly alter the relationship between supply, storage, and actual consumption.
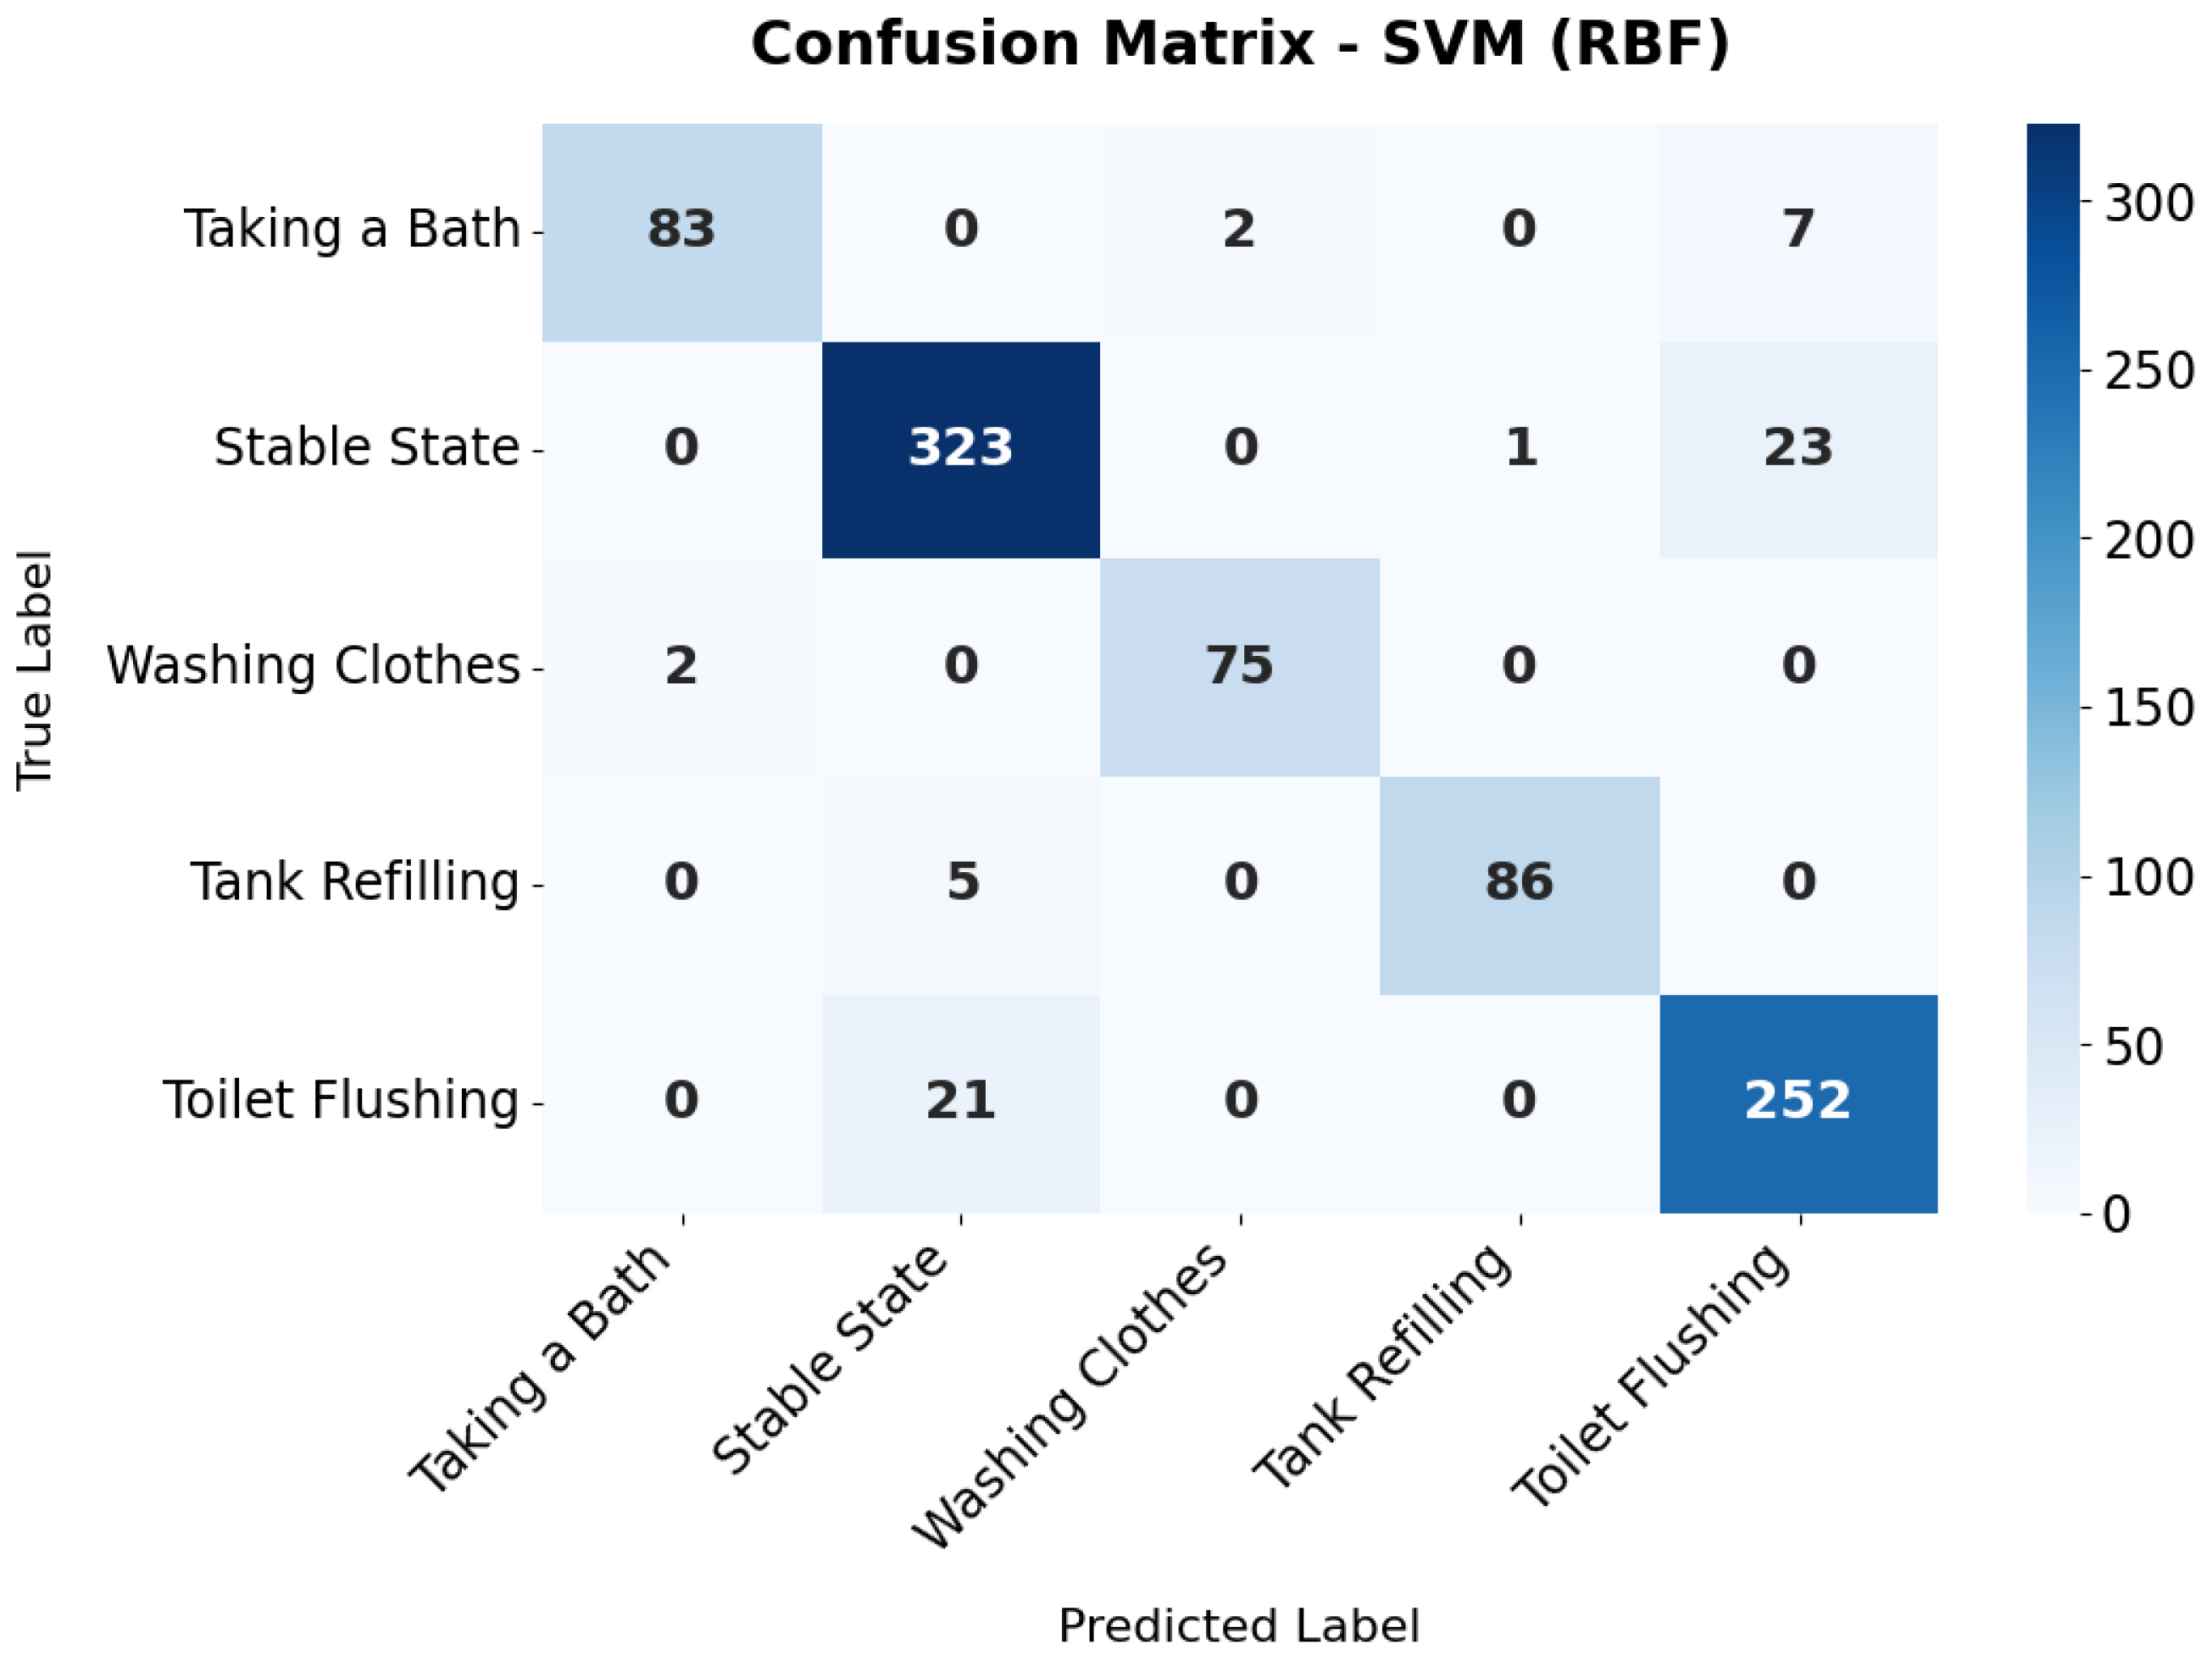
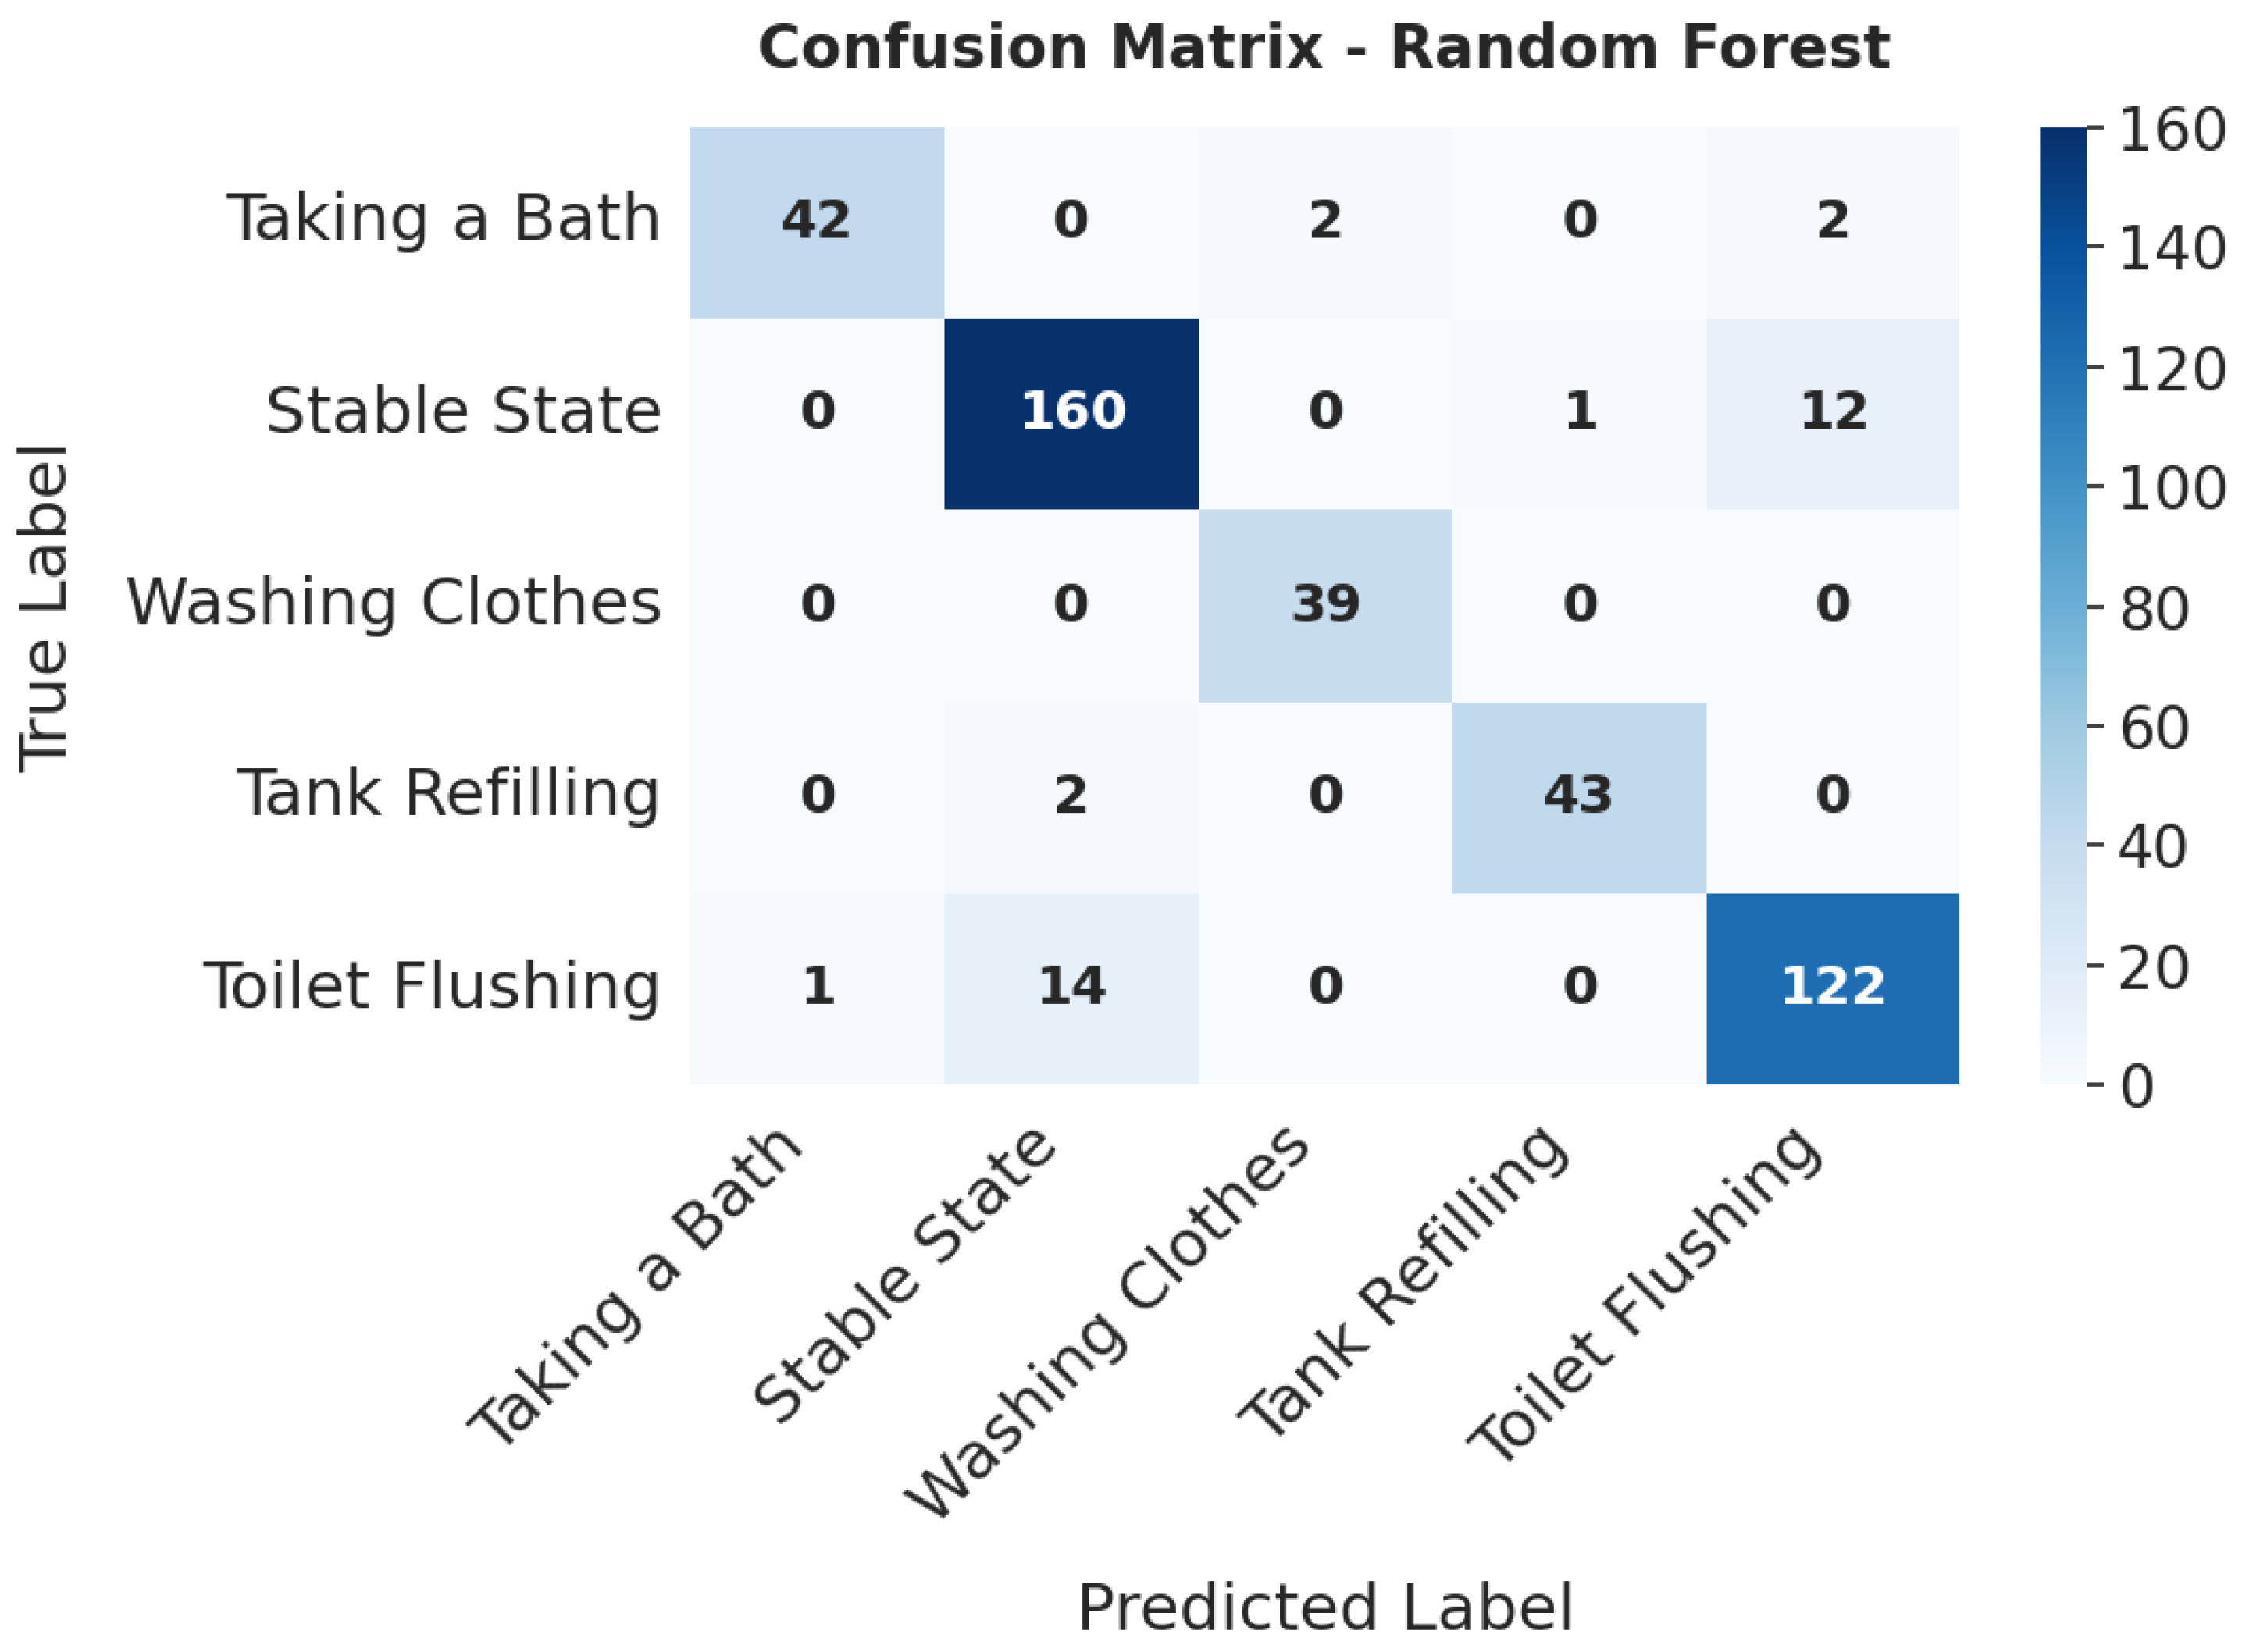
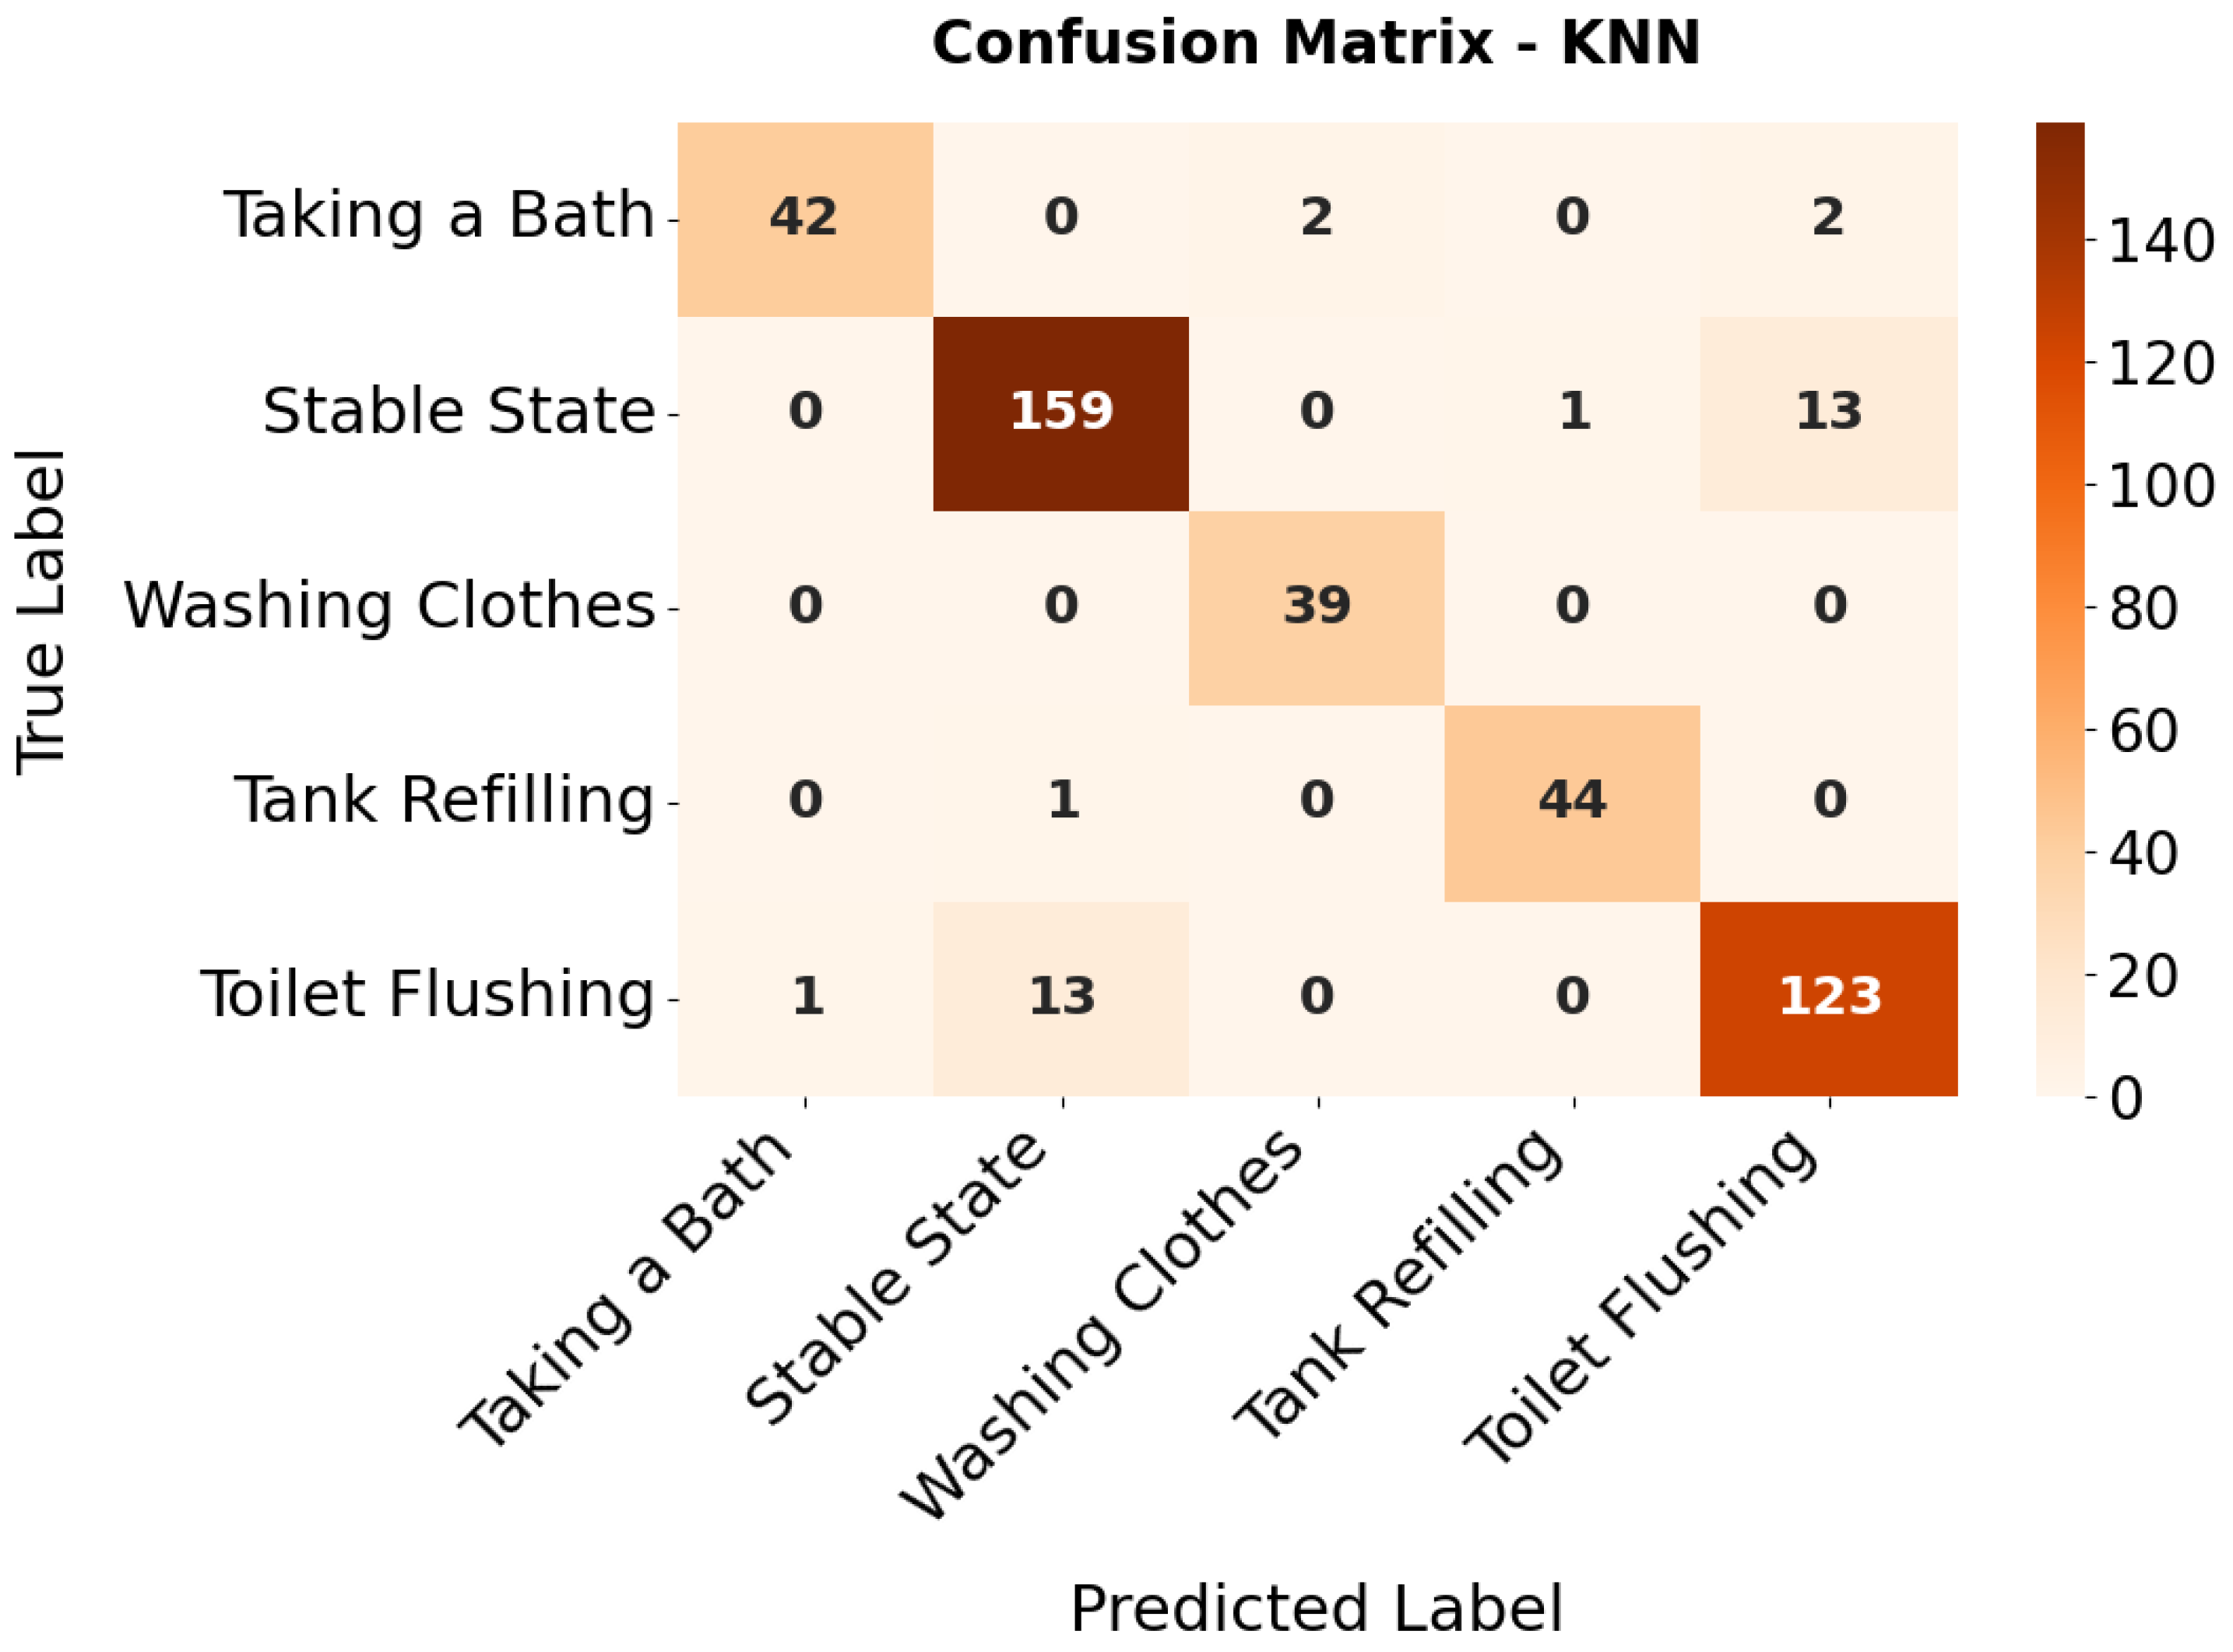
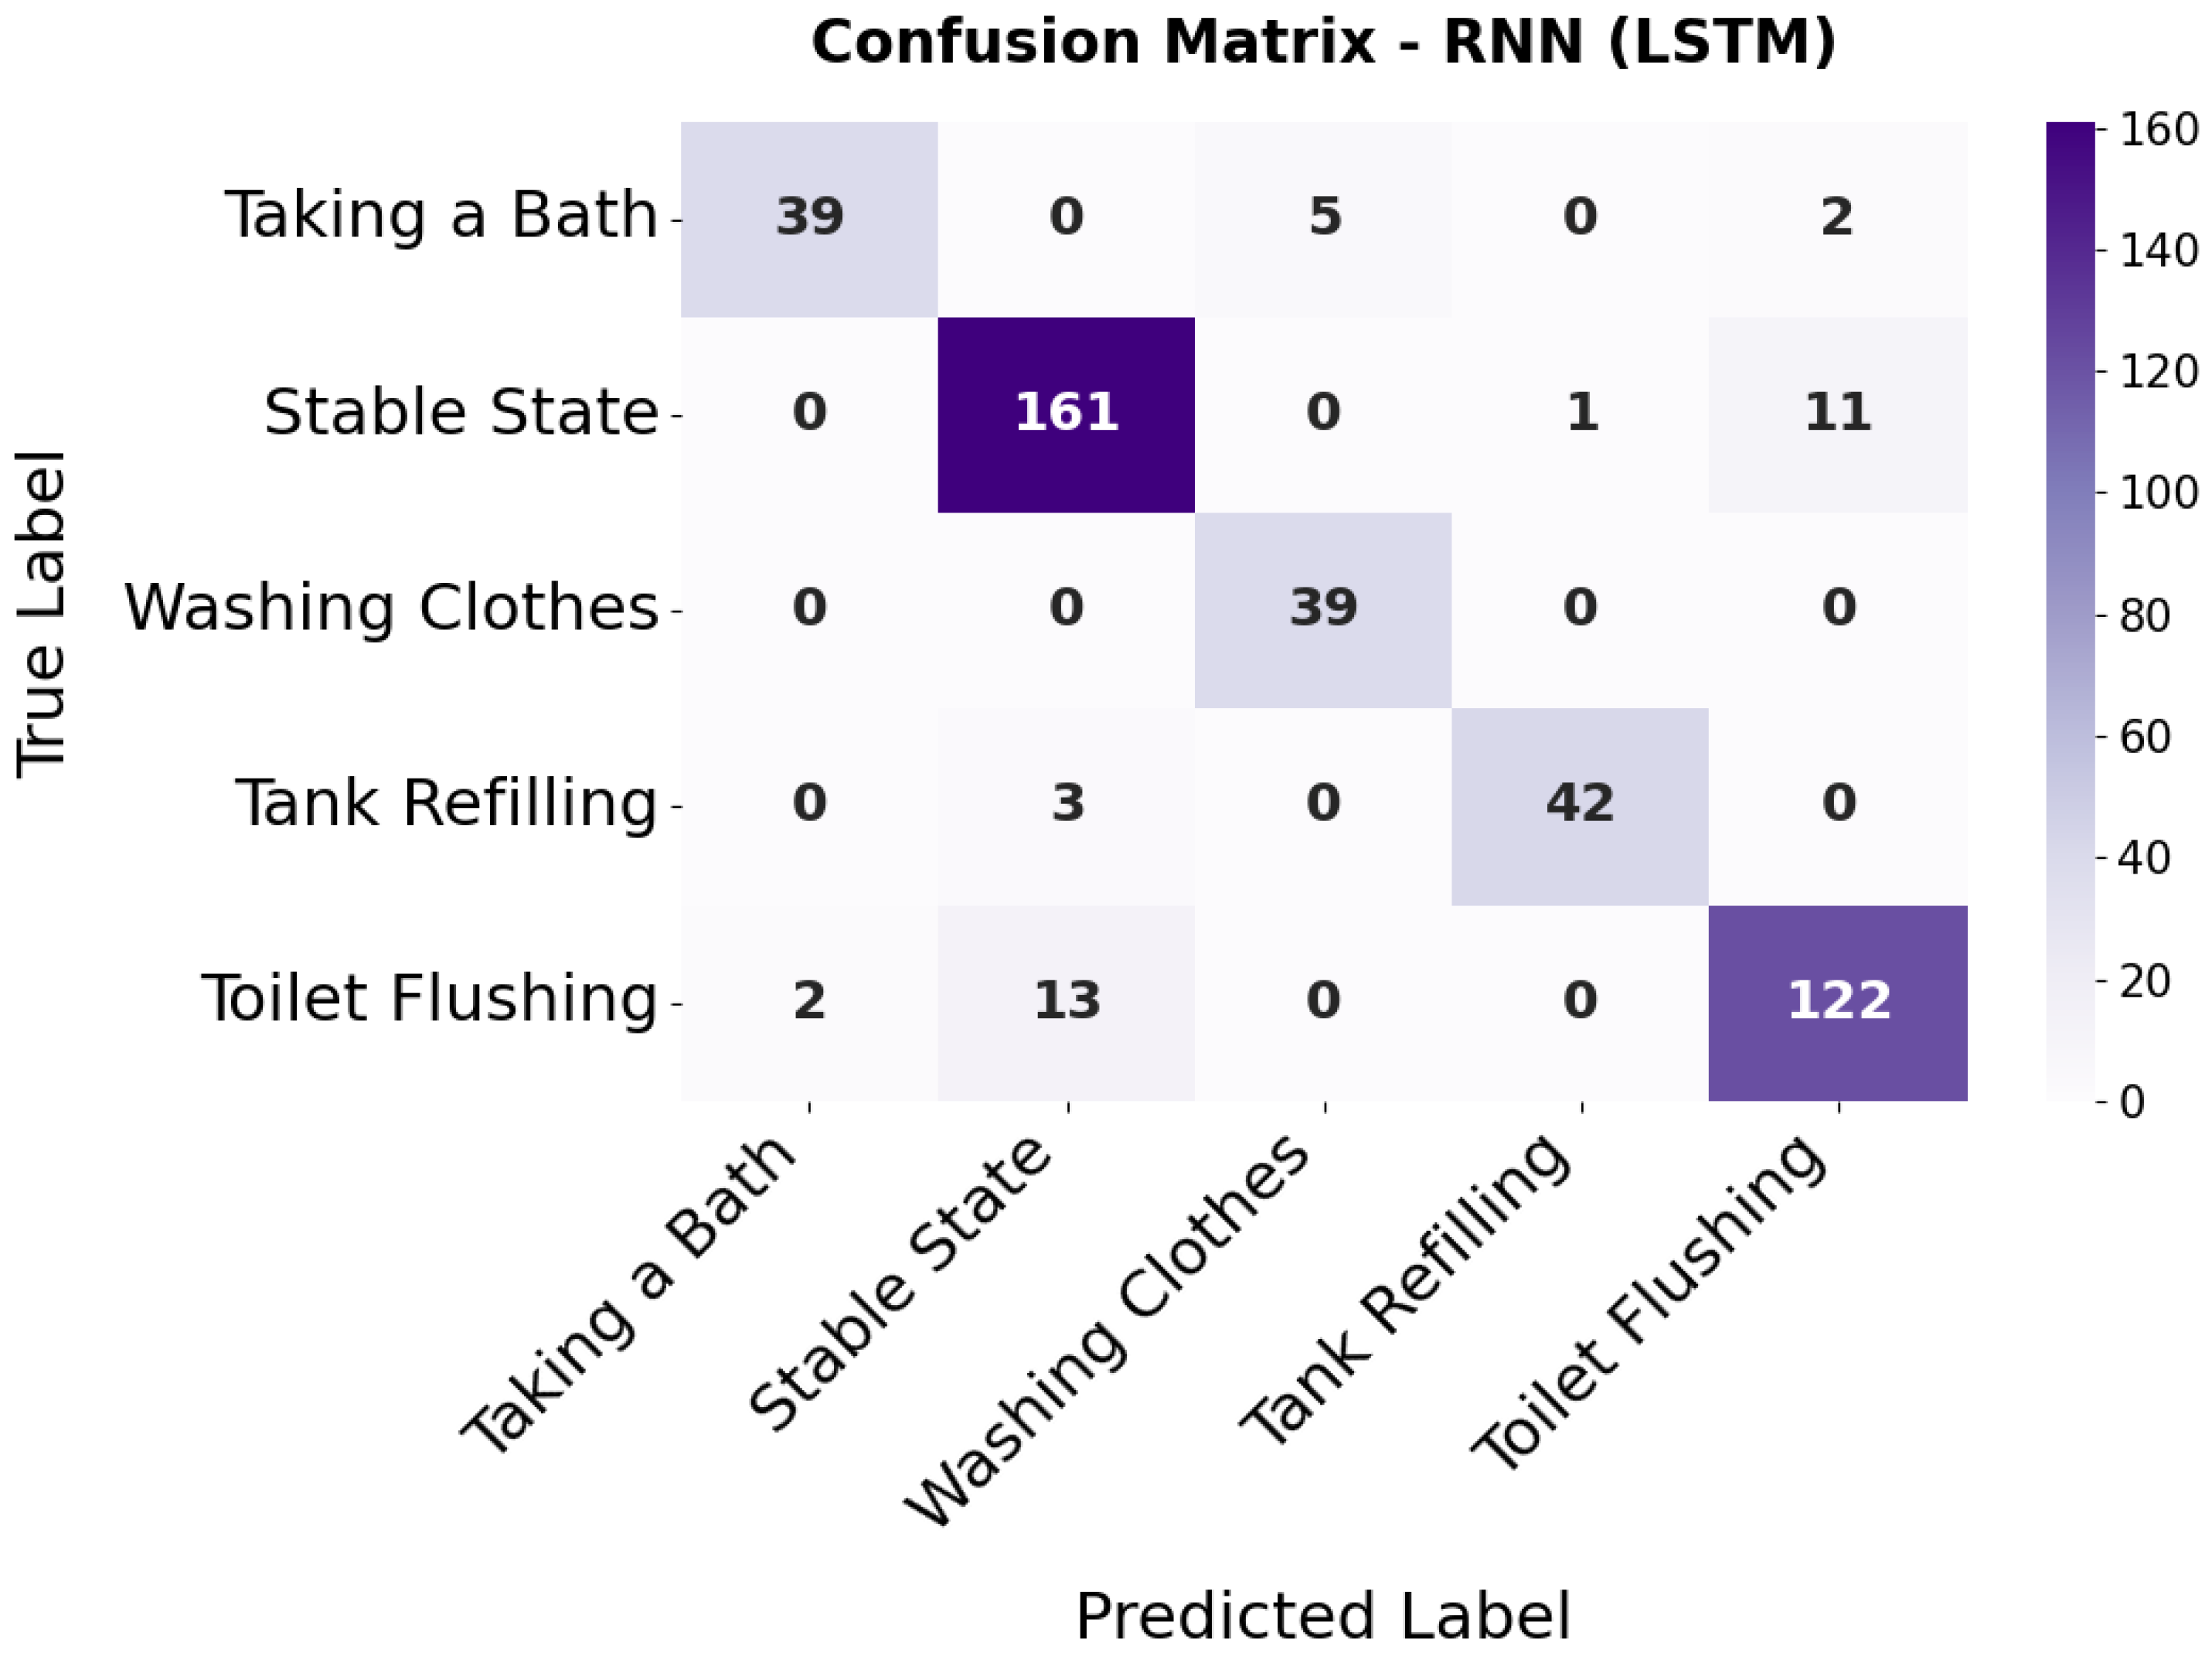
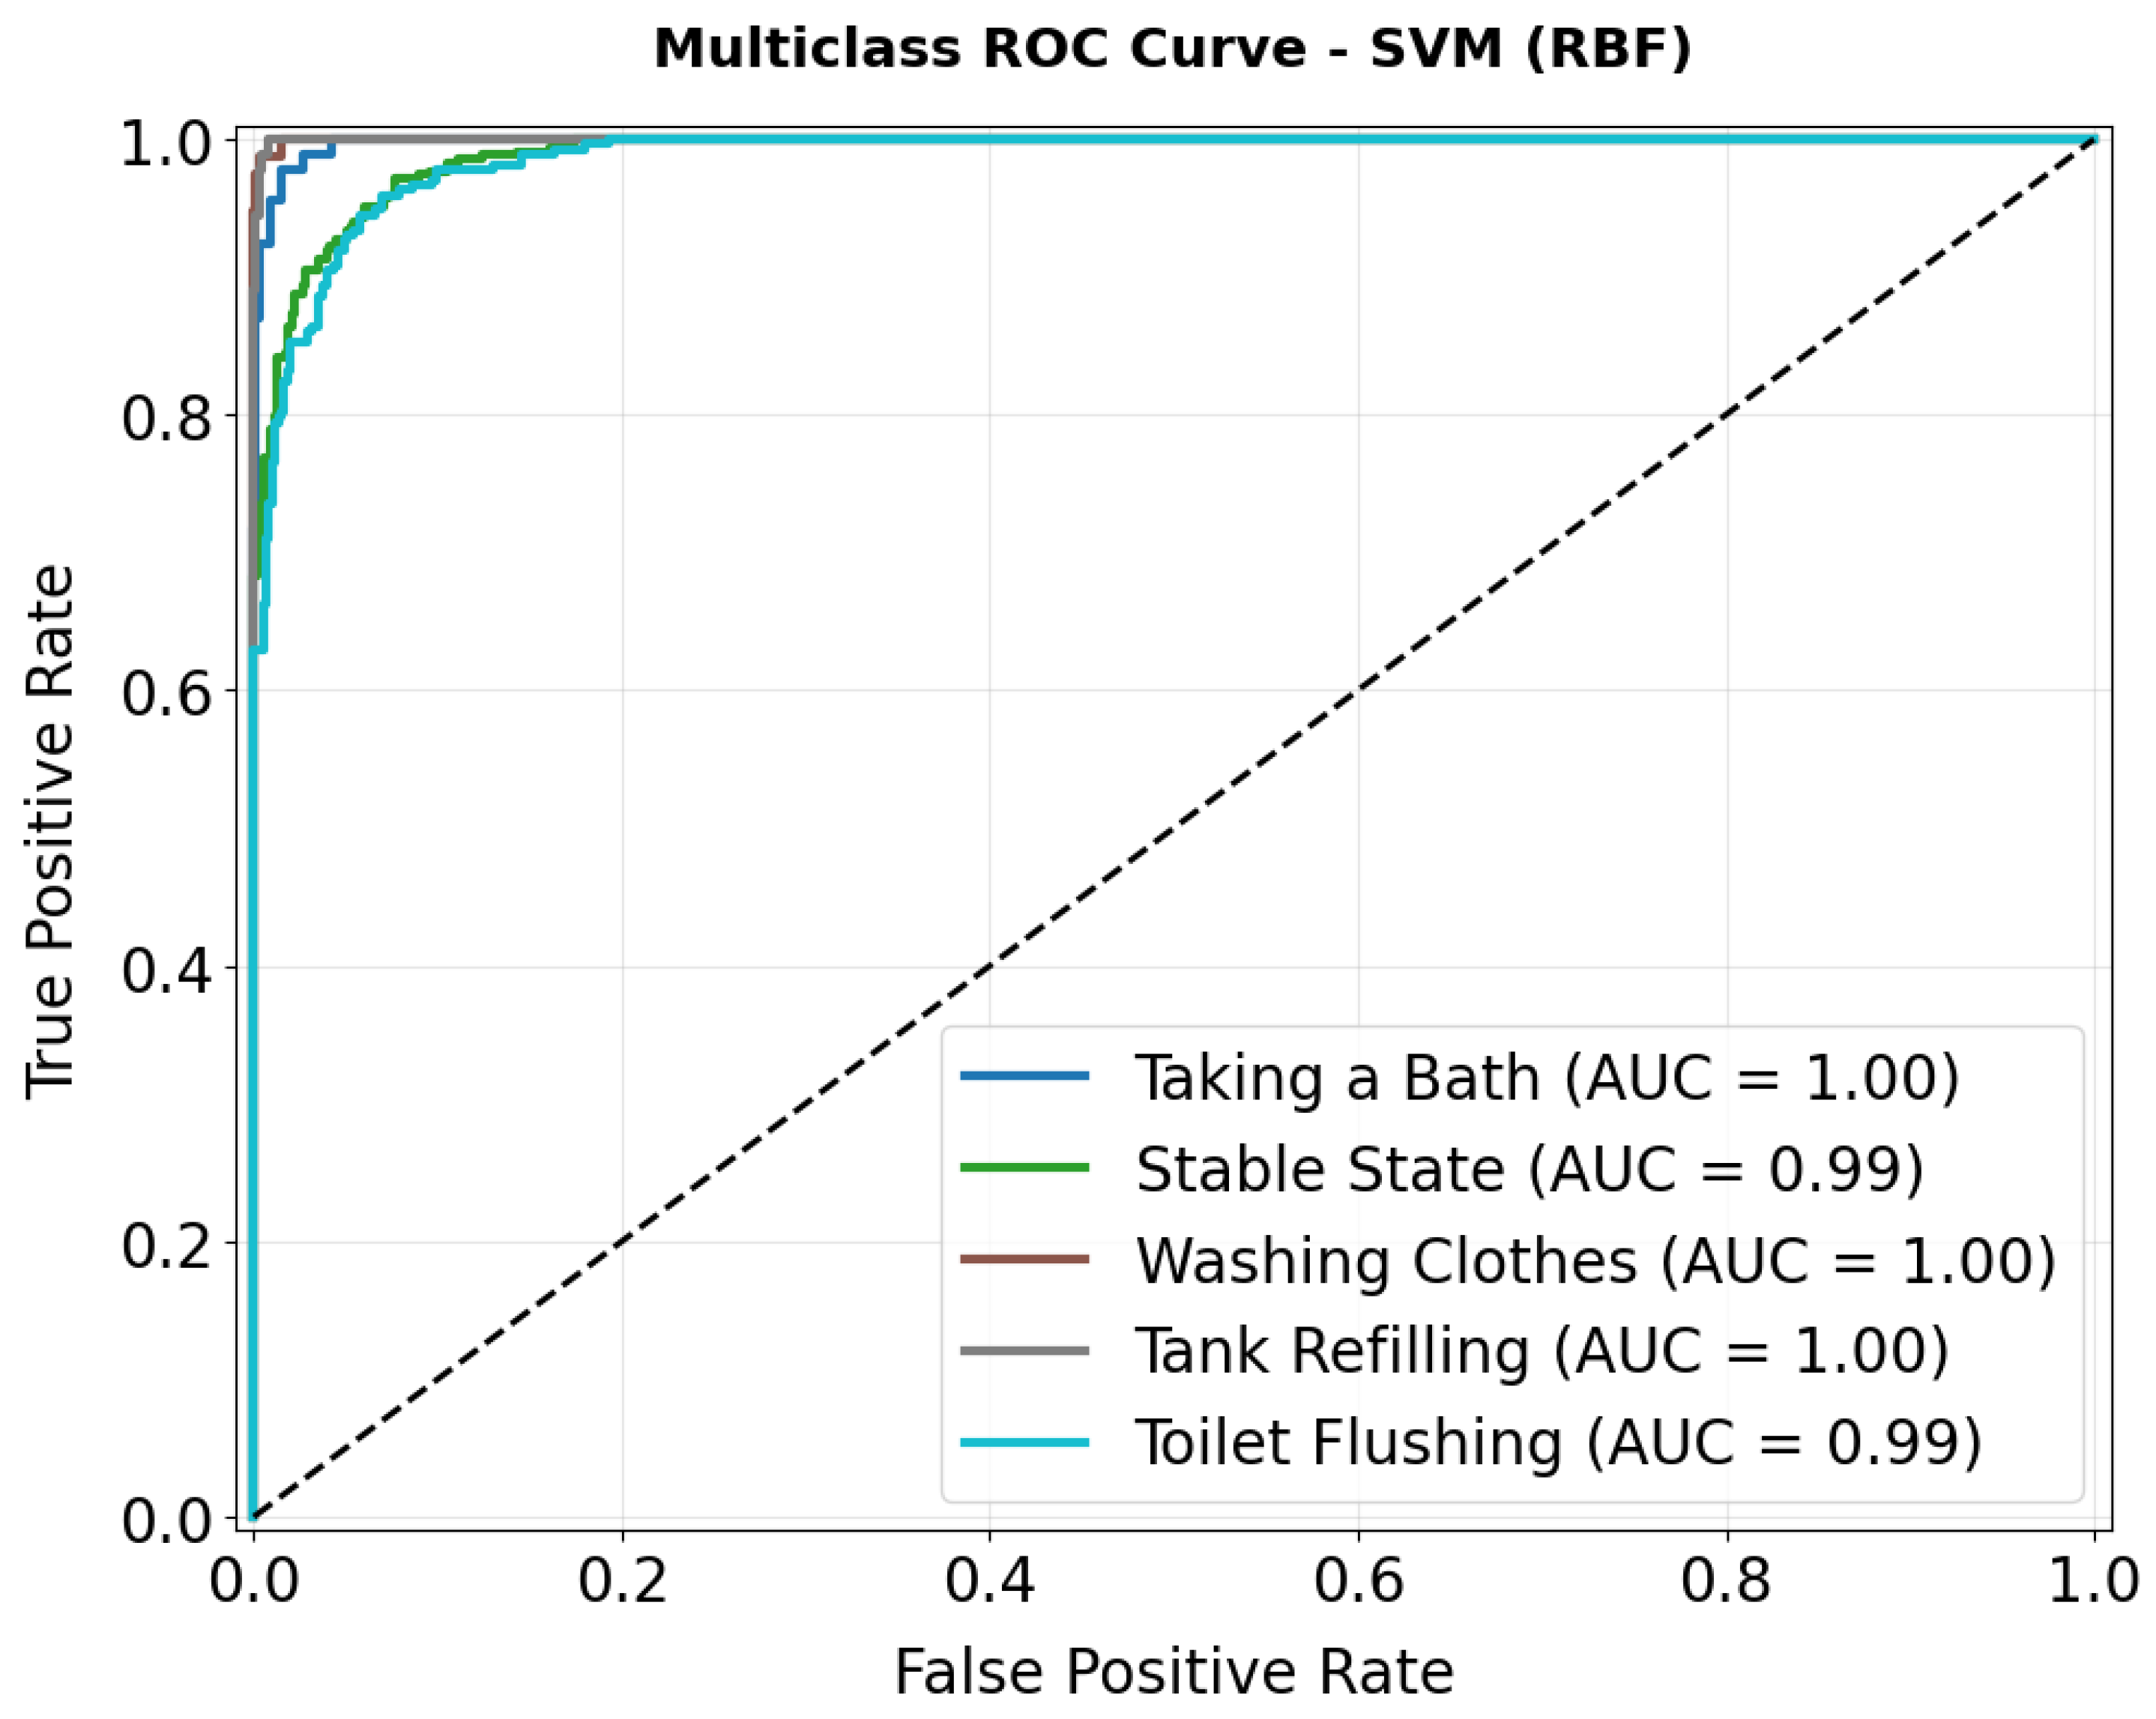
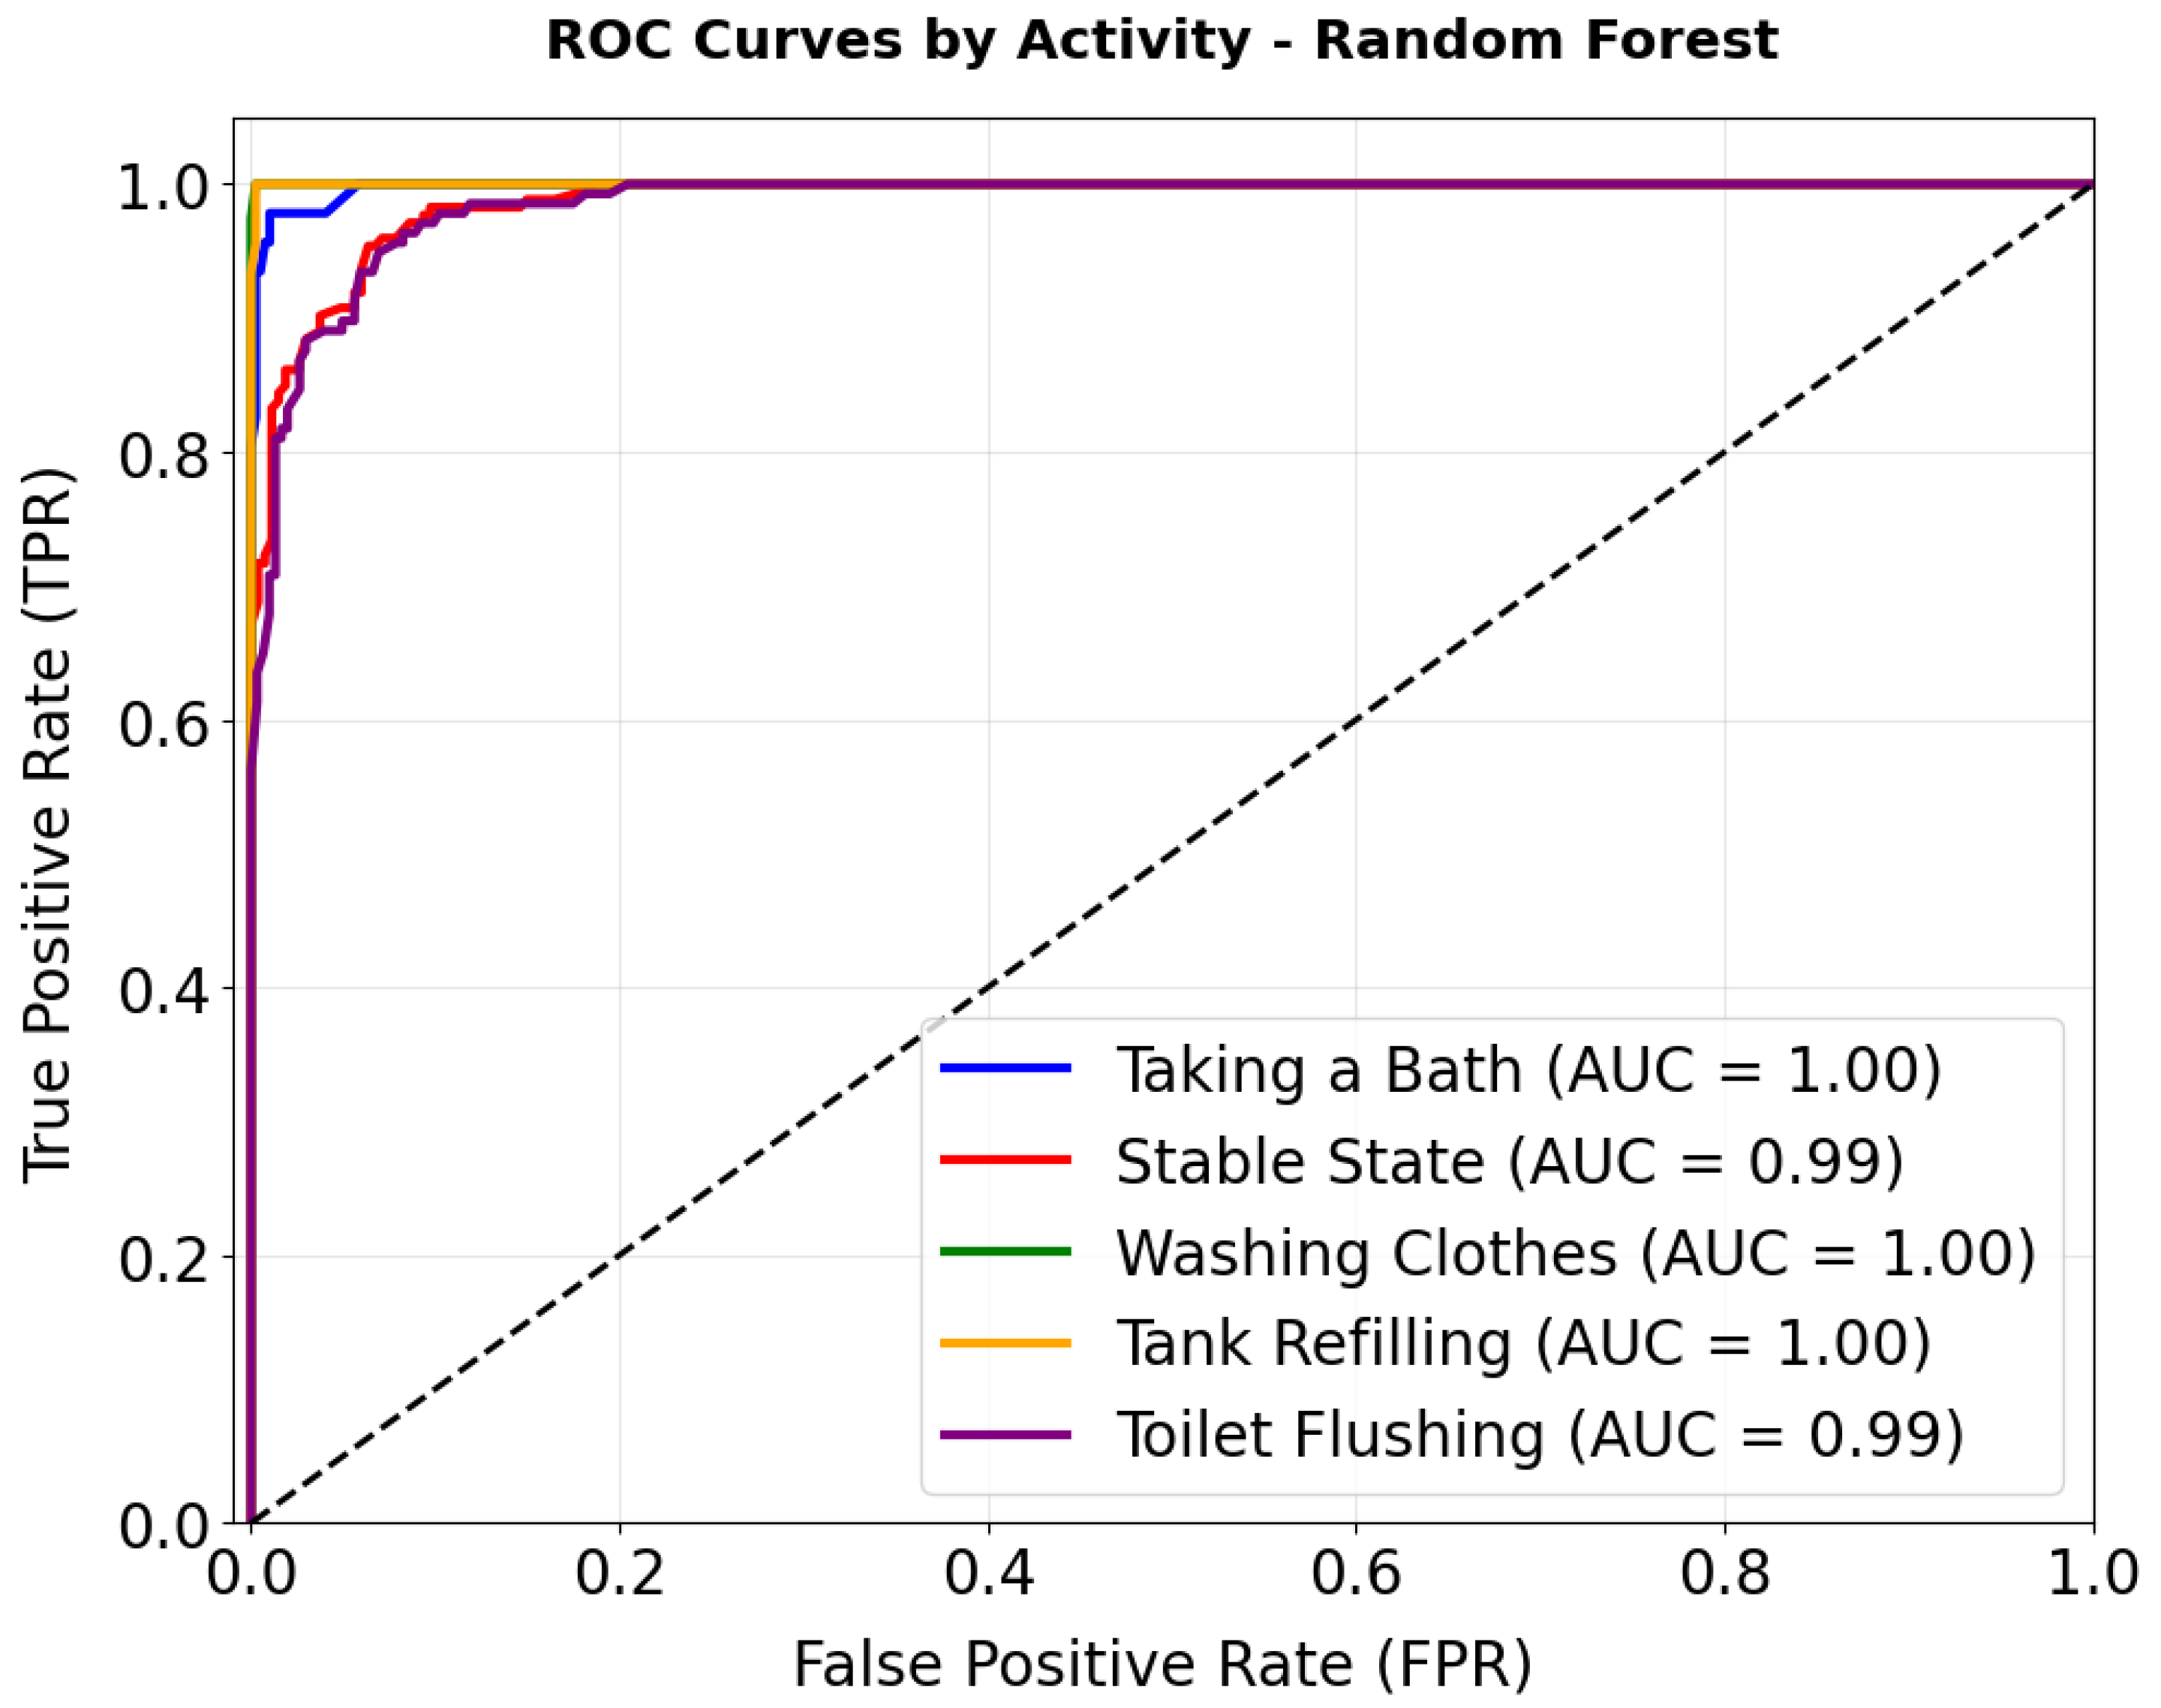
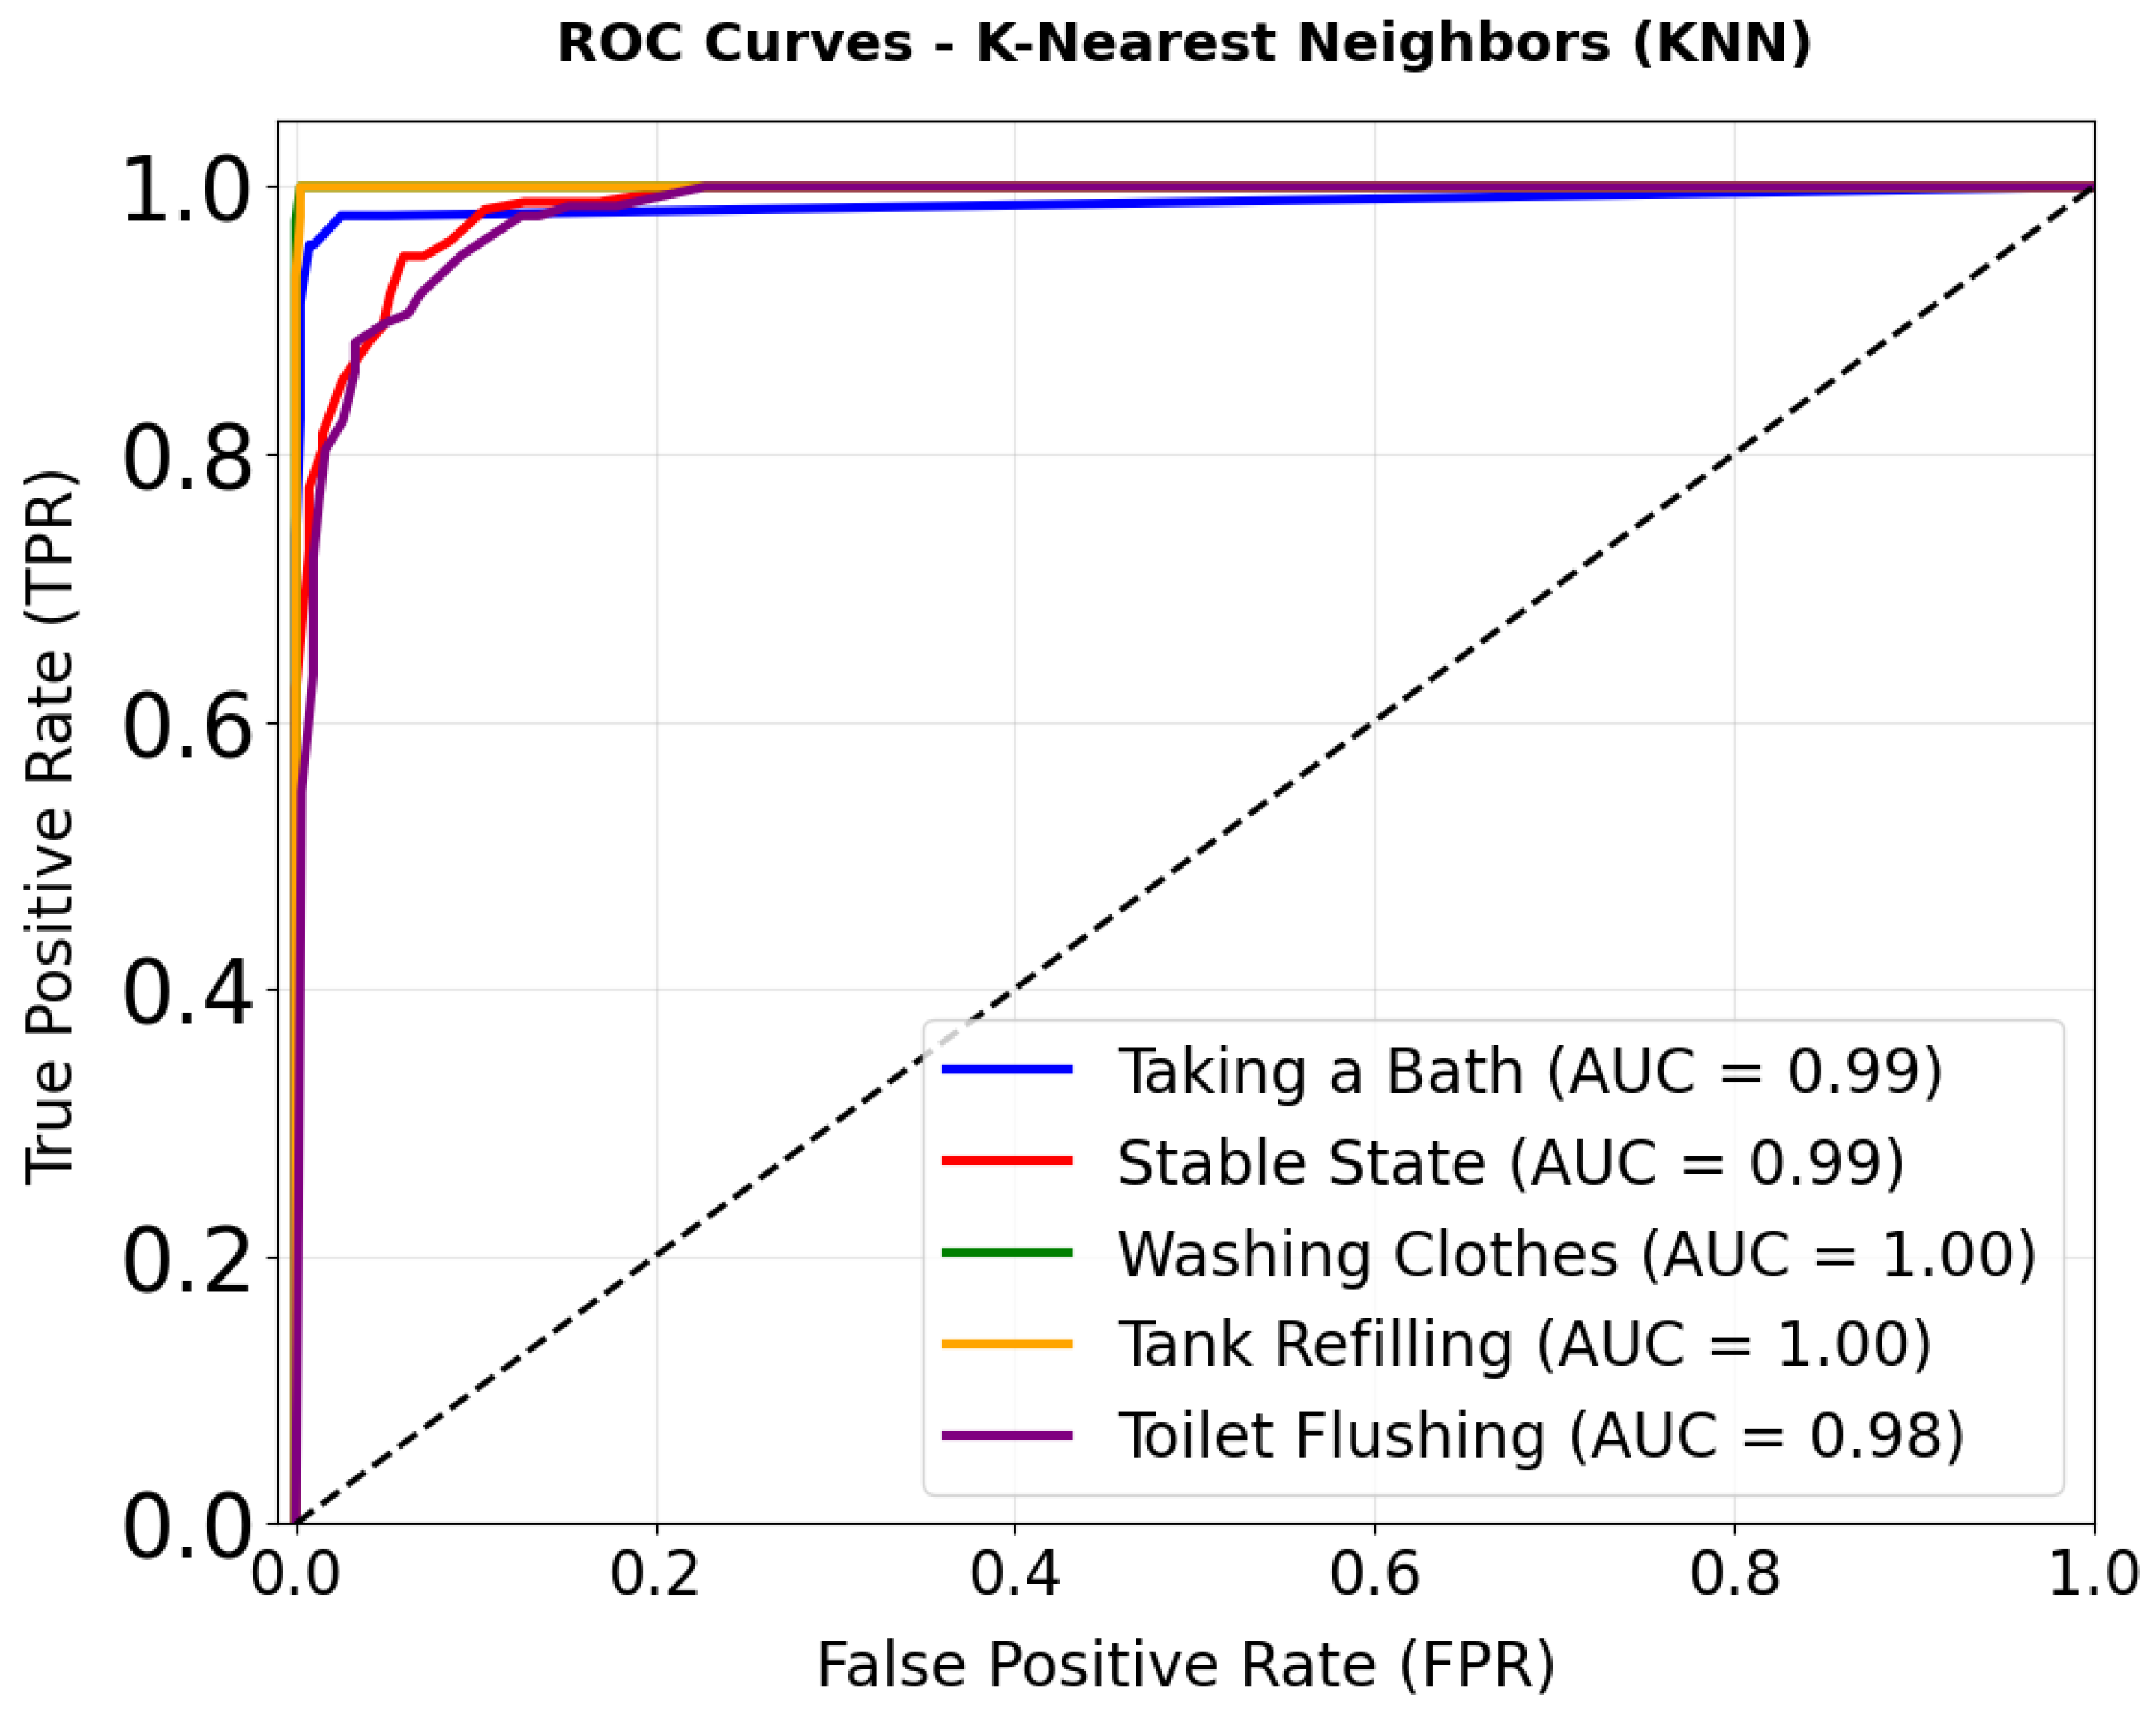
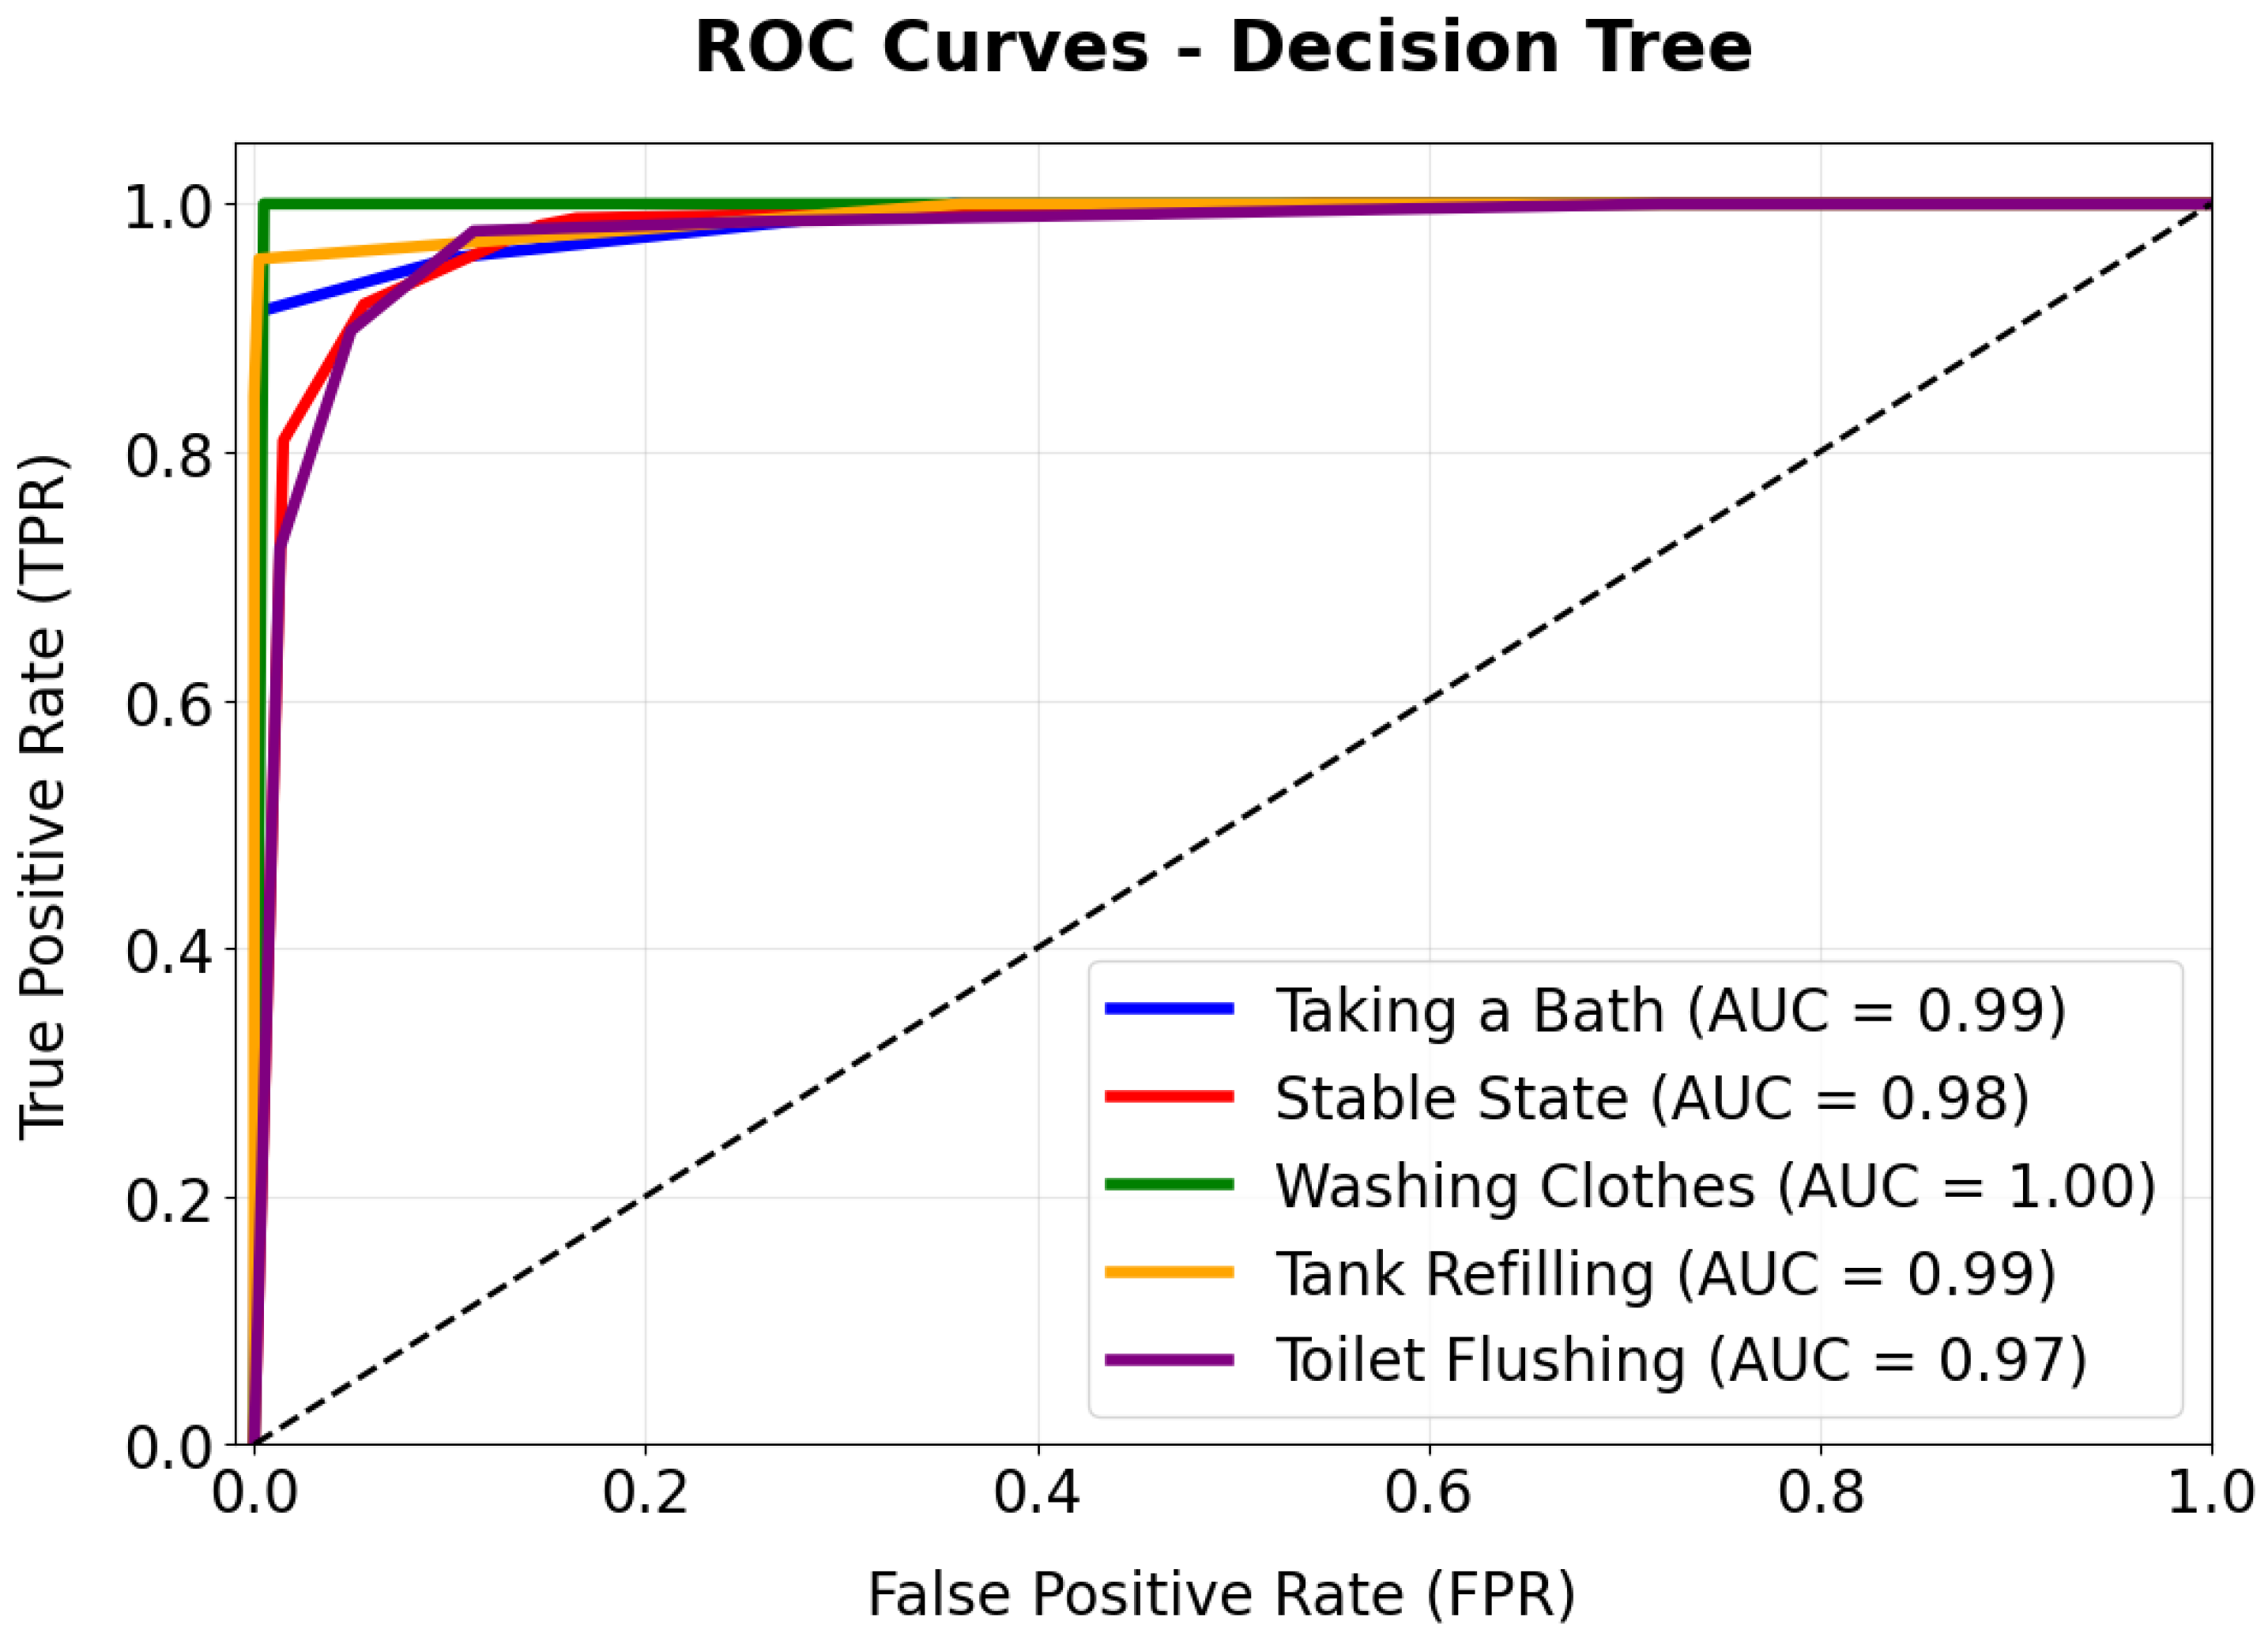
A key observation is the consistently high performance across all evaluated models, with accuracies exceeding 0.92 and weighted F1-scores reaching up to 0.93. The similar performance achieved by fundamentally different algorithms including distance-based methods, ensemble models, and recurrent neural networks indicates that the discriminative power primarily resides in the sensed variables and their physical meaning, rather than in model complexity alone. This finding suggests that, for storage-based systems, macroscopic level transitions encode sufficient information to distinguish domestic water-use events.
Several studies have addressed residential water end-use classification using supervised learning techniques; however, most rely on flow-based measurements or assume continuous water supply conditions, which limits their applicability in storage-dependent households. For example, comparative analyses using Random Forest, Support Vector Machines, and recurrent neural networks reported in [
12,
18] achieve competitive classification performance, but their experimental setups depend on high-frequency flow data or hybrid sensing strategies that do not explicitly model intermediate storage effects.
To contextualize the contribution of this work,
Table 5 presents a qualitative comparison between representative approaches reported in the literature and the proposed framework, which were selected based on three criteria: their focus on IoT-based water monitoring domains (consumption, quality, leakage, and forecasting), the diversity of sensing technologies employed (e.g., flow meters, ultrasonic, and smart meters), and their recent publication to reflect the current state of the art. This comparison emphasizes sensing strategy, operational assumptions, and deployment context rather than performance metrics alone. The metrics reported in related works do not always permit strict one-to-one comparisons due to the varying nature of the tasks,
is used for regression-based forecasting, while Accuracy (Acc) and F1-score are used for classification. Furthermore, binary classification tasks, such as leakage detection or potability assessment, tend to yield higher performance values compared to the five-class classification problem addressed in this study. Nevertheless, they provide a meaningful reference framework for situating the proposed methodology within the broader landscape of intelligent water monitoring systems.
In contrast, the proposed framework operates exclusively on tank-level dynamics, where consumption signatures are indirectly reflected through storage depletion rather than instantaneous flow. This distinction is non-trivial: in households with storage tanks and intermittent supply, flow measurements at the household connection often correspond to refilling events rather than actual end-use consumption, limiting the applicability of conventional flow-based classifiers. By explicitly modeling tank refilling, stable states, and consumption-driven level changes, this work addresses a gap that is largely overlooked in existing studies.
Compared with hybrid approaches that incorporate additional sensing modalities such as electricity consumption or pressure transients to improve classification accuracy [
18], the proposed method demonstrates that comparable performance can be achieved using a reduced and physically interpretable feature set. This finding suggests that, in storage-dependent systems, the dominant source of discriminative information lies in the macroscopic level transitions rather than in fine-grained temporal signatures. Feature importance analysis indicates that the total consumed volume, derived from the overall pressure variation, and the final stabilized pressure level are among the most discriminative variables for classification. These features provide stronger separability between consumption events compared to fine-grained temporal variations, particularly for activities with similar usage patterns such as bathing and washing clothes.
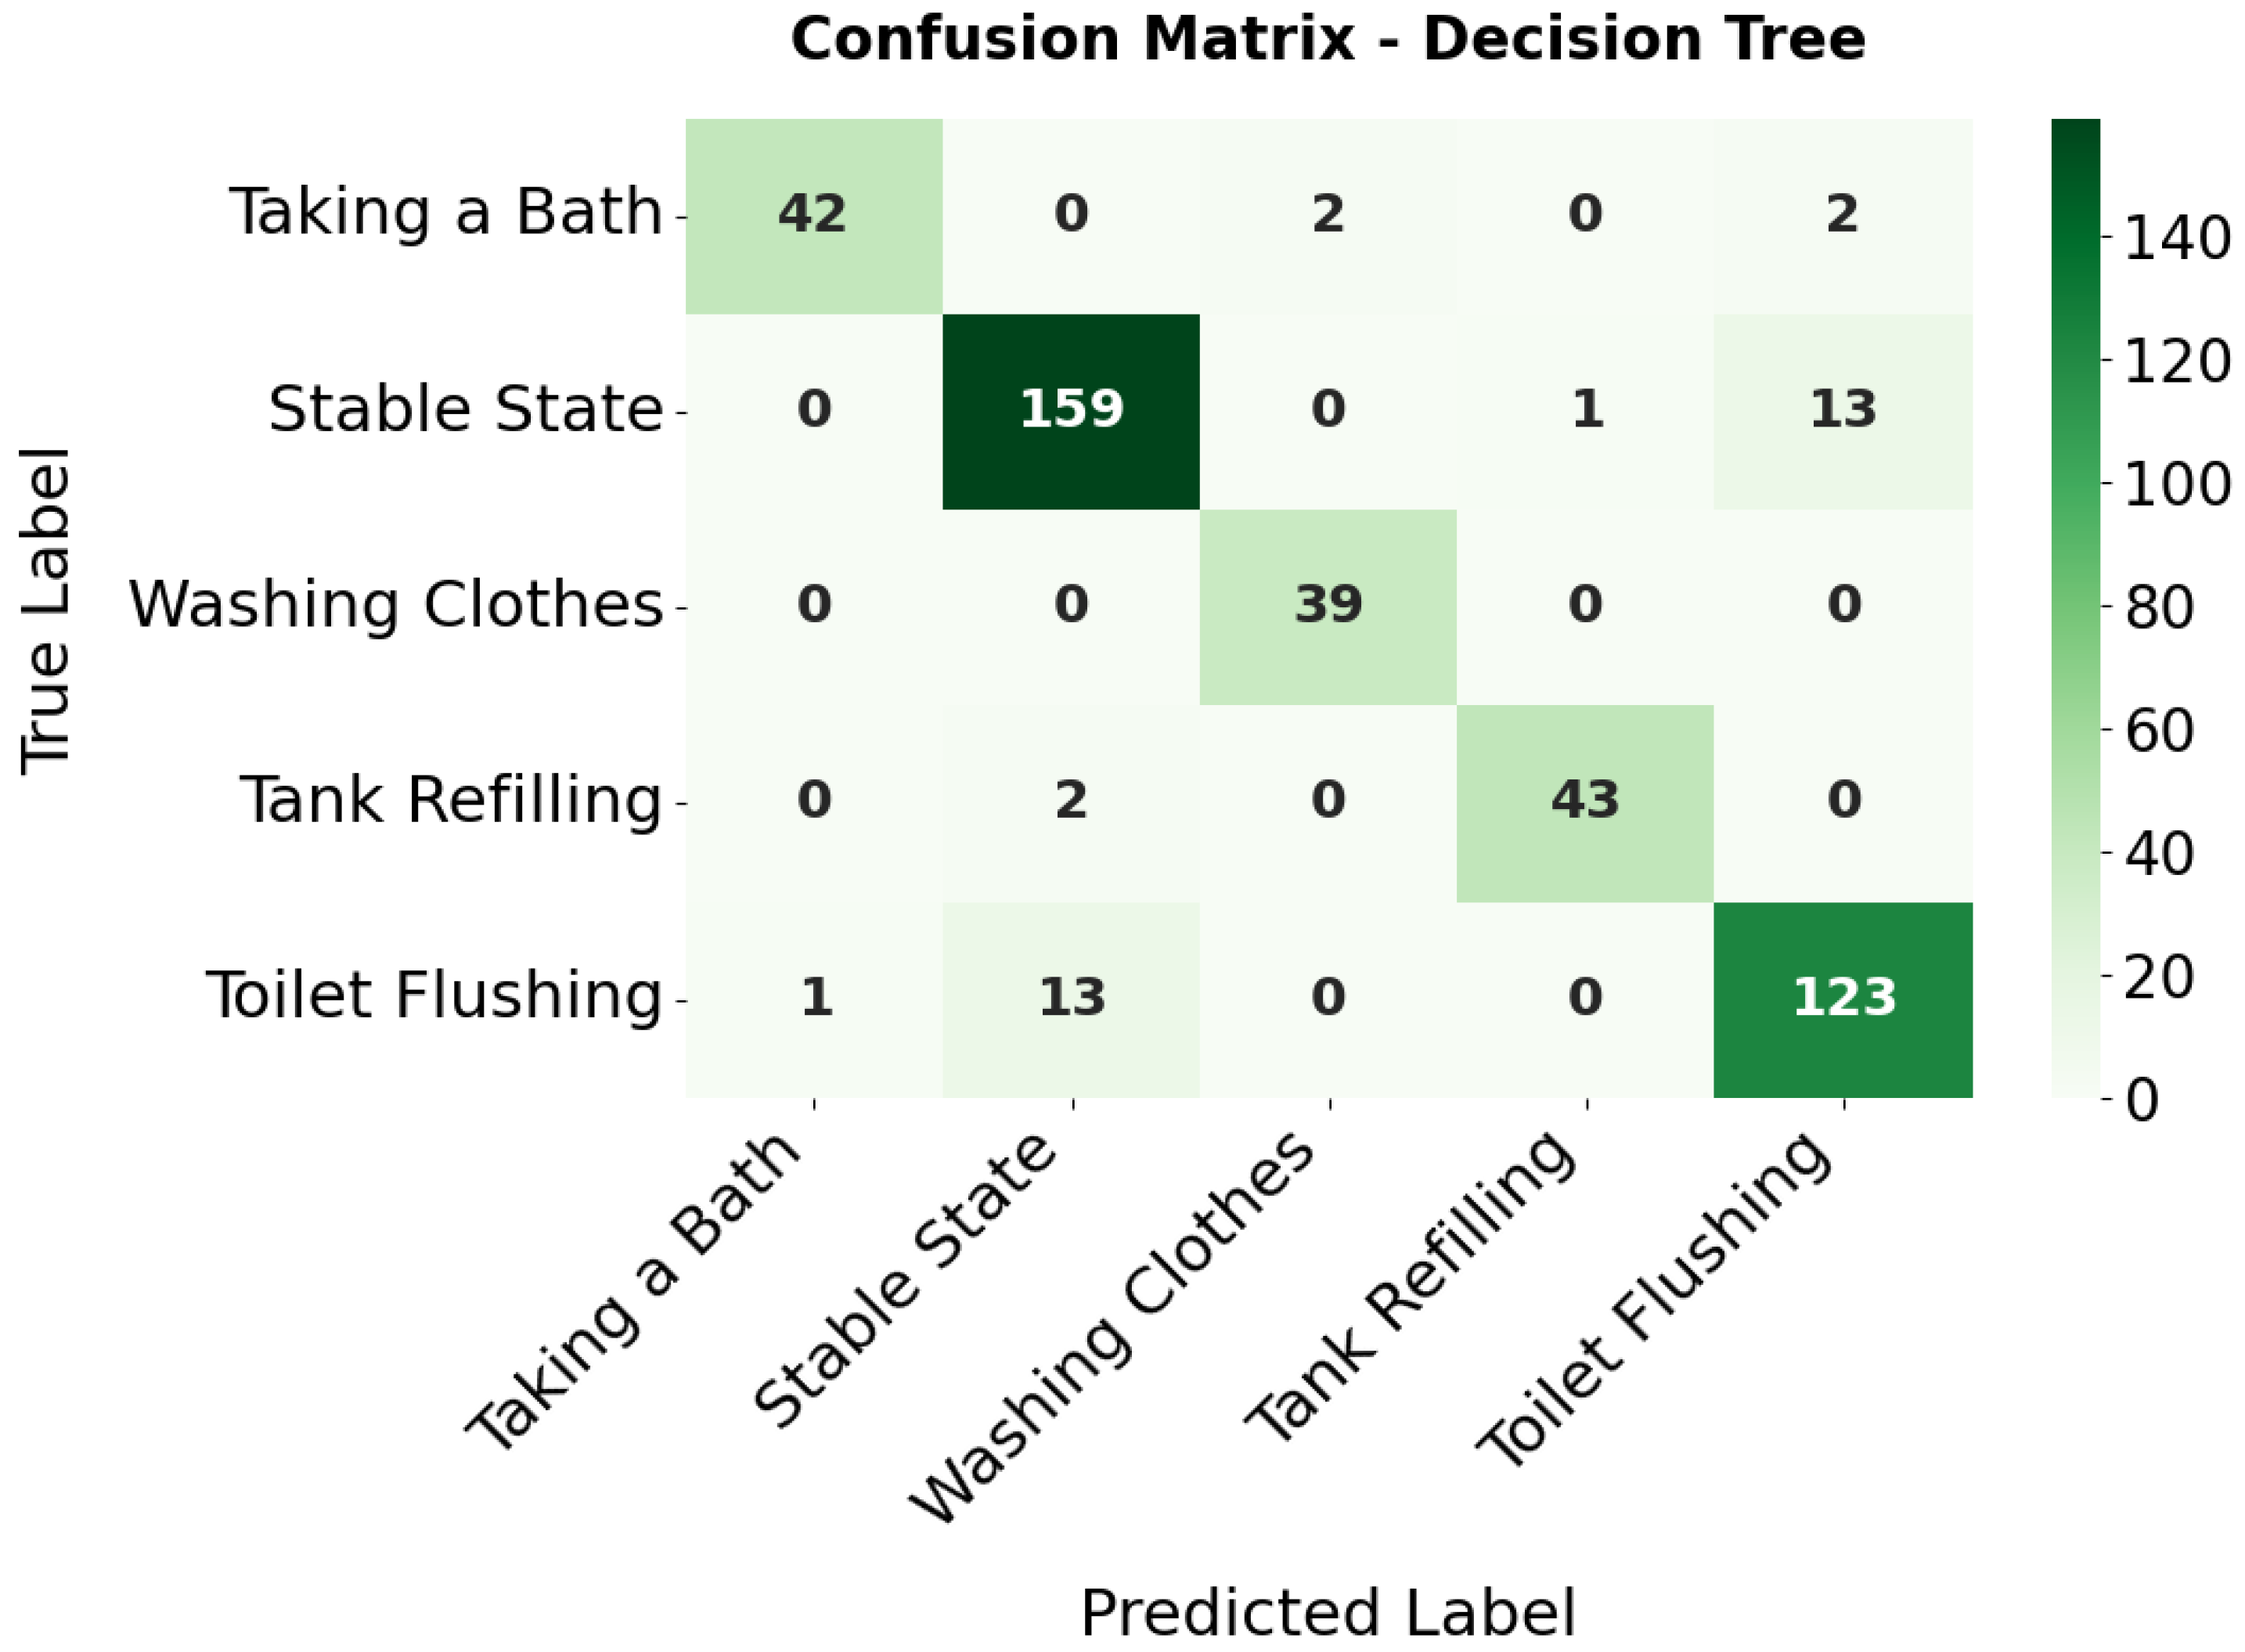
Regarding the misclassifications observed between classes, analysis of the feature overlap indicates that the underlying cause is primarily related to hardware resolution limitations rather than insufficient algorithmic feature engineering. Currently, measurements from certain classes exhibit similar patterns because the INA219 sensor’s default configuration does not provide sufficient resolution to clearly distinguish minute signal variations from a minor flush from those of a stable baseline.
To mitigate this issue in future deployments, the hardware configuration can be optimized by adjusting the physical shunt resistor and fine-tuning the internal Programmable Gain Amplifier (PGA) and Shunt Analog-to-Digital Converter (SADC) settings. These modifications are expected to significantly improve measurement resolution, enabling the detection of volume changes as small as 0.125 L and thereby reducing class confusion without increasing the computational complexity of the machine learning models.
Furthermore, while deep learning models have been shown to outperform classical methods in demand forecasting and event detection under controlled conditions [
19,
20,
21], the results of this study indicate that model complexity does not necessarily translate into superior performance for level-based consumption classification. The similar performance observed across SVM, RF, KNN, DT, and RNN/LSTM models reinforces the notion that sensing strategy and data representation play a more critical role than algorithmic sophistication in this context.
From a deployment perspective, an important consideration is the trade-off between model performance and computational efficiency. Lightweight models such as SVM and DT are well-suited for edge inference, as they can be deployed on resource-constrained microcontrollers with low memory and processing requirements. This enables reduced power consumption, lower communication overhead, and decreased dependence on continuous cloud connectivity. In contrast, although the LSTM model achieves comparable classification performance, it introduces higher computational complexity and memory requirements, making it better suited to cloud-based inference. This distinction highlights the practical advantages of classical machine learning models for scalable IoT implementations in domestic water monitoring systems.
From a practical deployment perspective, hydrostatic pressure sensors offer a more robust solution than non-contact ultrasonic alternatives. While ultrasonic devices require precise mounting, echo filtering, and periodic calibration to mitigate measurement errors, hydrostatic sensors measure column pressure directly and feature built-in temperature compensation [
9]. This hardware-level reliability directly supports the consistency of the classification results and highlights the importance of co-designing sensing and learning components rather than treating data acquisition as a secondary concern.
Overall, while previous works demonstrate the feasibility of end-use classification under idealized or infrastructure-rich scenarios, this study extends the state of the art by showing that reliable classification is achievable in storage-based households using non-intrusive, low-complexity sensing and learning strategies, thereby improving the practical relevance of IoT-based water monitoring systems for regions with intermittent supply.
Furthermore, it is crucial to consider the nature of the classification task. Studies such as Gichuhi et al. [
11] and Musleh et al. [
23] reported near-perfect accuracies (>99%) using RF; however, these works focused on binary problems (leakage vs. normal) or distinct quality classes. Our study addresses a multi-class problem (identifying 5 specific event types), which inherently entails greater complexity. Despite this, our results align closely with Chinnappan et al. [
24], who achieved
accuracy using DT for water quality, and Hameed et al. [
41], who reached
with KNN. The consistency of our results across different models (SVM, KNN, DT, all >0.92) validates the findings of Gourmelon et al. [
25], confirming that supervised methods are highly effective for event recognition when trained on well-labeled datasets, even when using low-cost hardware similar to the ESP8266 architectures explored by Wister et al. [
10].
7. Conclusions
This study presented an integrated IoT-based framework for the automated classification of residential water consumption activities in households with intermittent water supply and storage tanks. Beyond the development of a classification model, the work demonstrates the feasibility of combining robust level-based sensing, cloud-based data management, and supervised machine learning to extract meaningful information from domestic water storage systems, an aspect that remains underexplored in the literature.
7.1. Hardware and Sensing Reliability
From a sensing perspective, the experimental results confirm that hydrostatic pressure-based measurement provides stable and reliable water-level information under high-humidity and real operating conditions, outperforming non-contact optical alternatives in long-term deployments. The mitigation strategies evaluated for the laser sensor further highlight the importance of considering environmental constraints when designing IoT monitoring systems for enclosed domestic infrastructure.
7.2. Feature Extraction and Model Performance
At the data and modeling level, the results show that simple features derived from initial and final water levels, as well as estimated consumed volume, are sufficient to reliably discriminate between multiple household water-use events, even in the absence of intrusive flow meters. All evaluated machine learning models achieved high and balanced performance, with accuracies exceeding 0.92 and weighted F1-scores up to 0.93. The Support Vector Machine with RBF kernel demonstrated a slightly higher performance in this evaluation setting, while tree-based and instance-based methods demonstrated comparable robustness, indicating that the discriminative power lies primarily in the quality of the sensed data rather than in algorithmic complexity alone.
7.3. Methodological Validity and Practical Implications
Importantly, the consistency of the results across fundamentally different modeling paradigms, including distance-based, ensemble, and recurrent neural architectures, suggests that domestic water-use activities imprint distinctive and repeatable signatures on tank-level dynamics. This finding reinforces the validity of level-based monitoring as a practical alternative for end-use classification in storage-dependent households, where traditional flow-based approaches are often impractical or misleading.
From an application standpoint, the proposed framework enables non-intrusive identification of consumption patterns, differentiation between availability and actual use, and the detection of abnormal behaviors under intermittent supply conditions. These capabilities provide a foundation for demand management strategies, early leak detection, and user feedback mechanisms that aim to improve water-use efficiency at the household level.
Consequently, this work should be viewed primarily as a feasibility case study in a storage-tank household setting rather than as a broadly generalizable benchmark. A major limitation of this study is the reliance on a single-household deployment, which may constrain external validity, as variations in consumption habits, plumbing configurations, and tank dimensions across different residences could influence model generalization. Nevertheless, within the geographical context of this study, most residential dwellings share relatively standardized plumbing and water storage configurations. Consequently, this structural uniformity partially mitigates environmental variability, supporting the relevance of the findings for typical households in the region.
Future work will focus on extending the framework to multi-household deployments, incorporating adaptive and semi-supervised learning strategies to reduce labeling requirements, and integrating contextual variables such as occupancy patterns and temporal usage profiles. Additionally, exploring real-time classification and feedback mechanisms will further enhance the system’s potential as a decision-support tool for sustainable residential water management.




 ,
,