Article

Theory of Subsystems Driving Technological Coevolution in Modular Architecture of Complex Innovations


CNR—National Research Council of Italy, CNR-IRCRES, Turin Research Area, Strada Delle Cacce, 73-10135 Turin, Italy
Technologies 2026, 14(3), 156; https://doi.org/10.3390/technologies14030156
Submission received: 24 December 2025 / Revised: 12 February 2026 / Accepted: 16 February 2026 / Published: 3 March 2026
(This article belongs to the Section Information and Communication Technologies)

Abstract

This paper investigates the fundamental mechanisms of technological change in complex systems by analyzing how the evolution of embedded subsystems dictates the trajectory and sets the tempo of a host technology. Building on the theoretical framework of technological parasitism, the study conceptualizes host systems having a modular architecture—such as smartphones—as evolving through dynamic, coevolutionary interactions with their constituent subsystems. These relations gradually shift from parasitic reliance to mutualistic and ultimately symbiotic interactions. Central to this research is the concept of subsystems as pacemakers. Methodologically, this research employs a longitudinal, mixed-methods approach, combining an 18-year case study of the iPhone (2007–2025) with time-series regression and log–log hedonic pricing models. Key findings are: (a) Temporal precedence: Advances in subsystems (e.g., Bluetooth protocols) consistently precede host releases. The integration lag has contracted from three years to one, signaling an acceleration in symbiotic coupling and highlighting Bluetooth as a systemic pacemaker whose evolutionary tempo anticipates shifts in the wider smartphone architecture. (b) Differential evolutionary pressure in technological host systems: While camera resolution exhibited the highest exponential growth (+16.73%), it remained a secondary driver of systemic evolution. (c) Economic pacemakers: Hedonic analysis identifies battery life as the dominant evolutionary predictor (standardized beta = 0.77). With an elasticity of approximately 0.30, a 1% gain in battery performance correlates to a 0.3% increase in nominal price, whereas display and camera resolution exert significantly less influence on the system’s valuation and trajectory. These findings reveal that subsystems evolve—and exert influence—at different speeds and with different degrees of systemic leverage. Overall, the proposed theory shows that subsystem evolution functions as a leading indicator of forthcoming host–system transitions. By identifying which subsystems act as temporal pacemakers, this research contributes new design rules for forecasting technological generations and optimizing R&D strategies in complex, multi-component innovations. Hence, the study demonstrates that mastering complex innovation requires a granular understanding of the asynchronous rhythms between a host technology and its constitutive parts.

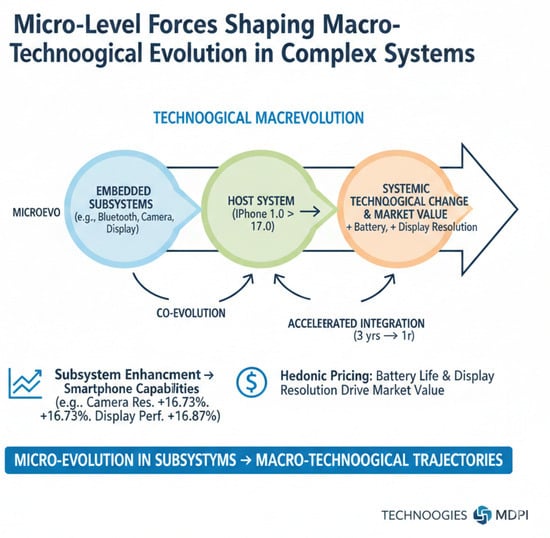
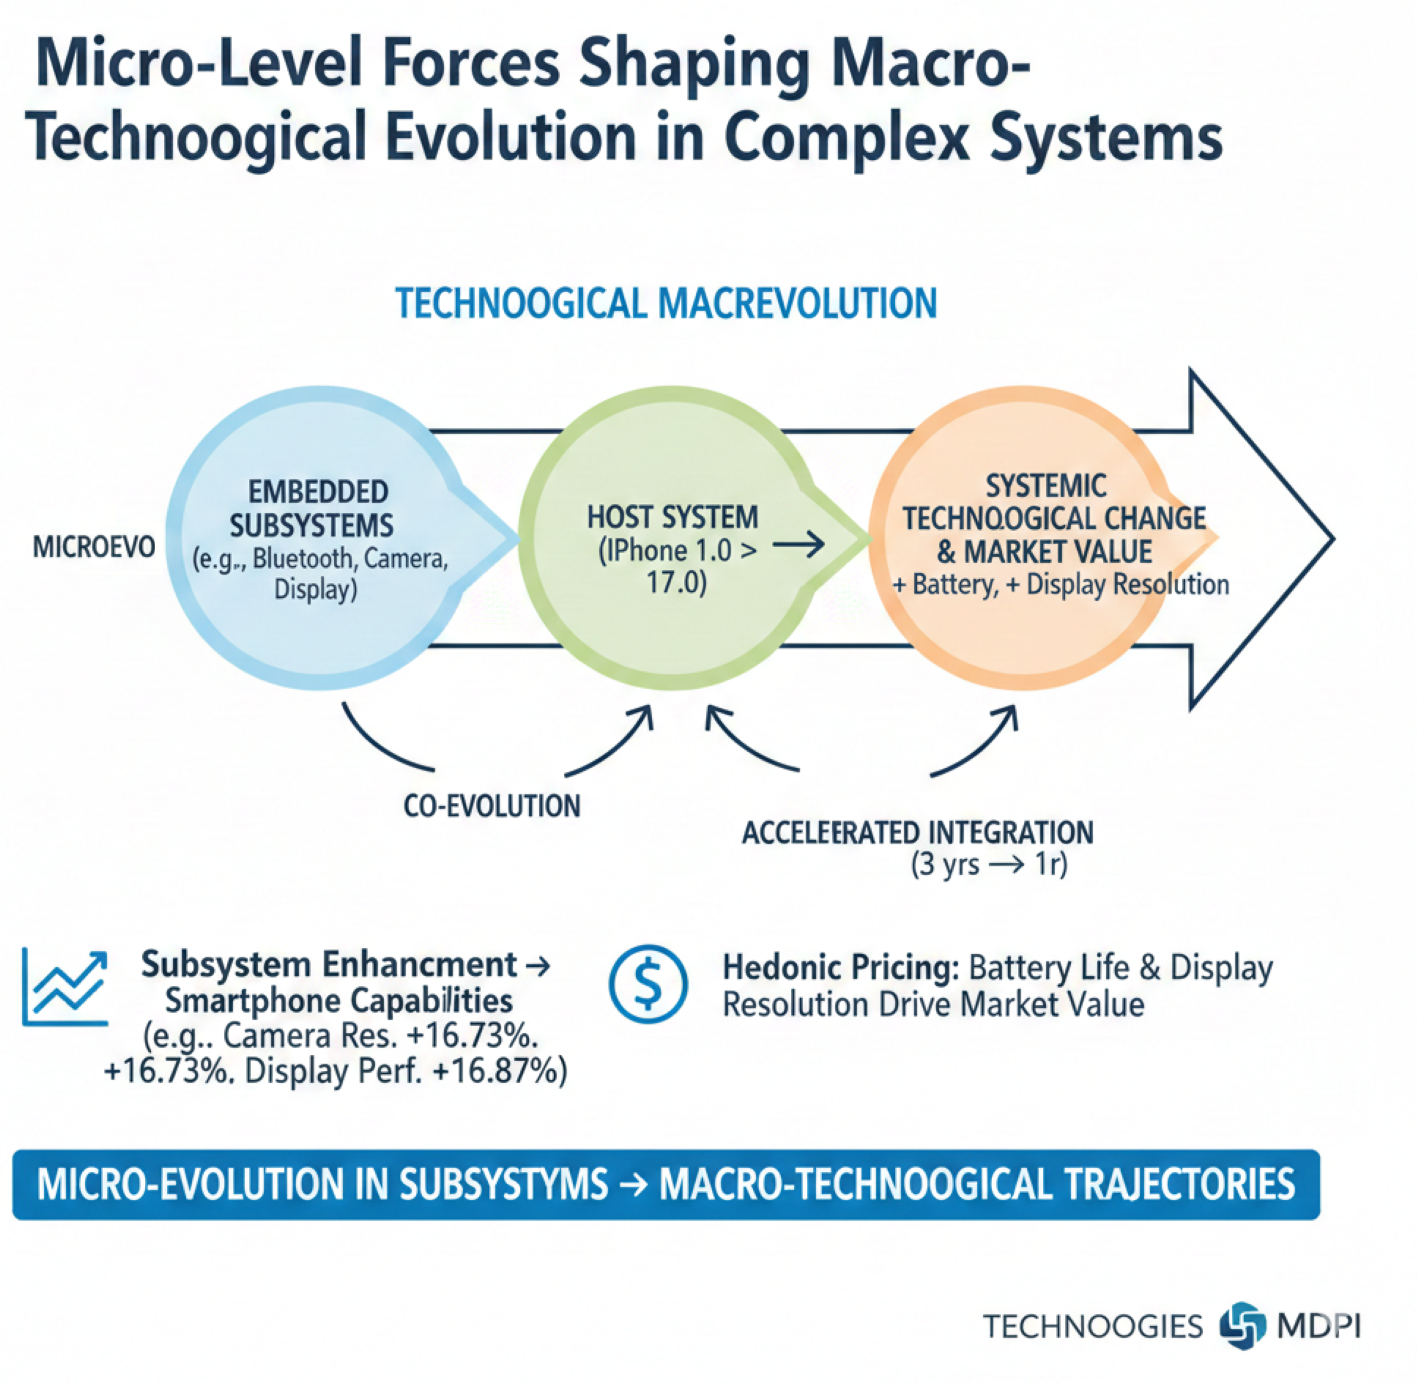
Graphical Abstract

1. Introduction and Scientific Goals

Understanding the mechanisms behind technological evolution is a central challenge in technology analysis, particularly in markets characterized by rapid change and increasing complexity. Studies show that technologies do not evolve in isolation; rather, they interact within systems composed of interrelated components, each contributing to the overall functionality and performance of the host technology [1,2,3]. This study addresses two fundamental research questions:
  • How do evolutionary changes in embedded technological subsystems influence the overall evolutionary trajectory of their host technologies?
By clarifying the influence of subsystem evolution on host trajectories, this study can explain why and when architectures reconfigure, generations emerge, and performance frontiers shift.
2.
What temporal patterns and statistical relationships exist between subsystem advancements and the innovation dynamics, performance improvements, and pricing trends of host technologies?
By identifying temporal patterns and statistical relationships, this study enables technological forecasting, quantification of subsystem value contributions, and evidence-based pricing, strengthening competitive strategy under rapid technological change.
These questions are critical for clarifying the mechanisms through which technological evolution supports the strategic management for the competitive advantage of firms [4,5]. Arthur ([6], p. 15ff) identifies the explanation of technological evolution as one of the most important problems in the field. Technological development is shaped by both “technical choices,” which reflect economic, social, and political factors, and “technical requirements,” which are imposed by material properties ([7], p. 3 and [8]). Arthur ([6], pp. 18–19) states that technologies emerge as fresh combinations of existing components, organized into systems with hierarchical and recursive structures. Sahal [9] emphasizes that technological evolution pertains to the structure and function of the object system, governed by internal dynamics and equilibrium processes (pp. 64–69). Technological evolution is driven by both major and minor innovations, problem-driven, that interact within complex technological systems [10,11,12,13]. Various theories in economics and management attempt to explain technological evolution, including models of competitive substitution, where new technologies replace older ones [9,14,15,16]. First of all, technologies are complex hierarchical systems [2,17,18], evolving through recombination and integration of symbiotic components [6,9]. Recent work supports multimode interactions that co-specialize technologies within ecosystems [2,3,19]. Borrowing from ecology, technological interactions can range from parasitism to mutualism, with parasite modules maturing into complements as standards stabilize—e.g., Bluetooth within smartphones [15,20]. Analogies with biology clarify that the evolution of complex systems emerges from microevolution under material and market constraints [8,21]. Empirically, subsystem advances in displays and batteries reconfigure capabilities and market value of host technologies [22,23,24]. Hence, subsystem dynamics—performance gains, compatibility, and coupling—predict host trajectories, performance, and pricing, motivating component-level forecasting and modular design strategies for roadmap planning.
Despite the extensive literature on technological evolution and innovation dynamics, a critical gap persists in understanding the role of embedded technological subsystems in shaping the evolution of host technologies. Existing theories primarily focus on system-level innovation, competitive substitution, and external drivers of technological change, overlooking the internal coevolutionary mechanisms between subsystems and their host technologies. To put it differently, technological evolution is widely described at the level of whole systems or market substitution, yet we lack theory and evidence on how micro-level changes in embedded subsystems propagate to macro-level shifts in host technologies. The internal, coevolutionary mechanisms—timing, magnitude, and pathways—by which subsystems shape host trajectories remain insufficiently specified and measured. In short, while scholars acknowledge that technologies evolve as interconnected systems [2], empirical and theoretical research rarely examines how incremental advancements in subsystems—such as connectivity modules, energy systems, or display technologies—trigger major evolutionary shifts in the overall technological architecture. Consequently, the temporal patterns and performance impacts of subsystem evolution on host technologies remain underexplored. This lack of insight limits the ability of innovation theory to explain systemic technological change and constrains firms’ strategic capacity to forecast market trajectories and optimize modular design in product families and assembly systems [25]. Addressing this gap requires a systemic framework that integrates evolutionary changes within subsystems and their cumulative influence on evolutionary transformations in the system of host technologies. The present study responds to this need by developing and validating a theory of technological evolution driven by subsystem advancements, offering new perspectives for innovation management and competitive strategy.
In particular, the present study develops a theory of evolution in technological systems driven by the evolution of their embedded subsystems. This approach extends existing theories of technological change by introducing new dimensions of interaction and coevolution. The proposed conceptual framework is grounded in Generalized Darwinism [26,27], which views technological evolution as a process of variation, selection, and retention within complex systems. In this context, the scientific inquiry endeavors to support the hypothesis that microevolution in subsystems drives macroevolution in host technologies. The proposed approach here develops a systemic theory of technological change, highlighting coevolution patterns, performance impacts, and strategic implications for innovation management and competitive advantage.
For the purposes of this article:
Microevolution refers to incremental, continuous changes and improvements related to technological subsystems of a higher-scale system (e.g., Bluetooth versions, battery modules, etc.). These changes occur at a smaller scale and enhance specific components’ functionality. It indicates a new generation of technological subsystems.
Macroevolution, instead, denotes major evolutionary shifts in the host technology as a whole (e.g., smartphone generations), driven by cumulative subsystem advancements, resulting in significant changes in performance, design, and market trajectory. It indicates a new product generation of a technological system, including previous new technological subsystems.
Host technology is the central system that integrates interdependent subsystems into a functioning architecture. Its macroevolution—generational shifts in capabilities, design, and market position—emerges from cumulative subsystem advances.
Technological subsystems (parasites) are embedded modules—e.g., connectivity, energy storage, displays, sensors—that perform specialized functions and interact via standards and interfaces. Their microevolution—incremental performance, efficiency, compatibility gains—supports host macroevolution, reshaping architectures, experiences, and pricing through component-level contributions.
To validate the proposed hypothesis of evolution in subsystems that drives systemic evolution in host technologies, the study employs a case study research of iPhone technology from 2007 to 2025, examining its relationship with Bluetooth and other parasitic subsystems. The iPhone serves as a host technology, integrating successive versions of Bluetooth (2.0 to 6.0), which enable macroevolutionary advances in smartphone models [22,24]. Selecting the iPhone–Bluetooth dyad provides a clean, data-rich setting to test subsystem-driven macroevolution. The iPhone is a tightly integrated, annually iterated host platform with well-documented specifications, prices, and performance. Bluetooth is an embedded, versioned connectivity subsystem (2.0–6.0) governed by an external standard, yielding exogenous and backward compatibility. Findings generalize to modular technologies where standardized subsystems coevolve with hosts, informing forecasting, modular design, and product strategy.
While prior research emphasizes competitive substitution and system-level innovation, little attention has been given to how micro-level changes in embedded subsystems trigger macro-level transformations in principal technologies. This study contributes to innovation theory by proposing a systemic model of technological evolution, where subsystems act as drivers of macro-level change. It integrates insights from evolutionary economics, systems theory, and technology management, offering a greater understanding of how technologies evolve through internal interactions and external pressures. This novel perspective on technological evolution, by focusing on the coevolutionary dynamics between subsystems and host technologies, develops a systemic theory that fills a critical gap in innovation theory. The study design analyzes how subsystem microevolution drives host macroevolution, considering: (1) a panel (iPhone, 2007–2025) linking subsystem indicators (e.g., Bluetooth version index, battery, display) to host performance and price; (2) estimate lead–lag relationships (0–24 months) and test directional influence; (3) marginal contributions quantified via hedonic regressions; and (4) detect macroevolutionary shifts with arithmetic and exponential rates of growth. This study offers fresh insights into internal drivers of technological change, enabling firms to strategically leverage subsystem advancements for forecasting, modular design, and long-term competitive advantage. For managers and innovation strategists, the findings can offer actionable insights. Firms can enhance product evolution by investing in high-impact subsystems, such as battery life or display resolution in smartphone technology. Monitoring subsystem trends enables better forecasting of market shifts and consumer expectations. This approach supports the coevolution of product and process families with effective modular design strategies, agile R&D planning, and long-term innovation road mapping [25].
The paper is organized as follows: The next section presents the theoretical framework, integrating evolutionary economics and systems theory to explain technological coevolution. The third section outlines materials and methods, detailing the research design and analytical approach. The fourth section introduces the case study of iPhone technology (2007–2025) and its embedded subsystems, such as Bluetooth. The fifth section reports empirical evidence on temporal patterns and statistical relationships between subsystem evolution and host technology performance. The discussion interprets findings, highlighting theoretical contributions and managerial implications for innovation strategy. Finally, the conclusion summarizes key insights and proposes future research directions.

2. Theoretical Framework

Firstly, it is important to clarify the concept of complex systems to support the theoretical framework here. Simon ([18], p. 468) states that: “a complex system is… one made up of a large number of parts that interact in a nonsimple way … complexity frequently takes the form of hierarchy, and … a hierarchic system … is composed of interrelated subsystems, each of the latter being, in turn, hierarchic in structure until we reach some lowest level of elementary subsystem.” McNerney et al. ([17], p. 9008) argue that: “The technology can be decomposed into n components, each of which interacts with a cluster of d − 1 other components”. Technology is defined here as a complex system that is composed of more than one component and a relationship that holds between each component and at least one other element in the system [2,15,16]. A technology interacts in a system with other interrelated technologies to achieve goals, satisfy needs and/or solve problems or, more broadly, to serve a human purpose or multiple purposes [2]. In this context, Sahal [9] points out that systems innovations are due to the integration of two or more symbiotic technologies. The analogy between biological and technological evolution has generated a substantial body of literature [4,6,28,29]. The recent literature challenges the traditional view that technological evolution is driven solely by competitive substitution. Utterback et al. [3] propose abandoning this zero-sum perspective, introducing the concept of symbiotic competition, where the growth of one technology stimulates the development of interrelated technologies. Technologies, therefore, evolve not only through rivalry but also through mutual reinforcement, forming complex ecosystems of innovation [12]. Pistorius and Utterback [19] further argue that multimode interactions between technologies offer a richer framework for analyzing technological change, especially in fast-moving markets. These interactions mirror biological evolution, where species co-adapt and evolve together. Sandén and Hillman [20] categorize technological interactions into six types: neutralism, commensalism, amensalism, symbiosis, competition, and parasitism. These categories, borrowed from ecology, help explain how technologies influence each other’s evolution. Coccia [15] applies this framework, showing that interactions often begin as parasitic but evolve toward mutualism and symbiosis over time. This conceptual continuity is central to evolutionary biology and can also be applied to technological evolution [15,16]. This dynamic is evident in the relationship between Bluetooth technology and smartphones. Moreover, this body of work highlights that parasite technologies (subsystems)—such as connectivity modules, sensors, etc.—can significantly influence the macroevolution of host technologies [2].
The biological analogy is supported by a rich body of literature. Alphey et al. [30] describe evolutionary drivers at the genetic level, such as mutational and reparational pressures, which influence the direction and rate of change. Mutations, while random in their phenotypic impact, are influenced by molecular structure, replication dynamics, and environmental factors. Similarly, technological subsystems evolve under constraints imposed by material properties, user demands, and systemic compatibility [7,8]. Moreover, macroevolutionary patterns—such as rates of species diversification—are influenced by ecological and demographic factors that are difficult to model [31,32]. In technology, similar challenges arise. While subsystem improvements can forecast host system evolution, external factors, such as market dynamics, regulatory environments, and user behavior, also play critical roles [22,24]. Moreover, technological evolution, like biological evolution, exhibits patterns of radiation, stasis, extinction, and novelty [21,33,34]. Subsystems may undergo rapid innovation (radiation), experience periods of incremental change (stasis), become obsolete (extinction), or introduce entirely new capabilities (novelty). These patterns are observable in the evolution of smartphone components, where certain technologies (e.g., physical keyboards) have disappeared, while others (e.g., facial recognition) have emerged as novel features and support macroevolution of these devices. The integration of subsystem evolution into host technologies is not merely additive but transformative. As subsystems improve, they redefine the capabilities and user experience of the host system. For instance, advancements in display technology—from LCD to OLED to high-refresh-rate panels—have not only improved visual quality but also enabled new applications such as gaming. Similarly, battery improvements have extended device usage, enabling more complex and power-intensive functionalities [1,22,23]. From this perspective, technological evolution is a hierarchical and coevolutionary process where micro-level subsystem dynamics drive macro-level system trajectories. This framework integrates Simon’s [18] view of complex systems—nested, interrelated subsystems—with Arthur’s [6] theory of recursive recombination, where novelty emerges from the assembly of existing parts. The hierarchy scales from microevolution (subsystem improvements) to macroevolution (long-term host system outcomes). To justify the transfer of biological analogies to technology, we apply the principle of conceptual continuity [15]. Just as genetic mutations are constrained by molecular structures [30], technological “mutations” are bound by material properties and systemic compatibility [8]. This perspective allows for a methodological bridge between ecological interactions and technological change. In addition, within this ecosystem, technologies interact through modes defined by Sandén and Hillman [20] and Coccia [15], most notably the parasitism–symbiosis approach. Parasitic technology here is an embedded subsystem (e.g., connectivity modules or sensors) that initially relies on a host system but significantly influences its overall evolutionary trajectory [2]. As these “parasites” stabilize, they often evolve into mutualistic complements. Utterback et al. [3] argue that innovation is a symbiotic competition where the growth of one technology stimulates its interrelated components. Hence, Arthur [6], Sahal [9], and Utterback et al. [3] maintain that technological change is an ecosystemic, coevolutionary process rather than a sequence of zero-sum substitutions. For Arthur [6], technologies are recursive combinations of existing components; novelty emerges when subsystems are recomposed into new architectures, generating increasing returns and path-dependent trajectories. Sahal [9] complements this by framing systems innovation as the integration of two or more symbiotic technologies, where architectural alignment and interface compatibility unlock new system capabilities and redirect trajectories. Extending beyond rivalry, Utterback et al. [3] introduce multimode interactions, in which the growth of one technology stimulates demand for, and improvement of, interrelated technologies, forming dense ecosystems of complements and co-specialized modules [19]. Together, these perspectives imply that subsystem dynamics—performance gains, compatibility, and coupling—shape the macroevolution of host systems: “parasite” modules can become mutualistic complements as standards stabilize and use-cases scale, shifting the competitive landscape from products to architectures. For theory and management, this synthesis justifies forecasting at the component-interaction level and designing strategies that cultivate cross-technology complementarities, platform interfaces, and evolutionary corridors that convert subsystem advances into system-level innovations and outcomes. This study advances a theoretical framework in which technological micro-drives—fine-grained, subsystem-level improvements in sensing, interfaces, design tools, and fabrication—act as proximate forces that reconfigure architectures and trigger systemic coevolution in complex systems. Studies also show that by lifting local performance, micro-drives reshape module boundaries [35], while domain-specific platforms (e.g., intelligent embedded systems for vehicular CPS) stabilize interfaces and propagate reusable patterns across applications [36]. Consolidation on resource-constrained stacks (e.g., Linux in embedded) diffuses shared toolchains that lower integration costs and accelerate recombination [37], and the rapid expansion of IoT further multiplies complementarities and scale economies along the edge–cloud continuum [38]. Emergent sensing trajectories widen observability and controllability, opening new search spaces for architectural redesign [39,40], while servitization logics translate subsystem advances into evolving product–service systems and value co-creation [41]. From an innovation-systems lens, micro-drives rewire actor–artifact networks and selection environments, improving foresight on path formation and tipping points [42,43,44], often functioning as enabling technologies that relieve bottlenecks and unlock downstream variety [45]. Deep-stack co-optimization links materials, devices, and architectures, synchronizing improvement rates and reliability envelopes [46], in step with semiconductor roadmaps that set the tempo and constraint surface for system evolution [47]. Industry-level conditions—capital intensity, standards, and policy—mediate diffusion and entry dynamics, shaping where micro-drives concentrate [48]. Empirically, cumulative subsystem learning and interface crystallization in digital-receiver architectures illustrate how local advances accelerate architectural recombination [49], while shifts in global innovation collaboration networks modulate diffusion pathways and lock-ins across tiers and geographies [50].
Overall, then, according to existing theories, technologies evolve as hierarchical systems formed by the recombination of components [6], with system innovation arising from symbiotic integrations [9] and multimode, symbiotic competition among interrelated technologies [3]. Prior work emphasizes competitive substitution but leaves subsystem–host coevolution underexplored. The contribution of this study is to develop a systemic evolution theory showing that evolution in embedded subsystems drives host trajectories and performance. We test this with the iPhone (2007–2025) to quantify subsystem value, delivering guidance for forecasting, modular design, agile R&D road-mapping, and strategic leverage of high-impact subsystems. Understanding these dynamics is essential for both theorists and R&D managers, as it enables better forecasting of technological trends and strategic planning for innovation dynamics in ecosystems. This perspective opens new avenues for research and managerial practice, emphasizing the importance of subsystem evolution in shaping the future of complex technological systems.

3. Materials and Methods

The theoretical foundation of this study is rooted in the concept of Generalized Darwinism, which extends Darwinian principles—variation, selection, and retention—beyond biological evolution to explain change in complex systems such as technologies, organizations, and economies [27]. Hodgson ([26], p. 260) defines Darwinism as a general theory applicable to all open, complex systems. This framework of Generalized Darwinism and evolutionary ecology provides a powerful approach for analyzing how technological systems evolve through the interaction and transformation of their embedded subsystems for a comprehensive understanding of technological change in modern markets. In particular, the study employs a multi-stage methodological framework grounded in Generalized Darwinism to examine how evolutionary subsystem changes trigger macroevolutionary host shifts. The main steps described below are: (1) Conceptual modeling based on technology that is defined as a complex system of interrelated subsystems. (2) Based on an empirical case study (iPhone 2007–2025) using a narrative approach and triangulated secondary data, the study tracks the iPhone (host) and Bluetooth (parasitic subsystem that stabilizes in the host and evolves into mutualistic complements). The statistical analysis involves growth rates and trend analysis. (3) Hedonic pricing is used to quantify the market value of these technical shifts and main subsystems supporting system evolution by standardized coefficients. This statistical toolkit is designed to bridge the gap between technical micro-change and system-impact. Arithmetic and exponential growth rates provide a precise measure of innovation velocity to categorize the nature of subsystem advancement. Pearson correlations and linear regressions validate the temporal directionality of the data, ensuring that subsystem evolution follows a statistically significant trajectory over the 2007–2025 period. The log–log hedonic pricing model serves as the critical link between engineering and economics. By regressing the host price (P) against specific technical attributes (e.g., camera resolution, ppi, battery), the study quantifies the market’s valuation of internal “mutations.” This model is superior for capturing non-linear returns on innovation. Finally, standardized coefficients enable a robust comparative analysis, isolating which subsystems (the “micro-drives”) exert the most influence over the host’s macro-level market performance, thereby empirically validating the theory of systemic coevolution.

3.1. Conceptual Structure of Proposed Theory of Technological Micro-Drives for Systemic Coevolution

The following premises support the proposed theory here:
(a)
Technology T is a complex system that is composed of more than one entity or sub-technological systems ti: 1, …, n and a relationship that holds between each entity and at least one other entity in the system to satisfy a need, solve a problem, or, more broadly, to serve a human purpose (or multiple purposes) Equation (1). The behavior and evolution of any technology is dependent on the behavior and evolution of interrelated technologies [2,15,16,51].
T e c h n o l o g y   T = t 1 , t 2 , t i , , t n
(b)
The evolution of a technological subsystem t is a consequential modification and/or improvement δ in technology t over time, concerning its performance and/or efficiency: Equations (2)–(5).
Temporal evolution of technology t is:
E v o l u t i o n   o f   T e c h n o l o g y   t = t + t = t 1
E v o l u t i o n   o f   T e c h n o l o g y   t 1 = t 1 + t 1 = t 2
E v o l u t i o n   o f   T e c h n o l o g y   t 2 = t 2 + t 2 = t 3
E v o l u t i o n   o f   T e c h n o l o g y   t 3 = t 3 + t 3 = t 4
t = technological subsystem
t1 = technological evolution of t
t2 = technological evolution of t1, etc.
δt = modification and/or improvement of technology t.
The evolution of technology (Δ) can be at different scales. If technology t is a subsystem or element of a main host technology T ( t T ) , the technological change and improvement in t is a microevolution in T. The technological change and improvement in T is a macroevolution of the overall system. We suggest a simple mechanism to link technological evolution at the micro and macro scales. Some basic concepts structure the theoretical framework.
Let T e c h n o l o g y   T = t 1 , t 2 , t i , , t n
Let ΔT = Macroevolution of the technological system T
Let Δt = Microevolution of the subsystem t
Let t T .
Postulates
The microevolutionary scale of a technological subsystem is linked to the macroevolution of its technological system.
Microevolutionary drives are basic for the macroevolution of technological systems.
The macroevolution of technology is a multidimensional change in its subsystems.
Macroevolution of technological systems = f(microevolutionary drives of subsystems).
Some testable implications of the theory of microevolutionary drives in the macroevolution of technological systems are:
Let κ = chronological or sequential time; κ − 1 is a previous period of time
M a c r o e v o l u t i o n   T = Δ T κ = f i = 1 n t 1 κ 1 + t 2 κ 1 + t 3 κ 1 , t i κ 1 , , t n κ 1 Δ T κ = f i = a n t i κ 1
M a c r o e v o l u t i o n   T = Δ T κ = f ( i = 1 n m i c r o   e v o l u t i o n   t 1 κ 1 + m i c r o   e v o l u t i o n t 2 κ 1 , , m i c r o   e v o l u t i o n t n κ 1 )
In general, microevolution refers to incremental, continuous changes and improvements within embedded technological subsystems.
Macroevolution is a major evolutionary shift in the host technology as a whole (e.g., smartphone generations), driven by cumulative subsystem advancements, resulting in significant changes in performance, design, and efficiency.
In particular, here, the macroevolution of a technological system ΔTκ at time κ is the addition of the microevolution of technological subsystems ti(κ − 1) developed in a previous period κ − 1. In addition, the macroevolution of a technological system is temporal dynamics (growth, development and change) based on the coevolution of technologies at different scales in a process of reciprocal adaptations to be more functional and efficient to satisfy changing needs and/or solve consequential problems of adopters [11]. Hence, this study proposes a systemic model of technological evolution grounded in Generalized Darwinism, where variation, selection, and retention occur at two interdependent levels: microevolution and macroevolution. Microevolution refers to incremental improvements in embedded subsystems (e.g., connectivity modules, energy systems), which introduce functional variations within the technological system. These variations are selected and retained when they enhance performance, usability, or market value. Over time, cumulative subsystem advancements trigger macroevolutionary shifts in the host technology, resulting in new generations with significant changes in design, functionality, and pricing. The model posits a causal relationship: subsystem evolution drives host technology evolution, shaping innovation trajectories Equations (6) and (7). This coevolutionary mechanism explains how internal component-level changes interact to produce systemic technological transformation (Figure 1).
The diagram illustrating the theoretical model in Figure 1 shows how subsystems evolve through microevolution, influencing host technology, which undergoes macroevolution and then creates a feedback loop back to subsystems. This cyclical interaction represents coevolution, with an arrow indicating progression over time.

3.2. Case Study

The prediction of the proposed theory is verified, initially, with a case study research based on Bluetooth technology as one of the technological subsystems of smartphone (a subsystem that stabilizes in the host and evolves into mutualistic complements). Bluetooth–iPhone is an analytically tractable, theory-consistent case where an embedded subsystem with well-documented versioning (Classic → Bluetooth Low Energy (BLE) → Ultra-Wideband (UWB) adjacency) coevolves with a host platform across 2007–2025. A narrative approach captures chronos (linear model releases, feature integrations) and kairos (opportune inflections, such as BLE adoption in iPhone 6), linking microevolutionary subsystem advances to macroevolutionary shifts in performance, design, and pricing. Using triangulated secondary data (standards histories, device specifications, accessory ecosystems, hedonic price lists) ensures reproducibility and temporal coverage, while Apple’s (American multinational corporation and technology company in Cupertino, California USA) tightly integrated architecture makes interface changes and host–parasite dynamics observable. This design, therefore, offers a rigorous, falsifiable testbed for the proposed macroevolution theory empirically.
In particular, the narrative approach is applied to analyze the link between the evolution of a subsystem (microevolution) and an interrelated technological system to clarify the pattern of macroevolution over time. Narratives connect the past, present, and future, enabling us to understand innovation as a temporal journey rather than a mere chronology [52]. In particular, the temporal dimension is captured by chronos, the linear unfolding of events, and kairos, the opportune moment for change [52]. Future technological trajectories are often shaped by projective narratives rooted in the past [52].
Bluetooth (developed by Bluetooth Special interest Group in Kirkland, Washington, U.S.) short-range wireless technology was introduced in 1998. This technology enables two information technology devices (such as wireless headphones, keyboards, mice, speakers to PCs, gaming consoles and mobile devices) to connect directly without a network infrastructure, such as a wireless router [53,54]. Bluetooth technology operates on radio frequencies in the 2.4 GHz range and has two current Bluetooth standards currently:
Bluetooth Classic supports basic rate and enhanced data rate.
Bluetooth Low Energy is a version that optimizes the power consumption of batteries in host devices, such as smartphones. It supports higher audio quality and more diverse listening options than Bluetooth Classic.
Initially, host devices (i.e., PCs) needed external dongles to connect to Bluetooth peripherals by USB ports. Since 2011, Intel corporate (Santa Clara, CA, USA) has included integrated Bluetooth functionality in Wi-Fi. Now, information technology devices have networking cards with Wi-Fi and Bluetooth functionality for improved performance and coordination across both radio capabilities.
Regarding the iPhone under study here, it is a line of smartphones originated by R&D investments in Apple that run the operating system iOS. The first-generation of the iPhone was presented in 2007 and introduced in worldwide markets in 2008. Apple has developed this innovative product and every year has launched new iPhone models and iOS versions [55]. The innovative iPhone was the first mobile phone with multi-touch technology. Technological evolution is directed to higher-resolution displays, video-recording functionality, waterproofing, a high-tech camera, and Face ID facial recognition. New advanced models in 2025 include also Apple Intelligence, A18prochip with a six-core CPU, camera control, a 48MP fusion camera, a 5x telephoto camera, visual intelligence, more than 32 hours of video playback, etc. [56,57]. Since the first iPhone in 2007, it supported Bluetooth technology version 2.0. In 2014, iPhone 6 introduced Bluetooth Low Energy. Apple has developed an innovation ecosystem of Bluetooth accessories that seamlessly integrate with the iPhone, such as AirPods, Air Tags, Apple Watch, etc. Apple [56,57] continually improves iPhone Bluetooth technology with each iOS update to improve audio quality, and new features are the “Find My” application to locate compatible Bluetooth devices [58]. The evolution of iPhone Bluetooth technology shows how Apple’s innovation is transforming the interaction between wireless devices. Future technological developments are directed to higher integration with a perspective of the coevolution of interrelated wireless technologies, such as improvements in Wi-Fi connectivity and a new wireless technology of the Ultra-Wideband.
The sampling logic employs a purposive, theory-consistent selection of the iPhone (2007–2025) as the host technology and Bluetooth as the focal subsystem (a subsystem that stabilizes in the host and evolves into mutualistic complements). This case is uniquely analytically tractable due to Apple’s tightly integrated architecture, which makes internal “host–parasite” dynamics and architectural alignments highly observable. Bluetooth offers a well-documented evolutionary path—moving from Classic to Low Energy and Ultra-Wideband adjacency—serving as a clear proxy for microevolutionary change. The 18-year longitudinal window is strategically chosen to capture the full macroevolutionary arc of the smartphone era. This timeframe allows for the analysis of both chronos (the linear sequence of model releases) and kairos (transformative inflections, such as the 2011 integration of Bluetooth into Wi-Fi cards). Spanning from the 2007 inception to the 2025 “Apple Intelligence” era ensures sufficient temporal depth to validate how cumulative subsystem advancements dictate systemic shifts in performance and market trajectory.
Now, the goal is to explain the link between the evolution of Bluetooth technology (as a subsystem), other technological subsystems and the iPhone (host technological system), from a perspective of host–parasite interaction [2]. This inductive analysis can clarify the link between the evolution of a subsystem (microevolution) and an interrelated host technological system to clarify the pattern of technological co–evolution over time.

3.3. Data Sources and Data Analysis Procedure

Source quality and verifiability are as follows. Primary sources are the Bluetooth SIG (core specification release notes/version history) and Apple’s official technical specifications and press releases; these are at the top of our source hierarchy and were used whenever available [53,56,57]. Secondary sources (e.g., [59,60,61,62]) were consulted only when primary data were unavailable or incomplete and then cross-checked across at least two independent outlets. Discrepancies were resolved in favor of primary sources; otherwise, the modal value across secondaries was used and flagged. In particular, data from these different sources were described in a narrative, from which intertwined past, present, and future notions were analyzed considering chronos and kairos aspects [52,63,64].
Firstly, this study analyzes data about the evolution of Bluetooth technology from the Classic Bluetooth versions (1.0–3.0) to Bluetooth Low Energy versions (4.0–5.4) and future directions [53,60]. Moreover, this study also analyzes data concerning the evolution of different models of the iPhone from the first model with OS1.0 announced in January 2007 to iPhone 17 with IOS 18.3, announced on 9 September 2025 [56,57,65], using different Bluetooth technologies. In particular, the chronological technological analysis considers which iPhone models support specific versions of Bluetooth technology [65]. Other data analyzed are camera characteristics [61], screen resolutions and sizes [66] and battery technology [56,57,62] embodied in different versions of iPhone models. This study also considers the price of the iPhone that includes the value of technological evolution. Price data are from Apple [56,57] and CNET [59]. The goal is to explain technological evolution by product characteristics and market valuation, integrating both economic and technical dimensions [22]. To ensure the findings are both robust and reproducible, this study employs a rigorous framework for data reliability and validity, centered on the longitudinal analysis of the iPhone (2007–2025). Reliability of the data derives from authoritative provenance, rigorous triangulation, temporal integrity, and transparent processing. Critical variables—Bluetooth version support, component specifications, and prices—are cross-verified across at least two independent sources; discrepancies trigger reconciliation rules that favor the proximate, official record. Construct validity based on a narrative approach that distinguishes between chronos and kairos captures the “temporal journey” of innovation rather than just a list of dates. The selection of the iPhone provides high internal validity; its “analytically tractable” and tightly integrated architecture makes the “host–parasite” dynamics between subsystems and the host system uniquely observable. This ensures the study accurately measures the coevolutionary mechanisms it intends to investigate. Overall, scope fit and longitudinal depth make these primary and secondary data robust and reproducible.
Secondly, in order to detect the evolution of a specific technological subsystem in smartphones, the arithmetic and exponential rates of growth are calculated.
Let TC represent the technological characteristics over 2007–2025; in particular:
TC 2007 = level of technological subsystem in 2007, first year available
TC 2025 = level of technological subsystem in 2025, last year available
If the development of technological subsystem i is assumed to be of the arithmetic type, the rate of growth is given by Equation (8):
T C i , 2025 = T C i , 2007 + T C i , 2007 r a r t · t ;   r a r t = T C i , 2025 T C i , 2007 T C i , 2007 · t
If the development of a technological subsystem i is assumed to be of the exponential type, the exponential rate of growth is given by Equation (9):
T C i , 2025 = T C i , 2007 e r e x p i t ;                                                               T C i , 2025 T C i , 2007 = e r e x p i t ; r e x p i = l o g T C i , 2025 T C i , 2007 t   = r a t e   o f   e x p o n e n t i a l   g r o w t h   o f   t e c h n o l o g i c a l   s u b s y s t e m   i
Thirdly, the patterns of temporal change are analyzed with Pearson bivariate correlation with a one-tailed test of significance. We use one-tailed tests because our theory predicts a positive relationship: improvements in subsystems should increase host capability and value. Since this directional hypothesis is defined ex ante, a one-tailed test is appropriate and more powerful for detecting the expected positive effect while remaining falsifiable if the correlation is zero or negative. Simple bivariate Pearson correlations are calculated using log-transformed variables (camera resolution, display ppi, battery hours, price), evaluated independently of calendar time. This approach demonstrates that subsystem characteristics co-move with host technology performance and valuation even when time is not explicitly included in the statistical specification. The log transformation linearizes multiplicative relationships, reduces skew, and stabilizes variance—standard motivations for its use in technological and economic time-series analysis. Pearson’s r coefficient then offers a clean summary of the underlying association without any imposed temporal structure. Thus, the relationships do not rely exclusively on shared upward time trends. In short, as just mentioned, the choice of one-tailed tests follows directly from the study’s theoretical framework: it is more powerful for detecting an effect in the predicted direction, and it remains standard practice when theory specifies directionality.
This correlation analysis supports the next analysis on the estimation of the parameters in a relationship between the variables under study with the following linear model of regression to assess the temporal evolution of technological subsystems in the host system. Model having Equation (10) considers time as an explanatory variable to analyze statistically the trends of technological subsystems. The basic model is:
Ln yi = αi + β timei + ui
y = technological evolution of subsystem i
time = explanatory variable capturing the dynamic progression of each subsystem
α = constant
β = coefficient of regression
u = error term
Ln = logarithm with base e = 2.718281828 is used to obtain robust results because the log transformation of variables has normality in the distribution.
Hence, the specification is designed to estimate the evolution of technological subsystems over time. Equation (10) intentionally uses time as the explanatory variable to capture the direction and magnitude of subsystem evolution.
Finally, the hedonic pricing method offers a valuable analytical approach for understanding the relationship between technological characteristics and market valuation, integrating both economic and technical dimensions [22,24,67]. In innovation studies, it is basic to detect and quantify technical changes that enhance product performance [68]. The core assumption of the hedonic approach is that a product’s market price reflects the value of its individual attributes. By quantifying the contribution of each subsystem to product value, the hedonic model reveals how subsystem innovations drive macroevolutionary shifts in technological systems. Thus, the hedonic method offers a dynamic perspective on innovation, showing how subsystem-level changes shape broader technological transformation. The variables under study are:
Price P of the iPhone (U$) sold from 2007 to 2025. Values are both Nominal USD and adjusted to 2025 United States Dollar, USD (see Supplemental Information for the method of conversion).
The evolution of smartphone technology is measured with technological characteristics (FMTs) of subsystems over 2007–2025 (Sahal [9], pp. 27–29). The FMTs in the iPhone used here are given by:
Wide camera resolution (megapixel or Mpixel or Mpix, refers to a unit of measurement equal to one million pixels, used to describe the resolution and detail of digital images and camera sensors).
Display resolution in ppi, which measures the pixel density of a screen, indicating the number of individual pixels packed into each inch of the display. A higher ppi means more pixels, which results in sharper, more detailed, and smoother images and text on the screen.
Battery h of video playback (hours).
This study considers a log–log model of hedonic pricing, in which iPhone prices (both in nominal values and in inflation-adjusted 2025 USD) are regressed with respect to the technological characteristics of subsystems. The specification of the log–log model (considering data in natural logarithms to have normal distributions and more robust results) is the following Equation (11):
l o g   P i P h o n e 2007 2025 = α 0 + α 1 l o g   C a m e r a M p i x + α 2 l o g   D i s p l a y   + α 3 l o g   B a t t e r y ( h )
α0 = constant;
αi = coefficient of regression (i = 1, 2, 3 technological subsystems).
In general, the hedonic framework can quantify how improvements in embedded subsystems (e.g., camera, display, battery) are capitalized into the iPhone’s market valuation. In hedonic theory, the observed price of a differentiated good reflects the implicit prices of its objectively measured attributes; regressing price on characteristics reveals those implicit valuations. This approach follows the measure of technological change in multi-attribute products by Saviotti [67]. Prices are modeled in natural logs in Equation (11) so that the coefficients are elasticities (percent changes), enabling direct comparison across attributes and over time. Standardized coefficients further indicate the relative importance of each subsystem to the macroevolution of the iPhone. A t-test is reported for each coefficient to assess statistical significance. To ensure temporal comparability, we analyze both nominal USD and inflation-adjusted 2025 USD prices. Real prices are obtained by scaling each observation using the CPI-U, U.S. city average, all items, not seasonally adjusted (1982–1984 = 100); specifically, P 2025 = P t × C P I 2025 / C P I t . This ratio method is the same principle used in the BLS inflation calculator and is consistent with BLS guidance in the Handbook of Methods. We rely on annual averages (not monthlies) to avoid seasonal noise and to align with the BLS calculator’s implementation; the CPI-U annual averages for 2007–2025 are drawn from the BLS tables (operational details and the exact CPI values used are provided in the Supplementary Materials with information and link indicated before references). Averaging observed market prices within each model year smooths promotions and temporary shocks, yielding a stable series aligned with Apple’s annual release cadence. Because the dependent variable is logged, the hedonic estimates are comparative and directional—they indicate which subsystems co-move most with price—rather than being dependent on precise level differences across Stock Keeping Units (SKUs) or retailers. Interpreting the results, the log–log hedonic coefficients quantify how a 1% improvement in a subsystem (e.g., hours of video playback, pixels-per-inch) is associated with a percent change in iPhone price. When using nominal USD, these elasticities reflect the joint influence of technology and contemporaneous pricing strategies (including inflation and markup). When using inflation-adjusted 2025 USD prices, they reflect quality-adjusted relationships by holding purchasing power constant; consequently, real-price elasticities isolate the extent to which subsystem advances alone explain valuation once macroeconomic drift is removed.
This price-based specification is complemented by an alternative model that regresses iPhone versions on subsystem metrics to capture generational progression independent of pricing artifacts (comparative analysis reported alongside the hedonic results). Hence, together with this version-based model, which abstracts from prices altogether, the framework here triangulates how subsystem evolution supports the macroevolution of the iPhone—as economic value (hedonic prices) and as technological generation (versions). Conceptually, this research strategy implements the hedonic premise that consumers pay for utility-bearing “mutations” in attributes, making hedonic regression a natural approach to link micro-level component progress with system-level evolution. The choice of a log–log model assumes, as said, constant elasticity. This means technical improvements result in proportional, rather than strictly linear, changes in price. The use of standardized coefficients assumes that the relative influence of each subsystem can be isolated, allowing researchers to determine which “micro-drive” most significantly dictates the host’s macroevolutionary path. In addition, modeling iPhone price evolution with camera resolution, display ppi, and battery hours as key regressors is appropriate for robust inference. Potential omitted factors—storage tiers, modem speed, RAM, materials, and brand equity—either vary within models, are partially mediated by our proxies (energy efficiency → battery hours; compute → camera performance), or trend smoothly and are absorbed by the intercept without distorting elasticities. Thus, camera, display, and battery function as sufficient statistics for perceived performance and pricing power in this product line, enabling reliable estimation of subsystem–price linkages while limiting omitted-variable bias in this study. Moreover, macroevolution (ΔTκ) is not defined as “later in time” or a simple generation counter. We operationalize ΔTκ as a multidimensional structural change in the host system, detected independently of calendar time. Hence, microevolution is quantified as standardized increments in subsystem (e.g., Bluetooth version, battery watt-hour, display pixels per inch). Macroevolution, as clarified previously, occurs when accumulated micro-changes jointly trigger a detected break in the system vector. Thus, the hypothesis that microevolution drives macroevolution, meaning that cumulative subsystem advances cause statistically detected, system-level structural reconfigurations, not merely later product releases. Overall, then, models in Equations (10) and (11) follow the conventions of technological evolution research, where subsystem characteristics capture structured, measurable technological improvements, and the residual term captures broader, diffuse progress not attributable to specific subsystems.
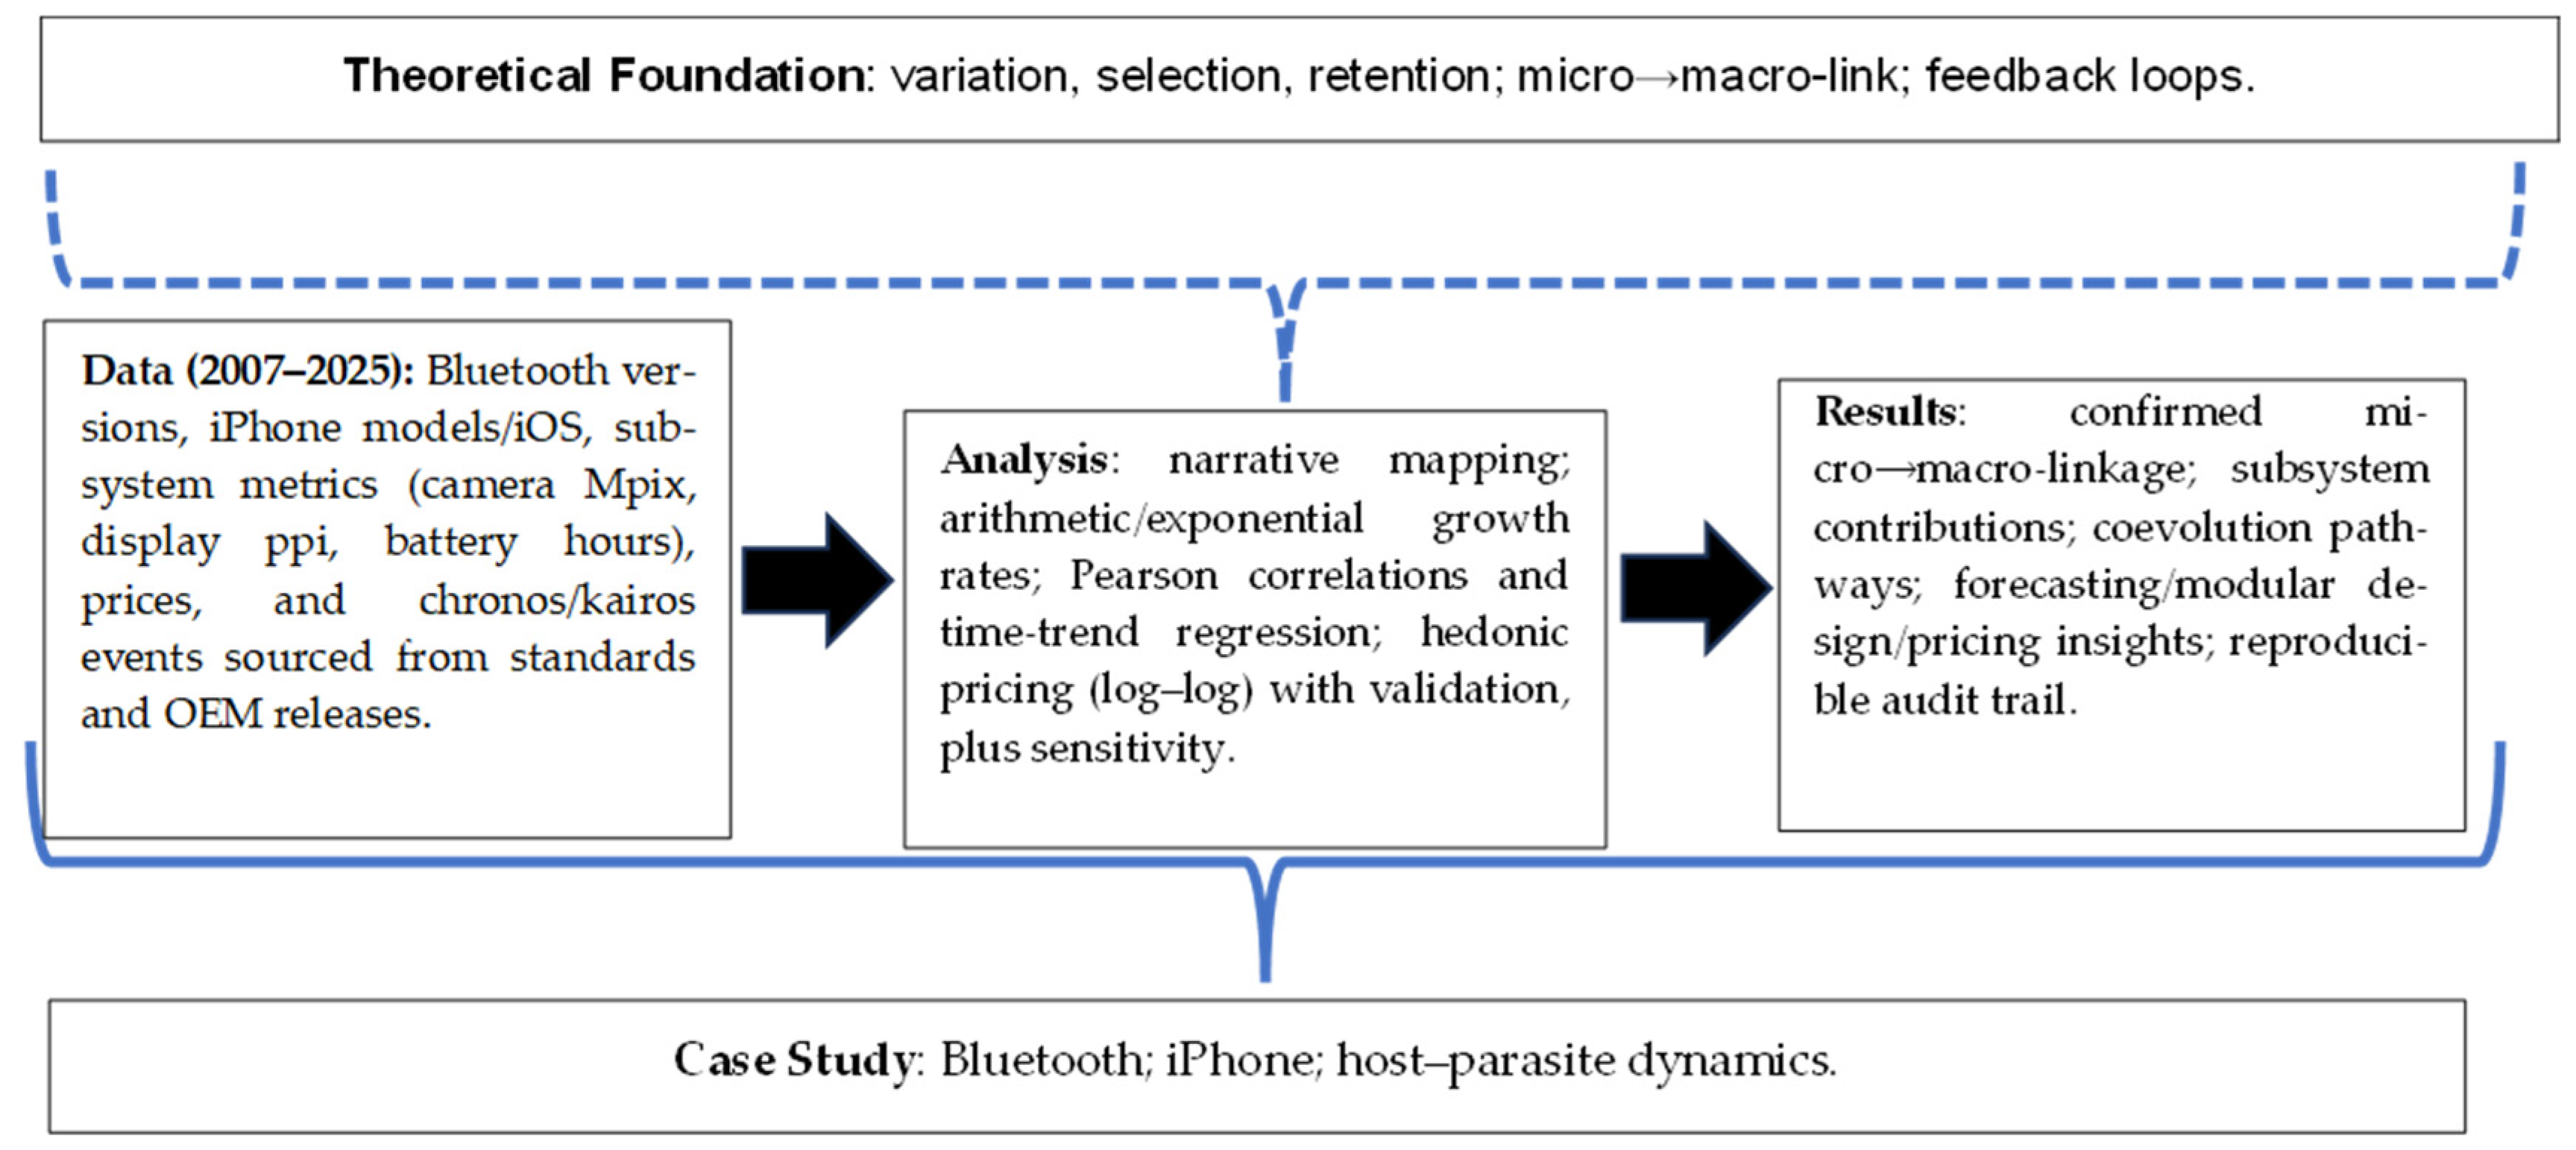
Validation of the approach described proceeds in the following stages. First, data integrity is ensured by cross-checking prices, camera Mpix, display ppi, and battery hours across independent sources and aligning prices to identical storage tiers. Second, model specification is validated using the log–log form that is better than the linear and semi-log alternatives. Third, inference robustness is assessed with coefficient t-tests, standardized betas, and the coefficient of determination. Figure 2 shows the analytical process of this study.
It is important to anticipate that the results are tentative because limitations temper the inference of this study design. First, reliance on some secondary sources introduces provenance heterogeneity, potential vendor bias, missing fields, and revision lags; despite triangulation, measurement error may persist in camera Mpix, display ppi, battery hours, and launch prices (storage tiers, promotions, regional taxes, currency drift). Second, the single-platform case (iPhone) limits external validity; Apple’s integrated architecture and ecosystem effects (brand, services, accessories) confound subsystem–price relationships. Third, the hedonic log–log specification risks omitted variables (RAM, materials, software features), multicollinearity among subsystem metrics, functional-form misspecification, and endogeneity, where attributes and prices coevolve. Fourth, temporal analyses may face autocorrelation, structural breaks (design generations, policy shocks), and small-sample constraints, weakening statistical power and out-of-sample generalization. Fifth, proxies can be imperfect: Mpix and ppi do not fully capture image pipeline quality or display experience; battery “video hours” reflects usage assumptions. Finally, narrative coding of chronos/kairos events entails interpretive judgment, exposing results to coder bias.

4. Results

4.1. Patterns of Systemic Technological Evolution

This section focuses on how an embedded subsystem (e.g., Bluetooth) and a host technology (iPhone) coevolve within a technological ecosystem.
Bluetooth technology is considered a parasitic technology as a subsystem for manifold technologies, such as smartphones, speakers, smartwatches, etc., evolving towards a symbiotic interaction [2,69]. Bluetooth version 1.0 was introduced in July 1999 as wireless communication between mobile and computing devices. In 2004, Bluetooth 2.0 was released with EDR (Enhanced Data Rate) technology, which increased the data transfer rates up to 3 Mbps and bandwidth to the transfer of large files. The technological and user utility of Bluetooth technology has emerged with the invention and market introduction of the radical innovation of the iPhone in 2007, which generated a market shift in information and communication technologies [56,57]. The first-generation 1.0 of the iPhone model is designed to support Bluetooth 2.0 with the EDR. In the technological system of the iPhone, Bluetooth technology is a main technological subsystem supporting the evolution of the overall host technology. A main assumption in our theory is that the macroevolution of a technological system = f(evolution of its subsystems). The technological evolution of Bluetooth technology 2.0 in 2004 supported the innovative technological system of iPhone 1.0 (year 2007). Initially, the temporal lag between the evolution of this parasite technology and the introduction in the main host technology given by iPhone was 3 years. As a consequence, the evolution of the technological subsystem (Bluetooth 2.0), temporally antecedent, is supporting the evolution of the host system in which it is embedded for the evolution of the technological system (iPhone). This technological regularity is also true for the next versions of Bluetooth (initially parasitic, but progressively symbiotic subsystem) and iPhone technology (host technological systems), i.e., evolution in subsystems (called here microevolution) drives the macroevolution of host technological systems (microevolution, as defined in the introduction, indicates a new generation of technological subsystems, and macroevolution indicates new product generation, including previous new technological subsystems). In fact, Bluetooth 4.0 was presented in 2009, with a comprehensive multiple-mode integration of classic Bluetooth, high-speed, and the innovative Bluetooth Low Energy extension. This technological advancement (evolution) in Bluetooth 4.0 contributed to the technological advancement (macroevolution) of the new iPhone model 5.0 in 2011, which combines this new technology in its technological system and other families of Apple products [25,56,57]. Hence, the evolution of Bluetooth technology (in 2009), as a symbiotic subsystem, contributed, after 2 years, to the macroevolution of its host system in 2011. The combined process between subsystems and macrosystems continues over time: Bluetooth 5.0 was released in 2016, improving the message capacity to 255 bytes—8 times more than Bluetooth 4.2—and the rate of data transfer achieves 2 Mbps in low-power mode, twice the earlier rates. In addition, the communication range is about 300 m. The new iPhone version 8.0 released in 2017, as a host system, implemented Bluetooth 5.0 after one year. Instead, Bluetooth 5.3 was introduced in 2021, with main advances in transmission efficiency, improved interference resistance, and battery life. Other incremental innovations are encryption key size control, periodic advertising and channel classification enhancements. The evolution of this subsystem in 2021 supported the macroevolution of the host technological system iPhone 14 model in 2022. Bluetooth 6.0, launched in September 2024, boosts precision with centimeter-level distance tracking, smarter ad filtering, and improved device monitoring. It enhances audio with lower latency, strengthens security, and optimizes power management for longer battery life—delivering faster, more reliable, and energy-efficient wireless connectivity. The new version of iPhone 17, released in September 2025, introduced Bluetooth 6.0, with a time delay of 1 year, contributing to the incremental macroevolution in the host system of this smartphone. These interrelationships between evolution in the parasitic–symbiotic subsystem and macroevolution of the host system are presented in Table 1. In short, evolution in subsystems is a driver of the evolution of host macrosystems. Moreover, the time lag from evolution of the subsystem and its implementation in the host technological macrosystem has reduced from 3 years to 1 year, suggesting an acceleration process in the evolution of technological macrosystems, driven by the evolution of this and other subsystems.

4.2. Patterns of Temporal Technological Evolution

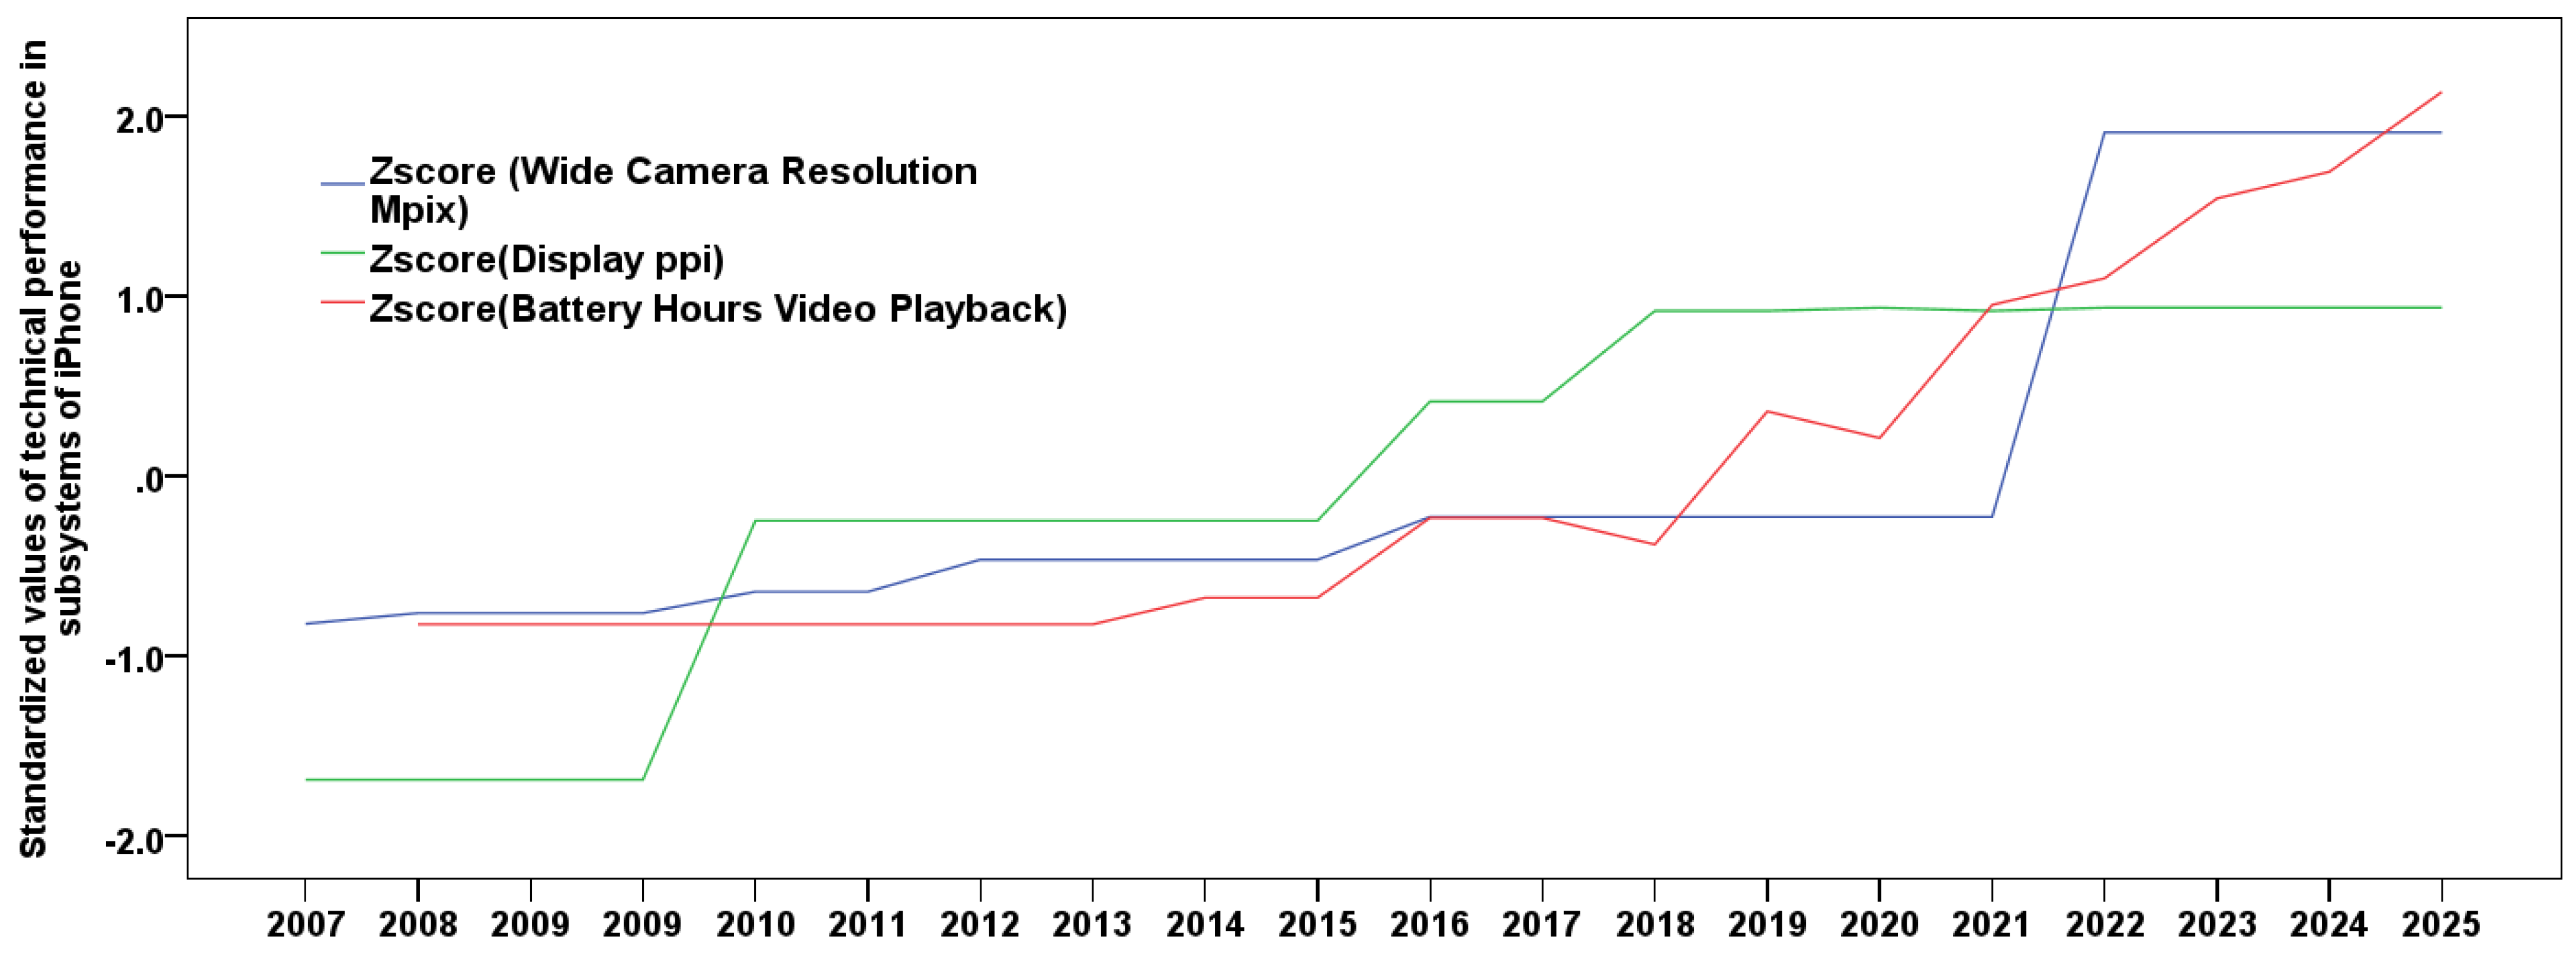
This section shows how the technical performance of subsystems embedded in the host changes through time. Figure 3 shows the evolutionary dynamics of the main technological subsystems included in the iPhone over 2007–2025. The graphical representation shows the increasing technical performance and quality of two main technological subsystems supporting the evolution of new versions of iPhone technology: higher Mpixel in wide camera resolution and hours of video playback in the battery.
Table 2 shows the rate of growth in the technological characteristics of these subsystems incorporated into iPhone technology that indicates their contribution to technological evolution in the system. According to the arithmetic and exponential rates of growth over time, higher technological advances that support the macroevolution of the iPhone are due to the subsystems of wide camera resolution (exponential rate of growth r exp = 16.73%, 2007–2025), hours of battery for video playback (r exp = 5.78%, 2007–2025), and, finally, display ppi (exponential rate of growth r exp = 5.46%, 2007–2025).
The results are also supported by statistical analyses of regression models with time as an explanatory variable (Table 3). In fact, parametric estimates of the linear model as a function of time in Table 3 show that the highest temporal growth is by wide camera resolution Mpix (b = 0.16, p-value 0.001), whereas display ppi and battery (hours video playback) have a similar temporal growth of about b = 0.06 (p-value 0.001). The coefficient R2 is high and explains about 90% of the variance in the data for the models with camera resolution Mpix and battery (h, video playback) as response variables, whereas the regression model explains about 74% of the variance in the data for the response variable of display ppi as a function of time. The F-test has a significant p-value < 0.001.
Hence, arithmetic growth reflects constant absolute increments per period, whereas exponential growth reflects constant percentage gains that compound. In our data, wide camera resolution exhibits exponential dynamics (r exp = 16.73%), consistent with architectural discontinuities (sensor area, pixel binning, computational photography) that multiply effective resolution; its linear time slope (β = 0.16, p < 0.001) corroborates acceleration. Battery hours grow exponentially at 5.78%, but under thermal constraints, improvements largely arise from SoC efficiency, software power management, and modest cell increases—hence, the smaller linear slope (β ≈ 0.07). Display ppi shows an early exponential phase (5.46%) followed by saturation near ~458–460 ppi; ergonomics and acuity bound arithmetic gains (β ≈ 0.06). Interpreted together, exponential rates flag subsystems acting as evolutionary engines that trigger macro-level redesigns, while arithmetic trends indicate maturation and refinement. The shift from exponential to arithmetic growth thus marks transitions in the locus of macroevolutionary momentum across iPhone subsystems.
The log-linear specification in Equation (10) ln y t = α + β   time t + u t is appropriate for these trend assessments (Table 3). Linearity is supported because the log transform converts observed multiplicative growth (Figure 3) into an approximately straight-line relation; the high fit (R2 ≈ 0.74–0.90) indicates minimal curvature. Homoscedasticity is plausible as logs stabilize scale, and no obvious “funneling” is suggested by the similar dispersion of residuals implied by tight standard errors across years. Normality of errors is aided by the log transform, which reduces skew in camera, display, and battery series; the strong, precise coefficients (p < 0.001) are consistent with roughly symmetric residuals. Independence is plausible because time is deterministic (exogenous) and measured without error; with one observation per year and smooth hardware cycles, any remaining serial correlation is likely modest for descriptive trend estimation. No multicollinearity holds (single regressor). Outliers/structural breaks appear limited (e.g., display ppi plateau), avoiding leverage that would distort slope estimates.

4.3. Patterns of Morphological Technological Change

This section clarifies how the configuration of attributes (subsystem levels) relates to the state of the host (versions, price)—independent of calendar time.
Table 4 uses simple bivariate Pearson correlations on log-transformed variables to describe how subsystem capabilities (camera resolution, display ppi, battery hours) move with host outcomes (iPhone model progression and price), independent of calendar time. The log scale linearizes multiplicative relationships, reduces skew, and stabilizes variance, making Pearson’s r an appropriate summary. We adopt one-tailed tests because the theory proposed suggests a positive relationship: improvements in subsystems are expected to increase host capability and value. In short, we use a one-tailed test (or one-sided test) considering our theoretical perspective that indicates the positive direction of the correlation between subsystems and the host technological system. This directional hypothesis is stated ex ante, so the one-sided test is suitable and more powerful for detecting the predicted effect while remaining falsifiable if correlations are null or negative. The observed log-scale associations are strong (r = 0.79–0.93; N = 20). The bivariate correlations reported in Table 4 show strong and statistically significant associations (at the 0.01 level) between iPhone model generations and key subsystem performance indicators. Specifically, iPhone model versions correlate highly with wide camera resolution (r = 0.92), display ppi (r = 0.89), and battery hours for video playback (r = 0.93). A similar pattern emerges for the U.S. dollar price of iPhone models, which is strongly correlated with wide camera resolution (r = 0.90), display ppi (r = 0.79), and battery video playback hours (r = 0.93). These results indicate that the macroevolution of the iPhone technological system is closely associated with improvements in its embedded subsystems. The strong correlations suggest that enhancements in camera capabilities, display resolution, and battery performance play a central role in “driving” or “propelling” the evolutionary trajectory of the overall device. Nonetheless, such relationships do not preclude the influence of broader technological trends—such as general advances guided by Moore’s Law or exogenous shifts in manufacturing and component design—which may also contribute to the observed patterns of technological evolution.
Table 5 shows how the evolution of key embedded subsystems—wide camera resolution, display sharpness (ppi), and battery life (video playback hours)—relates to the macroevolution of the iPhone when measured by price and by generational progress, and it clarifies how inflation adjustment and collinearity shape inference. In the log–log price model using nominal USD (Model 1A), subsystem performance maps strongly onto market valuations: battery life emerges as the dominant predictor (standardized β = 0.772; b = 0.293, p = 0.003), implying an elasticity close to 0.30—i.e., a 1% gain in battery hours is associated with an expected ≈0.3% increase in nominal iPhone price. Display resolution contributes positively but more modestly (β = 0.15; p = 0.333), while wide camera resolution has a negligible effect (β = 0.06; p = 0.818). The model fit is high (R2 = 0.88; F = 37.96, p < 0.001), indicating that, in historical nominal terms, hardware subsystems—especially battery performance—explain most of the observed price variation.
By contrast, when prices are converted to inflation-adjusted 2025 USD (Model 1B), these relationships attenuate sharply: the explained variance falls to R2 = 0.25, and the overall model is not statistically significant (F = 1.69). In this inflation-adjusted frame, none of the subsystem coefficients reach significance (battery: b = 0.125, β = 0.982, p = 0.089; display: β = 0.54, p = 0.176; wide camera: β = −1.187, p = 0.089), and the signs and magnitudes suggest instability consistent with variance compression and overlapping signals among predictors. Substantively, the move to inflation-adjusted 2025 USD removes inflationary drift and strategy-related markups embedded in nominal prices; the resulting flattening of real prices makes them less sensitive to subsystem improvements alone, implying that real price dynamics are mediated by additional factors (e.g., product positioning, cost structures, services bundling) beyond pure hardware advances. A cleaner technological signal appears when the dependent variable is the sequence of iPhone versions (Model 2). Here, subsystem evolution aligns tightly with generational progression: battery life (β = 0.577; b = 0.878, p < 0.001) and display ppi (β = 0.443; b = 0.734, p < 0.001) are both strong, significant drivers, whereas wide camera resolution remains negligible (β = 0.047; p = 0.720). The model explains nearly all variance in versioning (R2 = 0.97; F = 167.86, p < 0.001), indicating that improvements in energy endurance and visual density are the principal levers of systemic advancement. Throughout, collinearity diagnostics support interpretability with caution: VIFs range from 2.90 to 8.56 (tolerances 0.117–0.345), indicating moderate coevolutionary overlap typical of tightly integrated technologies but remaining below conventional concern thresholds (VIF < 10; tolerance > 0.10). This pattern helps explain why constant-dollar price elasticities appear unstable in Model 1B—deflation concentrates residual covariance among predictors—while the version-based specification, less exposed to pricing artifacts, yields stable and theoretically coherent estimates. Taken together, these results show that improvements in battery life and display density, rather than increases in wide camera resolution, are the most consequential subsystem forces driving the iPhone’s macroevolution, with effects most visible in nominal pricing and most cleanly captured by generational versioning. Moreover, subsystem evolution appears to drive iPhone macroevolution rather than merely co-varying with background technological progress. Hence, in the nominal log–log price model (Model 1A), battery endurance is the dominant predictor, implying a ~0.30 price elasticity: a 1% increase in video playback hours predicts a ≈0.3% higher price. Display ppi contributes modestly, and wide camera resolution is negligible; the overall fit is high, indicating that hardware subsystems explain most nominal price variations. Yet when prices are deflated to constant 2025 USD (Model 1B), the effects attenuate. The causal structure is clearer when macroevolution is measured by generational progression (Model 2): battery life and display density strongly and jointly predict versioning (R2 = 0.97). Moderate collinearity reflects coevolution but does not preclude interpretation of the subsystem causal impact.
Table 5 reveals a sharp contrast: subsystem evolution explains most nominal iPhone price variations (Model 1A: R2 = 0.88), yet only a modest share of real, inflation-adjusted price variations (Model 1B: R2 = 0.25). This attenuation can be due to a theoretical boundary condition on hardware-led value capture. In nominal terms, embedded subsystems—especially battery life (elasticity ≈ 0.30)—function as inflation-hedging value drivers and pricing levers: firms can justify list-price maintenance or hikes by pointing to salient hardware gains. Once prices are deflated, inflationary drift and strategy-related mark-ups are stripped away; the remaining real price dynamics are far less sensitive to hardware metrics alone. This pattern is consistent with hedonic price index practice, where quality adjustments flatten real price trends for fast-improving ICTs and reduce the apparent contribution of hardware to inflation measures. The residual variance in Model 1B can align with platform–ecosystem explanations of value capture that operate outside the hardware characteristics space. First, network effects and lock-in (e.g., app stores, installed base, switching costs) shift willingness-to-pay independently of components, so real pricing power partly resides in user–developer complementarities rather than incremental subsystem performance. Second, platform governance and ecosystem orchestration (services bundles, cross-side subsidies, vertical integration) shape price structures in two-sided markets, allowing firms to monetize on one side (e.g., services) while using hardware as a conduit—again weakening the direct hardware→real-price link. Moreover, as highlighted in the literature on layered modular architectures [70] and platform ecosystems [71], the hardware host increasingly serves as a “loss leader” or entry point for high-margin, intangible drivers. Third, brand equity creates durable price premia that are only loosely tied to technical specifications, amplifying nominal pricing but leaving a limited trace in real-price regressions centered on components [71,72]. Measurement research in the digital economy further explains the gap: consumer surplus from digital complements (apps, cloud, “free” services) is often uncaptured by deflated hardware prices, widening the disconnect between characteristics-based models and realized welfare or pricing outcomes [73]. Hence, factors such as software ecosystem lock-in, brand equity, and recurring service revenue (e.g., App Store, iCloud) likely account for the real-term premium that hardware alone no longer explains. In short, subsystems (battery, display) remain primary pacemakers of nominal pricing—useful for road-mapping and positioning—but the real value capture of the host technology is increasingly mediated by ecosystem lock-in, brand, and services. In this perspective, subsystems like battery and display act as the legitimizing pulse for nominal hikes—essentially “running to stay in place” against inflation—while the true economic macroevolution is driven by the intangible service layer. To put it differently, recognizing this nominal–real boundary moves the study beyond “hardware drives price” to a more complete account of how subsystem advances support pricing while platforms, brands, and services determine durable, inflation-adjusted value [71]. This finding adds a layer of sophistication to the study: hardware microevolution is the necessary condition for a new version, but the ecosystem is the sufficient condition for real economic growth.
This empirical evidence can be systematized in a logical manner as follows:
M a c r o e v o l u t i o n o f   i P h o n e ( Δ ) = f ( i = a n   W i d e   C a m e r a   r e s o l u t i o n κ 1 +   D i s p l a y +   B a t t e r y κ 1 , , t n κ 1 )
Δ = Macroevolution   o f   t h e   h o s t   t e c h n o l o g i c a l   s y s t e m
= e v o l u t i o n   o f   t h e   s u b   s y s t e m s
In synthesis, the results show Systemic (who coevolves and when) → Temporal (how fast performance changes) → Morphological (which attribute mix reshapes the host and price) technological evolution. Together, they triangulate causal timing, growth dynamics, and structural impact. These results of inductive analysis can be generalized, suggesting that macroevolution of the overall system is driven by the evolution of basic embedded subsystems, as emerged in iPhone technology, in which main subsystems support the technical macroevolution of iPhone technology, such as higher technological performance in Bluetooth with case study research and display with higher ppi and battery with higher hours for video playback in statistical analysis. In short, the results show that Bluetooth operates as a subsystem whose microevolution precedes and propels iPhone macroevolution. Version-adoption timing displays a shortening lag: Bluetooth 2.0 (2004) → iPhone 1 (2007, 3 years); Bluetooth 4.0 (2009) → iPhone 4 (2011, 2 years); Bluetooth 5.0 (2016) → iPhone 8 (2017, 1 year); Bluetooth 5.3 (2021) → iPhone 14 (2022, 1 year); and Bluetooth 6.0 (2024) → iPhone 17 (2025, 1 year). This acceleration indicates closer subsystem–system coupling based on symbiotic interactions [2,15,16]. Across 2007–2025, components improved: wide camera resolution exhibits the fastest exponential growth (r exp = 16.73%), followed by battery hours for video playback (5.78%) and display ppi (5.46%). Time-trend regressions corroborate these trajectories: camera (β = 0.16, p < 0.001) grows rapidly; display and battery rise at ~0.06–0.07 (p < 0.001). The model fit is high (R2 ≈ 0.90 for camera and battery; 0.74 for display). Bivariate correlations align with a macroevolutionary pattern: iPhone model progression correlates with camera (r = 0.92), display (r = 0.89), and battery (r = 0.93); prices correlate similarly (0.90, 0.79, 0.93). Hedonic models clarify drivers: battery and display explain price (adj. R2 = 0.86; 1% battery gain ≈ 0.3% price increase) and model evolution (adj. R2 = 0.97). Hence, subsystem microevolution drives technological change.
The models exhibit substantial explanatory strength, enabling practical forecasting at both the subsystem and system levels. Time-trend regressions yield high R2 (≈0.90 for camera resolution and battery hours; 0.74 for display ppi), indicating that temporal dynamics capture most variance in these trajectories. Consequently, projecting one–three years ahead for subsystem performance is defensible under the continuity of trends. The estimated slopes (β_camera ≈ 0.16; β_display ≈ 0.06; β_battery ≈ 0.07, all p < 0.001) quantify the pace of change, supporting parametric extrapolations (e.g., log-linear forecasts for Mpix, ppi, and video playback hours). The hedonic models extend predictive capability to market outcomes. With adj. R2 ≈ 0.86 for price and ≈0.97 for iPhone versions as a function of subsystem metrics, the framework can translate forecasted subsystem levels into expected price points and model evolution. Notably, battery hours and display ppi are reliable leading indicators of both pricing power and version cadence (e.g., a 1% battery improvement predicts ≈0.3% price uplift, ceteris paribus). This allows scenario planning: given anticipated gains in energy efficiency or display density, managers can pre-price models and stage feature bundles. A further forecasting lever is the observed adoption lag between Bluetooth releases and iPhone integration (shrinking from 3 to 1 year). Treating new Bluetooth standards as exogenous signals, the model can nowcast subsystem availability and time host system upgrades. Hence, prior work (Simon; Sahal; Arthur; Utterback) theorizes hierarchical systems and symbiotic interactions but typically stops short of quantifying subsystem–host timing. We document a systematic temporal precedence of subsystem microevolution (Bluetooth) over iPhone macroevolution and show that the adoption lag shrinks from 3 to 1 year (2007–2025). This finding reveals an acceleration in subsystem–system coupling, suggesting a symbiotic interaction, not explicitly measured before. Moreover, we operationalize macroevolution as a function of prior-period subsystem advances, making the coevolution claim testable and generalizable across technologies. In addition, while the literature often highlights cameras as headline features, our hedonic models show that battery hours and display ppi—not camera megapixels—can explain price and model evolution most strongly. This reframes the perceived value: energy efficiency and visual clarity are the primary economic levers. We also distinguish exponential vs. arithmetic subsystem trajectories and their strategic implications. Camera resolution shows sustained exponential growth (rexp ≈ 16.7%), whereas display ppi reaches a physiological/ergonomic ceiling (~460 ppi), and battery gains compound modestly (rexp ≈ 5.8%) via system-level efficiencies. This locates the shifting locus of macroevolutionary momentum across subsystems, a nuance underdeveloped in prior theory.
Overall, then, from parasitic to symbiotic, empirically traced, the study shows that the Bluetooth–iPhone chronology provides observed host–parasite co-adaptation—from antecedent subsystem advances to host releases with shrinking lags, evidencing the transition toward tighter mutualism and symbiotic interaction. Hence, this study integrates Generalized Darwinism with chronos/kairos narrative coding and econometric hedonic analysis, creating a replicable template for unpacking micro→macro causality in evolution of complex technological systems.

5. Discussion

5.1. Explanation of Results with Reference to the Previous Literature

This conceptual framework and empirical investigation reveals a dynamic interplay between host technologies and their embedded subsystems directed to technological coevolution between subsystems and main host systems [2,15,16]. The evolution of the iPhone, under study here, is a main case study, illustrating how incremental advancements in subsystems—such as Bluetooth, camera resolution, display quality, and battery life—collectively drive and shape the evolutionary trajectory of the overarching technology. The temporal alignment between successive Bluetooth versions and iPhone models suggests a pattern of accelerating integration and coevolution, where subsystem innovations increasingly precede and enable evolution of the host technology. The results in Table 1 show a decreasing lag between subsystem development and host adoption, highlighting a shift toward tighter coevolutionary coupling and symbiotic interaction, driven by learning processes for an accelerated pathway of evolution [25]. In this context, the strong statistical associations observed in Table 3 between subsystem improvements and iPhone model progression underscore the significance of micro-level changes. For instance, enhancements in camera resolution, display pixel density, and battery performance exhibit robust correlations with the evolution of iPhone generations (Table 3). These relationships are further substantiated by hedonic pricing models, which demonstrate that attributes like battery life and display resolution are not only key determinants of consumer value but also pivotal drivers of technological innovation in the host system [1,22,24]. In particular, Coccia [22] applies hedonic pricing to identify the technical features most influential in smartphone evolution. The findings here extend this approach by demonstrating that battery life and display resolution are not only significant in pricing but also serve as proxies for technological advancement. Moreover, the explanatory power of these models in Table 5 reinforces the notion that subsystem evolution is central to the functional macroevolution of host technologies [1,15,22,24,74].
This empirical evidence also aligns with Sahal’s [9] theoretical framework, which posits that technological evolution unfolds through a process of equilibrium shaped by internal system dynamics. Sahal’s view of stepwise development, where major innovations emerge from the cumulative effect of minor ones, finds resonance in the study’s demonstration of how subsystem innovations catalyze macro-level transformation. The increasing integration between Bluetooth and iPhone technologies exemplifies Sahal’s emphasis on systemic cohesion, particularly in the transition from loosely coupled components to symbiotic relationships, and Coccia’s [15,16,51] emphasis on symbiotic interactions between technologies that support coevolutionary processes. Moreover, the analogy of the technological parasitism–symbiosis approach by Coccia and Watts [2], inspired by evolutionary ecology, offers a rich conceptual lens for interpreting these dynamics. Drawing from the work by Poulin [75], the evolution of Bluetooth from a parasitic to a symbiotic subsystem mirrors biological coevolution, where the fitness of the parasite becomes intertwined with the host’s success [15]. This framework is further supported by Coccia and Watts [2], who argue that host technologies embedded with numerous parasitic subsystems tend to evolve more rapidly. This study exemplifies this principle, showing how the proliferation and refinement of subsystems accelerate the pace of host innovation [12,15,16].
The concept of System Generation Engineering, as articulated by Pfaff et al. [76], provides additional context for understanding innovation within the iPhone lineage. Their work suggests that successful innovation often arises from strategic variation rather than radical redesign. This study complements this view by showing that subsystem evolution enables such strategic variation, reinforcing the idea that innovation is cumulative and context-sensitive. The study here also draws a parallel with recent discussions in evolutionary biology, particularly the “paradox of predictability” explored by Tsuboi et al. [77]. This paradox highlights how microevolutionary variation can forecast macroevolutionary divergence. The technological analogy demonstrates that standing variation in subsystems—such as successive Bluetooth versions—can indeed predict broader evolutionary outcomes in host technologies like the iPhone. Taken together, this study offers an extension of evolutionary theory by integrating concepts of a technological parasitism–symbiosis approach into a systemic model of innovation [15,16,51]. In fact, the conceptualization of Bluetooth as a parasitic technology embedded within host systems, such as smartphones, smartwatches, and speakers, is well-grounded in the theory of the technological parasitism–symbiosis approach developed by Coccia and Watts [2]. This framework posits that parasitic technologies, while initially dependent on host systems, can evolve toward mutualistic or symbiotic relationships, ultimately accelerating the evolution of the host technology [15,16,51]. The empirical timeline in Table 1—from Bluetooth 2.0 supporting iPhone 1.0 to Bluetooth 6.0 integrated into iPhone 17—illustrates this evolutionary process, where subsystem innovation precedes and enables host system macroevolution. In addition, the identification here from case study research of a shrinking time lag between subsystem innovation and host system adoption is consistent with models of technological evolution that incorporate time-delay dynamics. Georgalis and Aifantis [78] explore how time delays—akin to biological maturation periods—affect the stability and growth of emerging technologies. Their adaptation of logistic growth models with delay parameters provides a mathematical foundation for the empirical observation that as subsystem technologies mature faster and are adopted more rapidly, the host systems evolve more efficiently and predictably. This concept is further supported by integrated approaches to mapping technology evolution paths, which highlight the importance of synchronizing scientific and technological developments to forecast innovation trends. The convergence of subsystem and host evolution is seen as a key factor in identifying future opportunities and guiding strategic innovation and R&D strategies, suggesting that identifying subsystems with high evolutionary potential can inform investment and design decisions [79,80,81,82].

5.2. Theoretical Novelty of the Current Theoretical Framework

This study advances a general, testable principle of technological evolution: microevolutionary change in embedded subsystems precedes and drives macroevolution in host systems. Framed within Generalized Darwinism, it formalizes coevolution as a two-level process in which variation, selection, and retention first operate on subsystems (e.g., connectivity, energy, display); the accumulated advances in these subsystems then predict and enable system-level transitions. Two distinctive contributions follow. First, acceleration: the integration lag between frontier subsystem advances and host upgrades shrinks over time, evidencing tighter coupling in technological ecosystems and a more and more symbiotic coevolution [15,16]. Second, as a consequence, a trajectory of symbiotic evolution: subsystems have a transition that begins as “parasitic” complements become mutualistic and finally symbiotic as interfaces stabilize, providing a concrete mechanism that links micro-level improvements to macro-level transformations of host technology [2,51].
These contributions generalize within—and extend—research on innovation ecosystems. Prior work shows that in interdependent ecosystems coevolve to shape both the direction and speed of progress; our results specify that the leading indicator within this process is the measurable evolution of key subsystems [83,84]. Moreover, classic studies of large technological systems similarly emphasize how technical and social components—firms, institutions, standards, infrastructure, regulation—coevolve to produce system-level outcomes; our mechanism identifies subsystem trajectories and interfaces as the proximate levers through which those heterogeneous components translate into host-level change. Within this systemic view à la Sahal [9], our focus on micro-level subsystem evolution is also consistent with modularity theory [25], in which design rules and partitioned architectures allow subsystems to innovate semi-independently while still shaping overall system performance and value for industrial innovation [85,86,87,88,89]. Empirically, the patterns this study documents—strong co-movement between iPhone evolution and advances in subsystems of camera resolution, display quality, and battery life—accord with the broader literature showing that component interaction topologies structure search dynamics and improvement paths in complex systems [90]. Moreover, software and product-architecture work demonstrates that changes in modular boundaries and design structure matrices propagate to system-level properties, creating measurable differences in evolvability; this aligns with our result that interface/subsystem evolution scales up to host transitions [91,92]. In digital settings, layered modular architectures (devices–networks–services–content) intensify these effects by enabling complementary innovation across layers, amplifying the impact of improvements in individual components [70,71]. Consistent with ecosystem theory, subsystem innovation is most predictive when complementarities are non-generic and when platform/ecosystem structures orchestrate alignment across roles—conditions under which micro-level advances (e.g., in data transfer, energy efficiency, connectivity) expand the feasible design space and can precipitate macro-level moves [83,84]. Leader Firms, in turn, purposefully design interfaces and governance to harvest these micro advances and convert them into system value [93]. Our framework also clarifies the double-edged nature of modularity: modular systems can accelerate incremental—and sometimes radical—component innovation, while simultaneously making performance gains easier to imitate; sustained advantage in fast-moving markets therefore hinges on evolving interfaces and selective re-integration of bottlenecks [89,94]. The accelerating coevolution we observe—specifically, the decreasing lag from ≈3 years to ≈1 year between subsystem advances (e.g., Bluetooth generations) and host integration—fits evidence that product families and production/assembly systems are codesigned across generations, which compresses response times and speeds absorption of upstream innovations [25]. Ecosystem scholarship similarly predicts tighter temporal coupling as interfaces stabilize and integration routines mature, enabling faster diffusion of component advances to downstream system integrators [95]. Over longer horizons, socio-technical transition research explains how such micro-to-macro linkages cumulate into system transitions, as niche innovations (often subsystems) align with regime structures and landscape pressures to reconfigure entire systems—precisely the macro-pattern our micro-indicator anticipates [85,86,87,88,96]. Crucially, architectural choices determine how effectively hosts capitalize on subsystem improvements: the placement of boundaries and interfaces, and the balance between modularity and integrality, mediate translation from micro to macro. While modularity enables parallel search and substitution, credible cases show that re-integrating bottleneck components can unlock performance and reshape industry structure, reaffirming that which subsystems lead and how they are governed is strategic for competitive advantage of firms [87,90,91]. In this sense, systems-integration capabilities act as strategic assets that mediate subsystem contributions into coherent system advances [95,96,97]. This approach, underpinned by the parasitic–symbiotic theory of technological evolution by Coccia and Watts [2], shows a main generalization that systems thinking portrays technology–society evolution as a symbionomic process in which organizations and artifacts co-adapt through increasingly dense networks [71,98,99].
Taken together, these studies justify a broader claim: where architectures are modular (or selectively integral), complementarities are orchestrated through platforms/ecosystems, and organizations possess robust systems-integration routines, microevolution in subsystems reliably conditions macroevolution in host systems—while time-to-integration shrinks as interfaces stabilize and network routines mature [This study; 83-84]. This pattern is not idiosyncratic to the iPhone; it is a widely observed property of complex, multi-component technologies embedded in dynamic innovation ecosystems and socio-technical systems, suggesting a main generalization of findings in different complex systems of technologies [87,96,97].
The parasitic → mutualistic → symbiotic trajectory offers an explicitly temporal and relational lens that maps directly onto core management constructs—architectures, interfaces, governance, and ecosystem alignment—while adding explanatory leverage that standard modularity theory does not provide. In the biological framing, early “parasites” depend on the host yet reshape its metabolism; as interfaces stabilize, they become mutualistic and, ultimately, symbiotic co-specialists. Translated to innovation management, embedded subsystems begin as complementary modules that tax budgets and increase coordination costs; as design rules, standards, and routines mature, they become high-leverage complements, rewiring value creation and pacing system evolution [2,6,9,15,16]. Moreover, the parasitic–symbiotic approach predicts lead–lag dynamics—subsystems move first, hosts follow—grounding a measurable mechanism of temporal precedence (e.g., shrinking integration lags) that modularity theory typically leaves implicit [15,16,83,84]. Some main aspects can be highlighted:
  • Phase transitions as governance cues. Parasitism → mutualism → symbiosis maps to interface hardening, boundary placement, and platform governance choices, supporting when firms should redesign boundaries or internalize bottlenecks [87,88,95].
  • Energetic/bottleneck logic. Biological metabolism foregrounds resource constraints (energy, throughput). In management terms, power/thermal budgets, spectrum, and latency become pacemakers (e.g., battery, connectivity) whose improvements pace host upgrades—an emphasis underrepresented in modularity’s static partitioning [22,90].
  • Co-adaptation across levels. Symbiosis highlights reciprocal adaptation, making subsystem trajectories the proximate levers that translate heterogeneous pressures into host change [71,96,97].
  • Integration with established constructs. In ecosystems, leaders that detect a shift toward mutualism redesign interfaces and governance to harvest subsystem advances [83,84]. In modularity, changes in the design structure matrix and shifts in system boundaries explain the observed jumps in a system’s capacity to evolve [91,92]. In industry dynamics, accelerating coevolution (shrinking lags) reconciles substitution and complementarity by showing when complements become system-defining [85,86,89].
The analogy here clarifies the double-edged nature of modularity: it speeds component innovation yet invites imitation, so firms regain advantage by re-integrating bottlenecks once subsystems tip into symbiosis [89,94]. In short, the parasitic–symbiotic analogy does not merely coexist with modularity and ecosystem theories; it operationalizes time, phase change, and resource coupling, yielding testable leading indicators and design rules for converting micro-advances into system-level evolution [16,25,42]. Hence, this study bridges the gap between biological analogies and management theory by framing technological change through the lens of Generalized Darwinism. While standard modularity theory [87,88] explains how partitioned architectures allow for parallel innovation, it often views components as static, inter-changeable modules. In contrast, the biological analogy of parasitic–symbiotic phases offers here unique explanatory leverage by capturing the temporal dependency that dictates the speed of systemic change. The transition from parasitism to symbiosis conceptually maps onto the maturation of innovation ecosystems [83,84]. Especially,
  • The Parasitic Phase: Early-stage subsystems (e.g., initial Bluetooth versions) act as “parasites”—they are resource-intensive, exogenous standards that the host must accommodate without immediate systemic benefit. This aligns with the “niche innovations” described in socio-technical transitions [96], which initially disrupt but rely on the host “regime” for survival.
  • The Symbiotic Phase: As interfaces stabilize and integration lags shrink [15], the relationship becomes mutualistic. Here, the subsystem becomes a primary pacemaker. The biological analogy provides a mechanism for temporal precedence that modularity lacks: it explains why certain bottlenecks (like battery life) exert a “selective pressure” that reconfigures the entire host architecture [89].
Standard modularity theory focuses on the structure of design rules [86]. However, the parasitic–symbiotic theory [2] explains the momentum of the system. By treating subsystems as living organisms within a host, we can model the accelerating coevolution where the integration lag drops from three years to one. This “symbionomic” process [98] demonstrates that subsystems are leading indicators, not just interchangeable parts. Unlike modularity, which suggests components can innovate independently, this analogy highlights that the host’s macroevolution is fundamentally bound to the subsystem’s microevolution. It transforms qualitative ecosystem claims into a testable, lag-structured causality, providing a robust blueprint for forecasting technological generations [95].
In general, the study advances a coherent theory of technological macroevolution by bridging the gap between component-level “mutations” and system-wide transitions [15,16]. The study’s primary contribution lies in quantifying the micro–macro link: the temporal precedence of subsystem microevolution over host macroevolution. While the existing literature [6,9] acknowledges hierarchical structures, this research provides empirical proof of shrinking adoption lags between subsystem advances and host technological improvements—reducing from three years to one year (such as in the case study of Bluetooth). This result suggests that as technological systems mature, the coupling between host and parasite becomes tighter and more efficient, directed to symbiotic interaction [2,16,51]. A critical finding is that economic value is not evenly distributed across technical advancements. While camera resolution exhibits the highest exponential growth (about 16.7%), hedonic models reveal that battery life and display density are the true drivers of pricing power and version cadence. This reframes the “feature race” narrative: headline-grabbing specs (megapixels) may suffer from diminishing marginal utility, whereas fundamental subsystems (energy/clarity) act as the primary engines of market macroevolution. Unlike competitive substitution models [14,16], which focus on external replacement, this framework prioritizes internal dynamics of technological systems. However, several boundary conditions must be noted, such as standardized “video playback hours”, which are proxies subject to software optimization and user-variable conditions. Moreover, the observed “acceleration” may be driven by supply chain vertical integration rather than purely Darwinian selection. Hence, the study validates that evolutionary drives in subsystems are the requisite precursors to macroevolutionary shifts of host technologies. By treating subsystems as leading indicators, firms can transition from reactive R&D to predictive strategies directed to competitive advantage [11,16,69]. The main argument rests on a transition from parasitism, mutualism to symbiosis: subsystems do not merely “feed” off the host; they dictate its survival trajectory in a competitive socioeconomic landscape [16].

6. Conclusions and Prospects

This study addresses a central challenge in technology research: understanding how technologies evolve within rapidly changing innovation ecosystems and socioeconomic systems [12]. By adopting a systemic perspective, it proposes that the technological macroevolution of host systems is driven by the microevolution of embedded subsystems, also generating disruptive technologies [15,69]. Using the iPhone and Bluetooth technologies as a case study, the research demonstrates how successive Bluetooth versions have consistently preceded and enabled macroevolution and advances in the performance of iPhone models. The decreasing time lag between subsystem innovation and host system integration—from three to one year—indicates an accelerating coevolutionary process with symbiotic pathways [2]. Statistical analyses reveal strong correlations between iPhone evolution and improvements in subsystems, such as camera resolution, display quality, and battery life. Regression and hedonic pricing models confirm that these subsystems significantly influence both technological capabilities and market value. The findings suggest that subsystem innovations are not merely supportive but are central drivers of host technology macroevolution. This conceptual framework extends existing theories of technological change by highlighting the evolutionary interdependence between subsystems and host systems [1,4,6,9,15]. It also introduces new insights into how learning processes and subsystem enhancements shape the trajectory of complex and radical technologies [11]. Overall, the study argues that macroevolution in technological systems is fundamentally dependent on the progressive microevolution of their interrelated and embedded subsystems, in line with some theoretical perspective [51].
The main lessons learned from the study are:
Subsystem innovation drives systemic evolution in technologies: The evolution of embedded technologies like Bluetooth plays a foundational role in shaping the trajectory of host systems such as the iPhone. Micro-level advancements in data transfer, energy efficiency, and connectivity consistently precede and enable macro-level innovation in host technology.
Technological coevolution accelerates over time: The decreasing time lag between subsystem development and host system integration—from three years to one—reveals a pattern of accelerating coevolution and a symbiotic pattern [15]. This suggests that technological ecosystems are becoming more tightly coupled and responsive to subsystem changes.
Subsystems influence market and functional value: Improvements in subsystems, such as camera resolution, display quality, and battery life, are strongly correlated with both the technological capabilities and pricing of host devices. These components are not peripheral but central to innovation and consumer valuation [22,24].
This study’s specific theoretical contribution is to articulate and formally encode a lag-structured micro → macro causality in technological evolution. Within Generalized Darwinism, it models coevolution as a two-level process—variation, selection, and retention operating first on embedded subsystems whose accumulated advances precipitate host–system transitions [100,101]. The core proposition is that system evolution is driven by prior-period subsystem change. Two novel mechanisms underpin this principle. Acceleration: Observed integration lags shrink over time, evidencing tighter coupling and increasing evolutionary throughput in technological ecosystems. Symbiosis trajectory: Subsystems that begin as “parasitic” shift toward mutualistic complements as interfaces stabilize, making the micro → macro linkage mechanistic rather than purely analogical. Methodologically, the theory integrates chronos/kairos [102] narrative timing with econometric identification, transforming qualitative coevolution claims into testable, portable predictions across domains. By treating subsystem variation as a leading indicator and encoding feedback loops from the host back to subsystems, the contribution resolves the substitution-versus-complementarity debate in favor of measured coevolution, establishing a generalizable blueprint for explaining—and forecasting—the emergence of new technological generations. The study reinforces the idea that technological macroevolution is not solely the result of radical innovations in host systems but is significantly shaped by the cumulative microevolution of embedded subsystems. This challenges linear models of innovation and supports a systemic, layered view of technological change [9]. Moreover, underlying technological evolution, there is a main mechanism of a technological parasitism–symbiosis approach [2]. By conceptualizing technologies like Bluetooth as parasitic subsystems that evolve toward symbiosis, the study extends evolutionary theory in technology [15]. It introduces a framework where subsystem–host relationships evolve dynamically, influencing innovation speed, integration, and system complexity. In addition, the technology analysis shows some main temporal dynamics in innovation ecosystems: The decreasing time lag between subsystem innovation and host system adoption suggests an acceleration in coevolutionary processes. This implies that innovation ecosystems are becoming more synchronized and that subsystem maturity can serve as a predictive indicator of host system evolution—offering a new lens for forecasting technological trajectories.

6.1. Management and Innovation Strategy

For strategy and R&D, the framework recasts subsystem roadmaps as leading indicators of technological change in larger systems. Firms should pursue ambidexterity: explore emergent subsystem options (e.g., new standards, component releases) while exploiting current architectures via modular upgrades [87,89,93]. Practically, this means building early access to suppliers and standards bodies, prioritizing high-impact subsystems (energy efficiency, display quality, connectivity), and aligning platform interfaces to reduce integration time. Portfolio and pricing decisions can be informed by subsystem performance elasticities, while roadmaps should synchronize release cadence with expected subsystem availability to shorten cycles [103]. Moreover, continuous tracking of subsystem trajectories enables scenario planning (acceleration vs. saturation), sharper resource allocation, and targeted ecosystem partnerships—improving the odds of timely, adaptive technological evolution in fast-moving markets. In short, the best practices for strategic management of innovation development based on the study’s results can be to adopt ambidextrous innovation strategies: a balanced exploration of emerging subsystems with exploitation of existing components in host technologies. This dual approach allows firms to remain agile, leveraging incremental innovations to enhance current products while preparing for disruptive shifts in the technological landscape. Actionable insights can be predictive road mapping: managers should treat technical standards (e.g., Bluetooth SIG updates) as exogenous leading indicators to “nowcast” the next host system generation. Instead, the strategic investment perspective should focus R&D on “high-elasticity” subsystems—battery efficiency and display clarity—which demonstrate higher market valuation than “headline” specs. Moreover, architectural agility should prioritize modular interfaces to further reduce the integration lag, moving toward a state of real-time coevolution.
Overall, then, this study addresses a significant gap in the literature on technological innovation: the lack of a systemic framework explaining how technologies evolve through the interaction of embedded subsystems within host systems. By introducing the proposed theory of evolution in systems driven by subsystem microevolution, this research offers a novel perspective that captures the complexity and interdependence of technological ecosystems [15]. The case study of the iPhone and Bluetooth technologies demonstrates how subsystem advancements precede and enable host system evolution, with decreasing time lags indicating accelerated coevolution directed to symbiotic interaction. These findings are important because they provide empirical evidence for a layered model of technological change, where subsystem innovation acts as a predictive and driving force in families of technologies [25]. This new perspective has implications for forecasting innovation, guiding R&D investment, and refining theories of technological evolution [2,12]. The study also highlights the role of learning processes and integration dynamics in shaping technological evolution, offering a more vital understanding of how technologies adapt and evolve in fast-changing markets.

6.2. Limitations

These conclusions are tentative, offering interesting yet preliminary evidence in a complex domain. First, the study is anchored in a single case (iPhone–Bluetooth), which may constrain external validity across other technological systems with different architectures, market logics, and regulatory contexts. Second, the analysis relies largely on quantitative indicators (resolution, battery hours, pricing), potentially under-representing qualitative drivers such as user experience, industrial design, and ecosystem compatibility that frequently mediate adoption and perceived value. Third, subsystem–host coevolution is inferred from temporal precedence and shrinking lags; however, endogeneity (mutual feedback between attributes and prices) and omitted variables (RAM, materials, software features, etc.) may bias estimates. Fourth, narrative coding of chronos/kairos inflection points involves interpretive judgment that can introduce coder bias; results may be sensitive to alternative codings of release timing or feature salience. Fifth, structural breaks (e.g., architectural overhauls, supply chain shocks, regulatory changes) and small-sample constraints can degrade model stability and out-of-sample accuracy. Finally, the iPhone’s integrated ecosystem and platform strategy—bundling hardware, software, and services—may confound subsystem–price relationships relative to more modular or open systems.

6.3. Future Directions

Future research should broaden the scope, technologies, enrich the metrics, and deepen the theory. First, the framework can be applied to diverse host technologies—cloud computing, generative artificial intelligence, medical devices, etc. —to validate and refine the micro → macro principle across different domains and architectures. Moreover, qualitative dimensions (user experience, design integration, ecosystem compatibility) can be integrated alongside technical metrics to capture how subsystem–host relationships differ in open vs. closed innovation environments and examine how organizational strategies—including modular design and platform thinking—mediate coevolution and time-to-integration [25,87,93]. In addition, longitudinal, real-time data (display utilization, etc.) and machine learning models can be pursued to improve predictive capabilities, build early-warning indicators of subsystem inflections, and update elasticities dynamically as evidence accrues. Causal identification can be strengthened using natural experiments (standard ratification timing), instrumental variables (supplier shocks), dynamic panel methods, and Bayesian updating can reduce endogeneity and quantify uncertainty. It could also be useful to formalize lag structures and feedback loops between subsystems and hosts and simulate coevolutionary trajectories under acceleration vs. saturation scenarios, and possible risks of innovation failure [104,105].
Hence, the proposed approach retains strong explanatory power in identifying how specific technological characteristics—particularly those of embedded subsystems—support the macroevolutionary pathways of complex technologies, such as smartphones. This study’s originality lies in its integration of evolutionary theory, subsystem analysis, and empirical modeling to explain how technologies evolve not in isolation but through dynamic interactions within broader systems [51]. As a consequence, this study contributes original insights to the literature by advancing a systemic theory of technological evolution driven by the microevolution of subsystems. This approach supports the adoption of flexible, systemic approaches that account for interdependencies across interrelated technological systems, consistent with the reality that—per Wright [106]—risks and limited rational choices govern strategic decisions. Advancing these directions will enhance the framework’s forecasting and managerial relevance in innovations, guiding R&D investments toward subsystems and interfaces with the highest potential to shape macroevolutionary pathways of path-breaking technologies.
To conclude, this research elucidates the mechanisms of technological macroevolution by analyzing the interplay between the iPhone (host) and its embedded subsystems (Bluetooth, camera, display, battery) from 2007 to 2025. To address the research questions, stated in the introduction, the study identifies two primary dynamics: (a) Subsystem influence on technological trajectory in the host: Embedded subsystems act as “microevolutionary engines.” The host’s macro-trajectory is a function of prior subsystem advances. This “parasitic-to-symbiotic” transition means the host’s survival depends on the micro-level maturity of its components. (b) Temporal and statistical patterns: Accelerated coupling based on the integration lag between subsystem release and host adoption has shrunk from 3 years to 1 year, signaling a maturation of the ecosystem’s coevolutionary throughput and symbiotic interactions [1,15]. The final take-home message is that technological macroevolution is not a series of radical host-level leaps but a structured outcome of cumulative micro-variations in subsystems. The key to innovation leadership lies in mastering the shrinking temporal gap between component maturity and system integration. However, as Wright ([106], p. 1562) aptly notes, “In the world of technological change, bounded rationality is the rule,” underscoring the need for cautious interpretation in settings shaped by incomplete information, turbulent markets and adaptive behavior of new technologies, as in current Artificial Intelligence Era.

Supplementary Materials

The following supporting information can be downloaded at: https://www.mdpi.com/article/10.3390/technologies14030156/s1, Method to convert from Nominal iPhone prices 2007–2025 to 2025 USD using the CPI with Table S1: iPhone Standard Model—Nominal and 2025 USD. Sources of the method to convert from nominal are U.S. Bureau of Labor statistics [107,108].

Funding

This research received no external funding.

Institutional Review Board Statement

Not applicable.

Informed Consent Statement

Not applicable.

Data Availability Statement

The raw data supporting the conclusions of this article will be made available by the authors on request. See also Supplementary Materials.

Conflicts of Interest

The authors declare no conflicts of interest.

References

  1. Coccia, M. Classification of innovation considering technological interaction. J. Econ. Bibliogr. 2018, 5, 76–93. Available online: https://journals.econsciences.com/index.php/JEB/article/view/1650 (accessed on 19 January 2026).
  2. Coccia, M.; Watts, J. A theory of the evolution of technology: Technological parasitism and the implications for innovation management. J. Eng. Technol. Manag. 2020, 55, 101552. [Google Scholar] [CrossRef] [Scilit]
  3. Utterback, J.M.; Pistorius, C.; Erdem, Y. The Dynamics of Competition and of the Diffusion of Innovations; MIT Sloan School Working Paper; MIT Libraries: Cambridge, MA, USA, 2019; p. 5519. Available online: http://hdl.handle.net/1721.1/117544 (accessed on 22 May 2025).
  4. Basalla, G. The History of Technology; Cambridge University Press: Cambridge, UK, 1988. [Google Scholar]
  5. Porter, M.E. Competitive Strategy; Free Press: New York, NY, USA, 1980. [Google Scholar]
  6. Arthur, B.W. The Nature of Technology. In What It Is and How It Evolves; Allen Lane–Penguin Books: London, UK, 2009. [Google Scholar]
  7. Hosler, D. The Sounds and Colors of Power: The Sacred Metallurgical Technology of Ancient West Mexico; MIT Press: Cambridge, UK, 1994. [Google Scholar]
  8. Magee, C.L. Towards quantification of the role of materials innovation in overall technological development. Complexity 2012, 18, 10–25. [Google Scholar] [CrossRef] [Scilit]
  9. Sahal, D. Patterns of Technological Innovation; Addison-Wesley Publishing Company, Inc.: Reading, MA, USA, 1981. [Google Scholar]
  10. Barton, C.M. Complexity, Social Complexity, and Modeling. J. Archaeol. Method Theory 2014, 21, 306–324. [Google Scholar] [CrossRef] [Scilit]
  11. Coccia, M. Sources of technological innovation: Radical and incremental innovation problem-driven to support competitive advantage of firms. Technol. Anal. Strateg. Manag. 2017, 29, 1048–1061. [Google Scholar] [CrossRef] [Scilit]
  12. Coccia, M. Comparative Theories of the Evolution of Technology. In Global Encyclopedia of Public Administration, Public Policy, and Governance; Farazmand, A., Ed.; Springer: Cham, Switzerland, 2019. [Google Scholar] [CrossRef] [Scilit]
  13. Dosi, G. Sources, Procedures, and Microeconomic Effects of Innovation. J. Econ. Lit. 1988, 26, 1120–1171. Available online: http://www.jstor.org/stable/2726526 (accessed on 19 January 2026).
  14. Fisher, J.C.; Pry, R.H. A Simple Substitution Model of Technological Change. Technol. Forecast. Soc. Change 1971, 3, 75–88. [Google Scholar] [CrossRef] [Scilit]
  15. Coccia, M. A Theory of classification and evolution of technologies within a Generalized Darwinism. Technol. Anal. Strateg. Manag. 2019, 31, 517–531. [Google Scholar] [CrossRef] [Scilit]
  16. Coccia, M. The theory of technological parasitism for the measurement of the evolution of technology and technological forecasting. Technol. Forecast. Soc. Change 2019, 141, 289–304. [Google Scholar] [CrossRef] [Scilit]
  17. McNerney, J.; Farmer, J.D.; Redner, S.; Trancik, J.E. Role of design complexity in technology improvement. Proc. Natl. Acad. Sci. USA 2011, 108, 9008–9013. [Google Scholar] [CrossRef] [Scilit]
  18. Simon, H.A. The architecture of complexity. Proc. Am. Philos. Soc. 1962, 106, 476–482. [Google Scholar]
  19. Pistorius, C.W.I.; Utterback, J.M. Multi-mode interaction among technologies. Res. Policy 1997, 26, 67–84. [Google Scholar] [CrossRef] [Scilit]
  20. Sandén, B.A.; Hillman, K.M. A framework for analysis of multi-mode interaction among technologies with examples from the history of alternative transport fuels in Sweden. Res. Policy 2011, 40, 403–414. [Google Scholar] [CrossRef] [Scilit]
  21. Andriani, P.; Cohen, J. From exaptation to radical niche construction in biological and technological complex systems. Complexity 2013, 18, 7–14. [Google Scholar] [CrossRef] [Scilit]
  22. Coccia, M. Functionality development of product innovation: An empirical analysis of the technological trajectories of smartphone. J. Econ. Lib. 2018, 5, 241–258. Available online: https://ssrn.com/abstract=3275326 (accessed on 19 January 2026).
  23. Watanabe, C.; Moriyama, K.; Shin, J. Functionality development dynamism in a diffusion trajectory: A case of Japan’s mobile phones development. Technol. Forecast. Soc. Change 2009, 76, 737–753. [Google Scholar] [CrossRef] [Scilit]
  24. Kargı, B.; Coccia, M. The Developmental Routes Followed by Smartphone Technology Over Time (2008–2018 Period). Bull. Econ. Theory Anal. 2024, 9, 369–395. Available online: http://dergipark.org.tr/tr/pub/beta/issue/85655 (accessed on 9 January 2026). [CrossRef] [Scilit]
  25. Bryan, A.; Ko, J.; Hu, S.J.; Koren, Y. Co-evolution of product families and assembly systems. CIRP Ann. Manuf. Technol. 2007, 56, 41–44. [Google Scholar] [CrossRef] [Scilit]
  26. Hodgson, G.M. Darwinism in economics: From analogy to ontology. J. Evol. Econ. 2002, 12, 259–281. [Google Scholar] [CrossRef] [Scilit]
  27. Hodgson, G.M.; Knudsen, T. Why we need a generalized Darwinism, and why generalized Darwinism is not enough. J. Econ. Behav. Organ. 2006, 61, 1–19. [Google Scholar] [CrossRef] [Scilit]
  28. Wagner, A.; Rosen, W. Spaces of the possible: Universal Darwinism and the wall between technological and biological innovation. J. R. Soc. Interface 2014, 11, 20131190. [Google Scholar] [CrossRef] [Scilit]
  29. Ziman, J. (Ed.) Technological Innovation as an Evolutionary Process; Cambridge University Press: Cambridge, MA, USA, 2000. [Google Scholar]
  30. Alphey, L.S.; Crisanti, A.; Randazzo, F.F.; Akbari, O.S. Opinion: Standardizing the definition of gene drive. Proc. Natl. Acad. Sci. USA 2020, 117, 30864–30867. [Google Scholar] [CrossRef] [Scilit]
  31. Erwin, D.H.; Krakauer, D.C. Evolution. Insights into innovation. Science 2004, 304, 1117–1119. [Google Scholar] [CrossRef] [Scilit]
  32. Schuster, P. Major Transitions in Evolution and in Technology. Complexity 2016, 21, 7–13. [Google Scholar] [CrossRef] [Scilit]
  33. Solé, R.V.; Valverde, S.; Casals, M.R.; Kauffman, S.A.; Farmer, D.; Eldredge, N. The Evolutionary Ecology of Technological Innovations. Complexity 2013, 18, 25–27. [Google Scholar] [CrossRef] [Scilit]
  34. Valverde, S.; Solé, R.V.; Bedau, M.A.; Packard, N. Topology and evolution of technology innovation networks. Phys. Rev. E Stat. Nonlinear Soft Matter Phys. 2007, 76, 056118. [Google Scholar] [CrossRef] [Scilit]
  35. Immonen, R.; Hämäläinen, T. Tiny Machine Learning for Resource-Constrained Microcontrollers. J. Sens. 2022, 2022, 7437023. [Google Scholar] [CrossRef] [Scilit]
  36. Conrad, C.; Al-Rubaye, S.; Tsourdos, A. Intelligent embedded systems platform for vehicular cyber-physical systems. Electronics 2023, 12, 2908. [Google Scholar] [CrossRef] [Scilit]
  37. Sharma, M. Optimizing Embedded Systems: Harnessing the Power of Linux in Resource-Constrained Environments. In Proceedings of the 2024 1st International Conference on Cognitive, Green and Ubiquitous Computing (IC-CGU), Bhubaneswar, India, 1–2 March 2024; pp. 1–7. [Google Scholar]
  38. Yalli, J.S.; Hasan, M.H.; Badawi, A.A. Internet of Things (IoT): Origins, embedded technologies, smart applications, and its growth in the last decade. IEEE Access 2024, 12, 91357–91382. [Google Scholar] [CrossRef] [Scilit]
  39. Coccia, M.; Roshani, S.; Mosleh, M. Evolution of Sensor Research for Clarifying the Dynamics and Properties of Future Directions. Sensors 2022, 22, 9419. [Google Scholar] [CrossRef] [Scilit]
  40. Coccia, M.; Roshani, S.; Mosleh, M. Scientific developments and new technological trajectories in sensor research. Sensors 2021, 21, 7803. [Google Scholar] [CrossRef] [Scilit]
  41. Gaiardelli, P.; Pezzotta, G.; Rondini, A.; Romero, D.; Jarrahi, F.; Bertoni, M.; Wiesner, S.; Wuest, T.; Larsson, T.; Zaki, M.; et al. Product-service systems evolution in the era of Industry 4.0. Serv. Bus. 2021, 15, 177–207. [Google Scholar] [CrossRef] [Scilit]
  42. Yoon, J.; Pant, G.; Pant, S. Discovery of technological innovation systems: Implications for predicting future innovation. J. Manag. Inf. Syst. 2024, 41, 39–72. [Google Scholar] [CrossRef] [Scilit]
  43. Coccia, M.; Roshani, S. Evolutionary Phases in Emerging Technologies: Theoretical and Managerial Implications from Quantum Technologies. IEEE Trans. Eng. Manag. 2024, 71, 8323–8338. [Google Scholar] [CrossRef] [Scilit]
  44. Coccia, M.; Roshani, S. Path-Breaking Directions in Quantum Computing Technology: A Patent Analysis with Multiple Techniques. J. Knowl. Econ. 2024, 16, 4991–5024. [Google Scholar] [CrossRef] [Scilit]
  45. Amiri, S. The Theory of Enabling Technologies for New Innovations in High-Tech Industries. Ph.D. Thesis, Northeastern University, Boston, MA, USA, 2023. [Google Scholar]
  46. Bazizi, E.M.; Pal, A.; Kim, J.; Jiang, L.; Reddy, V.; Alexander, B.; Ayyagari-Sangamalli, B. Materials to systems co-optimization platform for rapid technology development targeting future generation CMOS nodes. IEEE Trans. Electron Devices 2021, 68, 5358–5363. [Google Scholar] [CrossRef] [Scilit]
  47. Zhang, K. 1.1 semiconductor industry: Present & future. In Proceedings of the 2024 IEEE International Solid-State Circuits Conference (ISSCC), San Francisco, CA, USA, 18–22 February 2024; Volume 67, pp. 10–15. [Google Scholar]
  48. Bitri, A. Identification of Macroeconomic Level Factors for the Electronic Design Automation Industry. Int. J. Bus. Technol. 2021, 9, 1–12. [Google Scholar]
  49. Girish, B.S.; Reddy, S.H.; Sethi, S.; Srivani, K.S.; Abhishek, R.; Ajithkumar, B.; Bhattramakki, S.; Buch, K.; Chaudhuri, S.; Gupta, Y.; et al. Progression of digital-receiver architecture: From MWA to SKA1-Low, and beyond. J. Astrophys. Astron. 2023, 44, 28. [Google Scholar] [CrossRef] [Scilit]
  50. Zhang, B.; Yin, X.; Xiong, J.; Yuan, Z. The Evolution of Complex Global Innovation Collaboration Network: A Multilevel Analysis of a CoPS Industry 2001–2020. IEEE Trans. Eng. Manag. 2025, 72, 10916686. [Google Scholar] [CrossRef] [Scilit]
  51. Coccia, M. Theorem of not independence of any technological innovation. J. Econ. Bibliogr. 2018, 5, 29–35. Available online: https://journals.econsciences.com/index.php/JEB/article/view/1578 (accessed on 19 January 2026).
  52. Garud, R.; Dunbar, R.L.M.; Bartel, C.A. Dealing with Unusual Experiences: A Narrative Perspective on Organizational Learning. Organ. Sci. 2010, 22, 587–601. [Google Scholar] [CrossRef] [Scilit]
  53. Bluetooth. Bluetooth Technology. 2025. Available online: https://www.bluetooth.com/ (accessed on 8 December 2025).
  54. Intel. What Is Bluetooth® Technology? 2025. Available online: https://www.intel.com/content/www/us/en/products/docs/wireless/what-is-bluetooth.html (accessed on 9 December 2025).
  55. Verizon. A Timeline: Notable Milestones in the History of iPhone from Apple. 2025. Available online: https://www.verizon.com/articles/Smartphones/milestones-in-history-of-apple-iphone/ (accessed on 9 December 2025).
  56. Apple. iPhone. 2025. Available online: https://www.apple.com/iphone/ (accessed on 7 June 2025).
  57. Apple. New generations of iPhone. 2025. Available online: https://www.apple.com/it/?afid=p240%7Cgo~cmp-213292967~adg-13999330967~ad-733796428214_kwd-49065841~dev-c~ext-~prd-~mca-~nt-search&cid=aos-it-kwgo-brand-- (accessed on 13 June 2025).
  58. Levesque, M. TECHBROWSER. The Evolution of iPhone Bluetooth Technology: A Timeline. 2023. Available online: https://techbrowser.co/apple/iphone/evolution-iphone-bluetooth-timeline/#the-expanding-iphone-bluetooth-ecosystem (accessed on 5 July 2025).
  59. CNET. Apple Event-Tech-Mobile. iPhone Prices (Patrick Holland). 2025. Available online: https://www.cnet.com/tech/mobile/i-studied-iphone-prices-going-back-to-2007-tariff-or-not-were-due-for-a-price-hike/ (accessed on 7 December 2025).
  60. MOKOSmart. A Comprehensive Guide on Different Bluetooth Versions. 2024. Available online: https://www.mokosmart.com/guide-on-different-bluetooth-versions/ (accessed on 9 December 2025).
  61. SANDMARC2025. How Has the iPhone Camera Evolved? 2025. Available online: https://www.sandmarc.com/blogs/articles/how-has-the-iphone-camera-evolved?srsltid=AfmBOorw3Qv2Is5OAYBYokjkhTbRpBkb53dFE7_ubioFQnvRhqaeFW2y (accessed on 9 December 2025).
  62. UGREEN. The Evolution of the iPhone Battery and Charging Tech. 2021. Available online: https://www.ugreen.com/ (accessed on 13 June 2025).
  63. Ansari, S.S.; Garud, R.; Kumaraswamy, A. The disruptor’s dilemma: TiVo and the U.S. Television ecosystem. Strateg. Manag. J. 2016, 37, 1829–1853. [Google Scholar] [CrossRef] [Scilit]
  64. Kozinets, R.V. The field behind the screen: Using ethnography for marketing research in online communities. J. Mark. Res. 2002, 39, 61–72. [Google Scholar] [CrossRef] [Scilit]
  65. Everyi.com. iPhone Q&A, Does the iPhone Support Bluetooth? Which iPhone Models Support Which Versions of Bluetooth? 2025. Available online: https://everymac.com/systems/apple/iphone/iphone-faq/iphone-bluetooth-support-by-model.html (accessed on 7 December 2025).
  66. Appmysite. The Complete Guide to iPhone Screen Resolutions and Sizes (Updated 2025). 2025. Available online: https://www.appmysite.com/blog/the-complete-guide-to-iphone-screen-resolutions-and-sizes/ (accessed on 7 December 2025).
  67. Saviotti, P. An Approach to the Measurement of Technology Based on the Hedonic Price Method and Related Methods. Technol. Forecast. Soc. Change 1985, 27, 309–334. [Google Scholar] [CrossRef] [Scilit]
  68. Triplett, J.E. Measuring technological change with characteristics-space techniques. Technol. Forecast. Soc. Change 1985, 27, 283–307. [Google Scholar] [CrossRef] [Scilit]
  69. Coccia, M. Asymmetry of the technological cycle of disruptive innovations. Technol. Anal. Strateg. Manag. 2020, 32, 1462–1477. [Google Scholar] [CrossRef] [Scilit]
  70. Yoo, Y.; Henfridsson, O.; Lyytinen, K. The new organizing logic of digital innovation: An agenda for information systems research. Inf. Syst. Res. 2010, 21, 724–735. [Google Scholar] [CrossRef] [Scilit]
  71. Gawer, A.; Cusumano, M.A. Industry platforms and ecosystem innovation. J. Prod. Innov. Manag. 2014, 31, 417–433. [Google Scholar] [CrossRef] [Scilit]
  72. Katz, M.L.; Shapiro, C. Network Externalities, Competition, and Compatibility. Am. Econ. Rev. 1985, 75, 424–440. Available online: http://www.jstor.org/stable/1814809 (accessed on 3 May 2025).
  73. Brynjolfsson, E.; Collis, A.; Diewert, W.E.; Eggers, F.; Fox, K.J. The Digital Economy, GDP and Consumer Welfare: Theory and Evidence. In Proceedings of the ESCoE Conference on Economic Measurement, Bank of England, London, UK, 16–17 May 2018; Available online: https://www.imf.org/-/media/files/conferences/2018/6th-stats-forum/session-4kevin-foxthe-digital-economy-gdp-and-consumer-welfare-theory-and-evidencepaper.pdf (accessed on 6 February 2026).
  74. Kargı, B.; Coccia, M.; Uçkaç, B.C. Determinants generating general purpose technologies in economic systems: A new method of analysis and economic implications. JOIV Int. J. Inform. Vis. 2024, 8, 1791–1801. [Google Scholar] [CrossRef] [Scilit]
  75. Poulin, R. Evolutionary Ecology of Parasites; Princeton University Press: Princeton, NJ, USA, 2006. [Google Scholar]
  76. Pfaff, F.; Götz, G.T.; Rapp, S.; Albers, A. Evolutionary perspective on system generation engineering by the example of the iPhone. In Proceedings of the Design Society ICED23, Bordeaux, France, 24–28 July 2023; Volume 3, pp. 1715–1724. [Google Scholar]
  77. Tsuboi, M.; Sztepanacz, J.; De Lisle, S.; Voje, K.L.; Grabowski, M.; Hopkins, M.J.; Porto, A.; Balk, M.; Pontarp, M.; Rossoni, D.; et al. The paradox of predictability provides a bridge between micro- and macroevolution. J. Evol. Biol. 2024, 37, 1413–1432. [Google Scholar] [CrossRef] [Scilit] [PubMed]
  78. Georgalis, E.E.; Aifantis, E.C. Introducing time delay in the evolution of new technology: The case study of nanotechnology. J. Mech. Behav. Mater. 2013, 22, 203–210. [Google Scholar] [CrossRef] [Scilit]
  79. Coccia, M. Destructive Creation of New Invasive Technologies: Generative Artificial Intelligence Behaviour. Technologies 2025, 13, 261. [Google Scholar] [CrossRef] [Scilit]
  80. Coccia, M.; Mosleh, M.; Roshani, S. Evolution of Quantum Computing: Theoretical and Innovation Management Implications for Emerging Quantum Industry. IEEE Trans. Eng. Manag. 2024, 71, 2270–2280. [Google Scholar] [CrossRef] [Scilit]
  81. Coccia, M.; Roshani, S. Evolution of topics and trends in emerging research fields: Multiple analysis with entity linking, Mann-Kendall test and burst methods in cloud computing. Scientometrics 2024, 129, 5347–5371. [Google Scholar] [CrossRef] [Scilit]
  82. Coccia, M.; Wang, L. Evolution and convergence of the patterns of international scientific collaboration. Proc. Natl. Acad. Sci. USA 2016, 113, 2057–2061. [Google Scholar] [CrossRef] [Scilit]
  83. Adner, R. Ecosystem as structure: An actionable construct for strategy. J. Manag. 2017, 43, 39–58. [Google Scholar] [CrossRef] [Scilit]
  84. Jacobides, M.G.; Cennamo, C.; Gawer, A. Towards a theory of ecosystems. Strateg. Manag. J. 2018, 39, 2255–2276. [Google Scholar] [CrossRef] [Scilit]
  85. Abernathy, W.; Utterback, J. Patterns of Industrial Innovation. Technol. Rev. 1978, 8, 40–47. [Google Scholar]
  86. Abernathy, W.J.; Clark, K.B. Innovation: Mapping the winds of creative destruction. Res. Policy 1985, 14, 3–22. [Google Scholar] [CrossRef] [Scilit]
  87. Baldwin, C.Y.; Clark, K.B. Design Rules: The Power of Modularity; MIT Press: Cambridge, MA, USA, 2000; Volume 1. [Google Scholar] [CrossRef] [Scilit]
  88. Henderson, R.M.; Clark, K.B. Architectural Innovation: The Reconfiguration of Existing Product Technologies and the Failure of Established Firms. Adm. Sci. Q. 1990, 35, 9–30. [Google Scholar] [CrossRef] [Scilit]
  89. Ethiraj, S.K.; Levinthal, D. Modularity and innovation in complex systems. Manag. Sci. 2004, 50, 159–173. [Google Scholar] [CrossRef] [Scilit]
  90. Fleming, L.; Sorenson, O. Technology as a complex adaptive system: Evidence from patent data. Res. Policy 2001, 30, 1019–1039. [Google Scholar] [CrossRef] [Scilit]
  91. MacCormack, A.; Rusnak, J.; Baldwin, C.Y. Exploring the structure of complex software designs: An empirical study of open source and proprietary code. Manag. Sci. 2006, 52, 1015–1030. [Google Scholar] [CrossRef] [Scilit]
  92. Fixson, S.K.; Park, J.K. The power of integrality: Linkages between product architecture, innovation, and industry structure. Res. Policy 2008, 37, 1296–1316. [Google Scholar] [CrossRef] [Scilit]
  93. Chesbrough, H.; Prencipe, A. Networks of innovation and modularity: A dynamic perspective. Int. J. Technol. Manag. 2008, 42, 414–425. [Google Scholar] [CrossRef] [Scilit]
  94. Pil, F.K.; Cohen, S.K. Modularity: Implications for imitation, innovation, and sustained advantage. Acad. Manag. Rev. 2006, 31, 995–1011. [Google Scholar] [CrossRef] [Scilit]
  95. Brusoni, S.; Prencipe, A. Patterns of modularization: The dynamics of product architecture in complex systems. Eur. Manag. Rev. 2011, 8, 67–80. [Google Scholar] [CrossRef] [Scilit]
  96. Geels, F.W. Technological transitions and system innovations: A co-evolutionary and socio-technical analysis. In Technological Transitions and System Innovations; Edward Elgar Publishing: Gloucestershire, UK, 2005. [Google Scholar]
  97. Hughes, T.P. The evolution of large technological systems. Soc. Constr. Technol. Syst. New Dir. Sociol. Hist. Technol. 1987, 82, 51–82. [Google Scholar]
  98. Rosnay, J.D. Symbionomic evolution: From complexity and systems theory, to chaos theory and coevolution. World Futures 2011, 67, 304–315. [Google Scholar] [CrossRef] [Scilit]
  99. Kash, D.E.; Rycroft, R. Emerging patterns of complex technological innovation. Technol. Forecast. Soc. Change 2002, 69, 581–606. [Google Scholar] [CrossRef] [Scilit]
  100. Kauffman, S.; Macready, W. Technological evolution and adaptive organizations: Ideas from biology may find applications in economics. Complexity 1995, 1, 26–43. [Google Scholar] [CrossRef] [Scilit]
  101. Levit, G.; Hossfeld, U.; Witt, U. Can Darwinism be “Generalized” and of what use would this be? J. Evol. Econ. 2011, 21, 545–562. [Google Scholar] [CrossRef] [Scilit]
  102. Ricoeur, P. Time and Narrative; Blamey, K.; Pellauer, D., Translators; University of Chicago Press: Chicago, IL, USA, 1984. [Google Scholar]
  103. Daim, T.U.; Byung-Sun, Y.; Lindenberg, J.; Grizzi, R.; Estep, J.; Oliver, T. Strategic roadmapping of robotics technologies for the power industry: A multicriteria technology assessment. Technol. Forecast. Soc. Change 2018, 131, 49–66. [Google Scholar] [CrossRef] [Scilit]
  104. Coccia, M. New Perspectives in Innovation Failure Analysis: A Taxonomy of General Errors and Strategic Management for Reducing Risks. Technol. Soc. 2023, 75, 102384. [Google Scholar] [CrossRef] [Scilit]
  105. Coccia, M. Theory of Errors in Innovation Failure and Strategic Management of Winning by Failing. Technol. Anal. Strateg. Manag. 2024, 37, 2859–2873. [Google Scholar] [CrossRef] [Scilit]
  106. Wright, G. Towards A More Historical Approach to Technological Change. Econ. J. 1997, 107, 1560–1566. [Google Scholar] [CrossRef]
  107. U.S. Bureau of Labor Statistics. Consumer Price Index US City Average (1982–84 = 100): Northeast Information Office: U.S. Bureau of Labor Statistics. 2025. Available online: https://www.bls.gov/regions/northeast/data/consumerpriceindex_us_table.htm (accessed on 2 February 2026).
  108. U.S. Bureau of Labor Statistics. CPI Inflation Calculator. 2025. Available online: https://www.bls.gov/data/inflation_calculator.htm (accessed on 2 February 2026).
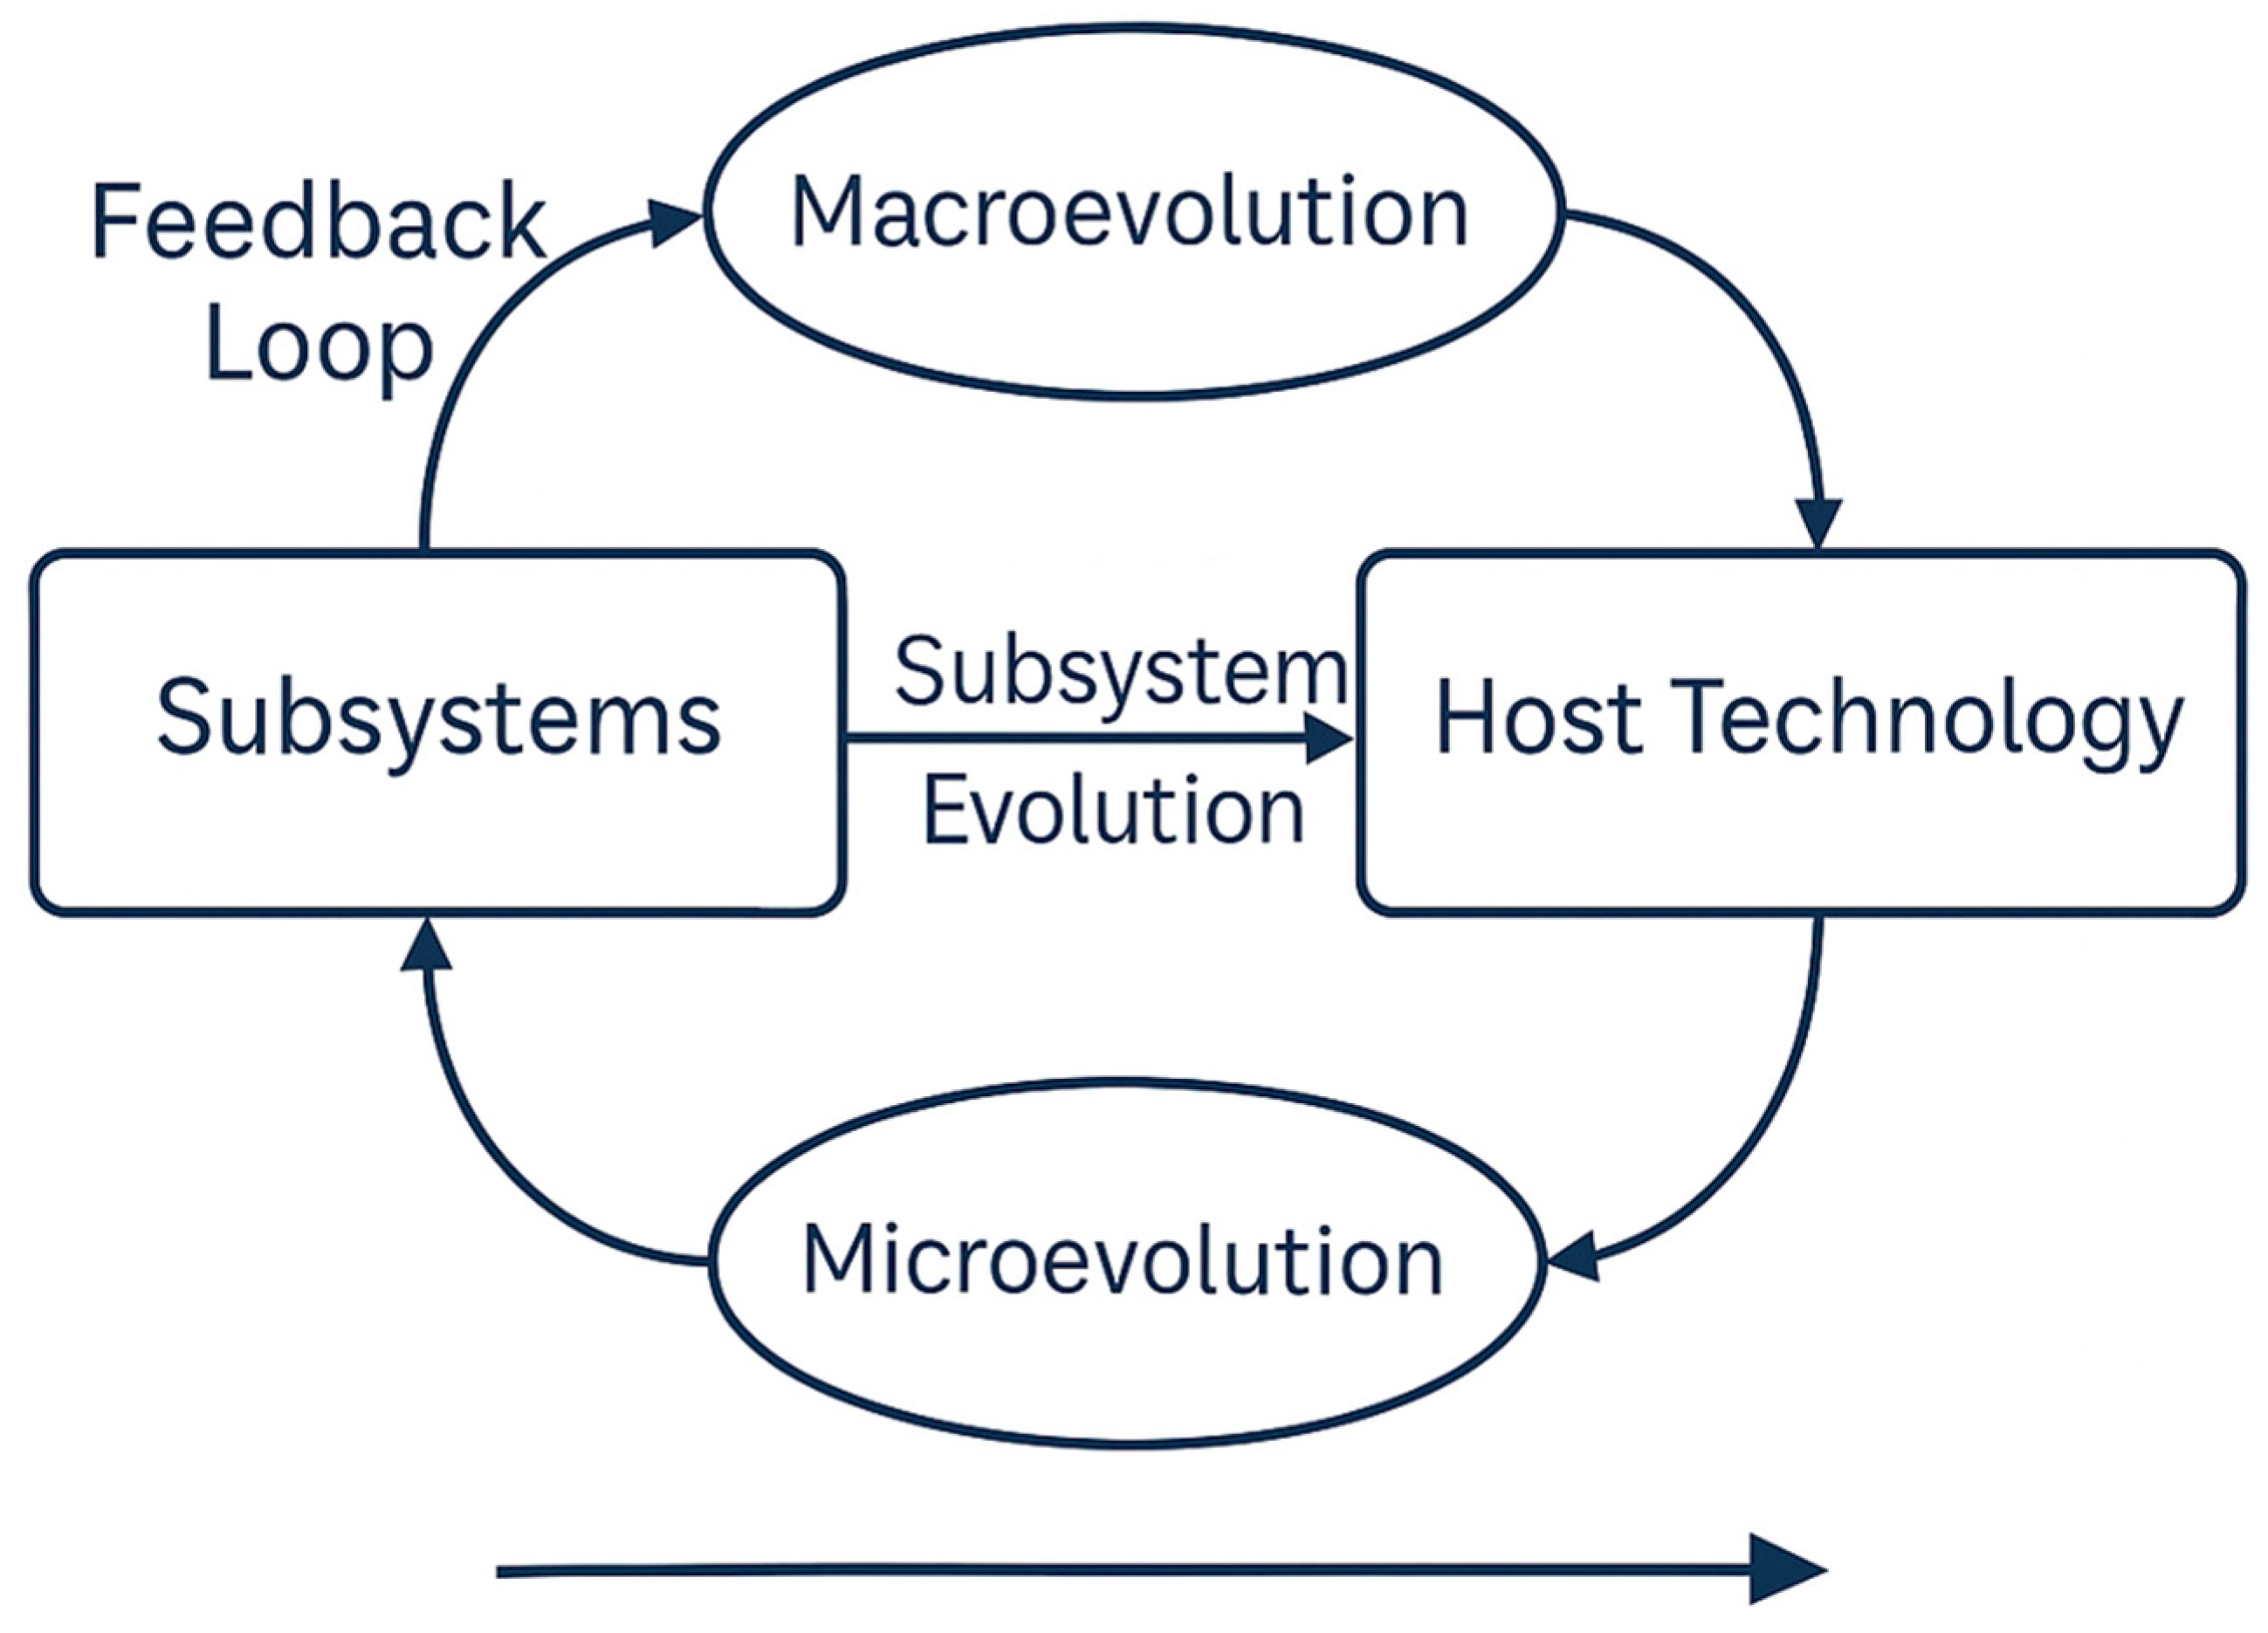
Figure 1. Proposed theoretical model of technological evolution with cyclical interaction representing coevolution and the arrow indicating progression over time in systems.
Technologies 14 00156 g001
Figure 2. Analytical process to analyze technological evolution driven by advances in subsystems.
Technologies 14 00156 g002
Figure 3. Evolutionary dynamics of technical performance of some technological subsystems embedded in the system of iPhone technology for supporting macroevolution (standardized values). Sources: [56,57,61,62,66].
Technologies 14 00156 g003
Table 1. Time lag in years from evolution in the parasitic–symbiotic subsystem of Bluetooth (from the 1st in 1999 to the last version 6 in 2024) to implementation in the host technological system of iPhone for macroevolution.
Years of Bluetooth Technological AdvancesBluetooth Technology (Evolutionary Versions Having Technological Advances)iPhone Technological Model Including New Versions of Bluetooth TechnologyYears of Introduction in iPhoneTime Lag (Years) Between Evolution in Bluetooth and Its Implementation in Host iPhone System for Macroevolution
19991
20042BT 2.0 > iPhone 120073
20094BT 4.0 > iPhone 420112
20165BT 5.0 > iPhone 820171
20215.3BT 5.3 > iPhone 1420221
20246BT 6 > iPhone 1720251
Sources: [53,60,65]. Note: Bluetooth progressed from 1.0–1.2 (core BR/EDR; Adaptive Frequency Hopping) to 2.0 + EDR (3 Mb/s); 3.0 + HS offloaded large transfers to Wi-Fi (802.11) for ~24 Mb/s bursts; 4.0 introduced Bluetooth Low Energy for sensor-class power use; 5.0 expanded range (4×), speed (2×), and broadcast capacity (8×); 5.2 launched LE Audio with the LC3 codec and isochronous channels; and 5.4 added Periodic Advertising with Responses and Encrypted Advertising for massive, low-power star networks. Reports on 6.0 highlight channel sounding (centimeter-level ranging) and latency/efficiency gains, with adoption rolling out.
Table 2. Rate of growth of the evolution of subsystems for macroevolution of the host system (iPhone).
YEARSiPhone Model, BornWide Camera Resolution Mpix, (1)Display Pixel
A
Display
B
Display AxBDisplay ppi, (2)Battery, Hours Video Playback
200712480320153,600163-
200833480320153,60016310
200933480320153,60016310
200933480320153,60016310
201045960640614,40032610
201145960640614,40032610
2012581136640727,04032610
2013581136640727,04032610
20146813347501,000,50032611
20156813347501,000,50032611
2016712192010802,073,60040114
2017812192010802,073,60040114
20181012243611252,740,50045813
20191112243611252,740,50045818
20201212253211702,962,44046017
20211312253211702,962,44045822
20221448255611793,013,52446023
20231548279612903,606,84046026
20241648279612903,606,84046027
20251748286813203,785,76046030
Arithmetic rate of growth84.21121.0525.3915.95118.339.598.95
Exponential rate of growth14.9116.739.417.4616.875.465.78
Note: (1) “Mpix” or “Megapixel” refers to a unit of measurement equal to one million pixels, used to describe the resolution and detail of digital images and camera sensors. (2) In display technology, PPI (Pixels Per Inch) measures the pixel density of a screen, indicating the number of individual pixels packed into each inch of the display. A higher PPI means more pixels, which results in sharper, more detailed, and smoother images and text on the screen. Sources: [56,57,61,62,66].
Table 3. Parametric estimates of the temporal evolution of some subsystems in the host system as a function of time (2007–2025), log-linear model.
Dependent Variable:
Subsystem in iPhone Models
Constant
α
Coefficient
β
Std Coeff. BR2F
Log Wide Camera Resolution Mpix −326.51 ***
(25.19)
0.16 ***
(0.012)
0.950.90
(0.31)
170.38 ***
Log Display ppi−114.95 ***
(16.32)
0.06 ***
(0.008)
0.870.74
(0.20)
54.78 ***
Log Battery, Hours Video Playback−136.77 ***
(11.05)
0.07 ***
(0.005)
0.950.90
(0.13)
159.30 ***
Note: *** p-value < 0.001. Dependent variable = subsystem in iPhone models. Explanatory variable: time; period is from starting year of the iPhone 2007 to 2025 (last year available). In round parentheses, the standard error. The F-test is based on the ratio of the variance explained by the model to the unexplained variance. R2 is the coefficient of determination. Sources: [56,57,61,62,66].
Table 4. Bivariate correlation, log scale, N = 20.
Wide Camera ResolutionDisplay ppiBattery Hours Video Playback
iPhone Models0.92 **0.89 **0.93 **
U$ Price iPhone0.90 **0.79 **0.93 **
Note: ** Correlation is significant at the 0.01 level (1-tailed). Sources: [56,57,61,62,66].
Table 5. Estimated relationship of the macroevolution in the host system (iPhone price in model 1A-1B and iPhone versions in model 2) on embedded subsystems of main components (log–log model).
Model 1AUnstandardized CoefficientsStand. Coeff.tSig.95.0% Confidence Interval for BCollinearity
Statistics
Dependent Variable:
Log Price iPhone US Dollar
BStd.
Error
Beta Lower BoundUpper BoundToleranceVIF
(Constant)5.3880.364 14.7880.0014.6126.165
Log Wide Camera Res. Mpix0.010.0420.060.2350.818−0.080.0990.1178.56
Log Display ppi0.0620.0620.1510.333−0.070.1940.3452.896
Log Battery h Video Playback0.2930.0810.7723.6220.0030.1210.4660.1715.86
F-test37.96 ***
R20.88 (0.06)
Model 1BUnstandardized CoefficientsStand. Coeff.tSig.95.0% Confidence Interval for BCollinearity
Statistics
Dependent Variable:
Log Price iPhone USD-2025
BStd.
Error
Beta Lower BoundUpper BoundToleranceVIF
(Constant)6.1960.309 20.03305.5376.855
Log Wide Camera Res. Mpix−0.0650.036−1.187−1.8180.089−0.1410.0110.1178.56
Log Display ppi0.0750.0530.541.4210.176−0.0370.1870.3452.896
Log Battery h Video Playback0.1250.0690.9821.8170.089−0.0220.2710.1715.86
F-test1.69
R20.25 (0.05)
Model 2Unstandardized CoefficientsStand. Coeff.tSig.95.0% Confidence Interval for BCollinearity
Statistics
Dependent Variable:
Log iPhone Versions
BStd.
Error
Beta Lower BoundUpper BoundToleranceVIF
(Constant)−4.7220.728 −6.4890−6.273−3.171
Log Wide Camera Res. Mpix0.0310.0840.0470.3650.72−0.1480.210.1178.56
Log Display ppi0.7340.1240.4435.93200.470.9970.3452.896
Log Battery h Video Playback0.8780.1620.5775.4300.5331.2230.1715.86
F-test167.86 ***
R20.97 (0.11)
Note: *** = p-value < 0.001. Sources: [56,57,59,61,62,66].
Disclaimer/Publisher’s Note: The statements, opinions and data contained in all publications are solely those of the individual author(s) and contributor(s) and not of MDPI and/or the editor(s). MDPI and/or the editor(s) disclaim responsibility for any injury to people or property resulting from any ideas, methods, instructions or products referred to in the content.