Physiologically Explainable Ensemble Framework for Stress Classification via Respiratory Signals
Abstract
1. Introduction
2. Dataset
3. Materials and Methods
3.1. Respiratory Signal Preprocessing
3.2. Respiratory Signal Feature Extraction
3.2.1. Respiratory Rhythm Feature
3.2.2. Respiratory Depth Feature
3.2.3. Nonlinear Dynamic Feature
3.3. Respiratory Signal Feature Analysis
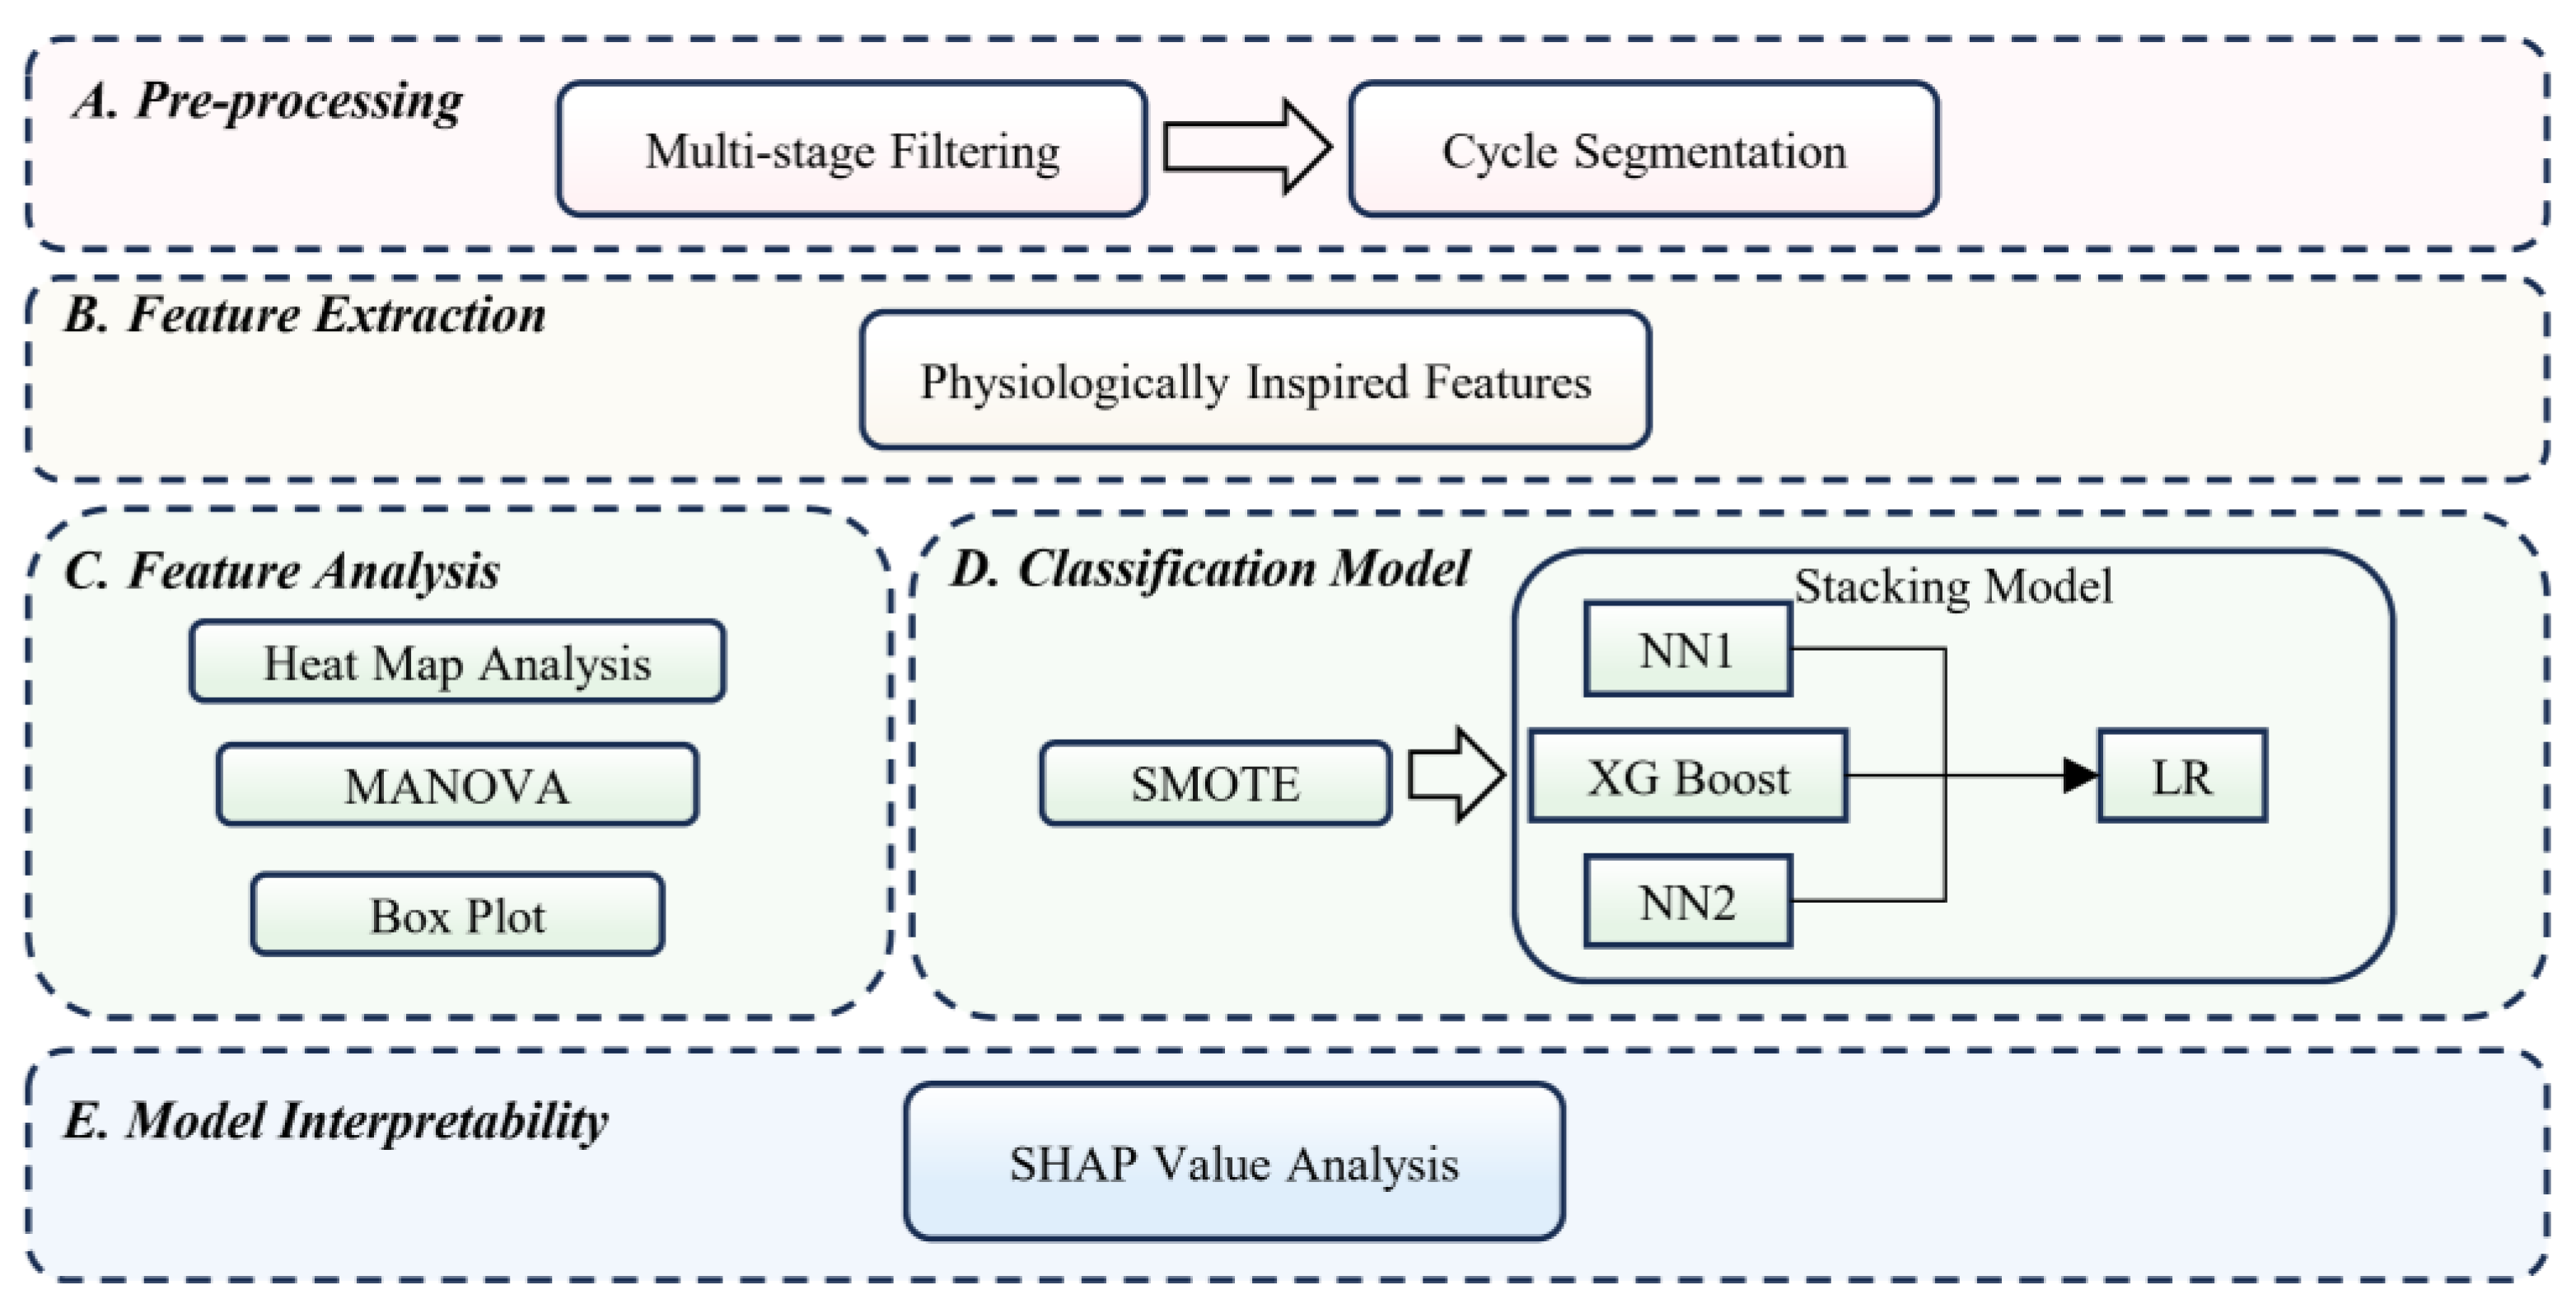
3.4. Stress Classification Model
- A Neural Network 1 with 64, 64 neurons in hidden layers, ReLU activation, Adam solver, regularization (α = 0.0001), and a maximal number of iterations of 50.
- A Neural Network 2 with 32, 64, 128 neurons in hidden layers, ReLU activation, Adam solver, regularization (α = 0.03), and a maximal number of iterations of 50.
- A Gradient Boosting with Extreme Gradient Boosting Random Forest method, 50 trees, learning rate 0.1, regularization lambda 0.001, limit depth of individual trees 10, and replicable training.
3.5. Classification Model Interpretability
4. Results
4.1. Respiratory Signal Feature Analysis Results
4.2. Stress Classification Performance
4.3. SHAP Value Analysis Result
5. Discussion
5.1. Respiratory Feature Analysis
5.2. Model Classification Performance
5.3. SHAP Value Analysis for Feature Mechanism
5.4. Limitations and Future Directions
6. Conclusions
Author Contributions
Funding
Institutional Review Board Statement
Informed Consent Statement
Data Availability Statement
Conflicts of Interest
References
- World Health Organization. Depressive Disorder (Depression). World Health Organization. 2023. Available online: https://www.who.int/news-room/fact-sheets/detail/depression (accessed on 19 February 2025).
- Chan, S.F.; La Greca, A.M. Perceived Stress Scale (PSS). In Encyclopedia of Behavioral Medicine; Gellman, M.D., Ed.; Springer International Publishing: Cham, Switzerland, 2020; pp. 1646–1648. ISBN 978-3-030-39903-0. [Google Scholar]
- Hsu, Y.-L.; Wang, J.-S.; Chiang, W.-C.; Hung, C.-H. Automatic ECG-Based Emotion Recognition in Music Listening. IEEE Trans. Affect. Comput. 2020, 11, 85–99. [Google Scholar] [CrossRef]
- Alberdi, A.; Aztiria, A.; Basarab, A. Towards an Automatic Early Stress Recognition System for Office Environments Based on Multimodal Measurements: A Review. J. Biomed. Inform. 2016, 59, 49–75. [Google Scholar] [CrossRef]
- Pourmohammadi, S.; Maleki, A. Stress Detection Using ECG and EMG Signals: A Comprehensive Study. Comput. Methods Programs Biomed. 2020, 193, 105482. [Google Scholar] [CrossRef]
- Giannakakis, G.; Grigoriadis, D.; Giannakaki, K.; Simantiraki, O.; Roniotis, A.; Tsiknakis, M. Review on Psychological Stress Detection Using Biosignals. IEEE Trans. Affect. Comput. 2022, 13, 440–460. [Google Scholar] [CrossRef]
- Jerath, R.; Crawford, M.W.; Barnes, V.A.; Harden, K. Self-Regulation of Breathing as a Primary Treatment for Anxiety. Appl. Psychophysiol. Biofeedback 2015, 40, 107–115. [Google Scholar] [CrossRef]
- Jhang, J.; Park, S.; Liu, S.; O’Keefe, D.D.; Han, S. A Top-down Slow Breathing Circuit That Alleviates Negative Affect in Mice. Nat. Neurosci. 2024, 27, 2455–2465. [Google Scholar] [CrossRef]
- Zhou, Z.; Jin, Y.; Fu, J.; Si, S.; Liu, M.; Hu, Y.; Gan, J.; Deng, Y.; Li, R.; Yang, J. Smart Wireless Flexible Sensing System for Unconstrained Monitoring of Ballistocardiogram and Respiration. Npj Flex. Electron. 2025, 9, 15. [Google Scholar] [CrossRef]
- Looney, D.; Kidmose, P.; Park, C.; Ungstrup, M.; Rank, M.L.; Rosenkranz, K.; Mandic, D.P. The In-the-Ear Recording Concept: User-Centered and Wearable Brain Monitoring. IEEE Pulse 2012, 3, 32–42. [Google Scholar] [CrossRef]
- Ghosh, S.; Kim, S.; Ijaz, M.F.; Singh, P.K.; Mahmud, M. Classification of Mental Stress from Wearable Physiological Sensors Using Image-Encoding-Based Deep Neural Network. Biosensors 2022, 12, 1153. [Google Scholar] [CrossRef]
- Almadhor, A.; Sampedro, G.A.; Abisado, M.; Abbas, S. Efficient Feature-Selection-Based Stacking Model for Stress Detection Based on Chest Electrodermal Activity. Sensors 2023, 23, 6664. [Google Scholar] [CrossRef]
- Kumar, S.; Raj Chauhan, A.; Akhil; Kumar, A.; Yang, G. Resp-BoostNet: Mental Stress Detection From Biomarkers Measurable by Smartwatches Using Boosting Neural Network Technique. IEEE Access 2024, 12, 149861–149874. [Google Scholar] [CrossRef]
- Machado Fernández, J.R.; Anishchenko, L. Mental Stress Detection Using Bioradar Respiratory Signals. Biomed. Signal Process. Control 2018, 43, 244–249. [Google Scholar] [CrossRef]
- Hameed, R.A.; Sabir, M.K.; Fadhel, M.A.; Al-Shamma, O.; Alzubaidi, L. Human Emotion Classification Based on Respiration Signal. In Proceedings of the International Conference on Information and Communication Technology, Kuala Lumpur, Malaysia, 24–26 July 2019; Association for Computing Machinery: New York, NY, USA, 2019; pp. 239–245. [Google Scholar]
- Shan, Y.; Li, S.; Chen, T. Respiratory Signal and Human Stress: Non-Contact Detection of Stress with a Low-Cost Depth Sensing Camera. Int. J. Mach. Learn. Cybern. 2020, 11, 1825–1837. [Google Scholar] [CrossRef]
- Prasanthi, T.L.; Prasanthi, K. Machine Learning-Based Signal Processing by Physiological Signals Detection of Stress. Turk. J. Comput. Math. Educ. 2021, 12, 4831–4840. [Google Scholar]
- Barik, S.; Pal, S. Enhancement of Stress Analysis Performance Using Respiration Information. In Proceedings of the 2023 IEEE 3rd Applied Signal Processing Conference (ASPCON), Haldia, India, 24–25 November 2023; pp. 216–221. [Google Scholar]
- Boiten, F. Component Analysis of Task-Related Respiratory Patterns. Int. J. Psychophysiol. 1993, 15, 91–104. [Google Scholar] [CrossRef]
- Van Diest, I.; Verstappen, K.; Aubert, A.E.; Widjaja, D.; Vansteenwegen, D.; Vlemincx, E. Inhalation/Exhalation Ratio Modulates the Effect of Slow Breathing on Heart Rate Variability and Relaxation. Appl. Psychophysiol. Biofeedback 2014, 39, 171–180. [Google Scholar] [CrossRef]
- Rashid, N.; Rahman, M.M.; Ahmed, T.; Kuang, J.; Gao, J.A. BreathIE: Estimating Breathing Inhale Exhale Ratio Using Motion Sensor Data from Consumer Earbuds. In Proceedings of the ICASSP 2023—2023 IEEE International Conference on Acoustics, Speech and Signal Processing (ICASSP), Rhodes Island, Greece, 4–10 June 2023; pp. 1–5. [Google Scholar]
- Karthika, M.; Al Enezi, F.A.; Pillai, L.V.; Arabi, Y.M. Rapid Shallow Breathing Index. Ann. Thorac. Med. 2016, 11, 167–176. [Google Scholar] [CrossRef]
- Bozorgmehr, A.; Weltermann, B. Prediction of Chronic Stress and Protective Factors in Adults: Development of an Interpretable Prediction Model Based on XGBoost and SHAP Using National Cross-Sectional DEGS1 Data. JMIR AI 2023, 2, e41868. [Google Scholar] [CrossRef]
- Park, H.-M.; Kim, G.; Oh, J.; Van Messem, A.; De Neve, W. Interpreting Stress Detection Models Using SHAP and Attention for MuSe-Stress 2022. IEEE Trans. Affect. Comput. 2025, 16, 1031–1043. [Google Scholar] [CrossRef]
- Schmidt, P.; Reiss, A.; Duerichen, R.; Marberger, C.; Van Laerhoven, K. Introducing WESAD, a Multimodal Dataset for Wearable Stress and Affect Detection. In Proceedings of the 20th ACM International Conference on Multimodal Interaction, Boulder, CO, USA, 16–20 October 2018; Association for Computing Machinery: New York, NY, USA, 2018; pp. 400–408. [Google Scholar]
- Kirschbaum, C.; Pirke, K.-M.; Hellhammer, D.H. The ‘Trier Social Stress Test’–A Tool for Investigating Psychobiological Stress Responses in a Laboratory Setting. Neuropsychobiology 2008, 28, 76–81. [Google Scholar] [CrossRef]
- Bobade, P.; Vani, M. Stress Detection with Machine Learning and Deep Learning Using Multimodal Physiological Data. In Proceedings of the 2020 Second International Conference on Inventive Research in Computing Applications (ICIRCA), Coimbatore, India, 15–17 October 2020; pp. 51–57. [Google Scholar]
- Wang, J.; Liang, H.; Wang, Y.; Wang, W.; Lan, K.; Cao, L.; Zhang, Z.; Li, Y.; Liu, Z.; Cao, D. Quantitative Analysis of Breathing Patterns Based on Wearable Systems. J. Biomed. Eng. 2021, 38, 893–902. [Google Scholar] [CrossRef]
- Li, M.; Kang, Y.; Kou, Y.; Zhao, S.; Zhang, X.; Qiu, L.; Yan, W.; Yu, P.; Zhang, Q.; Zhang, Z. Exploratory Study on Quantitative Analysis of Nocturnal Breathing Patterns in Patients with Acute Heart Failure Based on Wearable Devices. J. Biomed. Eng. 2023, 40, 1108–1116. [Google Scholar] [CrossRef]
- Delgado-Bonal, A.; Marshak, A. Approximate Entropy and Sample Entropy: A Comprehensive Tutorial. Entropy 2019, 21, 541. [Google Scholar] [CrossRef]
- Henriques, T.; Ribeiro, M.; Teixeira, A.; Castro, L.; Antunes, L.; Costa-Santos, C. Nonlinear Methods Most Applied to Heart-Rate Time Series: A Review. Entropy 2020, 22, 309. [Google Scholar] [CrossRef]
- Sedgwick, P. Pearson’s Correlation Coefficient. BMJ Br. Med. J. 2012, 345, e4483. [Google Scholar] [CrossRef]
- Keselman, H.J.; Huberty, C.J.; Lix, L.M.; Olejnik, S.; Cribbie, R.A.; Donahue, B.; Kowalchuk, R.K.; Lowman, L.L.; Petoskey, M.D.; Keselman, J.C.; et al. Statistical Practices of Educational Researchers: An Analysis of Their ANOVA, MANOVA, and ANCOVA Analyses. Rev. Educ. Res. 1998, 68, 350–386. [Google Scholar] [CrossRef]
- Wang, S.; Dai, Y.; Shen, J.; Xuan, J. Research on Expansion and Classification of Imbalanced Data Based on SMOTE Algorithm. Sci. Rep. 2021, 11, 24039. [Google Scholar] [CrossRef]
- Tharwat, A. Classification Assessment Methods. Appl. Comput. Inform. 2021, 17, 168–192. [Google Scholar] [CrossRef]
- Marcílio, W.E.; Eler, D.M. From Explanations to Feature Selection: Assessing SHAP Values as Feature Selection Mechanism. In Proceedings of the 2020 33rd SIBGRAPI Conference on Graphics, Patterns and Images (SIBGRAPI), Recife/Porto de Galinhas, Brazil, 7–10 November 2020; pp. 340–347. [Google Scholar]
- Yan, X.; Lin, Z.; Lin, Z.; Vucetic, B. A Novel Exploitative and Explorative GWO-SVM Algorithm for Smart Emotion Recognition. IEEE Internet Things J. 2023, 10, 9999–10011. [Google Scholar] [CrossRef]
- Cai, H.; Lin, Q.; Liu, H.; Li, X.; Xiao, H. Recognition of Human Mood, Alertness and Comfort under the Influence of Indoor Lighting Using Physiological Features. Biomed. Signal Process. Control 2024, 89, 105661. [Google Scholar] [CrossRef]
- Noble, D.J.; Hochman, S. Hypothesis: Pulmonary Afferent Activity Patterns During Slow, Deep Breathing Contribute to the Neural Induction of Physiological Relaxation. Front. Physiol. 2019, 10, 1176. [Google Scholar] [CrossRef] [PubMed]
- Muntean, E. Training of Abdominal Breathing on Purpose of Reducing Anxiety by Restricting the Chest Movements. In Proceedings of the MedEspera, Chisinau, Republic of Moldova, 24–27 April 2024; Volume 10, p. 373. [Google Scholar]




| Feature Category | Parameter Name | Description |
|---|---|---|
| Respiratory Rhythm Parameters | BR | Breathing rate mean (bpm) |
| BR_cv | Respiratory rate variation coefficient, refer to Formula (1) | |
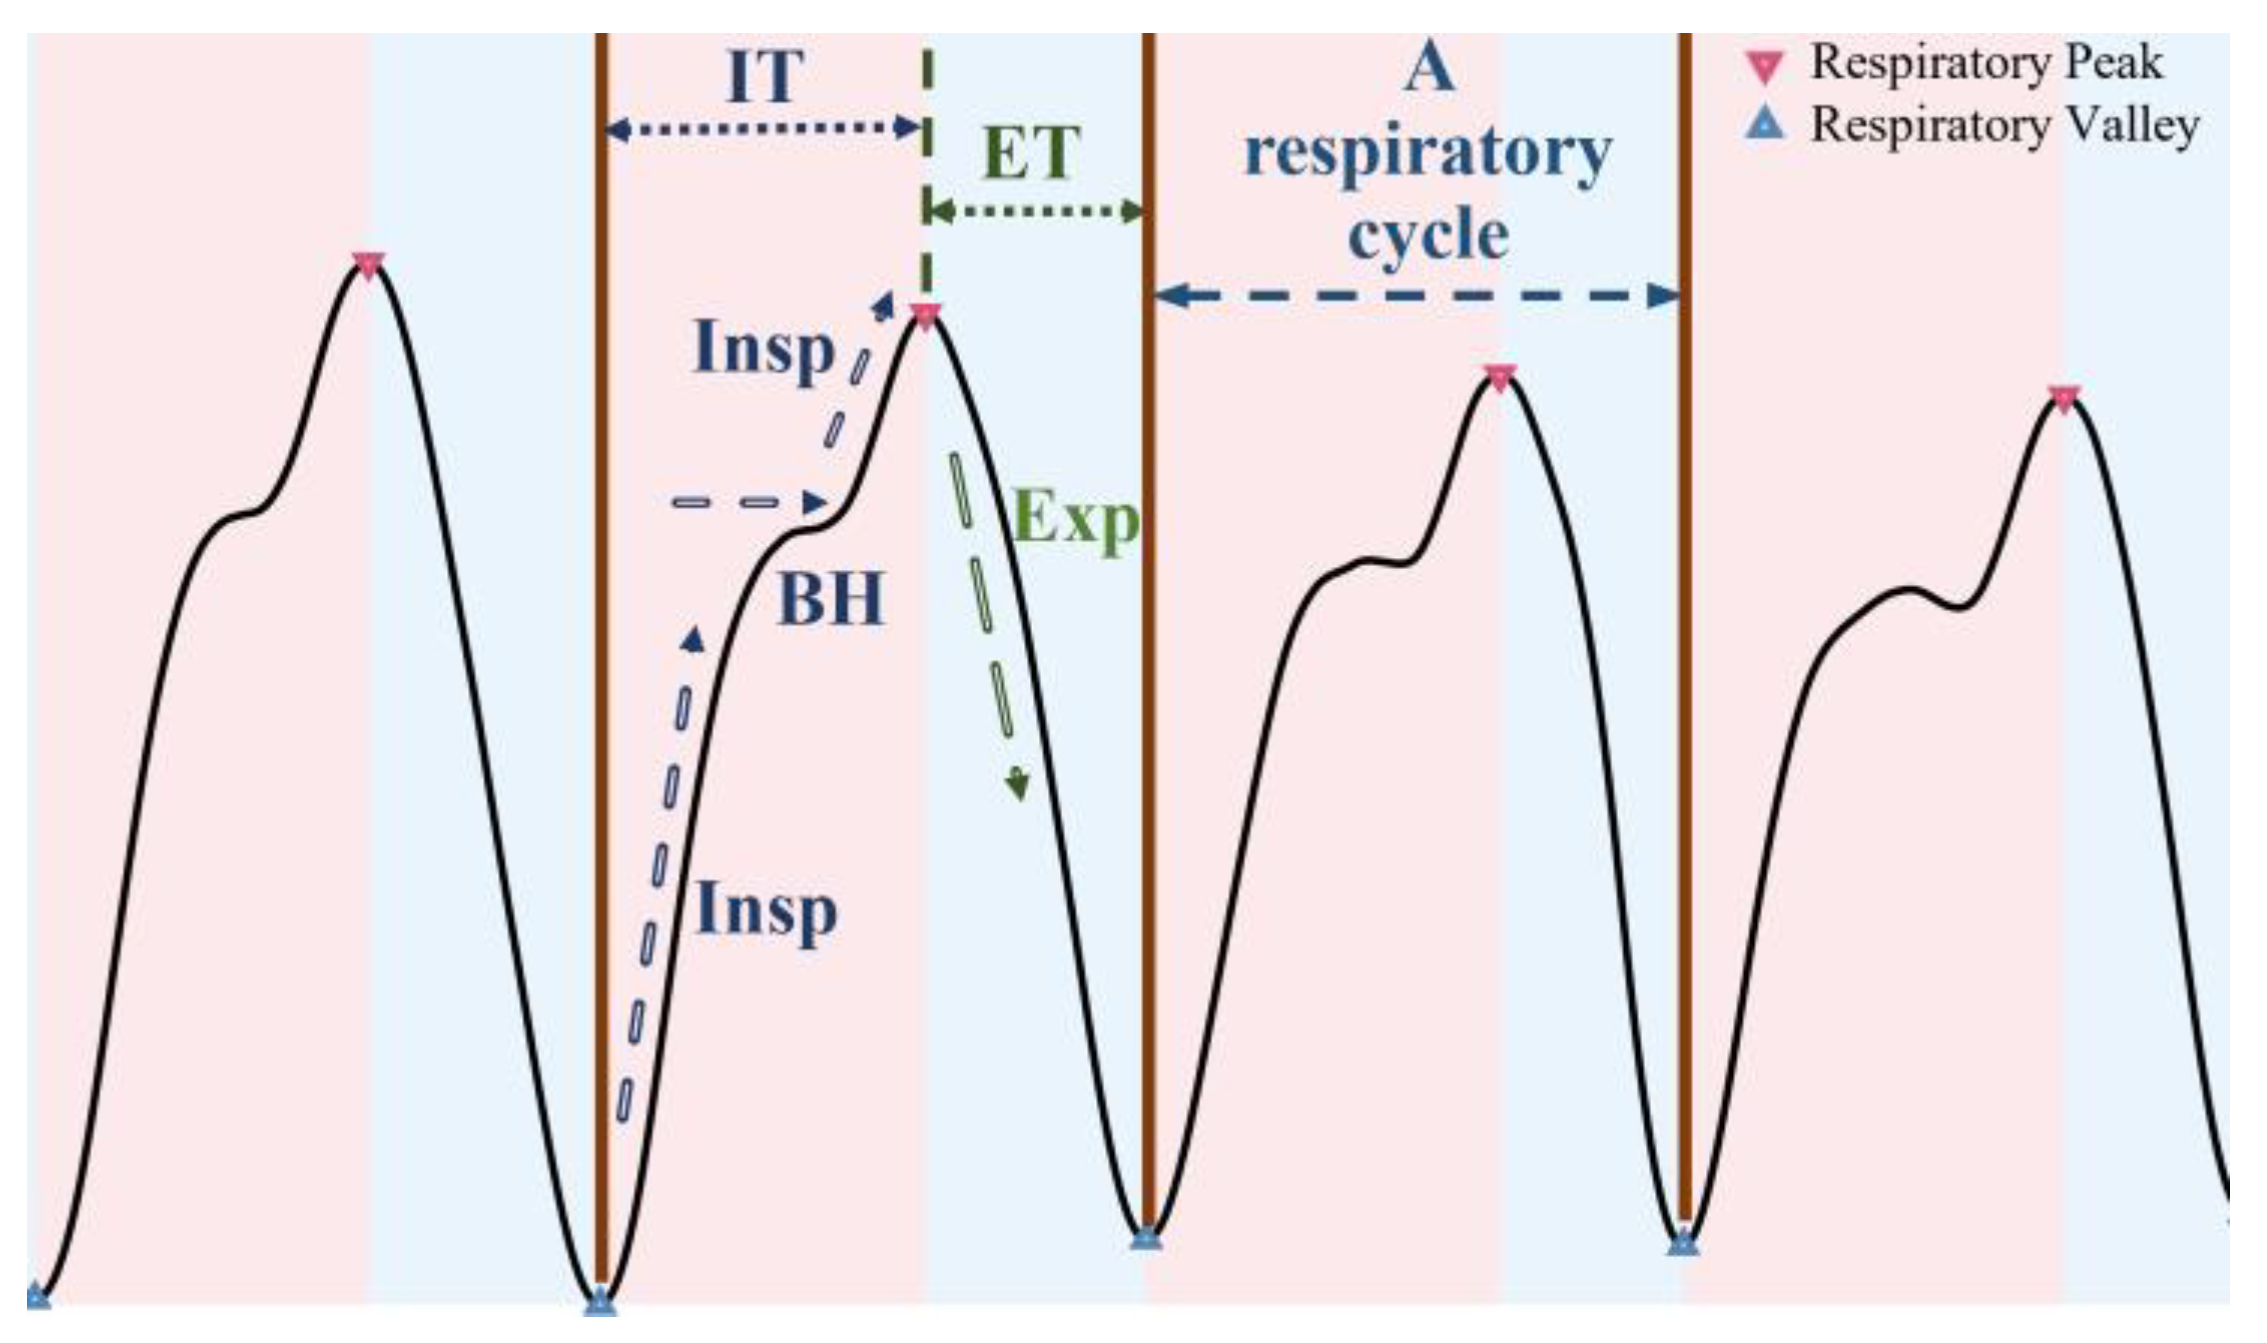
| IT | Inspiration time mean, mean time interval from trough to next peak (s) | |
| IT_cv | Inspiratory time variation coefficient, refer to Formula (1) | |
| ET | Expiratory time mean, mean time interval from peak to next trough (s) | |
| ET_cv | Expiratory time variation coefficient, refer to Formula (1) | |
| IT_ratio | Inspiratory time ratio, refer to Formula (2) | |
| IT_ratio_cv | Inspiratory time ratio variation coefficient, refer to Formula (1) | |
| Respiratory Depth Parameters | D | Breathing depth mean, the mean difference between the amplitude of a wave crest and an adjacent trough |
| D_cv | Breathing depth ratio variation coefficient, refer to Formula (1) | |
| RSBI | Rapid shallow breathing index, refer to Formula (3) | |
| RSBI_cv | Rapid shallow breathing index variation coefficient, refer to Formula (1) | |
| Respiratory Nonlinear Dynamics Parameters | SD1 | Short-Term Variability of Poincaré chart, Formula (4) |
| SD2 | Long-Term Variability of Poincaré chart, Formula (5) | |
| Appor | Approximate Entropy, calculation method refer to [30] | |
| Sample | Sample Entropy, calculation method refer to [30] |
| Feature Category | Parameter Name | Description |
|---|---|---|
| Time Domain Feature Parameters | Avg, Std, Rat, Skw, Kur | Mean, standard deviation, ratio of maximum value to mean, skewness, and kurtosis. |
| Frequency Domain Feature Parameters | Fre, Fre1, Fre2, Fre3, Fre4, Fre5, Fre6 | Main frequency, power sum in 0–0.1 Hz, 0.1–0.2 Hz, 0.2–0.3 Hz, 0.3–0.4 Hz, 0.4–0.7 Hz, and 0.7–1 Hz bands. |
| Wavelet Domain Feature Parameters | Wer, Wee, We, Wse | Wavelet energy ratio of the first subband, wavelet energy entropy, wavelet entropy of the first subband, and wavelet singular entropy. |
| Feature | I | J | I − J | Error | Sig. | Feature | I | J | I − J | Error | Sig. |
|---|---|---|---|---|---|---|---|---|---|---|---|
| BR | N | S | −1.6281 * | 0.2974 | 0.000 | BR_cv | N | S | −0.2088 * | 0.0095 | 0.000 |
| S | M | 7.4811 * | 0.3347 | 0.000 | S | M | 0.0675 * | 0.0138 | 0.000 | ||
| M | N | −5.8530 * | 0.2291 | 0.000 | M | N | 0.1413 * | 0.0122 | 0.000 | ||
| IT | N | S | 0.1416 * | 0.0412 | 0.002 | IT_cv | N | S | −0.1865 * | 0.0115 | 0.000 |
| S | M | −1.8480 * | 0.0811 | 0.000 | S | M | 0.0920 * | 0.0146 | 0.000 | ||
| M | N | 1.7063 * | 0.0749 | 0.000 | M | N | 0.0945 * | 0.0123 | 0.000 | ||
| ET | N | S | −0.2933 * | 0.0324 | 0.000 | ET_cv | N | S | −0.2561 * | 0.0089 | 0.000 |
| S | M | −0.5970 * | 0.0582 | 0.000 | S | M | 0.1647 * | 0.0118 | 0.000 | ||
| M | N | 0.8903 * | 0.0506 | 0.000 | M | N | 0.0914 * | 0.0104 | 0.000 | ||
| IT_ratio | N | S | 0.0506 * | 0.0034 | 0.000 | IT_ratio_cv | N | S | −0.1413 * | 0.0064 | 0.000 |
| S | M | −0.0990 * | 0.0039 | 0.000 | S | M | 0.1014 * | 0.0079 | 0.000 | ||
| M | N | 0.0484 * | 0.0034 | 0.000 | M | N | 0.0399 * | 0.0064 | 0.000 | ||
| D | N | S | −2.5176 * | 0.2909 | 0.000 | D_cv | N | S | −0.2124 * | 0.0157 | 0.000 |
| S | M | −0.4953 | 0.4778 | 0.658 | S | M | 0.1559 * | 0.0198 | 0.000 | ||
| M | N | 3.0129 * | 0.4036 | 0.000 | M | N | 0.0565 * | 0.0200 | 0.015 | ||
| RSBI | N | S | −1.8441 * | 0.4118 | 0.000 | RSBI_cv | N | S | −0.7210 * | 0.0452 | 0.000 |
| S | M | 3.6690 * | 0.4193 | 0.000 | S | M | 0.5091 * | 0.0545 | 0.000 | ||
| M | N | −1.8249 * | 0.2101 | 0.000 | M | N | 0.2119 * | 0.0448 | 0.000 | ||
| SD1 | N | S | −0.7652 * | 0.0458 | 0.000 | SD2 | N | S | −0.6454 * | 0.0432 | 0.000 |
| S | M | −0.1383 | 0.0831 | 0.264 | S | M | −0.1675 | 0.0712 | 0.057 | ||
| M | N | 0.9035 * | 0.0767 | 0.000 | M | N | 0.8129 * | 0.0665 | 0.000 | ||
| Sample | N | S | 0.0009 * | 0.0001 | 0.000 | Appro | N | S | 0.0008 * | 0.0001 | 0.000 |
| S | M | 0.0012 * | 0.0001 | 0.000 | S | M | 0.0015 * | 0.0001 | 0.000 | ||
| M | N | −0.0022 * | 0.0001 | 0.000 | M | N | −0.0023 * | 0.0001 | 0.000 |
| Subject | Accuracy | F1 | Precision | Recall |
|---|---|---|---|---|
| 2 | 91.3% | 91.0% | 91.6% | 91.3% |
| 3 | 100.0% | 100.0% | 100.0% | 100.0% |
| 4 | 84.8% | 85.3% | 87.5% | 84.8% |
| 5 | 93.5% | 93.3% | 93.8% | 93.5% |
| 6 | 95.7% | 95.6% | 96.0% | 95.7% |
| 7 | 100.0% | 100.0% | 100.0% | 100.0% |
| 8 | 93.5% | 93.6% | 93.8% | 93.5% |
| 9 | 97.8% | 97.8% | 98.0% | 97.8% |
| 10 | 91.3% | 91.3% | 91.8% | 91.3% |
| 11 | 87.0% | 85.7% | 88.7% | 87.0% |
| 13 | 67.4% | 68.7% | 76.5% | 67.4% |
| 14 | 89.1% | 89.2% | 91.5% | 89.1% |
| 15 | 95.7% | 95.5% | 96.0% | 95.7% |
| 16 | 97.8% | 97.8% | 97.9% | 97.8% |
| 17 | 100.0% | 100.0% | 100.0% | 100.0% |
| Average | 92.33% | 92.32% | 93.54% | 92.33% |
| State | Accuracy | F1 | Precision | Recall |
|---|---|---|---|---|
| Normal | 92.75% | 93.02% | 93.54% | 92.50% |
| Stress | 94.49% | 87.50% | 86.36% | 88.67% |
| Meditation | 97.39% | 95.00% | 95.00% | 95.00% |
| Feature Set | No. of Features | Accuracy | F1 | Precision | Recall |
|---|---|---|---|---|---|
| This Study | 16 | 92.33% | 92.32% | 93.54% | 92.33% |
| General | 16 | 81.75% | 81.63% | 84.50% | 81.75% |
| Hybrid | 32 | 90.74% | 90.79% | 92.27% | 90.74% |
| Paper | Signal | Feature | Classification | Method | Accuracy | F1 |
|---|---|---|---|---|---|---|
| [11] | WESAD dataset (Multi-signals) | GAF encoding | 4-class | CNN | 94.77% | 95% |
| [13] | WESAD dataset (Multi-signals) | - | 3-class | BNN + ANN | 94% | 96.9% |
| [27] | WESAD dataset (Multi-signals) | Time and Freq | 2-class | ANN | 95.21% | 94.24% |
| [27] | WESAD dataset (Multi-signals) | Time and Freq | 3-class | ANN | 84.32% | 78.71% |
| [37] | WESAD dataset (ECG only) | DCT Freq | 3-class | X-GWO-SVM | 95.93% | 95.56% |
| [14] | RESP | Time and Freq, RQA, and approximate entropy | 2-class | MLP (LOOCV) | 94.4% | - |
| [16] | RESP | Time and Freq | 3-class | SVM | 93.41% | - |
| [17] | RESP | Time and Freq | 3-class | KNN | 92.06% | - |
| [18] | RESP | Time and Freq | 4-class | SVM | 92.5% | 95.11% |
| Proposed work | WESAD dataset (RESP only) | Physiologically meaningful respiratory feature | 3-class | Stacking | 92.33% | 92.32% |
Disclaimer/Publisher’s Note: The statements, opinions and data contained in all publications are solely those of the individual author(s) and contributor(s) and not of MDPI and/or the editor(s). MDPI and/or the editor(s) disclaim responsibility for any injury to people or property resulting from any ideas, methods, instructions or products referred to in the content. |
© 2025 by the authors. Licensee MDPI, Basel, Switzerland. This article is an open access article distributed under the terms and conditions of the Creative Commons Attribution (CC BY) license (https://creativecommons.org/licenses/by/4.0/).
Share and Cite
Yang, C.; Wei, S.; Li, J.; Liu, C. Physiologically Explainable Ensemble Framework for Stress Classification via Respiratory Signals. Technologies 2025, 13, 411. https://doi.org/10.3390/technologies13090411
Yang C, Wei S, Li J, Liu C. Physiologically Explainable Ensemble Framework for Stress Classification via Respiratory Signals. Technologies. 2025; 13(9):411. https://doi.org/10.3390/technologies13090411
Chicago/Turabian StyleYang, Chenxi, Siyu Wei, Jianqing Li, and Chengyu Liu. 2025. "Physiologically Explainable Ensemble Framework for Stress Classification via Respiratory Signals" Technologies 13, no. 9: 411. https://doi.org/10.3390/technologies13090411
APA StyleYang, C., Wei, S., Li, J., & Liu, C. (2025). Physiologically Explainable Ensemble Framework for Stress Classification via Respiratory Signals. Technologies, 13(9), 411. https://doi.org/10.3390/technologies13090411


