1. Introduction
With the rapid advancement of wireless communication technologies, power amplifiers (PAs) are increasingly expected to deliver both high efficiency and wide operational bandwidth [
1]. Among various PA topologies, the Doherty power amplifier (DPA) has garnered significant attention due to its high efficiency, linearity, and bandwidth [
2], making it a key enabler in modern communication systems.
To further enhance PA performance, various design methodologies have been proposed in recent years. Ref. [
3] proposed a three-stage DPA incorporating impedance compensation in the load combiner, effectively extending the bandwidth. Ref. [
4] introduced an improved load modulation network that significantly boosts back-off efficiency through optimized matching networks. Ref. [
5] exploited the dual-band characteristics of T-shaped networks, enabling different load modulation paths at selected operating frequencies, thereby achieving high efficiency and output power. Ref. [
6] designed a DPA based on a composite objective function constrained by both impedance and phase characteristics, improving efficiency consistency under power back-off conditions.
In addition, optimization algorithms and artificial intelligence techniques have been widely applied to PA design. In Refs. [
7,
8], Bayesian optimization was adopted to automate the design process, resulting in improved performance metrics. Refs. [
9,
10] applied simulated annealing and particle swarm optimization to achieve efficient design of broadband and multi-band PAs. Ref. [
11] employed multi-objective optimization techniques to address the challenges of broadband matching. Ref. [
12] proposed a novel surrogate model-assisted hybrid optimization approach for efficient and general-purpose automatic PA design. Ref. [
13] presented a deep learning-based inverse design method for broadband PAs, enabling effective broadband matching and power flatness optimization. Despite these advancements, achieving an optimal trade-off between efficiency and bandwidth continues to pose a significant challenge in PA design.
To address this issue, this paper presents a hybrid optimization method that integrates genetic algorithms and neural networks to optimize broadband DPA design. Genetic algorithms are well known for their robustness and strong global search capabilities in solving complex optimization problems. By performing global exploration of the design space [
14], genetic algorithms have become a powerful tool for handling nonlinear, high-dimensional design tasks. On the other hand, neural networks, with their adaptive learning ability and nonlinear modeling capacity [
15], can accurately predict the performance of power amplifiers under varying circuit parameters. The integration of these two techniques forms an efficient collaborative optimization framework, effectively improving both the efficiency and bandwidth in broadband power amplifier design.
The remainder of this paper is organized as follows.
Section 2 introduces the proposed optimization framework.
Section 3 presents the detailed design methodology and implementation process.
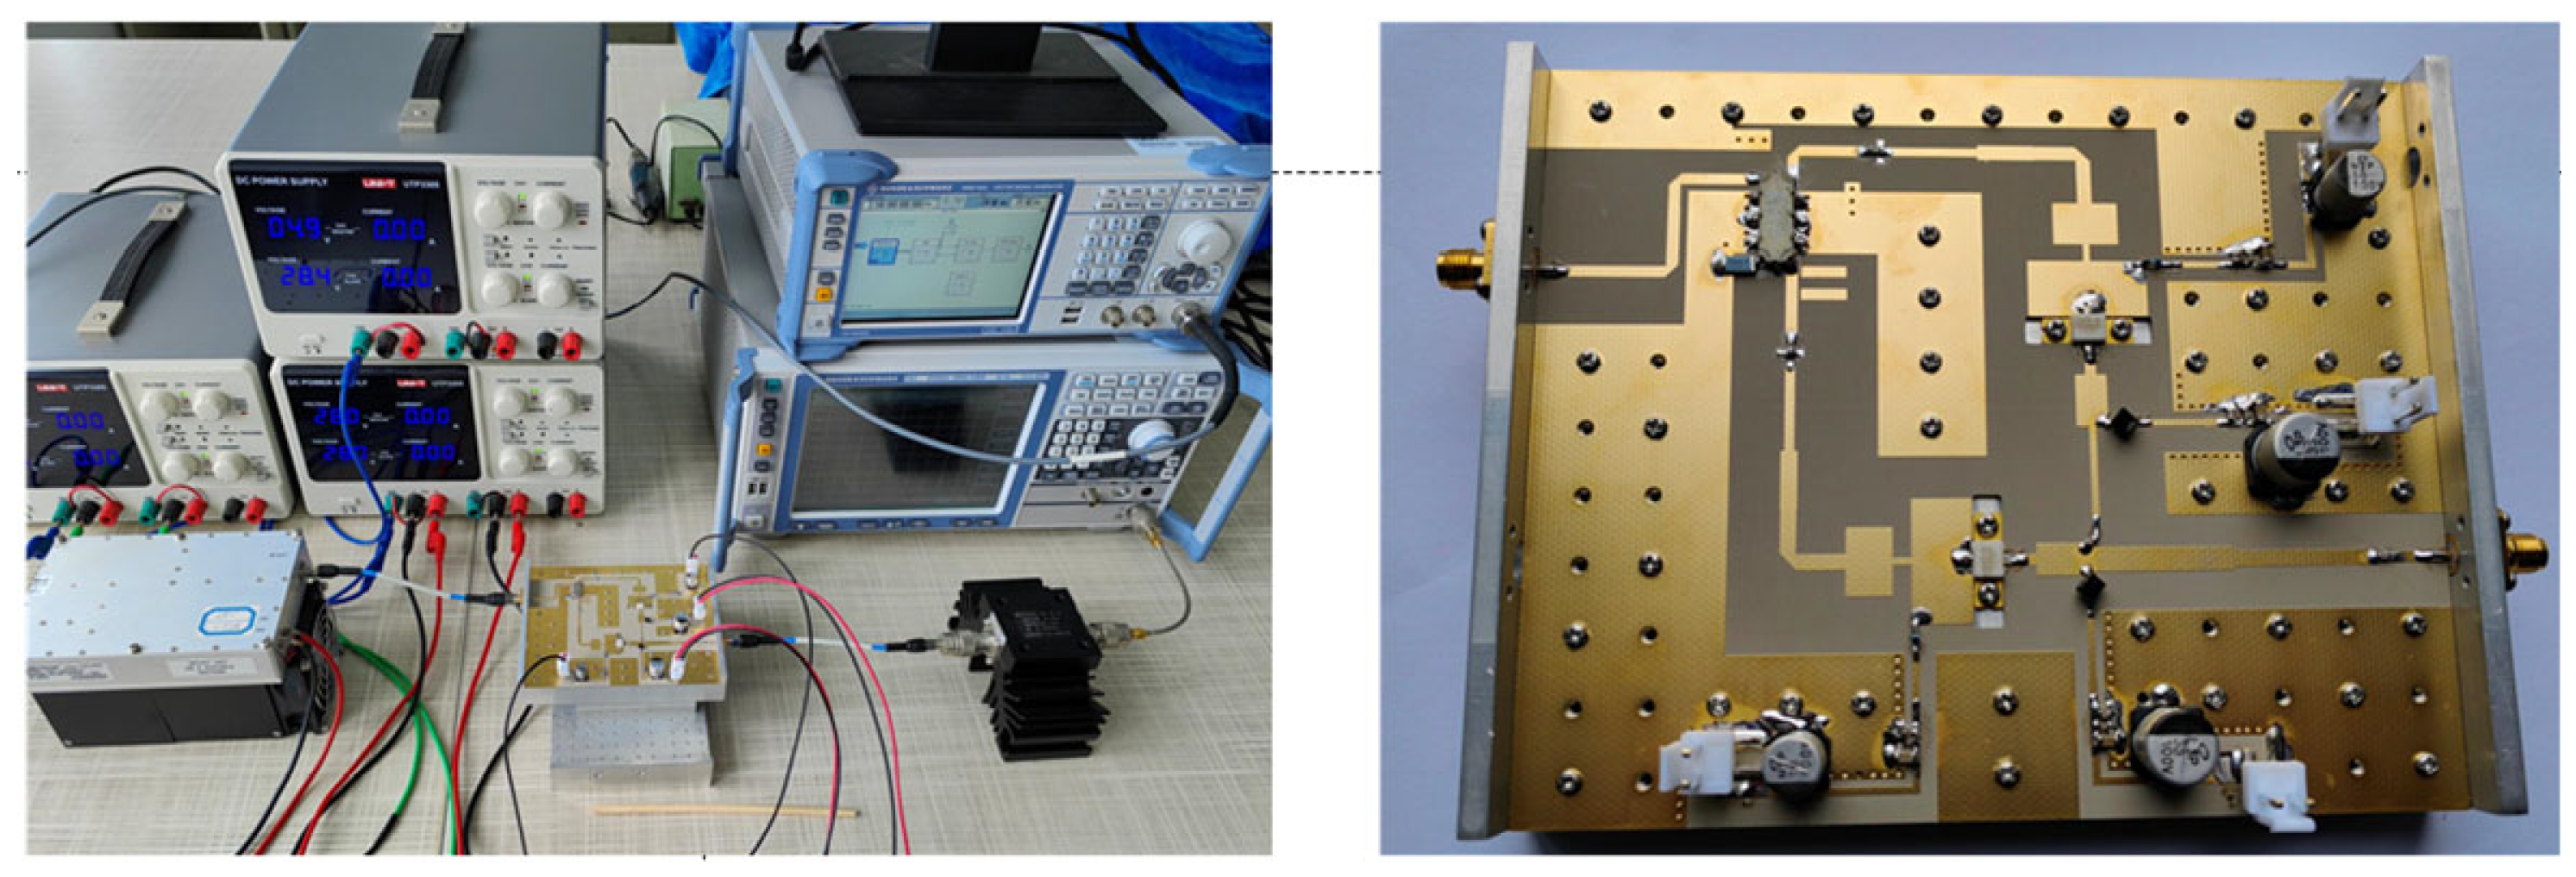
Section 4 discusses the experimental setup and measurement results.
Section 5 concludes the paper.
2. Genetic Algorithm and Neural Network
In the field of optimization, the integration of Genetic Algorithms and Neural Networks has become an effective approach for solving complex optimization problems. For examples, Refs. [
16,
17] dynamically combined multi-objective genetic algorithms (MOGAs) with neural networks to tackle intricate optimization tasks in the physical sciences. The proposed DNMOGA algorithm incorporates enhancements such as dynamic reallocation of evaluation resources across individuals, enabling it to handle stringent constraints and preference structures inherent in physical optimization problems. This approach was successfully applied to optimize the shape of superconducting radio-frequency (SRF) cavities, yielding designs that outperformed those obtained through manual tuning. By combining the global search capabilities of GAs with the rapid evaluation and modeling efficiency of NNs, this hybrid method significantly enhances both optimization accuracy and computational efficiency.
To address the limitations of traditional optimization techniques in broadband Doherty power amplifier (DPA) design, we propose a hybrid optimization framework that combines the global exploration capability of genetic algorithms (GAs) with the predictive efficiency of neural networks (NNs). This integration significantly improves the computational speed while maintaining optimization accuracy.
The theoretical foundation and implementation process of this combined approach are detailed as follows.
In the implementation, the initial population is generated using Latin Hypercube Sampling (LHS), a neural network model is constructed and trained, a dynamic mutation strategy and crossover operations are employed to generate new individuals, and an elitism strategy is applied to update the population. Finally, the accuracy of the optimization results is ensured by validating the true fitness of the best solution. The pseudo-code of the algorithm is presented in Algorithm 1.
| Algorithm 1: The Complete Optimization Process |
Input: Maximum number of generations; Population size;
Output: Best solution and fitness;Initialize environment and parameters; Generate initial population using LHS; Define neural network (NN) architecture; Set NN training options; Initialize historical data storage; Compute initial fitness values for the population; for each generation from 1 to max_generations do Train NN using current population and historical data; Generate offspring through crossover, mutation; Perform partial real evaluation using NN prediction; Execute environmental selection to update parent population; Recompute fitness for predicted individuals; Identify the best individual and fitness of current generation; Update historical population and fitness data; end for
|
Step 1: Initial Population Generation.
To ensure uniform distribution of the initial population across each dimension [
18], Latin Hypercube Sampling (LHS) is employed. LHS is a statistical sampling technique that divides the interval
of each input variable dimension into
subintervals and randomly selects one sample point
from each subinterval. This method guarantees uniform coverage of the sample space in every dimension and avoids sample clustering or sparsity issues caused by random sampling, thereby improving the quality of the initial population. For each sampled individual
its fitness value
is computed and stored. The fitness function is the core of the optimization problem, evaluating the quality of each individual based on the objective criteria. The fitness values of the initial population provide the basis for subsequent optimization. In this study, all individuals are generated using a random number seed to ensure stochasticity.
Step 2: Neural Network Model Construction.
The neural network consists of an input layer, hidden layers, and an output layer [
19]. The input layer receives the optimization parameters, while the output layer provides the corresponding performance metrics, such as objective function values. The hidden layers extract features from the input data and perform nonlinear transformations to enable the network to learn the complex relationships between inputs and outputs. The neural network model can be mathematically represented as
where
denote weight matrices,
are bias vectors, and
is the activation function.
In this study, the input layer of the network receives optimization parameters, which are subsequently processed by a feature input layer. The hidden layers are composed of multiple components. Initially, there is a fully connected layer with 128 neurons, followed by a batch normalization layer, which facilitates the acceleration of network convergence and enhances the stability of the training process. Subsequently, a ReLU activation function is applied to introduce nonlinearity, thereby enabling the network to capture complex patterns. To further prevent overfitting, a dropout layer with a dropout rate of 0.3 is incorporated into the network. Following this, the network includes a Long Short-Term Memory (LSTM) layer, which comprises 64 units and is configured to output sequences. After the LSTM layer, another fully connected layer with 64 neurons is employed, succeeded by a ReLU activation function layer and a dropout layer with a dropout rate of 0.2. The output layer of the network is composed of a single fully connected layer with a single neuron designed to generate the final predictive output.
Step 3: Neural Network Training.
The neural network is trained by minimizing the mean squared error (MSE) between the predicted and true values, which is defined as
where
and
are the model’s weights and biases,
is the number of training samples,
is the true value of the
sample, and
is the predicted value.
During the training phase, the network parameters are optimized using the Adam algorithm to minimize MSE, with a maximum of 200 iterations, a mini-batch size of 128, and an initial learning rate of 0.001. To avoid premature cessation of training based on validation performance, an early stopping criterion with a patience of 20 epochs is included. Through this iterative optimization process, the neural network progressively acquires the mapping between inputs and outputs, thereby facilitating rapid and accurate predictions on novel input data following the completion of training.
Step 4: Genetic Algorithm Operators—Mutation and Crossover.
Mutation and crossover operations are key to generating new individuals in the genetic algorithm. Mutation introduces new genetic variations by randomly altering parts of individuals, maintaining population diversity and preventing premature convergence. A dynamic mutation strategy is adopted to adjust mutation strength according to the generation number
:
where
is the initial mutation strength and
is the maximum number of generations. This dynamic adjustment allows larger mutations in the early stages to explore the search space broadly, while reducing mutation strength in later stages to refine the search locally, thereby improving optimization accuracy.
Crossover generates offspring by exchanging parts of two parent individuals. For parents
and
, the offspring
in dimension
is computed as
where
is the crossover coefficient. This operation combines desirable traits from both parents to produce offspring with potentially better fitness, driving the population toward optimal solutions.
After crossover, offspring undergo mutation to further increase diversity. The mutated value
in dimension
is expressed as
where
is a Gaussian random variable. This Gaussian mutation adds random noise to each dimension of the offspring, enabling exploration of new regions in the search space and helping avoid local optima.
In genetic algorithms, the elitism strategy is commonly employed to preserve the individuals with the highest fitness values, ensuring the overall quality of the population. After merging the offspring and parent populations, the elitism strategy selects the top 10% individuals in terms of fitness from the current population
as the elite set
, which are directly carried over to the next generation. This strategy can be formulated as
where
is the fitness threshold correspong to the minimum
quantile. By retaining the individuals with the highest fitness, elitism ensures that the population maintains a high quality throughout evolution, thereby improving optimization efficiency.
Step 5: Fitness Evaluation of Mutated Offspring.
The mutated offspring require fitness evaluation. Since direct computation of fitness can be computationally expensive, the trained neural network is used to predict the fitness values of the offspring. For individuals with predicted low fitness as well as for a subset of randomly sampled individuals, true fitness evaluations are performed and their fitness values are updated accordingly. In this study, 20% of the dataset is allocated for validation purposes. This partial real evaluation strategy significantly reduces computational cost while maintaining optimization accuracy.
Step 6: Environmental Selection and Population Update.
Environmental selection is conducted by sorting the combined current population and offspring according to fitness values, selecting the lowest fitness individuals to form the next generation. The data of the new generation are stored in a historical population used for subsequent neural network training. The update of the historical population provides more training samples for the neural network, thereby further improving prediction accuracy. As the optimization progresses, the historical population grows, enabling the neural network to better adapt to changes in the solution space and enhance optimization efficiency. In this study, the training process utilizes data from the most recent 10 generations. Following this, fitness predictions of individuals are recalculated to identify the current best individual and fitness.
Step 7: Termination Condition and Output.
The optimization process terminates when a preset maximum number of iterations is reached or when fitness convergence criteria are met. Upon termination, the true fitness of the best predicted solution is verified. If the predicted best fitness differs from the true value, a re-evaluation of the entire population is performed to identify the true best solution. Finally, the best individual and its fitness value are outputted as the solution to the optimization problem.
- 2.
Algorithm Testing
The proposed algorithm is evaluated using three different types of benchmark test functions. The details of these test functions are listed in
Table 1.
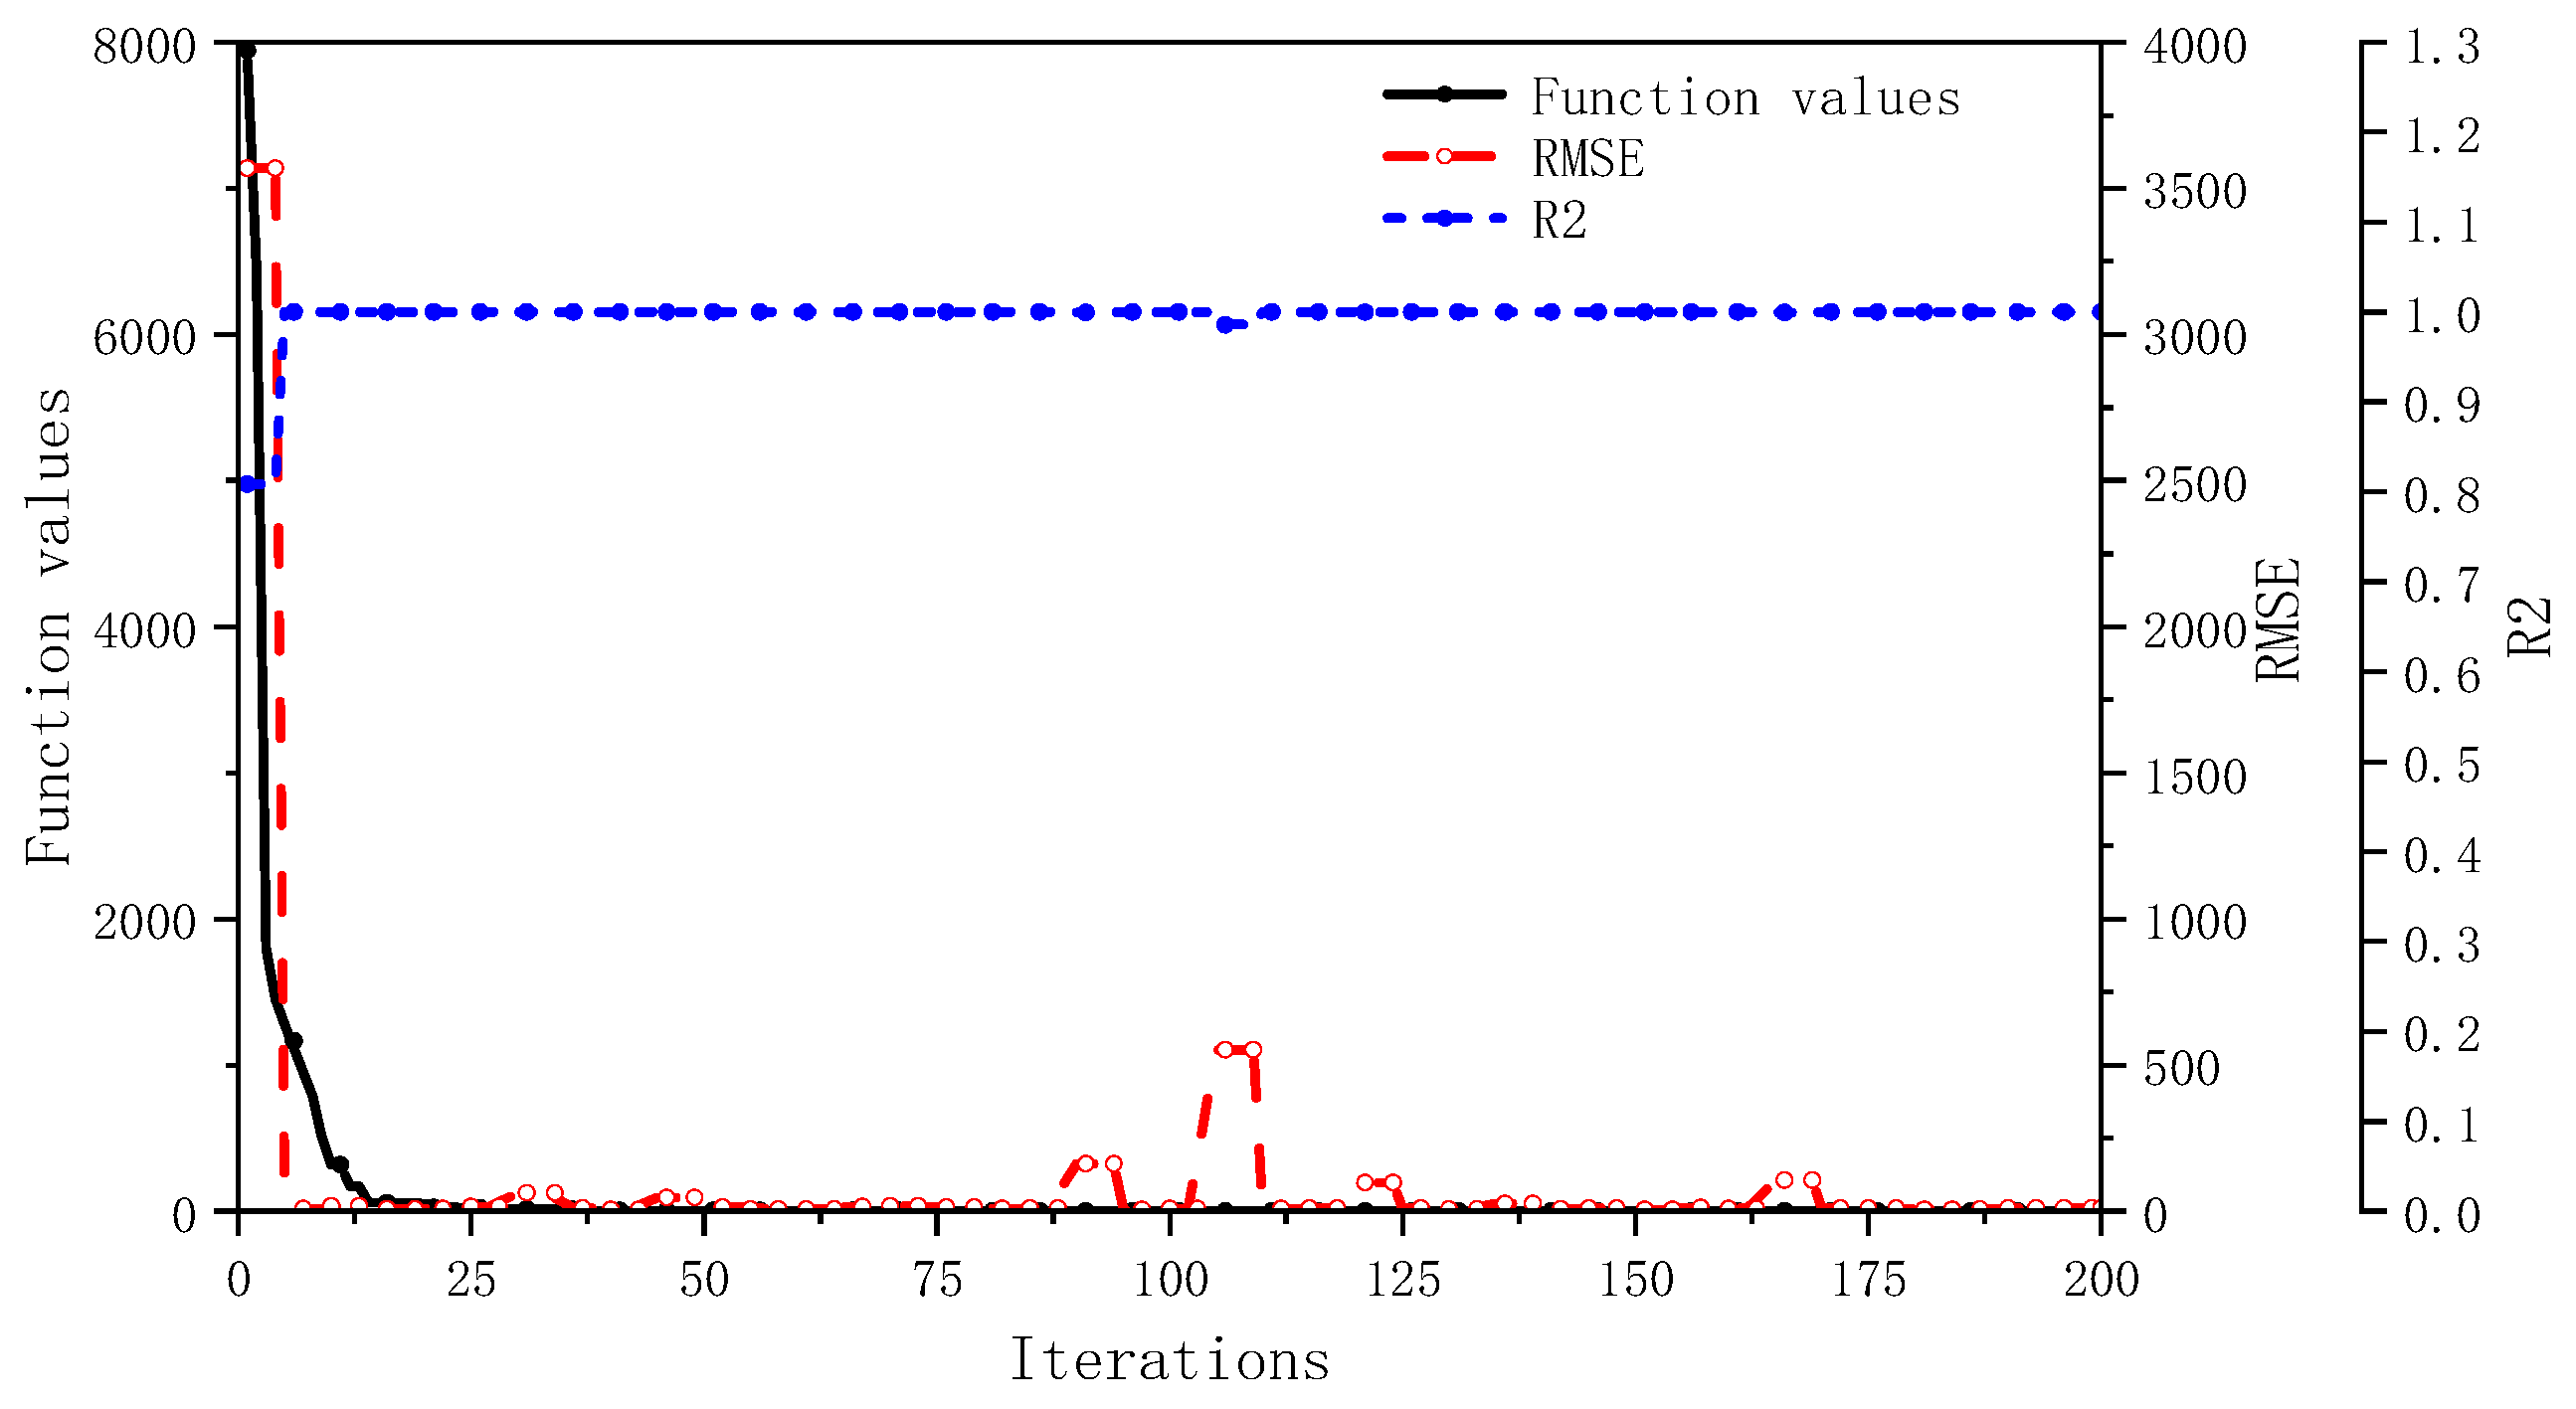
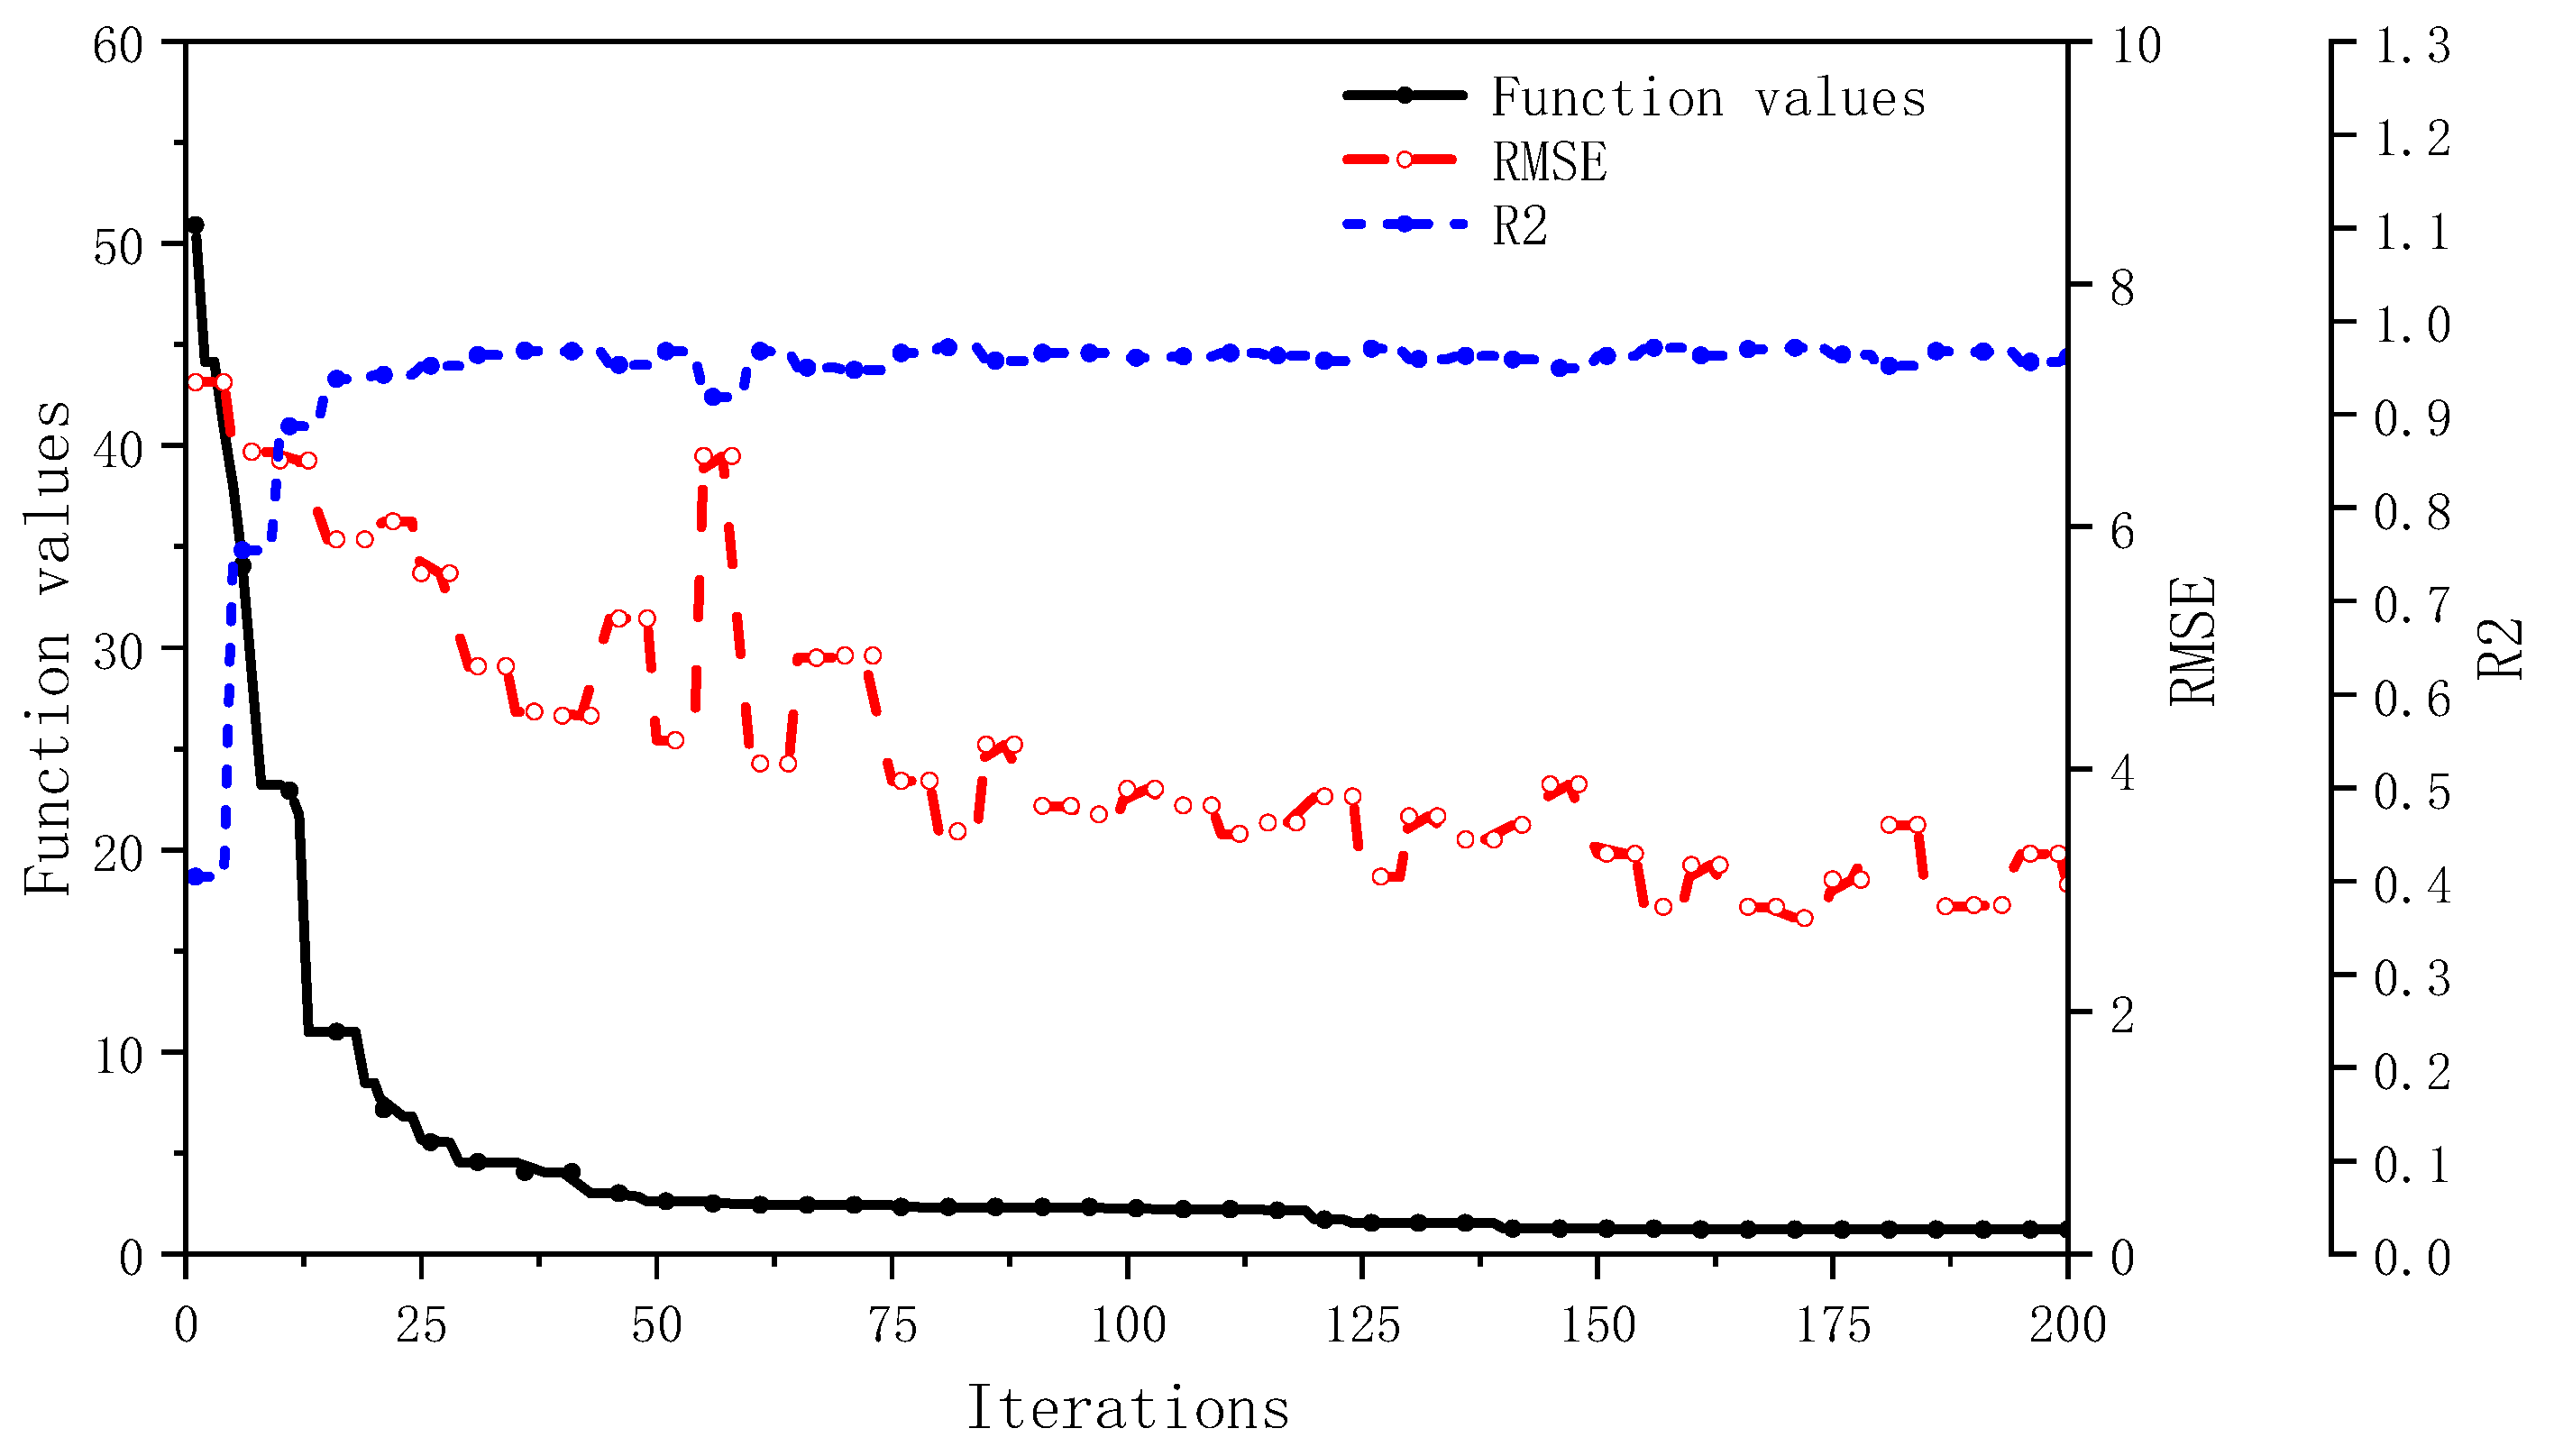
To guarantee the reliability of the surrogate model integrated within our Genetic Algorithm, we employ the Root Mean Squared Error (RMSE) as a principal metric to evaluate the accuracy of the Neural Network predictions relative to the actual fitness values. The RMSE provides a quantitative measure of the average magnitude of the errors between the predicted and actual fitness values. The RMSE is calculated as follows:
where
represents the actual fitness value of the
-th individual,
is the predicted fitness value from the neural network, and
is the number of individuals used for validation.
In addition to RMSE, we calculate the coefficient of determination
to evaluate the goodness-of-fit of the neural network predictions. The
score indicates the proportion of variance in the actual fitness values that is predictable from the surrogate model:
where
is the mean of the actual fitness values. A higher
value (closer to 1) suggests a better fit and higher reliability of the surrogate model.
The parameter settings for the optimization algorithm during testing are as follows: population size is set to 200, maximum number of iterations is 200, and the dimension of the test functions is 8. The algorithm parameters
is set as 0.2 and
is set as 0.8. Additionally, the neural network undergoes retraining at intervals of every five generations. The results are shown in
Figure 1,
Figure 2 and
Figure 3, which demonstrate that the algorithm is capable of converging to the minimum values and the surrogate model maintains a low RMSE and a high
score, demonstrating its reliability in predicting fitness values.
3. Design and Optimization
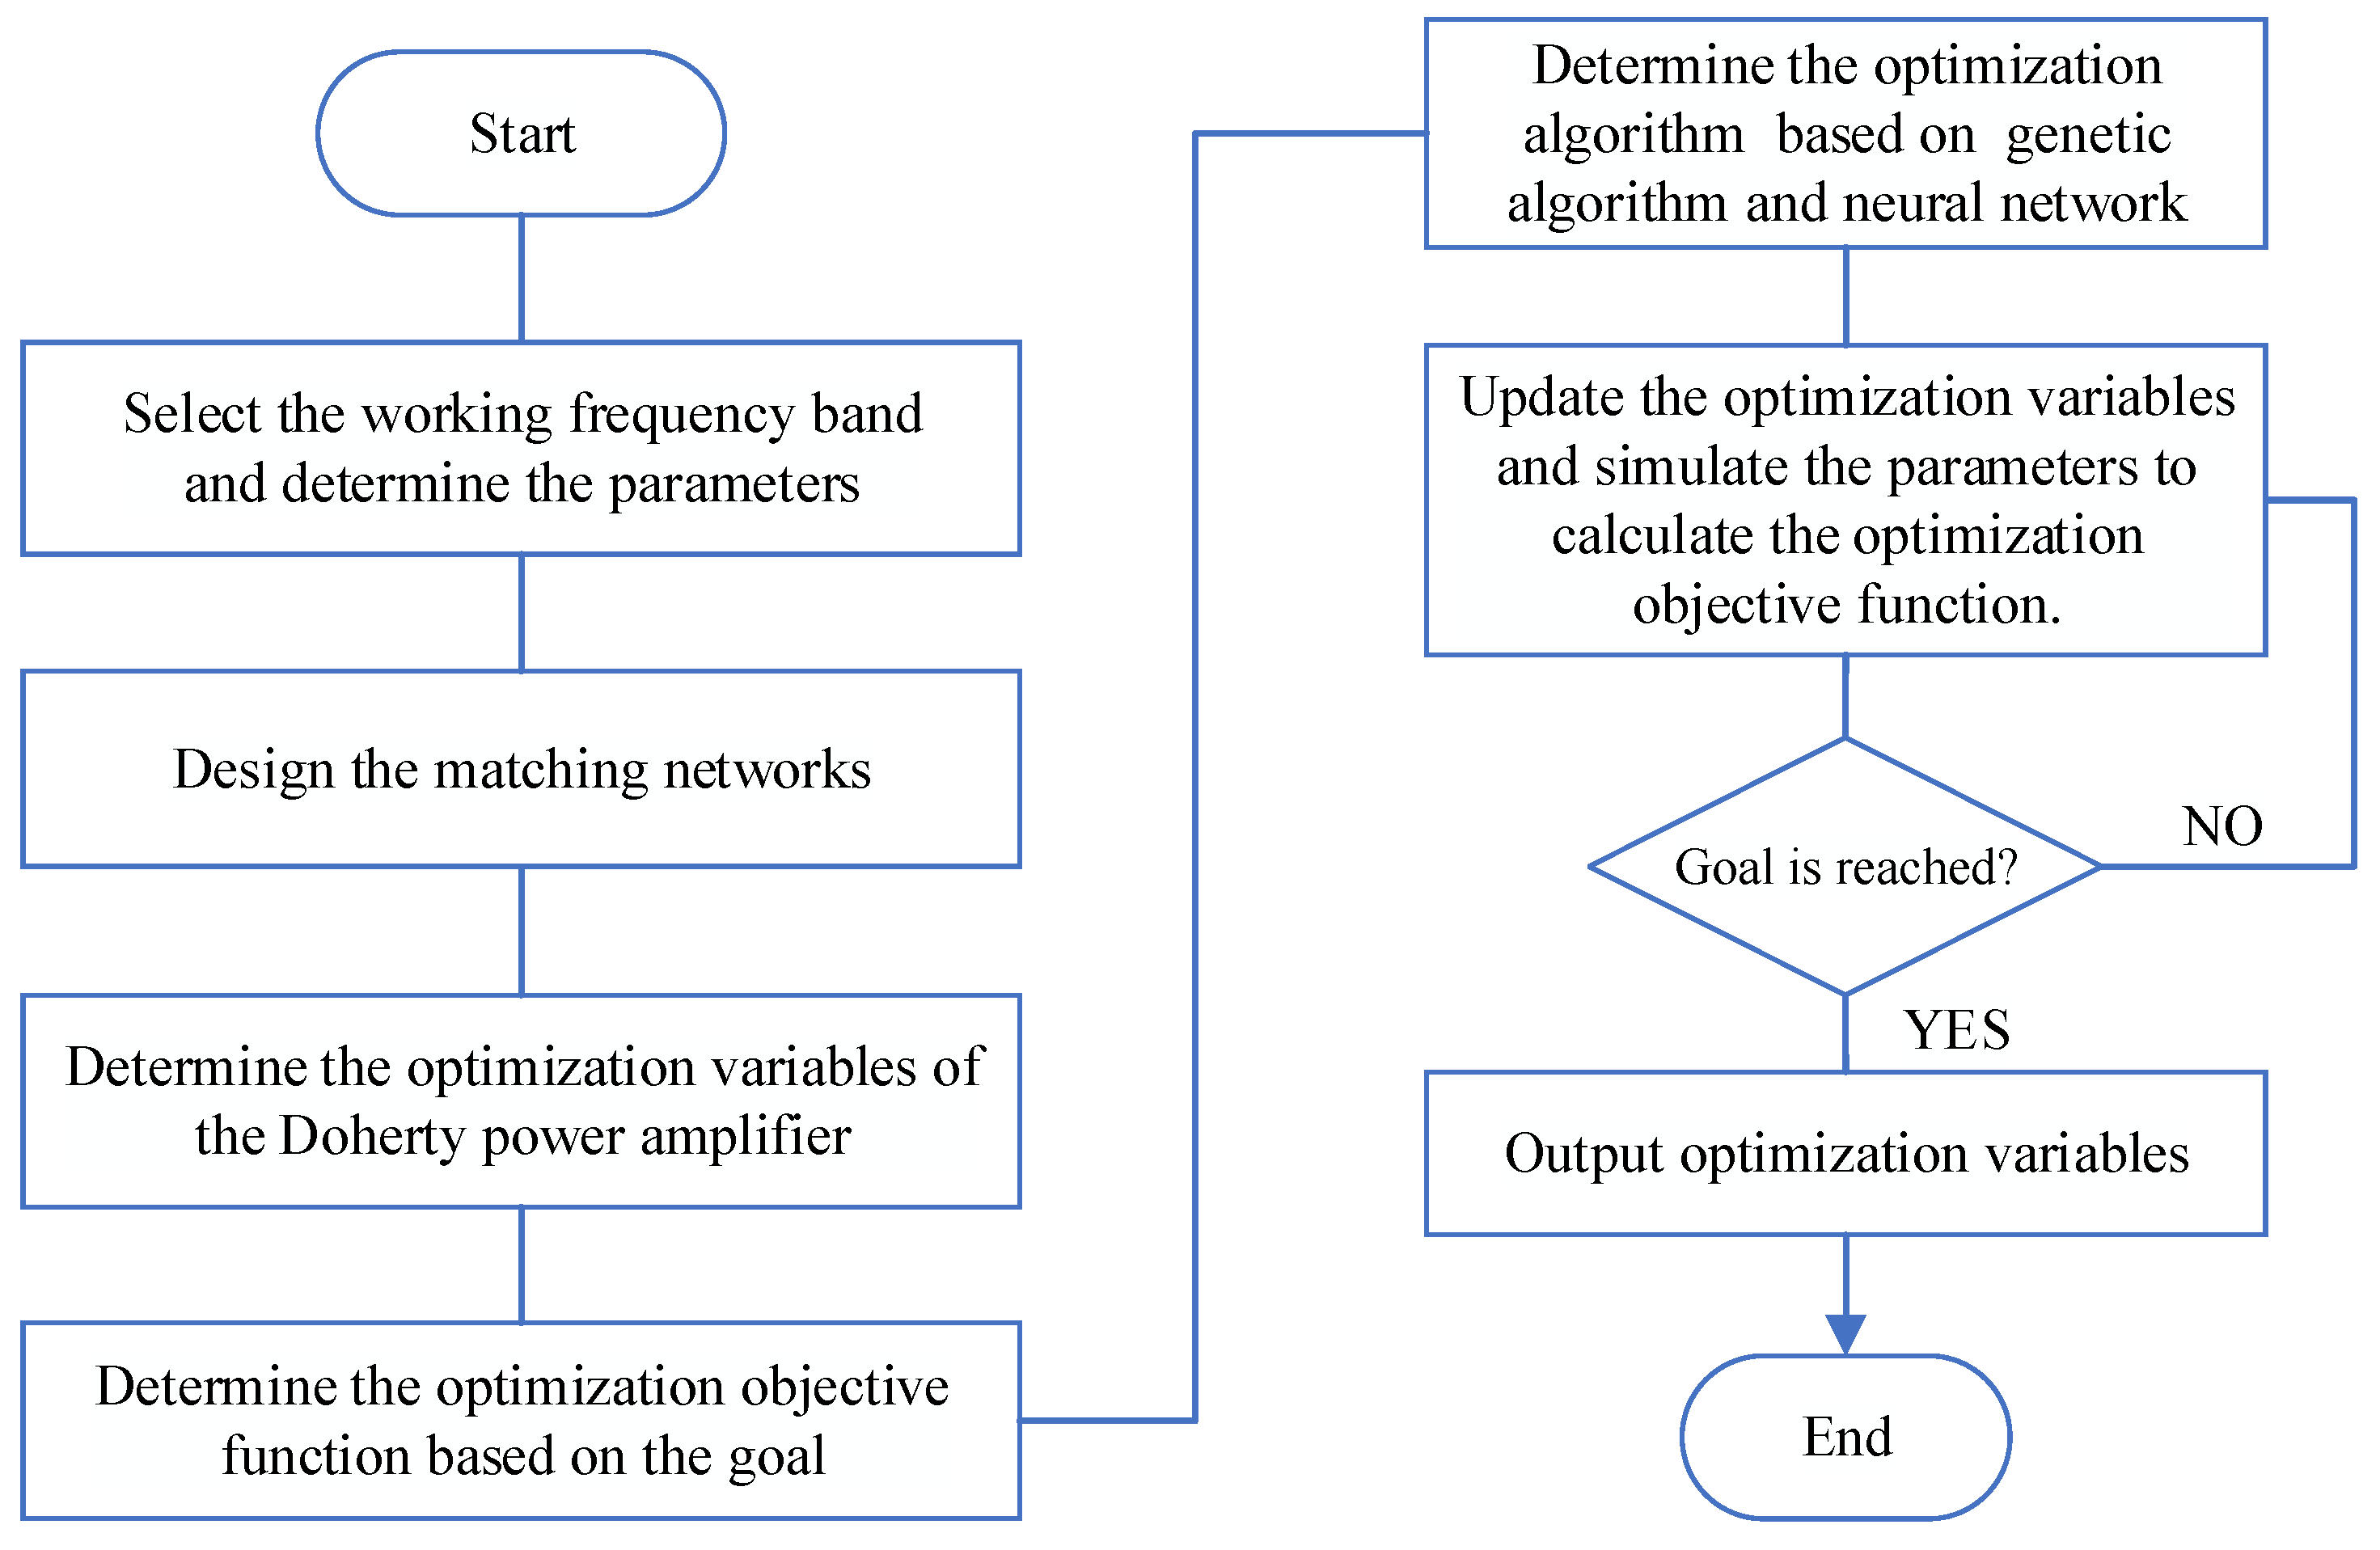
For the optimization and design of a high-efficiency broadband Doherty power amplifier, the design methodology is illustrated in the flowchart shown in
Figure 4.
- 3.
Objective Function Design
For the optimization and design of broadband power amplifiers, optimizing performance at a single frequency point is insufficient to meet the overall performance requirements. Therefore, applying a holistic approach to broadband power amplifier design is particularly important.
To address issues commonly found in traditional Doherty power amplifier designs—such as complex matching networks, potential efficiency degradation, and narrow operating bandwidth—this project proposes a novel design method. Specifically, a minimization-based approach is adopted for the design of the objective function. The core idea is as follows: if the maximum values of the various performance metrics within the operating bandwidth can be minimized while still satisfying the optimization goals, then the performance across the entire operating frequency range can also meet the desired specifications.
The target values in the objective function are as follows: O_P_out is the target value of saturated power, O_DE_sat is the target value of saturated efficiency, O_Gain_sat is the target value of saturated gain, O_DE_6dB is the target value of 6 dB back-off efficiency, O_Gain_6dB is the target value of 6 dB back-off gain, and O_Gain_30 is the target value of gain at 30 dBm output power. P_out(fpi) is the saturated output power at the design frequency point fpi, DE_sat(fpi) is the saturated efficiency at fpi, Gain_sat(fpi) is the saturated gain at fpi, DE_6dB(fpi) is the 6 dB back-off efficiency at fpi, Gain_6dB(fpi) is the 6 dB back-off gain at fpi, and Gain_30(fpi) is the gain at 30 dBm output power at fpi, which can be obtained through simulation.
All the above objective functions are expected to be less than or equal to 1. According to the formula of the objective function, the function value can be less than or equal to 1 only when the minimum values of indicators such as power, efficiency, and gain reach or exceed the target values.
The final objective function F is defined as the maximum value among the individual objective functions mentioned above. When the maximum value of these objective functions is less than or equal to 1, it implies that all other objective functions are also less than or equal to 1, and the corresponding performance metrics such as power, efficiency, and gain have reached or exceeded their respective target values.
- 4.
Matching Network Design
For the broadband power amplifier, the optimized frequency range is 1.5 GHz to 2.6 GHz. The structural diagram of the high-efficiency broadband Doherty power amplifier (DPA) is shown in
Figure 5.
The matching networks are composed of stepped-impedance matching sections, which are commonly employed in RF power amplifier design for their ability to achieve broadband impedance matching. The matching network for the carrier power amplifier is shown in
Figure 6 and
Figure 7, while the matching network for the peaking power amplifier is illustrated in
Figure 8 and
Figure 9. The combiner matching network structure is shown in
Figure 10.
- 5.
Optimization of the DPA
This section focuses on the optimization design of the input matching network, output matching network, and combiner matching network of the high-efficiency broadband DPA, involving a total of 32 optimization variables.
To achieve high-efficiency broadband Doherty power amplifier optimization, a hybrid algorithm is applied to the design of the DPA operating in the 1.5 GHz to 2.6 GHz range. With a frequency step of 100 MHz, a total of 12 optimization frequency points are selected. For the DPA within the 1.5–2.6 GHz range, the optimization targets for efficiency, output power, and gain are listed in
Table 2. When the minimum values of efficiency and output power across all frequency points in the band meet the optimization requirements, the overall power amplifier is considered to satisfy the design criteria.
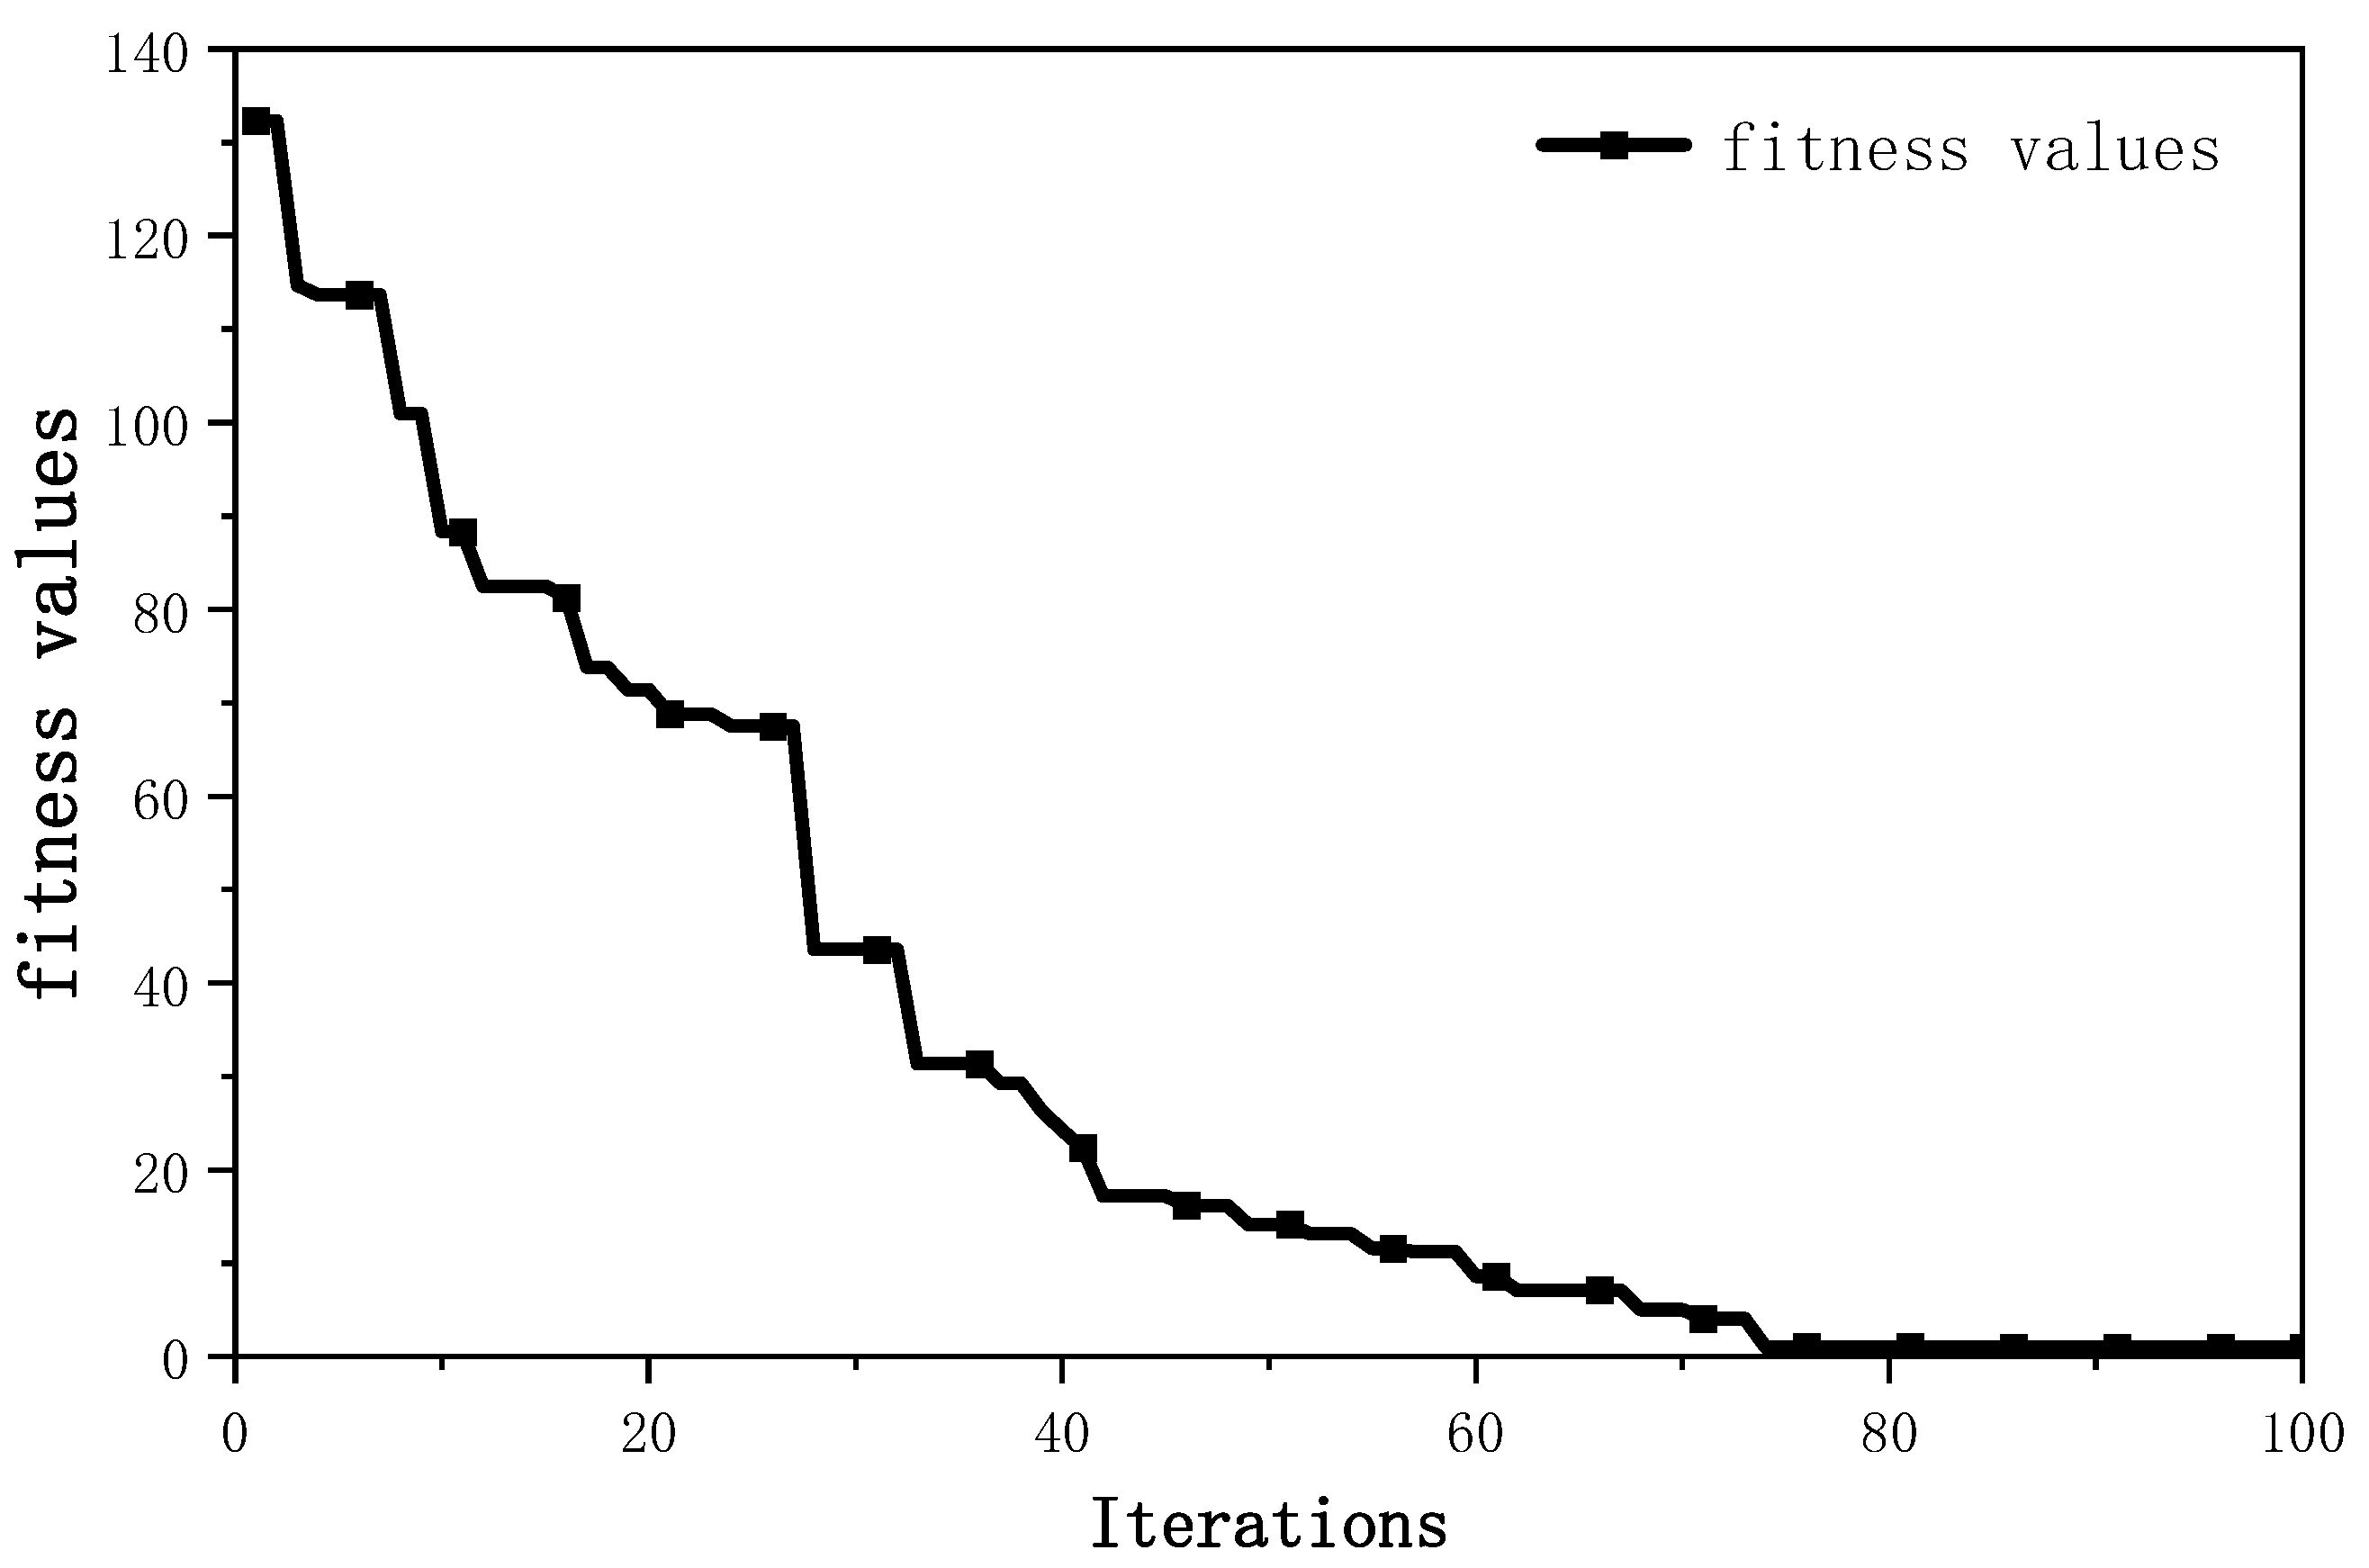
The parameters for the optimization algorithm used in the process are set as follows: population size of 100, number of iterations of 100, initial mutation strength
set to 0.15, and
set to 0.5. Additionally, a penalty value is introduced—when the set targets are not met, the fitness value is significantly increased. This approach enhances diversity and benefits the neural network’s prediction performance. The results are shown in
Figure 11, where the improved algorithm reaches the optimization goals around the 75th generation.
The optimal matching network parameters obtained from the optimization of the high-efficiency broadband DPA are listed in
Table 3.
The complete schematic of the Doherty power amplifier is shown in
Figure 12.
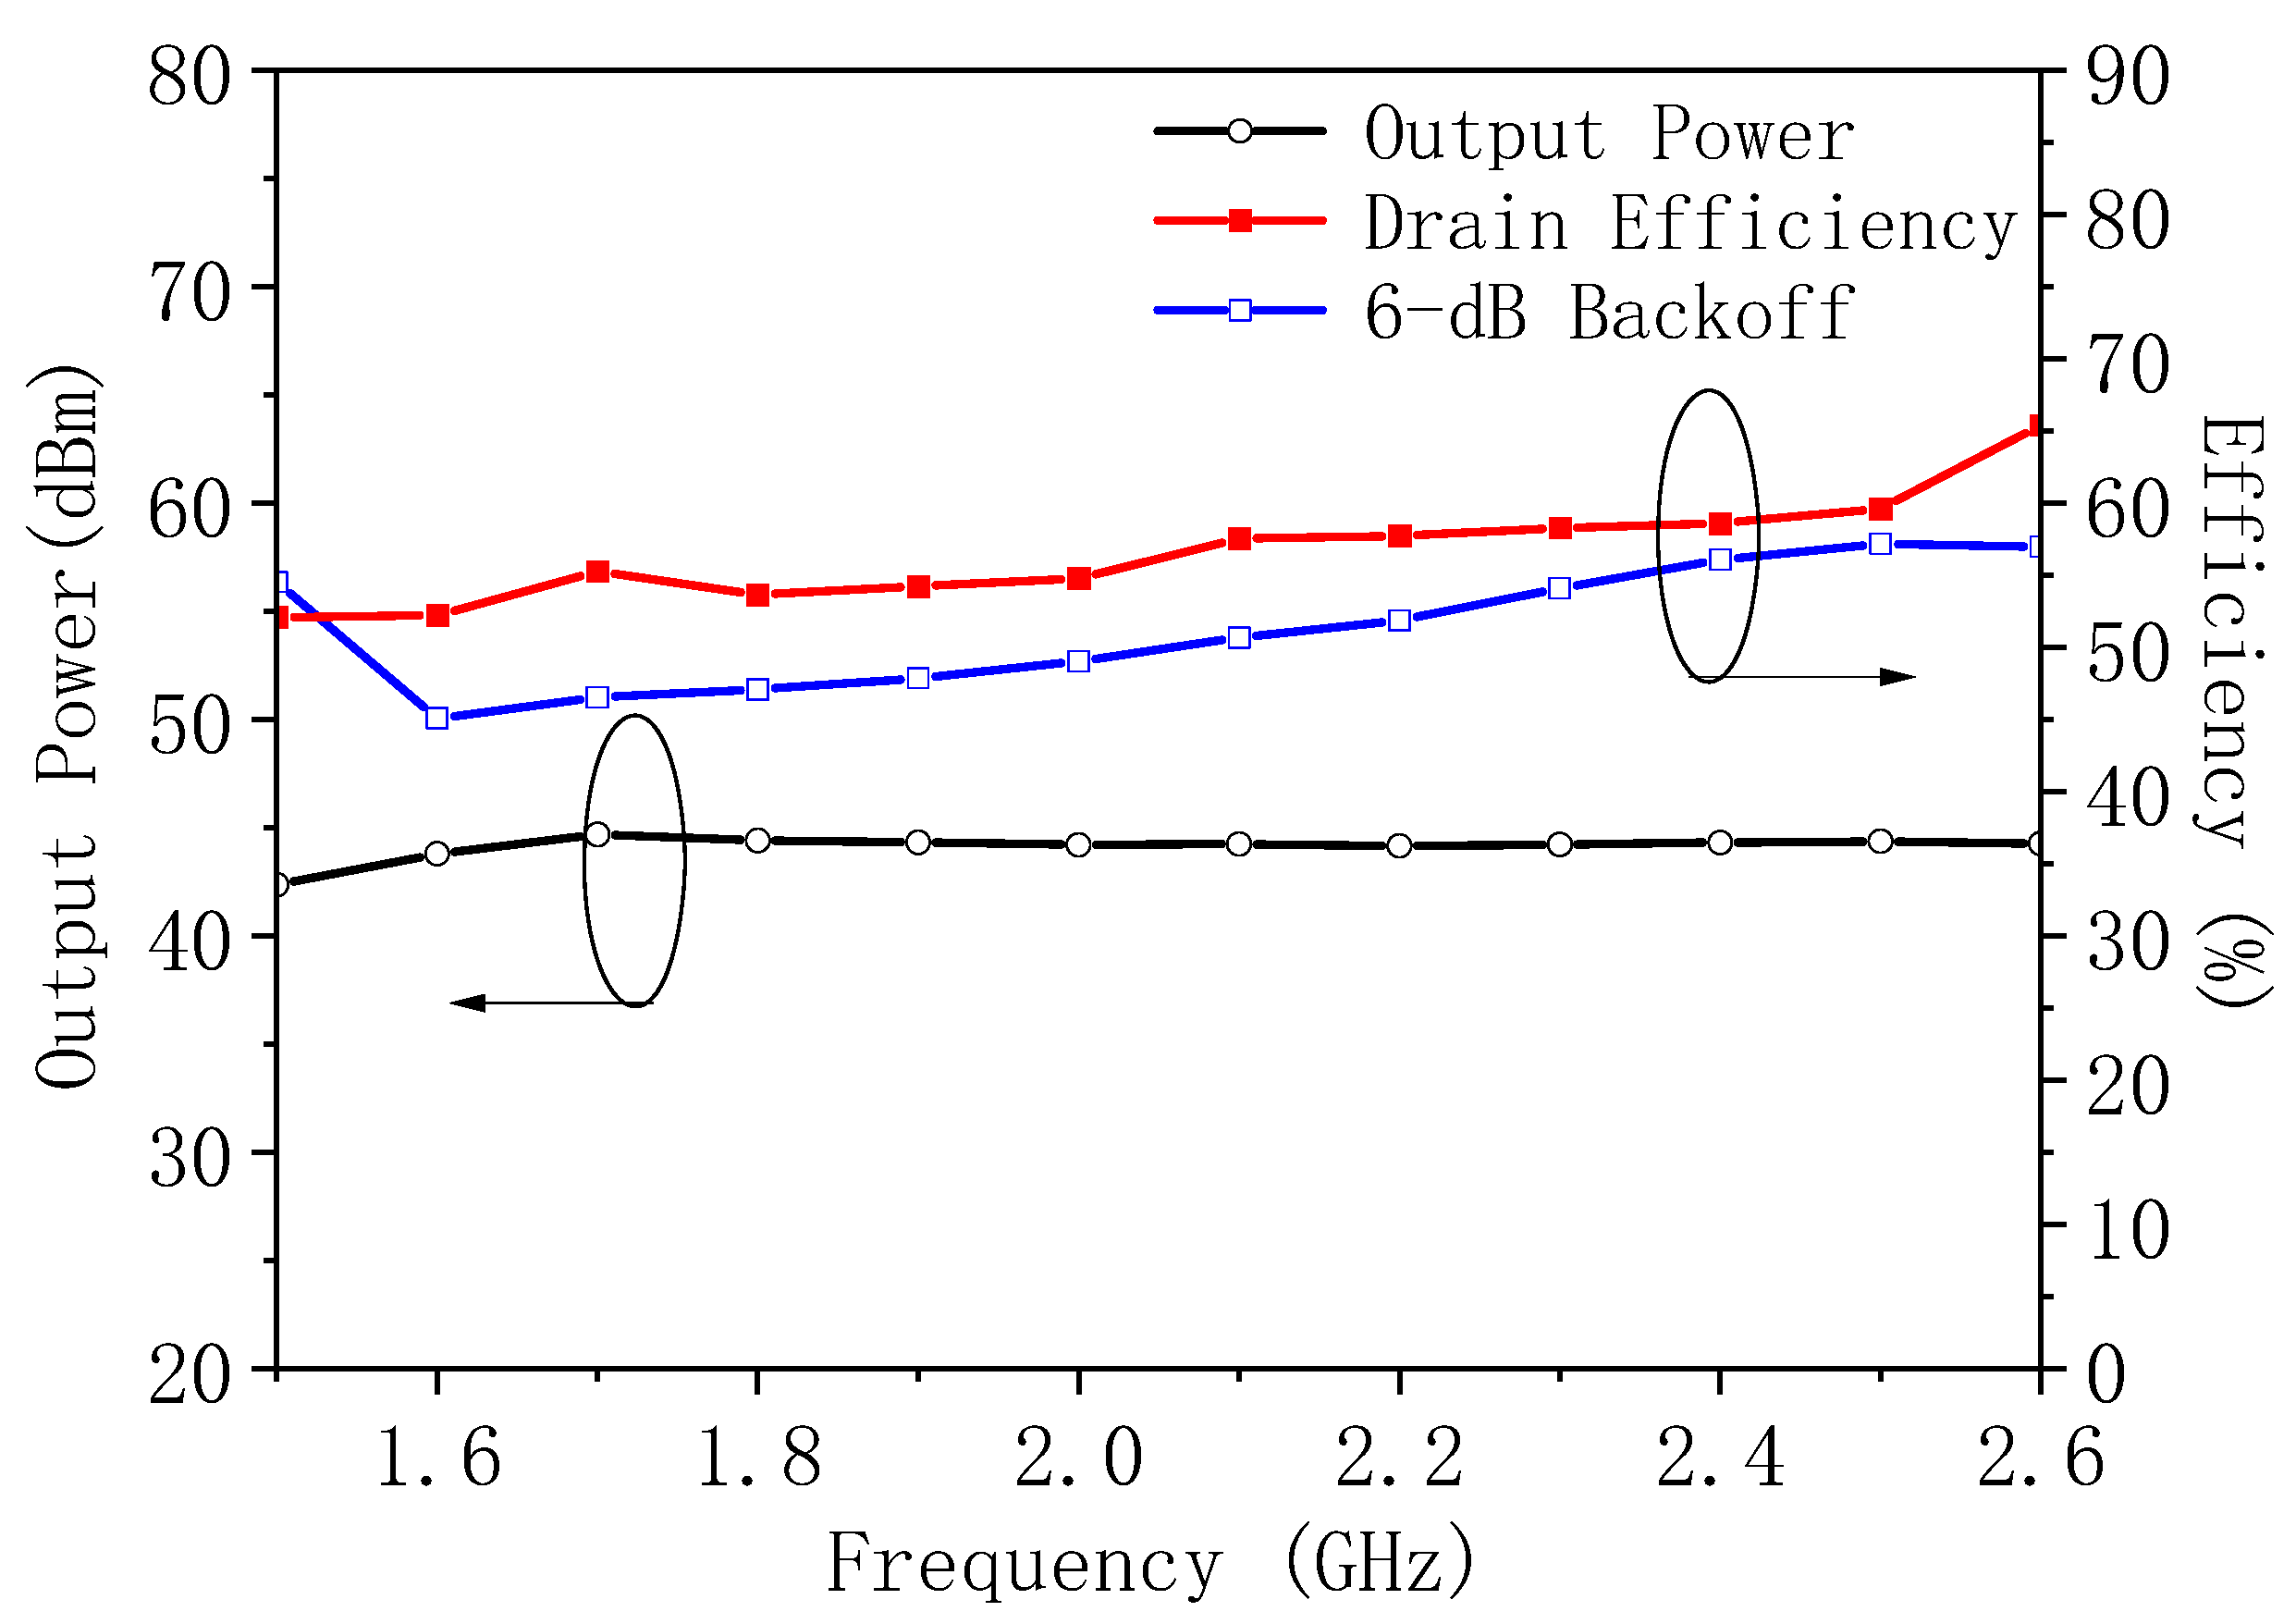
The optimized Doherty power amplifier was simulated, and the results are shown in
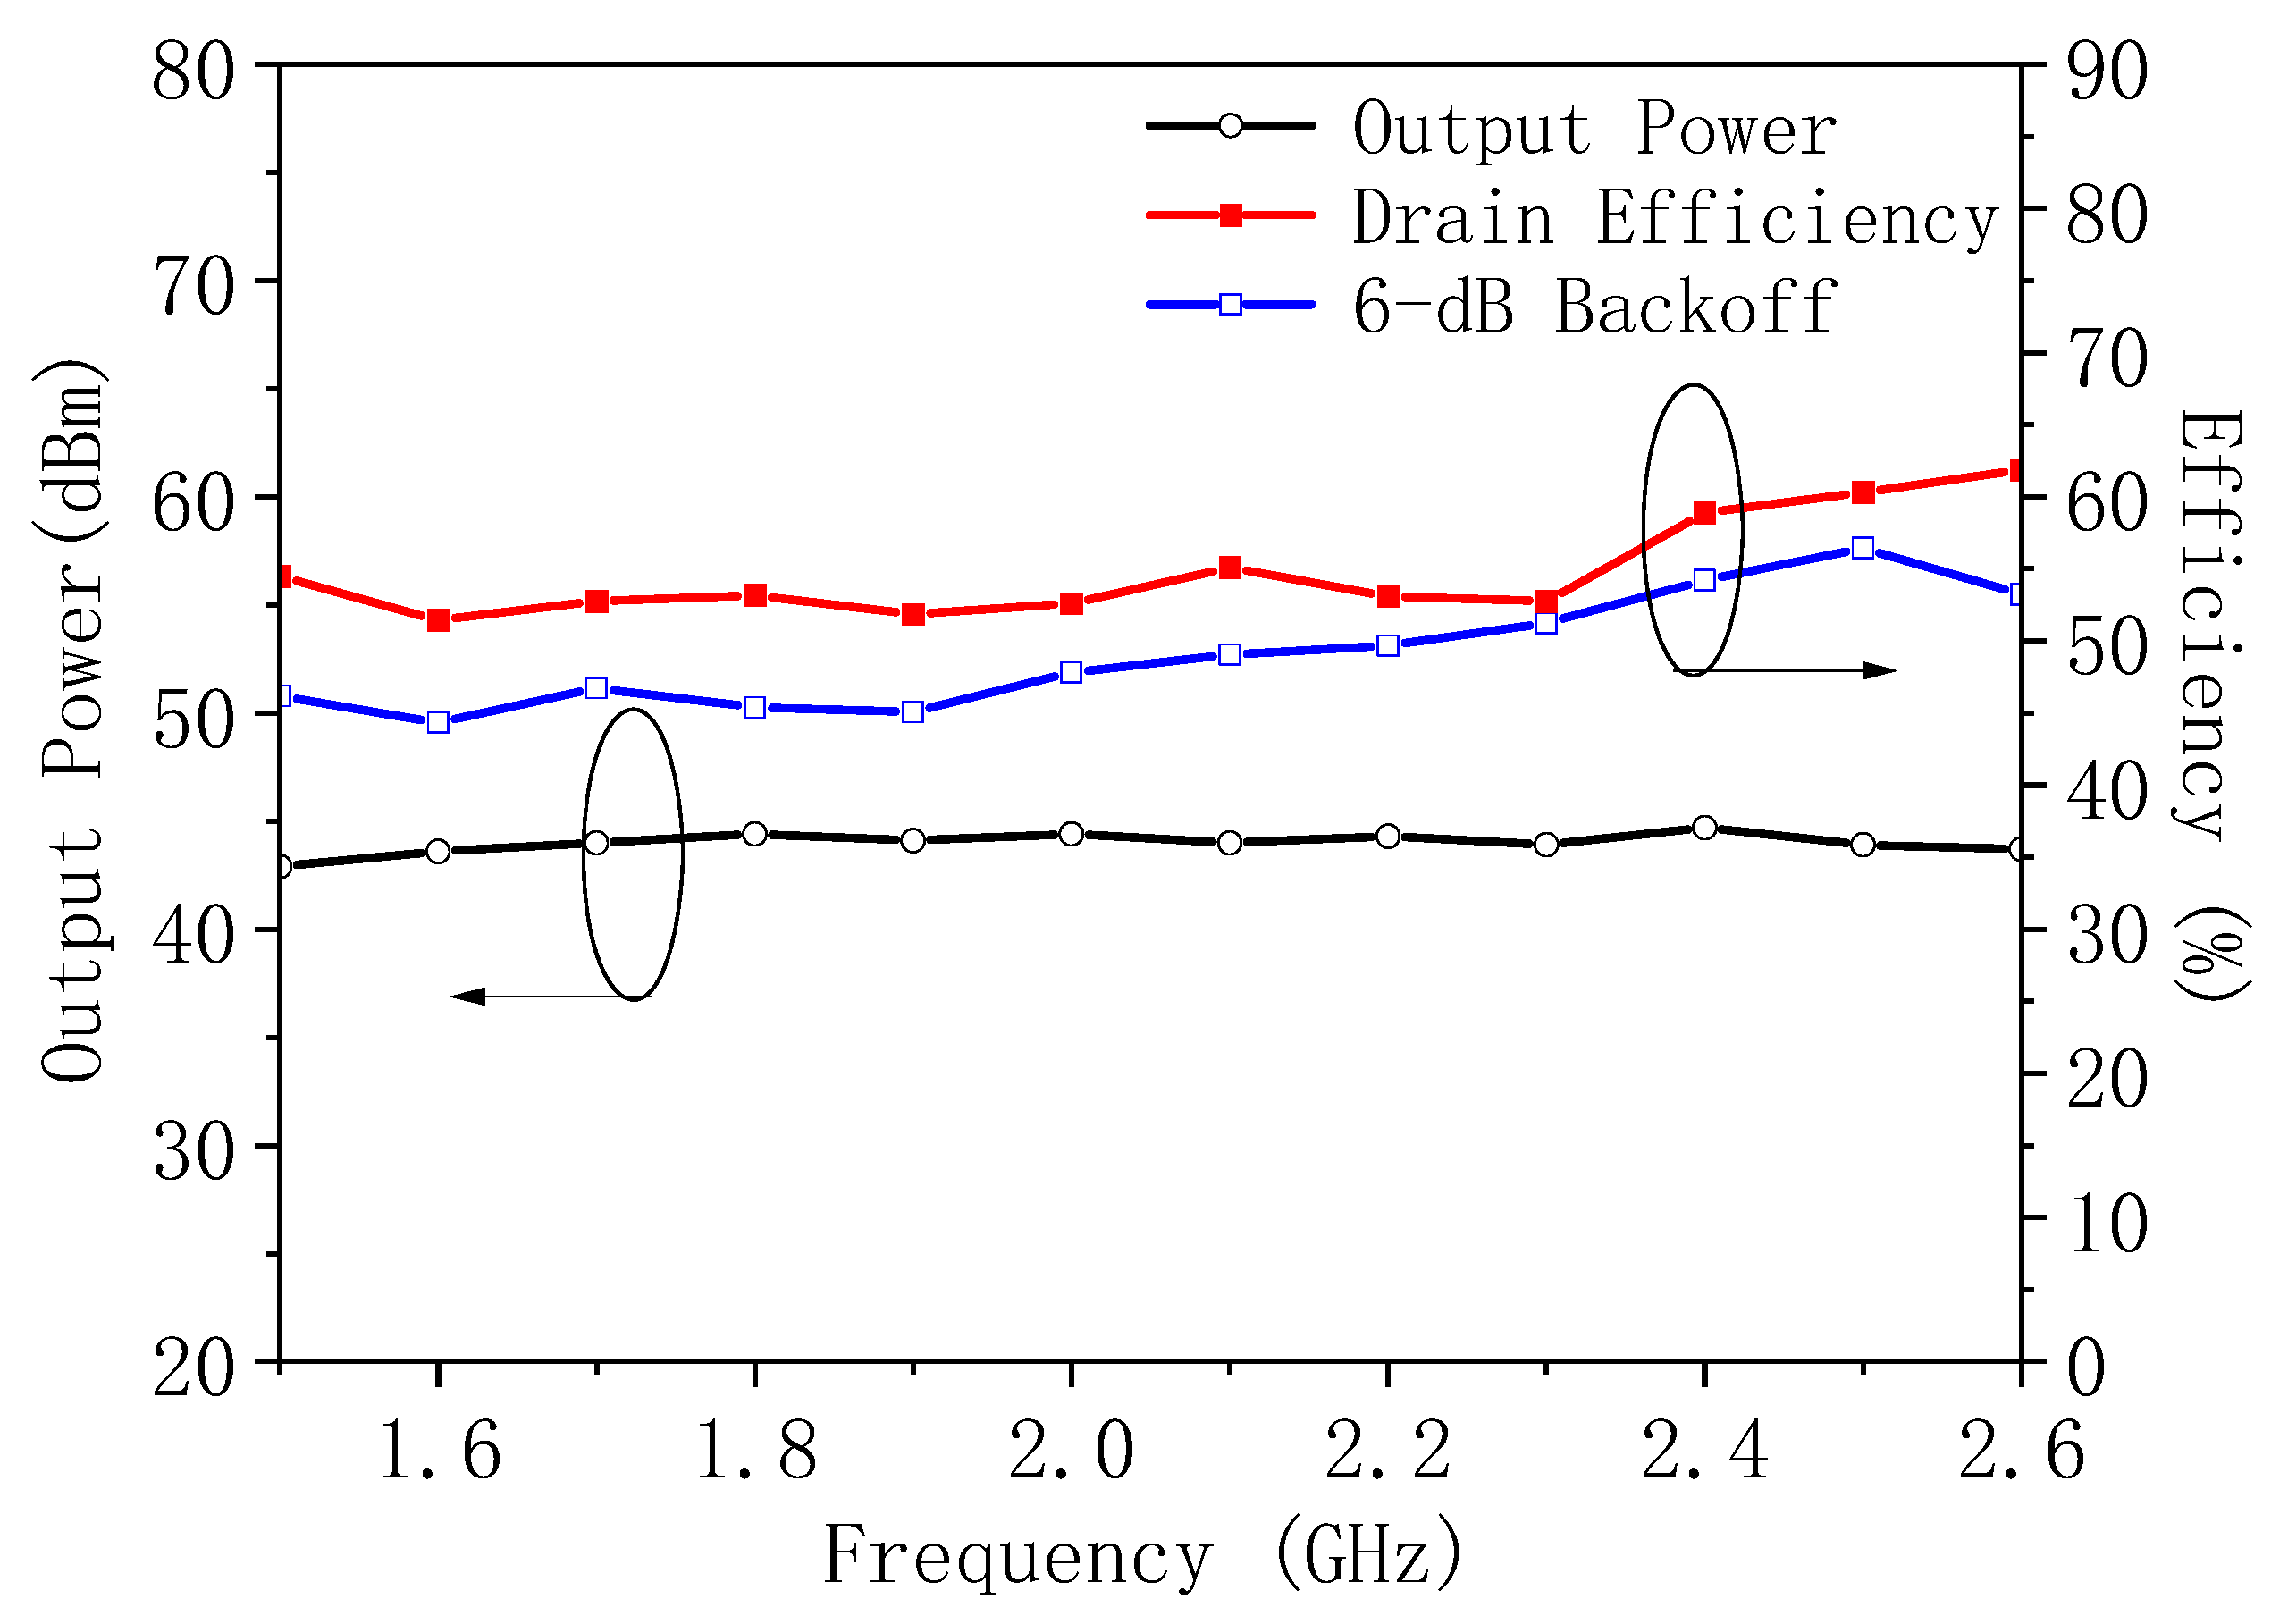
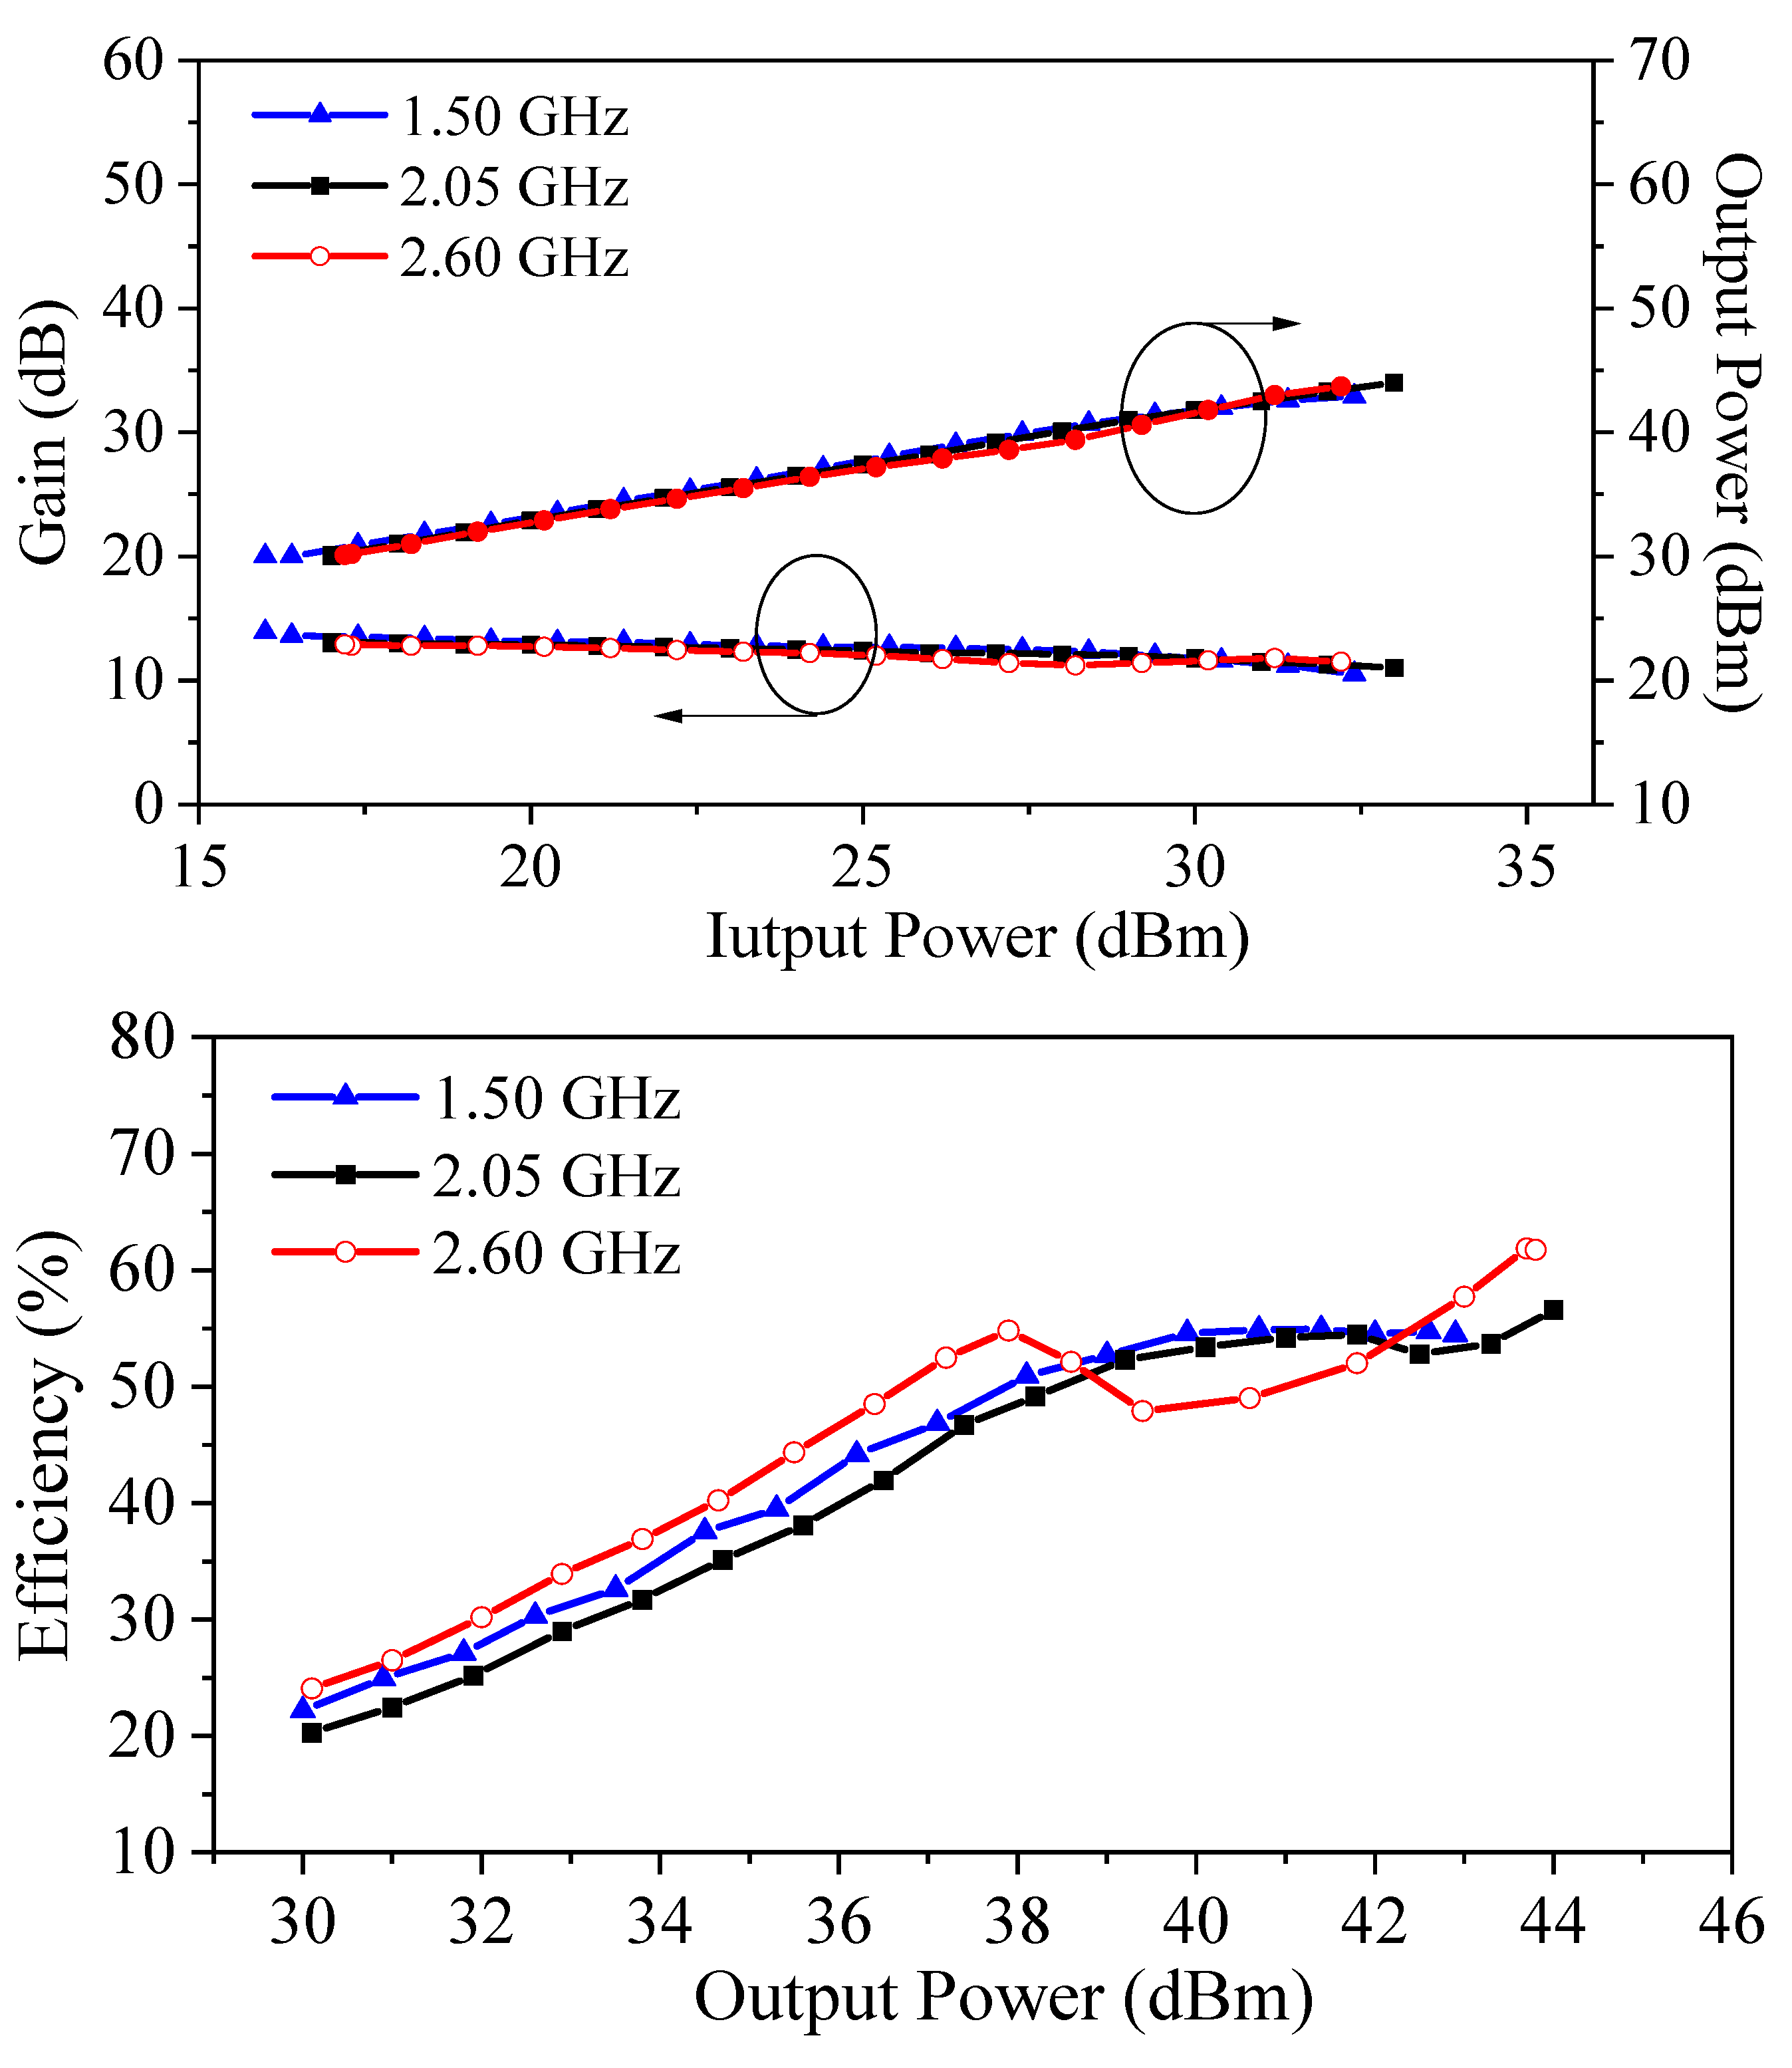
Figure 13. From the simulation, it can be observed that the designed power amplifier achieves a saturated efficiency ranging from 52% to 65.3% across the entire bandwidth. The efficiency at 6 dB power back-off ranges from 47% to 57.1%, and the saturated output power varies between 42.3 dBm and 44.6 dBm.
- 6.
Algorithm comparison
This section focuses on the comparison between the GA and GA + NN algorithms. The algorithm parameters is set as 0.15 and is set as 0.5. The experimental platform consists of an Intel 13900HX processor, an NVIDIA RTX 4060 Laptop GPU, 32 GB of RAM, ADS 2019 and MATLAB 2024a.
Firstly, the population size is set to 30 and maximum number of iterations is 50. The time required to execute the simulation is illustrated in
Figure 14.
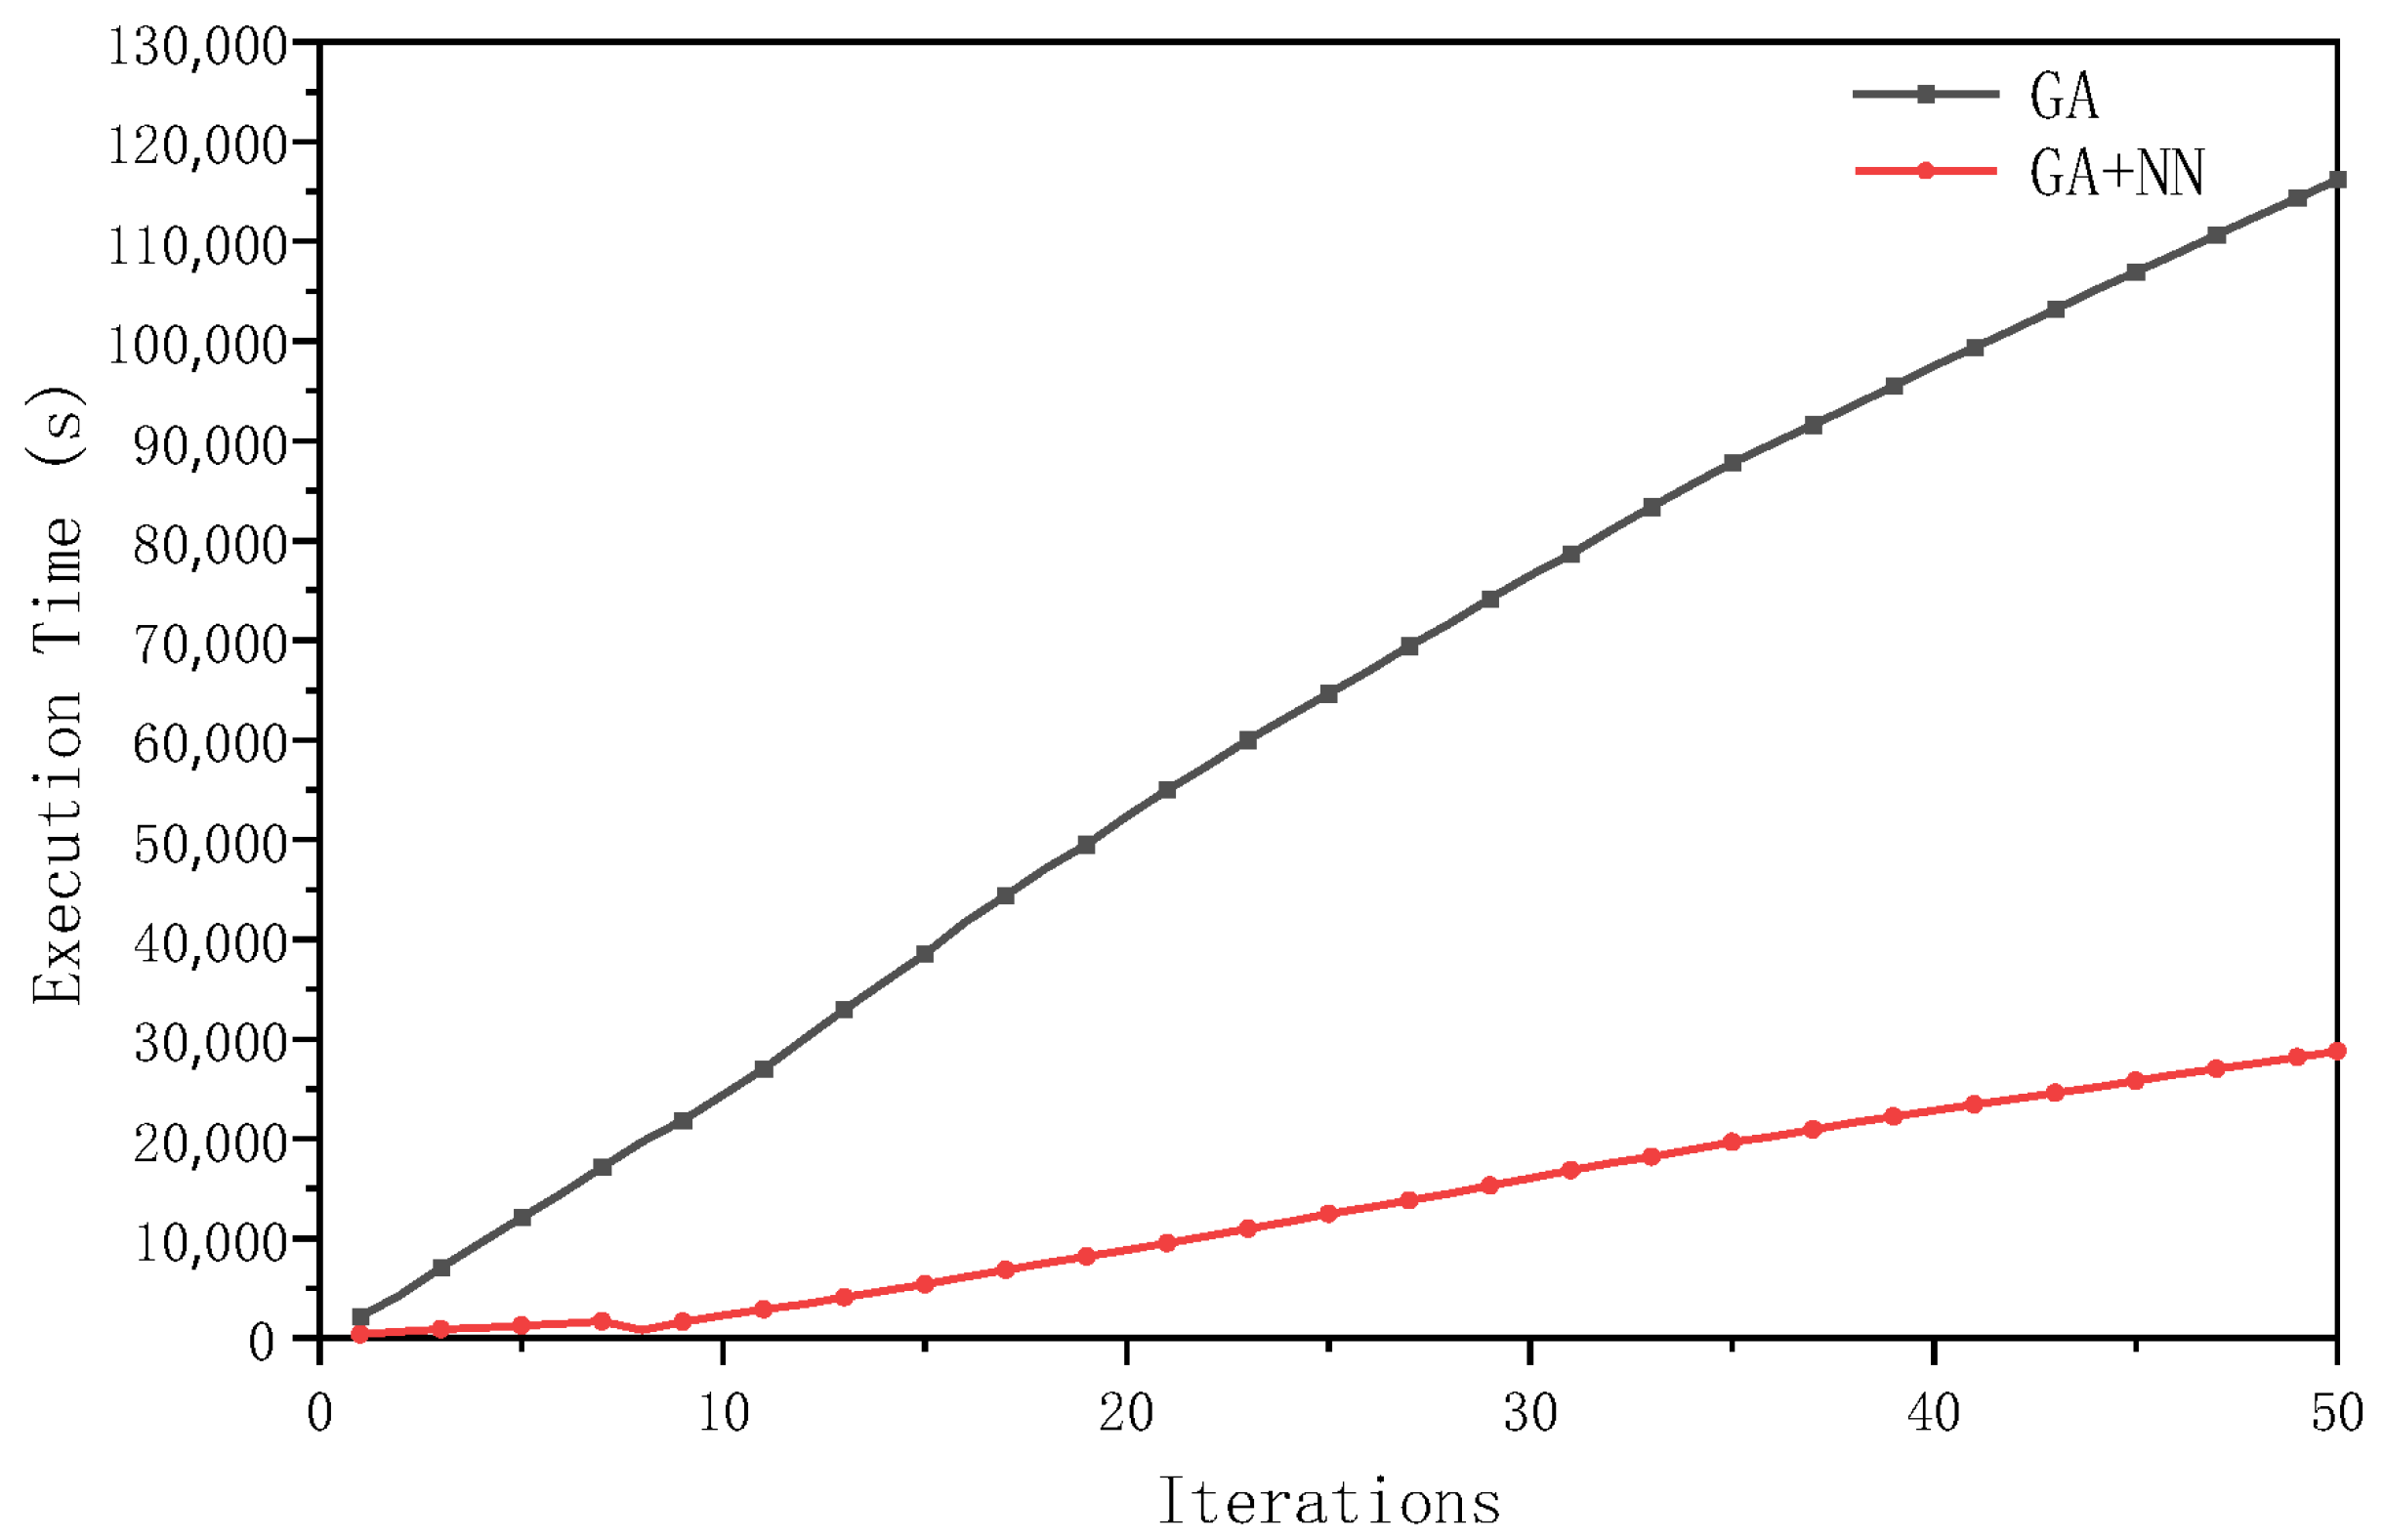
Secondly, the population size is set to 100 and the maximum number of iterations is 50. The time required to execute the simulation is illustrated in
Figure 15.
The comparative results of computational efficiency between the GA and GA + NN algorithms are presented in
Table 4. For the 30 × 50 scale, the GA takes an average of 20.8 s to simulate one individual, whereas the GA + NN algorithm significantly reduces this time to 6.5 s. This represents a 68.7% reduction in simulation time when using GA + NN compared to GA. For the 100 × 50 scale, the GA requires an average of 23.2 s per simulation of one individual. In contrast, the GA + NN algorithm further decreases the simulation time to 5.8 s, indicating a 75% reduction compared to the GA. The integration of neural networks with genetic algorithms results in a substantial reduction in simulation time.
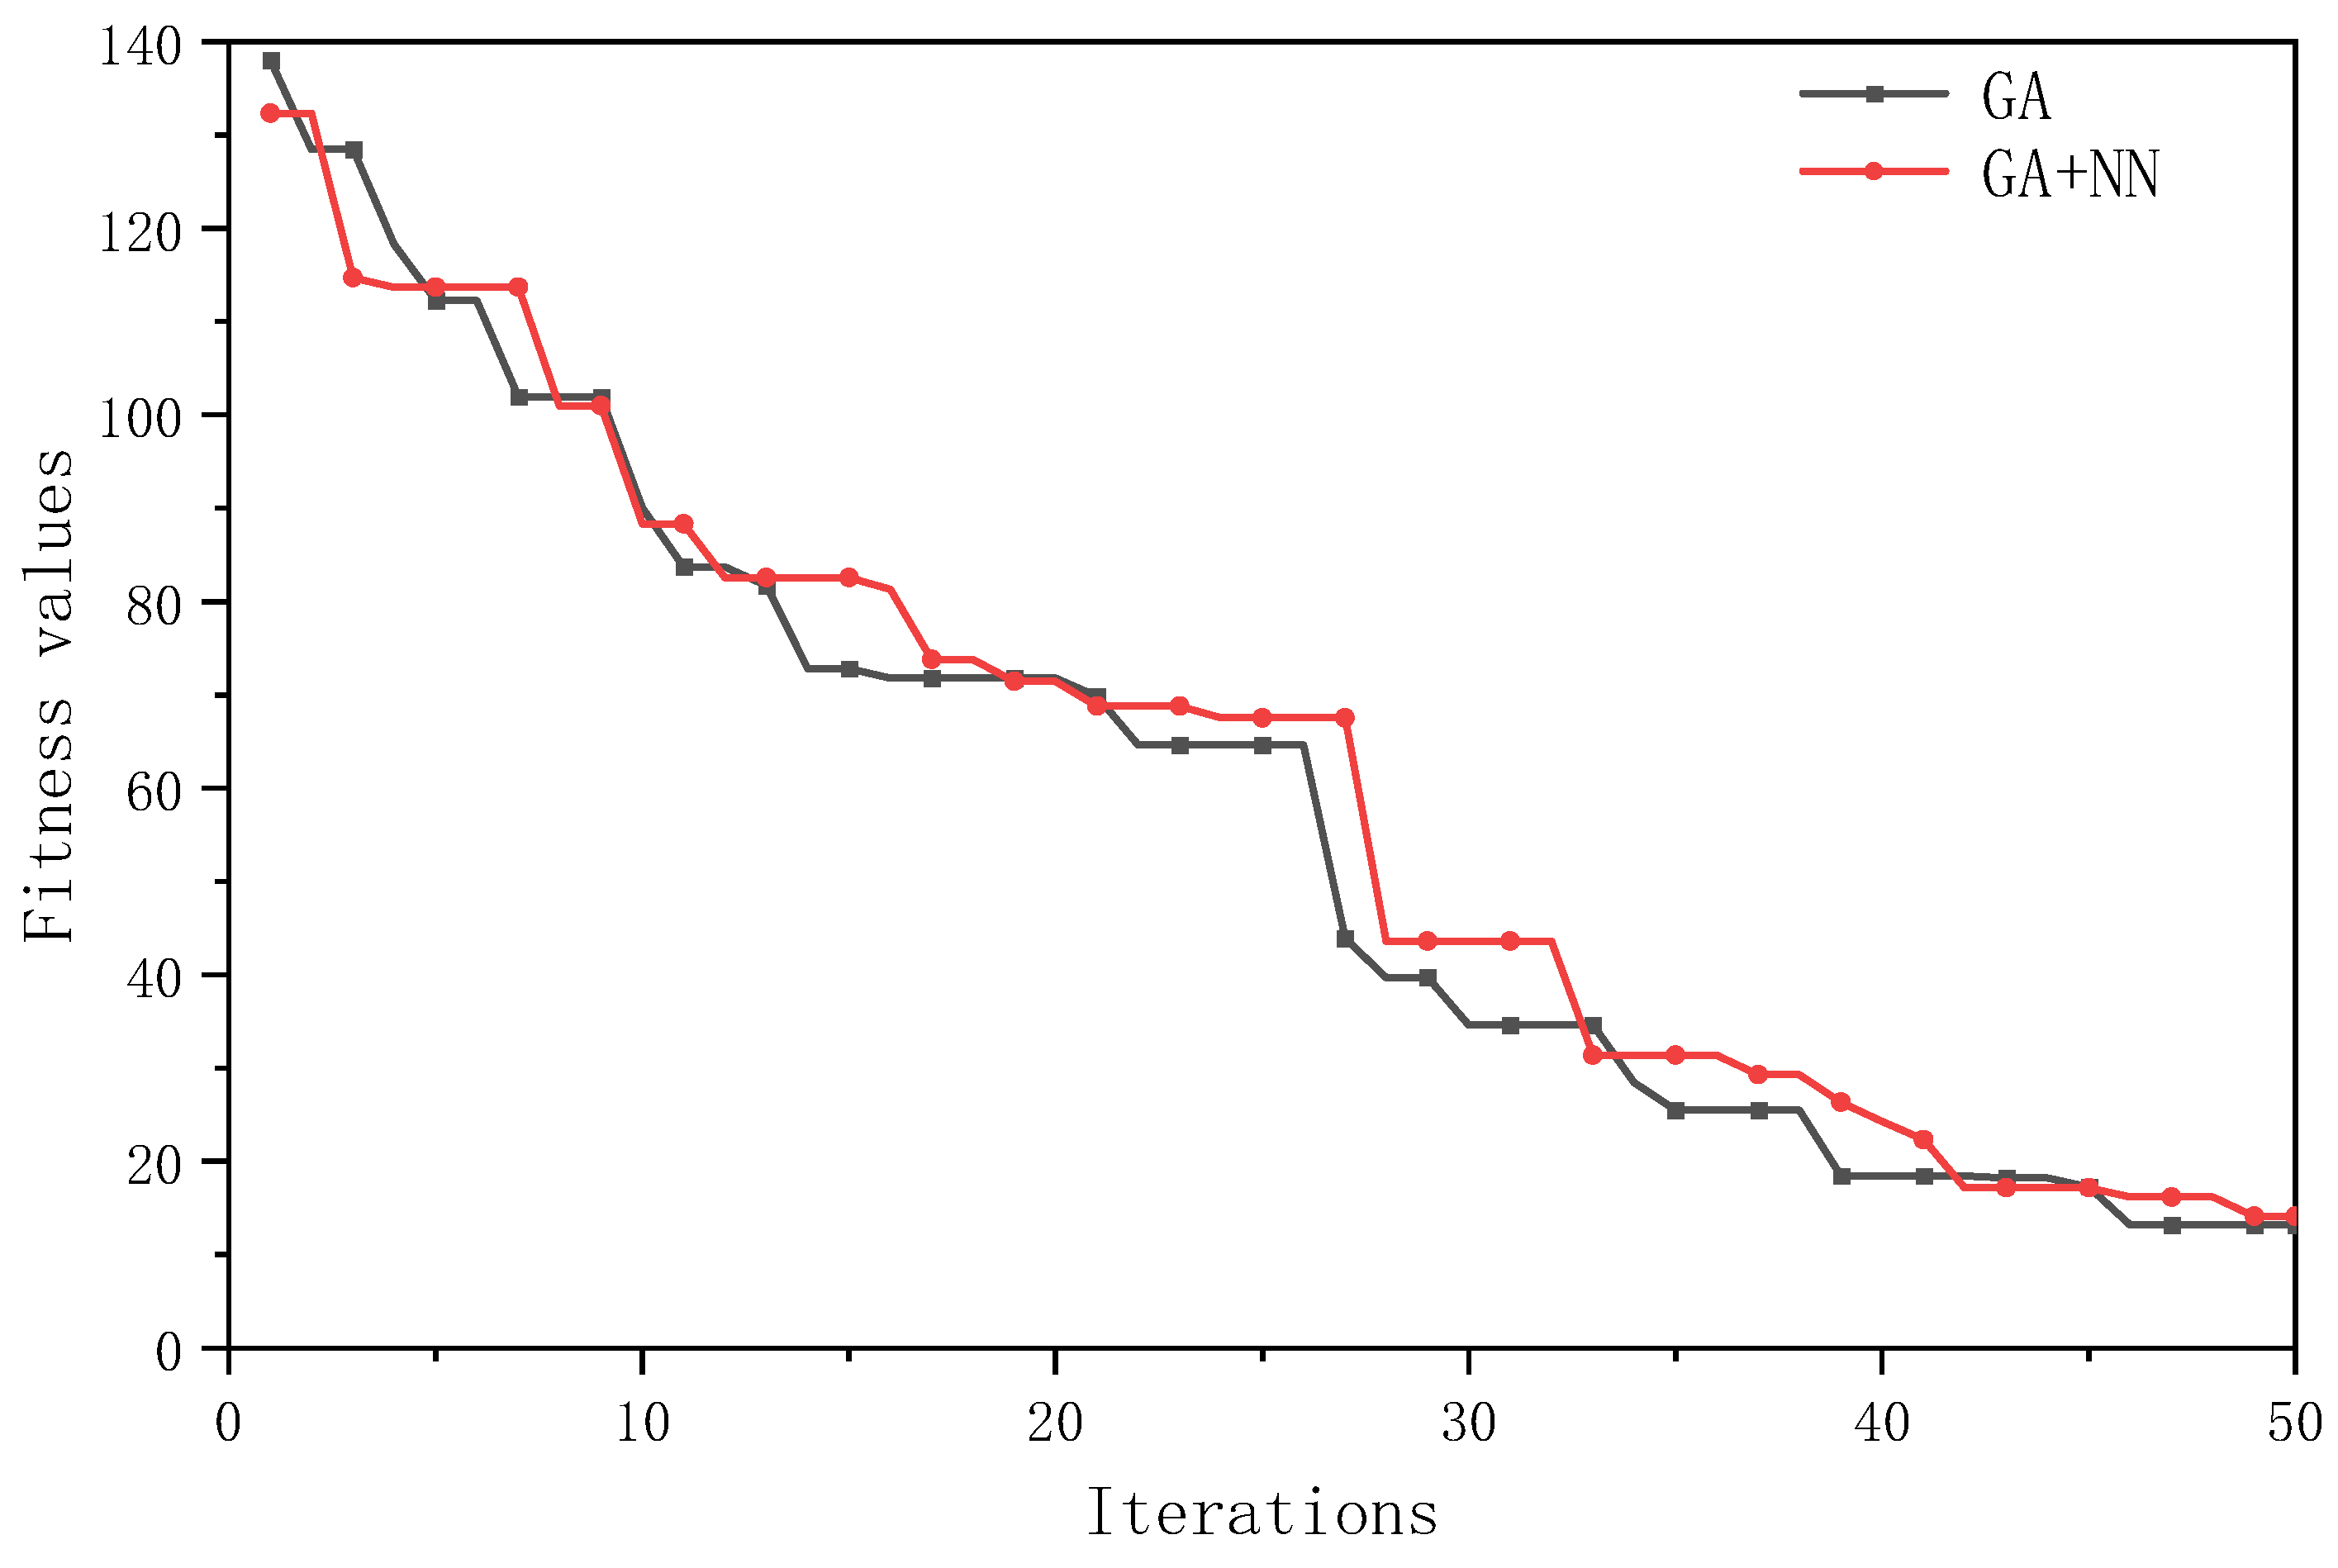
For the 100 × 50 scale, the fitness values of both algorithms exhibit a downward trend as the number of iterations increases, as shown in
Figure 16. The overall performance difference between the two algorithms is not significant. Both algorithms are capable of converging to the optimal solution.
