Article

Mitigation Technique Using a Hybrid Energy Storage and Time-of-Use (TOU) Approach in Photovoltaic Grid Connection

by
Mohammad Reza Maghami
1,2,*,
Jagadeesh Pasupuleti
3,*,
Arthur G. O. Mutambara
2 and
Janaka Ekanayake
4
1
Strategic Research Institute (SRI), Asia Pacific University of Technology and Innovation (APU), Technology Park Malaysia, Kuala Lumpur 57000, Malaysia
2
Institute for the Future of Knowledge (IFK), University of Johannesburg, Johannesburg 2092, South Africa
3
Institute of Sustainable Energy, Universiti Tenaga Nasional, Jalan Ikram-Uniten, Kajang 43000, Malaysia
4
Electrical and Electronic Engineering, University of Peradeniya, Peradeniya 20400, Sri Lanka
*
Authors to whom correspondence should be addressed.
Technologies 2025, 13(8), 339; https://doi.org/10.3390/technologies13080339
Submission received: 14 July 2025 / Revised: 31 July 2025 / Accepted: 3 August 2025 / Published: 5 August 2025

Abstract

This study investigates the impact of Time-of-Use (TOU) scheduling and battery energy storage systems (BESS) on voltage stability in a typical Malaysian medium-voltage distribution network with high photovoltaic (PV) system penetration. The analyzed network comprises 110 nodes connected via eight feeders to a pair of 132/11 kV, 15 MVA transformers, supplying a total load of 20.006 MVA. Each node is integrated with a 100 kW PV system, enabling up to 100% PV penetration scenarios. A hybrid mitigation strategy combining TOU-based load shifting and BESS was implemented to address voltage violations occurring, particularly during low-load night hours. Dynamic simulations using DIgSILENT PowerFactory were conducted under worst-case (no load and peak load) conditions. The novelty of this research is the use of real rural network data to validate a hybrid BESS–TOU strategy, supported by detailed sensitivity analysis across PV penetration levels. This provides practical voltage stabilization insights not shown in earlier studies. Results show that at 100% PV penetration, TOU or BESS alone are insufficient to fully mitigate voltage drops. However, a hybrid application of 0.4 MWh BESS with 20% TOU load shifting eliminates voltage violations across all nodes, raising the minimum voltage from 0.924 p.u. to 0.951 p.u. while reducing active power losses and grid dependency. A sensitivity analysis further reveals that a 60% PV penetration can be supported reliably using only 0.4 MWh of BESS and 10% TOU. Beyond this, hybrid mitigation becomes essential to maintain stability. The proposed solution demonstrates a scalable approach to enable large-scale PV integration in dense rural grids and addresses the specific operational characteristics of Malaysian networks, which differ from commonly studied IEEE test systems. This work fills a critical research gap by using real local data to propose and validate practical voltage mitigation strategies.

1. Introduction

A voltage violation occurs when the voltage levels in a power grid drop below a certain threshold, potentially leading to equipment damage, power outages, and other issues. In the context of large-scale photovoltaic (PV) systems, voltage failure can result from the intermittent nature of solar power generation. As PV penetration in power grids increases, voltage fluctuations become more frequent, increasing the risk of voltage failure. Various techniques can be employed to mitigate voltage failure in large-scale PV power systems [1]. One commonly used method is reactive power control, which involves adjusting the reactive power output of generators and compensating devices to regulate voltage levels. This can be achieved using voltage regulators, capacitors, and other reactive power compensation devices. Another technique is voltage control, which entails adjusting the voltage set-points of generators and compensating devices. Voltage control is typically implemented using automatic voltage regulators (AVRs) and other voltage control equipment. Demand response (DR) is another effective strategy for mitigating voltage failures. It involves reducing load demand during periods of high solar power generation to balance energy output and consumption, thereby ensuring that voltage remains within safe limits [2,3].

1.1. Literature Review

Several studies have investigated the impact of large-scale PV penetration on power systems and proposed solutions to mitigate voltage failures [4]. The increasing penetration of PV systems in the electricity grid can be effectively managed by integrating BESS and TOU strategies. Battery storage systems are essential for managing the intermittent nature of PV output [5,6]. They operate by storing surplus energy when solar generation is high and releasing it when solar availability is low or absent. This process contributes to a steady and reliable power supply and helps mitigate grid fluctuations. Moreover, BESS enables peak load management by discharging stored energy during demand surges, thereby enhancing PV utilization and reducing reliance on traditional generation sources. Additionally, battery units support the grid by providing services such as voltage stabilization and frequency control, which improve overall reliability and grid performance. TOU strategies complement PV system integration by incentivizing consumers to adjust their electricity consumption patterns. Through TOU pricing and incentives, consumers are encouraged to shift their electricity usage to periods of high PV generation [7]. This approach maximizes solar energy utilization and reduces the reliance on grid-supplied electricity during peak demand hours. Moreover, load shifting allows consumers to schedule high-energy consumption activities, such as running appliances or charging electric vehicles, during periods of high PV system generation [8]. This optimization of consumption patterns contributes to improved grid stability and enables grid operators to better integrate PV systems while balancing supply and demand dynamics.
The integration of battery energy storage systems and the implementation of ToU strategies are effective means of managing the challenges associated with PV system penetration [9]. BESs smooth out intermittency, provide peak shaving capabilities, and enhance grid stability by offering ancillary services. TOU strategies incentivize consumers to align their electricity usage with PV system generation, thereby maximizing self-consumption and reducing grid strain during peak hours. Combining these approaches, the grid can efficiently accommodate higher levels of PV system penetration, ensuring grid stability, reliability, and optimal use of renewable energy resources. For instance, a study by [10] proposed an adaptive voltage control strategy to maintain voltage stability in a power system with high PV system penetration. The strategy involved adjusting the voltage set-points of the power system based on the solar irradiance and load demand forecasts. Another study by [11] proposed a coordinated control strategy for a hybrid energy storage system and reactive power compensation devices to mitigate voltage fluctuations in a power system with high PV system penetration. The strategy involved using the energy storage system to absorb excess solar power during high-irradiance periods and release stored energy during low-irradiance periods to maintain voltage stability. Energy storage enables the capture of excess solar energy during periods of high generation and its subsequent release during periods of low generation or peak demand, thereby mitigating solar power intermittency. This approach not only enhances grid stability but also allows consumers to leverage TOU tariffs, reducing electricity costs by using stored solar energy during peak pricing hours [12].
Hybrid mitigation techniques that combine multiple techniques, such as active or reactive power control, DR, and BESS, can also mitigate voltage failure in large-scale PV power systems. These techniques involve the integration of different mitigation strategies to achieve optimal voltage stability and reliability. For example, a hybrid mitigation technique involving reactive power control and BESS can be used to mitigate voltage fluctuations in power systems with high PV penetration. This technique involves using reactive power control to regulate the voltage levels and using BESS to store excess PV energy during periods of low load demand and release it during periods of high load demand. A study [4] proposed a hybrid mitigation technique using demand response and community battery energy storage to mitigate voltage failure in a power system with high PV system penetration. The technique involved using demand response to reduce the load demand during high solar power generation periods and using battery energy storage to store excess solar power during periods of low load demand and release it during periods of high load demand. A study [13] proposed a hybrid mitigation technique for voltage regulation in a power system with high PV penetration. The technique involved a combination of reactive power control, BESS, and demand response to maintain voltage stability and avoid voltage collapse. This study demonstrated that the hybrid mitigation technique effectively reduced voltage fluctuations and maintained voltage stability in the power system. In another study by [14], a hybrid mitigation technique was proposed for frequency regulation in a power system with high PV penetration. The technique involved a combination of BESS and demand response to balance power supply and demand and maintain frequency stability. This study demonstrated that the hybrid mitigation technique effectively reduced frequency deviations and maintained frequency stability in the power system. Table 1 presents a review of recent mitigation techniques in the field of TOU.

1.2. Research Problem and Gaps

A notable shortcoming in current research is the lack of comprehensive evaluation methods for large-scale PV systems distributed across wide geographic areas. While previous studies have primarily focused on single-location PV systems or smaller clusters in confined areas, expansive networks comprising multiple PV units have received less attention. Furthermore, research is needed on integrating BESS with these networks to support efficient load distribution and peak demand reduction. Studies on the large-scale use of storage in PV integration remain limited. Another issue is the tendency to model loads and PV units as static PQ nodes, overlooking their dynamic behavior and interaction with the grid. Many referenced studies rely on IEEE or U.S. distribution models, which often represent networks with only a few customers per transformer—unlike Malaysian grids that serve significantly larger customer bases per unit. Despite increasing interest in distributed generation, there remains a clear lack of research on real-world rural multi-node PV networks, particularly those with extended feeders and high load dispersion, as seen in developing regions. Most prior studies rely on simplified or urban-centric models, which do not fully capture the operational challenges of rural grids under high PV penetration. Recent research on urban PV applications, such as tracking systems for energy-efficient buildings and modular shading devices, demonstrates the versatility of PV technology [20,21]. This study, however, focuses on rural network challenges.

1.3. Research Aim and Objectives

In this study, a novel hybrid mitigation technique using BESS and TOU was employed to improve the network voltage profile. This study identifies technical barriers related to high-penetration PV scenarios to facilitate the integration of PV into the grid and to secure it against failure. Figure 1 shows a single-line diagram of the proposed 132/11 kV power distribution network for the power factory. A dynamic power flow simulation was performed based on two worst-case scenarios—no load and peak load—to identify weak points in the network. This study aimed to achieve the following objectives:
  • To analyze voltage violations, power losses, and grid power using PF dynamic simulation;
  • To examine the effect of BESS integration on voltage violations, power losses, and grid power;
  • To investigate the impact of TOU on network voltage, power losses, and grid power;
  • To study the impact of hybrid mitigation techniques using TOU and BESS on the network.

1.4. Novelty and Contribution

While previous studies have examined the integration of BESS with DR or TOU pricing in power distribution networks, most focus on idealized or small-scale models and do not address the unique challenges of rural grids. This study advances the field by undertaking the following:
  • Applying a hybrid BESS–TOU approach to a real, large-scale Malaysian rural network, using actual utility data for both load and topology;
  • Systematically analyzing the impact of varying PV penetration, BESS sizing, and TOU participation on node-level voltage stability and network power losses;
  • Demonstrating the operational benefits of distributed (node-level) BESS deployment—an approach not commonly investigated in the previous literature—particularly for rural feeders with high impedance and long line lengths.
These innovations provide actionable guidance for improving voltage stability and renewable integration in rural distribution systems, addressing gaps left by recent works that focus on more urbanized or idealized scenarios. This study contributes to the field by modeling a real Malaysian rural distribution network with 110 nodes, addressing the lack of research on multi-node rural PV systems. It proposes a hybrid mitigation strategy that combines BESS and TOU load shifting, which is more effective in reducing voltage violations and power losses than standalone methods. Using dynamic simulations in DIgSILENT PowerFactory (Version 2021) across various PV penetration levels, this study provides insights into system behavior and control efficiency. A sensitivity analysis further identifies the optimal BESS and TOU configurations. The results offer practical guidance for improving voltage stability and energy efficiency in rural solar-integrated grids.

2. Materials and Methods

This study adopts a structured approach to analyze and enhance voltage stability in distribution networks under various PV system integration levels. The methodology is organized into several key phases, beginning with comprehensive data collection. Information on grid components—such as transformer capacities, feeder configurations, line lengths, bus layouts, and solar irradiation patterns—was obtained from utility providers and used to create a detailed network model. After developing the baseline network topology, simulations were conducted to identify nodes prone to voltage instability. These weak points were detected using time-series voltage analysis under normal and stressed loading conditions. Once these sensitive locations were identified, mitigation strategies were evaluated through multiple experimental scenarios. BESS was deployed at every node to store surplus solar energy during peak generation periods, with the intention of discharging this energy when demand exceeds generation. A TOU demand-shifting strategy was also introduced in a parallel assessment, allowing for the comparison of BESS and TOU both individually and in combination. The methodology included four distinct simulation cases, as shown in Table 2. Case 1 served as the control model without mitigation. Cases 2 and 3 independently tested BESS and TOU, whereas Case 4 examined their combined effect. Each case was assessed under consistent conditions to evaluate improvements in voltage regulation:
  • Acquiring detailed load and PV data and generating system schematics, such as single-line diagrams;
  • Simulating power flows dynamically across the network after deploying 100 kW PV systems at each node;
  • Identifying nodes experiencing the most significant overvoltage or undervoltage conditions;
  • Applying and evaluating mitigation techniques, first independently (BESS and TOU), then as a hybrid system.
This structured framework allowed for a clear comparison of the effectiveness of different mitigation methods in managing voltage fluctuations under increasing PV system penetration, with specific attention to vulnerable areas within the network.

2.1. Network Topology Description

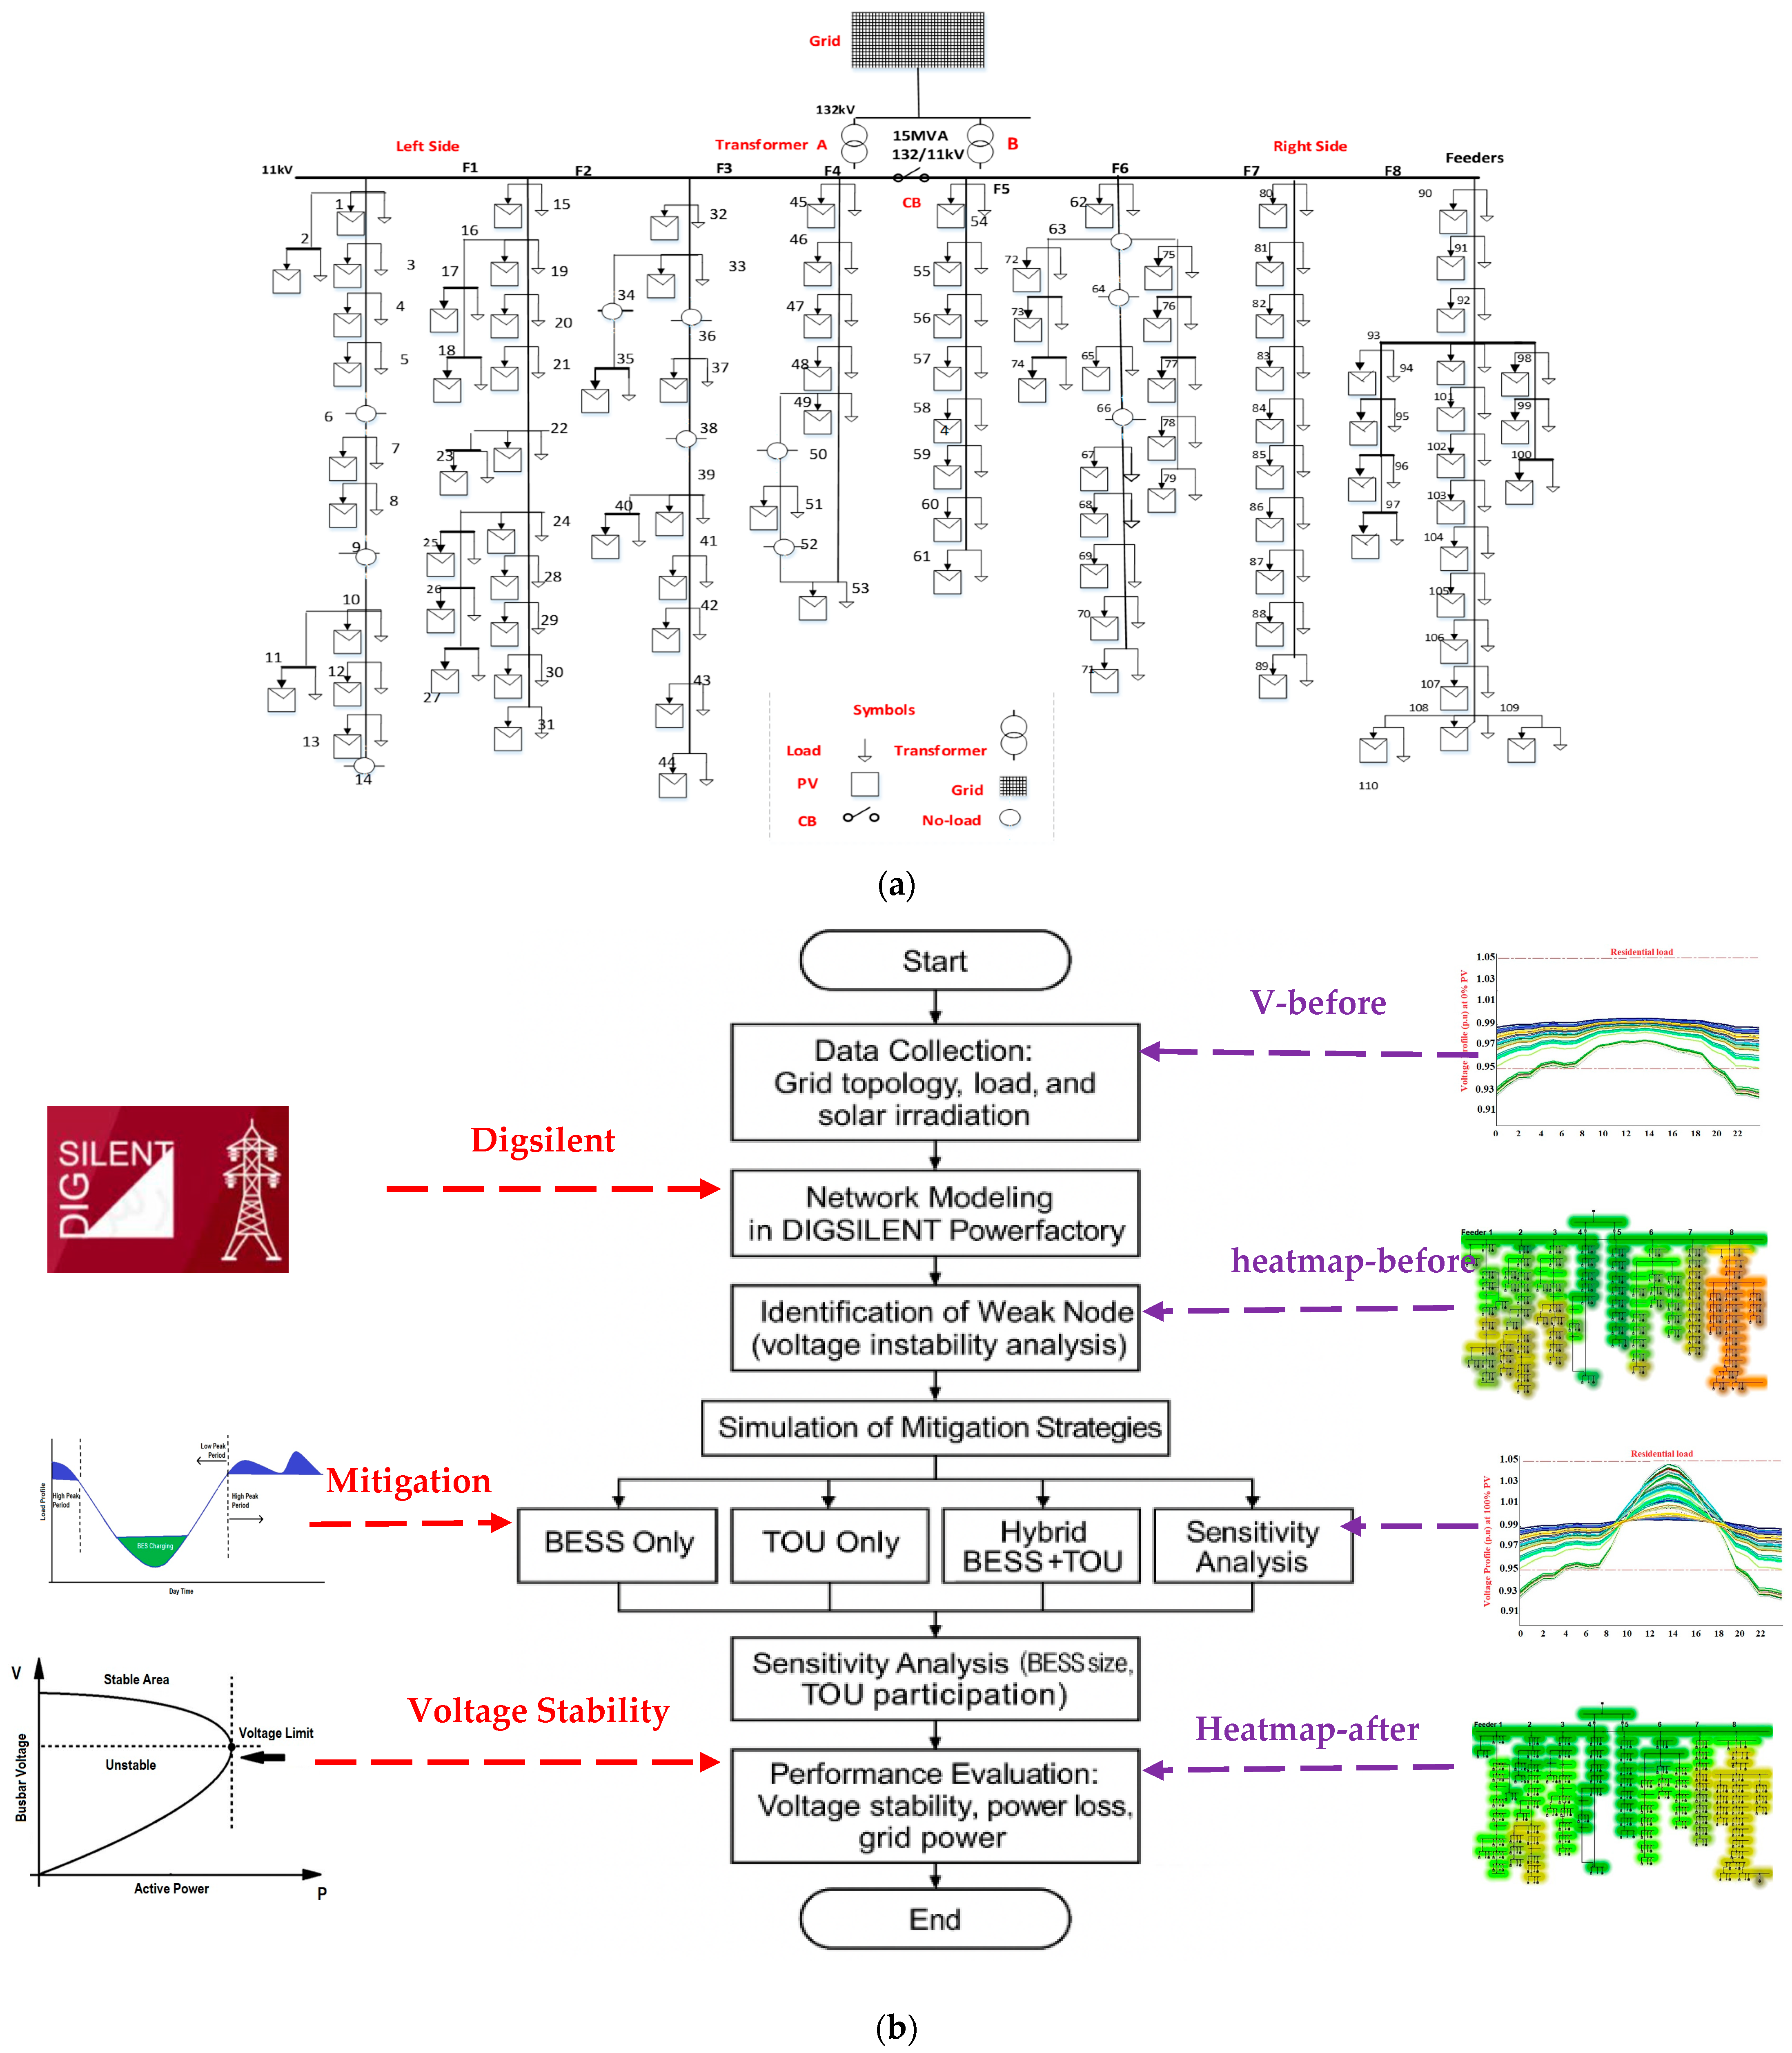
The simulation model in this study is based on a rural medium-voltage distribution network in Malaysia, developed using DIgSILENT PowerFactory. The rural grid layout consists of 110 nodes connected across 8 feeders, representing a typical radial distribution system commonly found in less urbanized regions, where infrastructure must span longer distances to serve dispersed loads. Figure 1 shows that the network is supplied by two 132/11 kV, 15 MVA transformers operating in parallel, feeding into a central 11 kV busbar. This busbar distributes power to all eight feeders, which in turn supply various loads throughout the rural region. The feeders serve a wide geographical spread of nodes, reflecting real-world conditions in rural power systems, where long line lengths and low customer density are prevalent. The system has a total connected load of 20.006 MVA, comprising 13.394 MW of active power and 6.612 MVAR of reactive power (Table 3). Feeder 8 is the most heavily loaded, delivering 2.745 MW of active power and 1.282 MVAR of reactive power across 21 bus nodes (bus numbers 90 to 110). In contrast, Feeder 6 has the lowest load demand, supplying only 783 kW and 395 kVAR, distributed across a more modest node range (Figure 1a). The load distribution highlights how rural feeders can vary significantly in both electrical demand and physical length, often resulting in voltage regulation challenges and higher line losses. Such configurations make rural grids particularly vulnerable to instability, emphasizing the importance of tailored planning and mitigation strategies—such as energy storage and demand-side management—to ensure reliable service delivery. This topology serves as the foundation for evaluating PV integration and mitigation techniques. Figure 1b illustrates each step of the research methodology, beginning with data collection and network modeling in PowerFactory. It visually traces the workflow from identifying weak nodes and simulating mitigation strategies (BESS only, TOU only, and hybrid BESS + TOU) through sensitivity analysis and performance evaluation to the final visualization of voltage profiles and network heatmaps before and after mitigation—providing a comprehensive overview of the analytical process used in this study.

2.2. Dynamic Power Flow Analysis

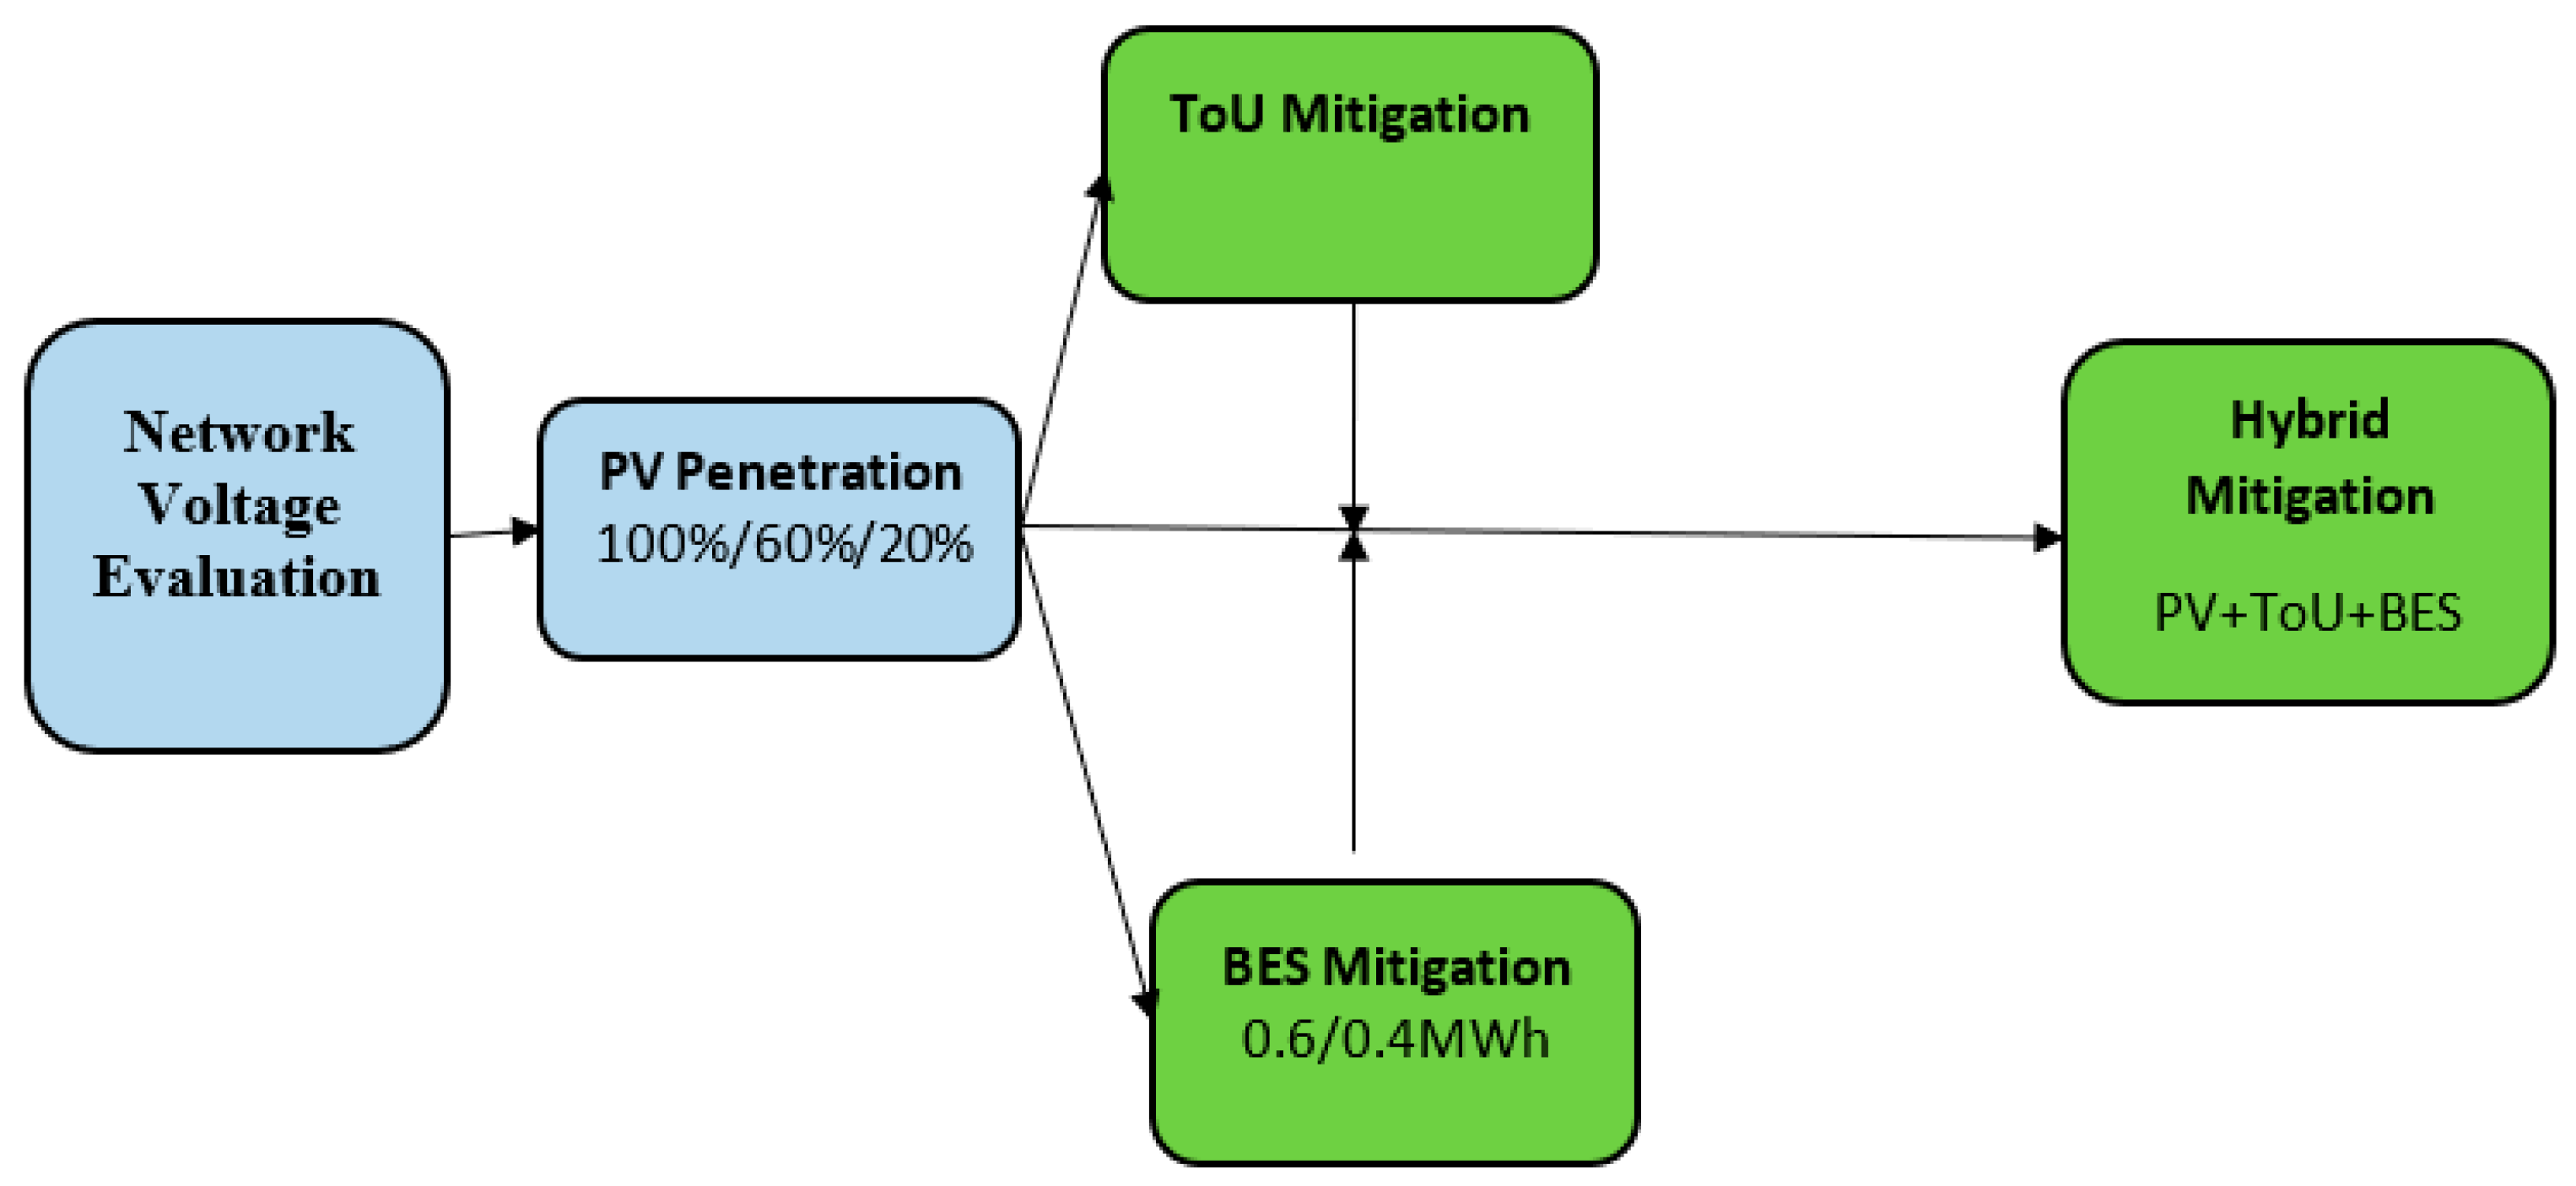
To evaluate how PV systems affect voltage performance in distribution networks, a dynamic power flow analysis was conducted. To capture a full range of operational behaviors, this analysis considered different PV system penetration levels—specifically 100%, 60%, and 20%—under both peak load and no-load conditions. The primary aim was to assess how these variations influence voltage profiles across the network, particularly in rural contexts where system sensitivity is greater due to long feeder distances and fewer stabilizing assets. As PV penetration increases, current flow in the distribution lines typically decreases, helping to reduce conventional energy losses. However, when solar generation exceeds local demand, energy may flow back toward the substation, potentially increasing real power losses and complicating voltage management. These scenarios were captured through time-based simulations that account for load variation and PV output fluctuations throughout the day. Each scenario was evaluated using the network model described earlier, and Figure 2 outlines the overall analysis framework. Mitigation strategies were tested using both battery energy storage systems (BESS) and TOU programs—first as standalone methods and then combined as a hybrid solution. BESS systems with capacities of 0.6 MWh and 0.4 MWh were included to assess their effectiveness in shifting and storing excess energy, while TOU was applied to encourage off-peak consumption behavior. This evaluation aimed to determine how each strategy, or their combination, could minimize lower voltage limit violations, especially in rural networks prone to undervoltage conditions due to distributed load profiles and limited infrastructure reinforcement. This multi-scenario analysis offers a realistic representation of operational challenges and potential solutions for high-PV penetration networks.

2.3. Network Simulation and Mitigation Techniques

To evaluate voltage variations and the interaction between the PV system and the grid, a simplified two-busbar model was used to represent the local distribution network (See Figure 3). The model focuses on understanding power transfer between the generation source, the grid, and the load connected at the point of common coupling (PCC). The voltage relationship across the two buses can be derived from fundamental power system equations, starting with the apparent power formula:
S   =   P   +   j Q   =   V P C C I
Here, VPCC is the complex voltage at the PCC, measured in volts (V), and I is the conjugate of the current injected at that point, measured in amperes (A). The current in the line, referencing power flow, is given by Equation (2):
I = P n e t j Q n e t V P C C .
where P n e t and Q n e t represent the net active and reactive power exchanged at the PCC (generated minus consumed power). To model voltage drops along the transmission line between the source and the PCC, Equation (3) is used:
V G =   V P C C +   Z I
where VG is the voltage at the grid-side transformer terminal, and Z = R + jX is the total impedance of the distribution line. Substituting the expression for current (Equation (4)), we get the following:
V G =   V P C C +   R   +   j X · P N e t   j Q N e t V N e t
Rewriting for the PCC voltage, Equation (5) is as follows:
V P C C =   V G P N e t R +   Q N e t X V P C C     j   Q N e t R   P N e t   X V P C C
This expression links grid voltage, load conditions, and line parameters to determine the voltage at the load bus. It also captures the dynamic interaction between PV output, load demand, and line impedance—critical in determining whether the PCC will absorb or feed power. Essentially, when local PV generation exceeds consumption, excess energy flows back toward the grid, potentially raising the voltage. Conversely, when demand surpasses generation, the grid supplies the deficit, causing a voltage drop that depends on the load level and network impedance. This model serves as the backbone for assessing mitigation strategies such as BESS and TOU policies, helping to anticipate and address voltage violations under real-time operating conditions.

2.4. PV Penetration (PVP) Level

The PV penetration level defines the ratio between the actual energy output from a PV system and the maximum permissible capacity that can be connected to the grid. It serves as a key performance indicator when assessing how much solar power a distribution network can accommodate without compromising stability. To evaluate the impact of different PV output levels on grid behavior, a rural distribution system was simulated using DIgSILENT PowerFactory. The network was tested under three generation conditions—low (20 kW), moderate (60 kW), and full-scale (100 kW)—applied to each node. These levels reflect realistic solar deployment scenarios and allow examination of how varying PV injection levels affect voltage and system loading. Furthermore, the analysis considered voltage violation thresholds to determine the maximum tolerable penetration level before triggering stability issues. This approach not only assessed system capacity but also served as a diagnostic tool for detecting when grid reinforcements or mitigation measures (such as storage or load shifting) might be needed. The solar generation at any given hour t can be expressed through a temperature- and irradiance-adjusted model, as shown in Equation (6):
P p v t = R p v D p v G T t G T , S T C [ 1 + α p T c e l l t T c e l l , S T C ]
where Ppv(t) represents the solar output at hour t of the year (unit: kilowatts [kW]), R p v denotes the system’s rated capacity in kilowatts (kW), and D p v indicates the PV derating percentage. G T is the actual solar irradiance (kW/m2), G T , S T C corresponds to irradiance under standard test conditions, α p denotes the temperature coefficient for power (%/°C), and T c e l l and T c e l l , S T C refer to the cell temperatures under operating and STC conditions, respectively. This formula accounts for temperature-induced non-linear behaviors. By applying this model across multiple PV penetration levels, this study was able to characterize not only energy yield but also the grid’s dynamic response to distributed solar integration—especially in rural areas where voltage violations are more pronounced due to longer feeder distances and fewer voltage control devices.

2.5. Mitigation Technique

To address voltage fluctuations under varying PV penetration conditions—particularly during low-load and peak-load periods—this study employed two primary mitigation strategies: BESS and TOU. BESS was implemented to manage surplus solar generation by storing excess energy during periods of high output. TOU, on the other hand, aimed to regulate demand behavior by shifting load patterns, thereby reducing network stress during critical hours.
  • BESS Implementation
Battery storage plays a crucial role in balancing generation and consumption, especially in rural distribution networks where real-time control is limited. In this study, each of the 110 nodes was equipped with a battery system capable of absorbing surplus PV output. Each node in the distribution network is equipped with a 0.4 MWh lithium iron phosphate (LFP) battery energy storage system (BESS). The LFP chemistry was selected for its superior cycle life, thermal stability, and proven suitability in grid-scale applications. Technical specifications for the BESS—including a nominal voltage of 400 V, rated power output of 100 kW, round-trip efficiency of 90%, and a depth of discharge (DOD) limited to 80%—are based on standard models available in the DIgSILENT PowerFactory library, ensuring alignment with realistic and industry-accepted performance benchmarks. The sizing of both the PV systems and the BESS was determined according to the overall network load profile: the 20.006 MVA total network load is distributed across 110 nodes, each with a 100 kW PV installation, supporting scenarios of up to 100% PV penetration. The 0.4 MWh BESS capacity at each node allows for up to four hours of full-rate discharge at the PV output, effectively capturing excess solar generation and supplying energy during peak demand periods. By adopting a distributed storage topology, the network benefits from localized voltage support and enhanced resilience, which is particularly critical for mitigating undervoltage events along the long, high-impedance feeders characteristic of rural Malaysian grids. The dynamic control of these batteries was modeled using a time-series simulation approach that tracked changes in state of charge (SOC) over the course of a day (unit: percentage [%]). The SOC at any given time step t is defined by Equation (7):
S O C t = S O C 0 + η c k = 0 t P C B k + η d k = 0 t P D B K
where S O C 0 denotes the initial SOC of the battery, P C B indicates the battery’s charging power, and P D B signifies the discharging power. The symbols η c and η d represent the efficiencies of the battery during charging and discharging, respectively. The limitations associated with usable battery capacity are expressed as follows by Equations (8) and (9):
B m i n S O C B m a x               B m i n = 1 D O D B m a x
where DOD represents the depth of discharge. The battery system operates only when certain conditions are met. Specifically, discharge is allowed if the following is true:
0 P D B K P m a x
In this case, P m a x denotes the peak hourly discharge capability of the system. This allows the system to operate within its operational limits while providing adaptive support to maintain voltage stability under demanding grid scenarios. Through the integration of BESS with localized control, voltage variability can be minimized, energy curtailment reduced, and overall power reliability enhanced. When paired with demand management strategies such as Direct Load Control or TOU pricing, the system’s performance—especially in rural settings with extended feeders and minimal regulation—can be significantly improved.
  • Battery Frame Control in Power Factory
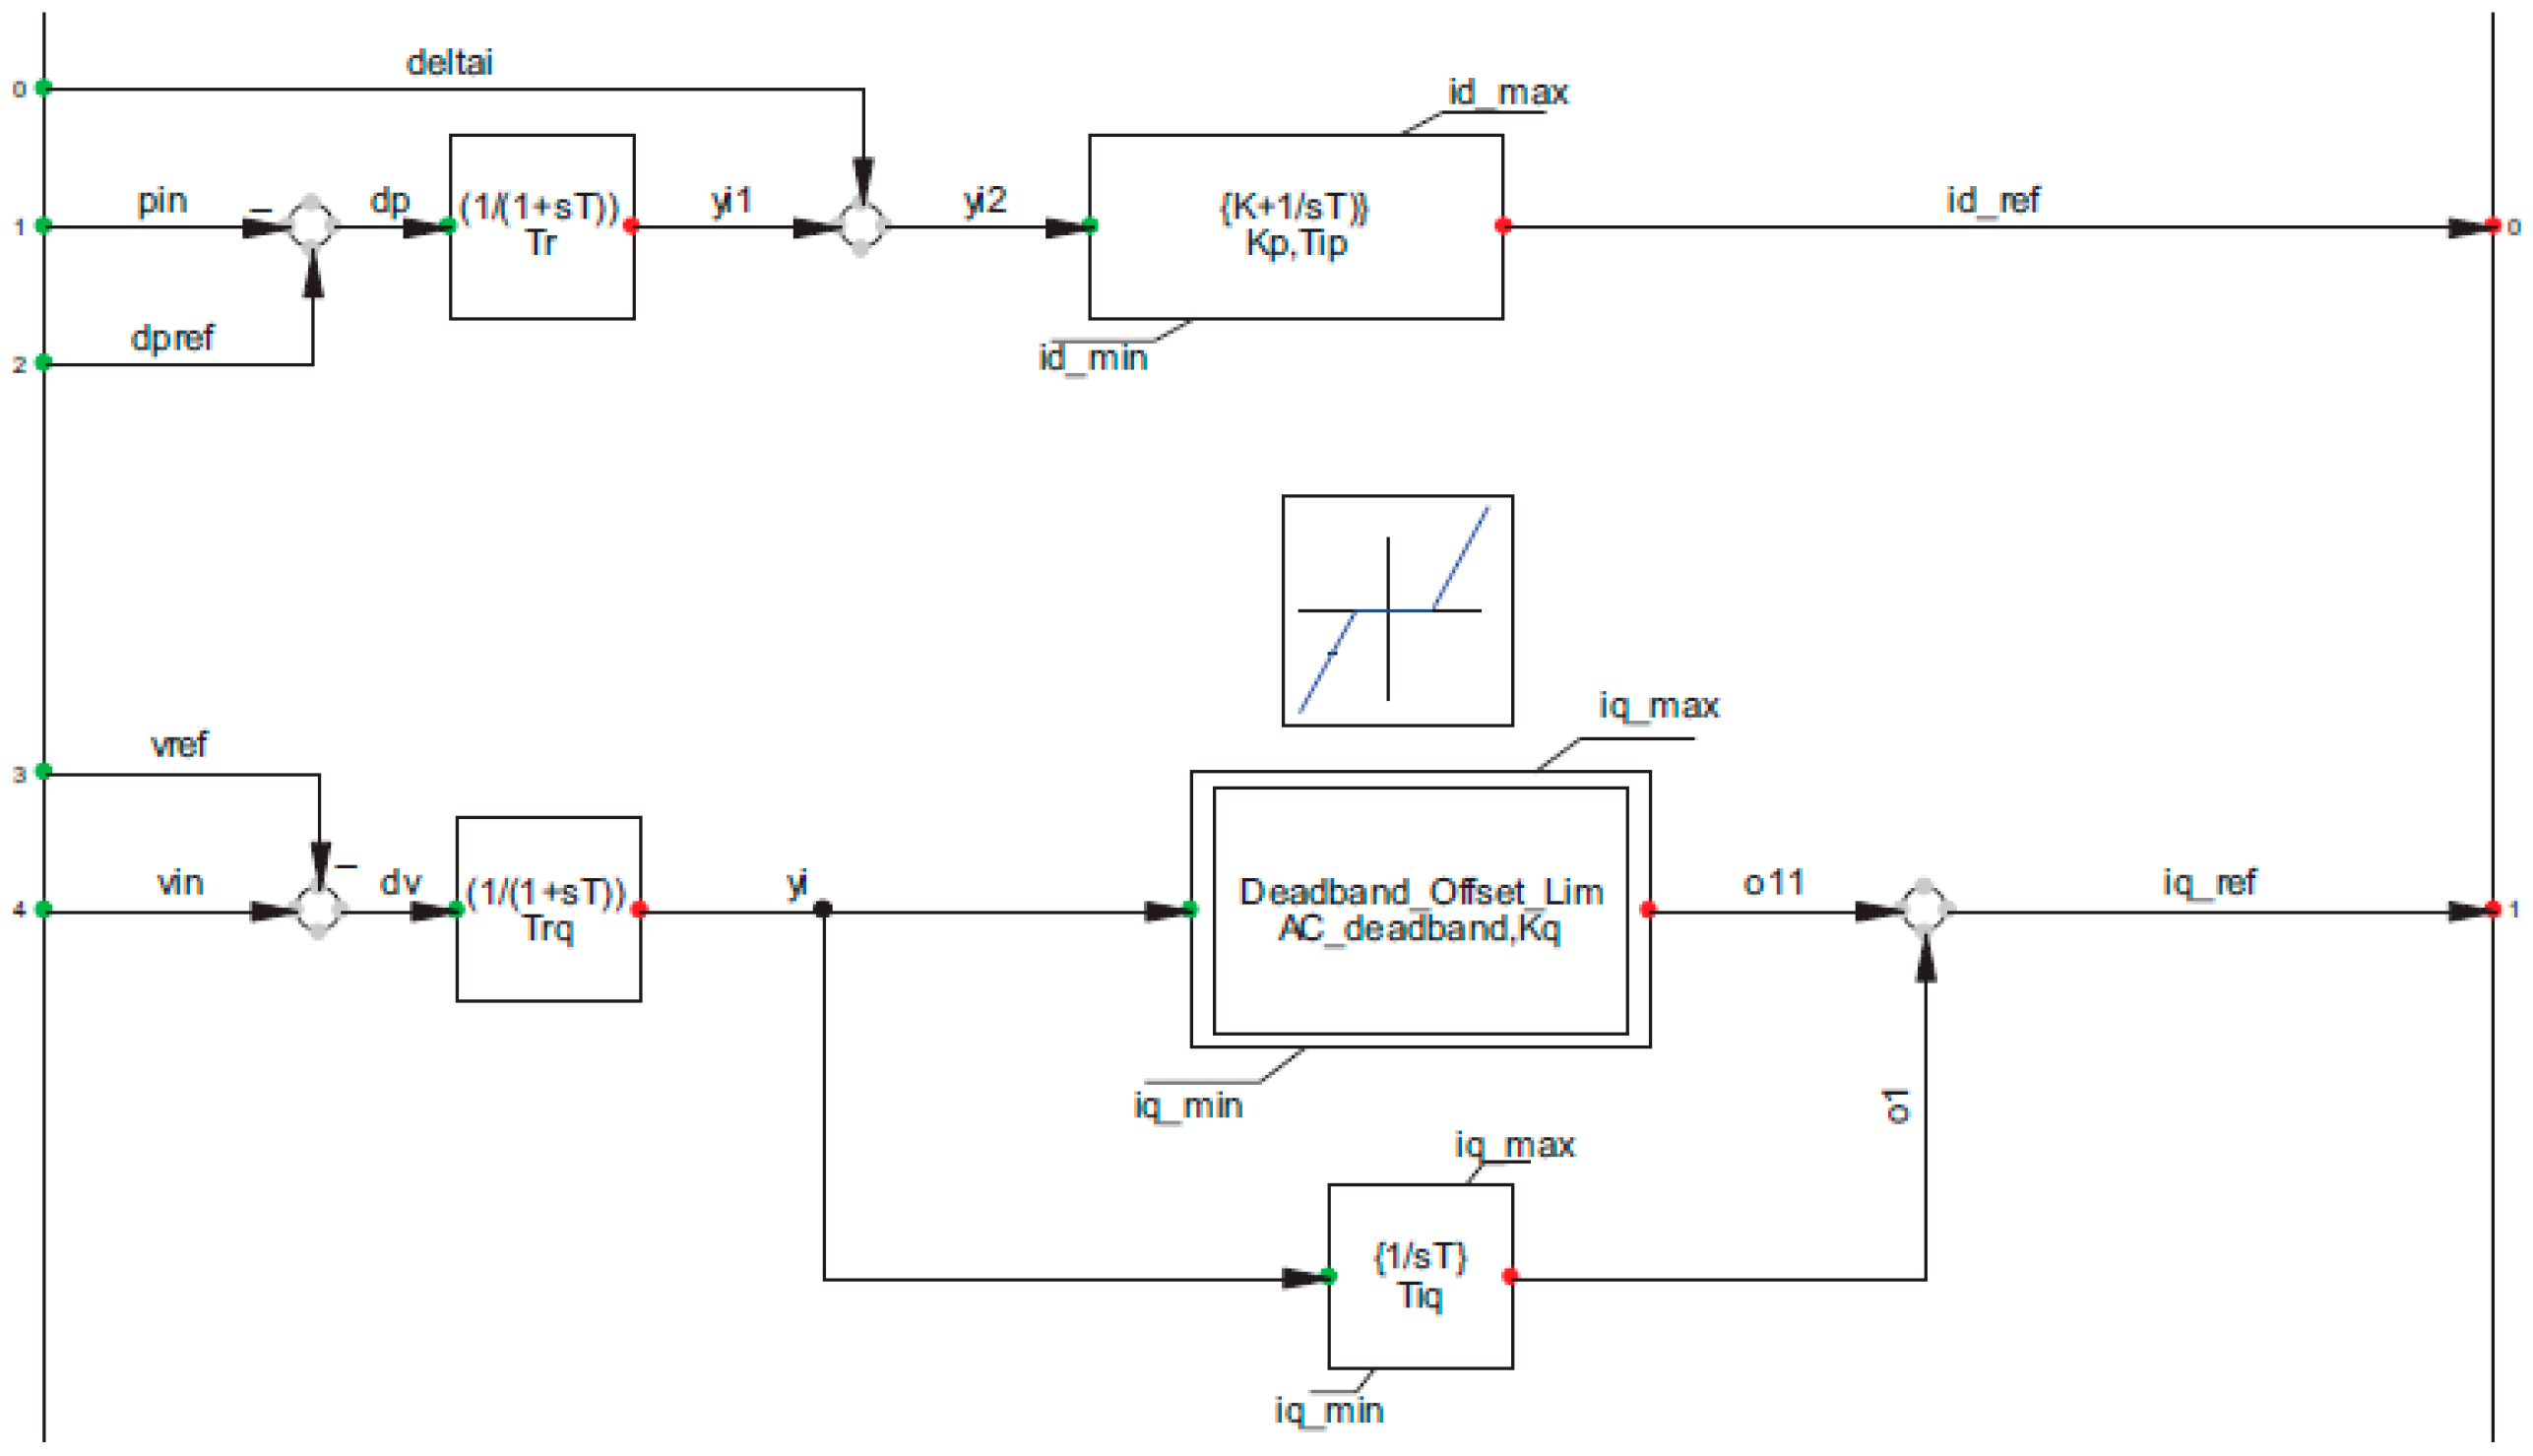
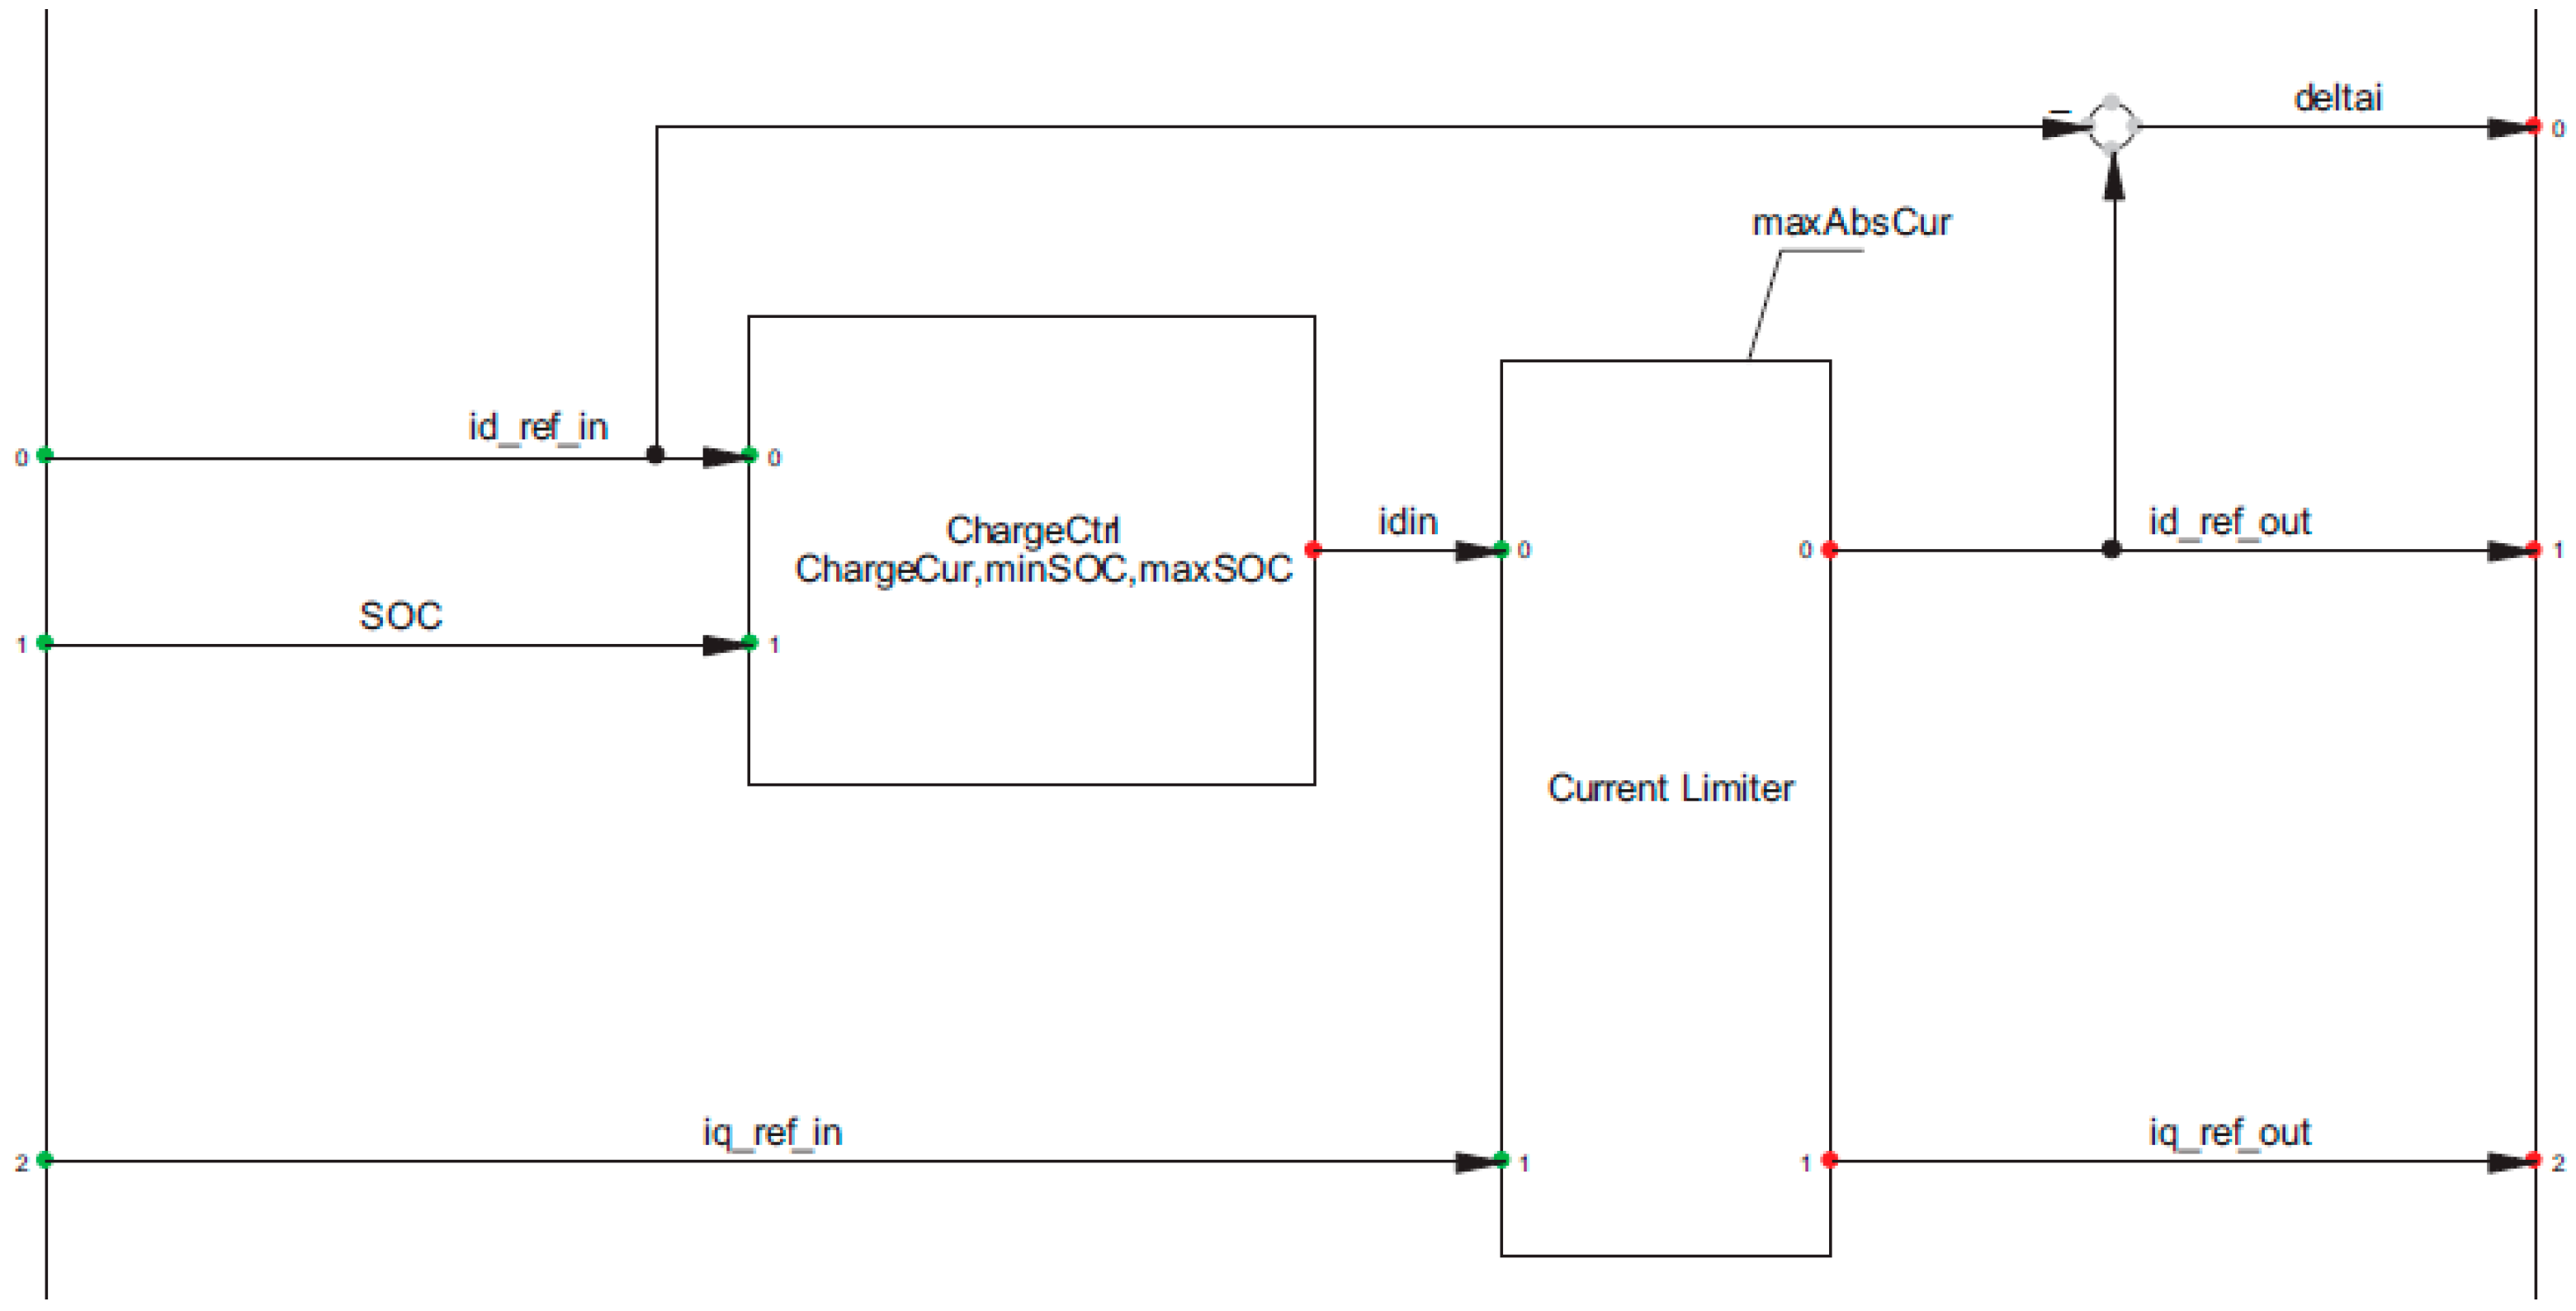
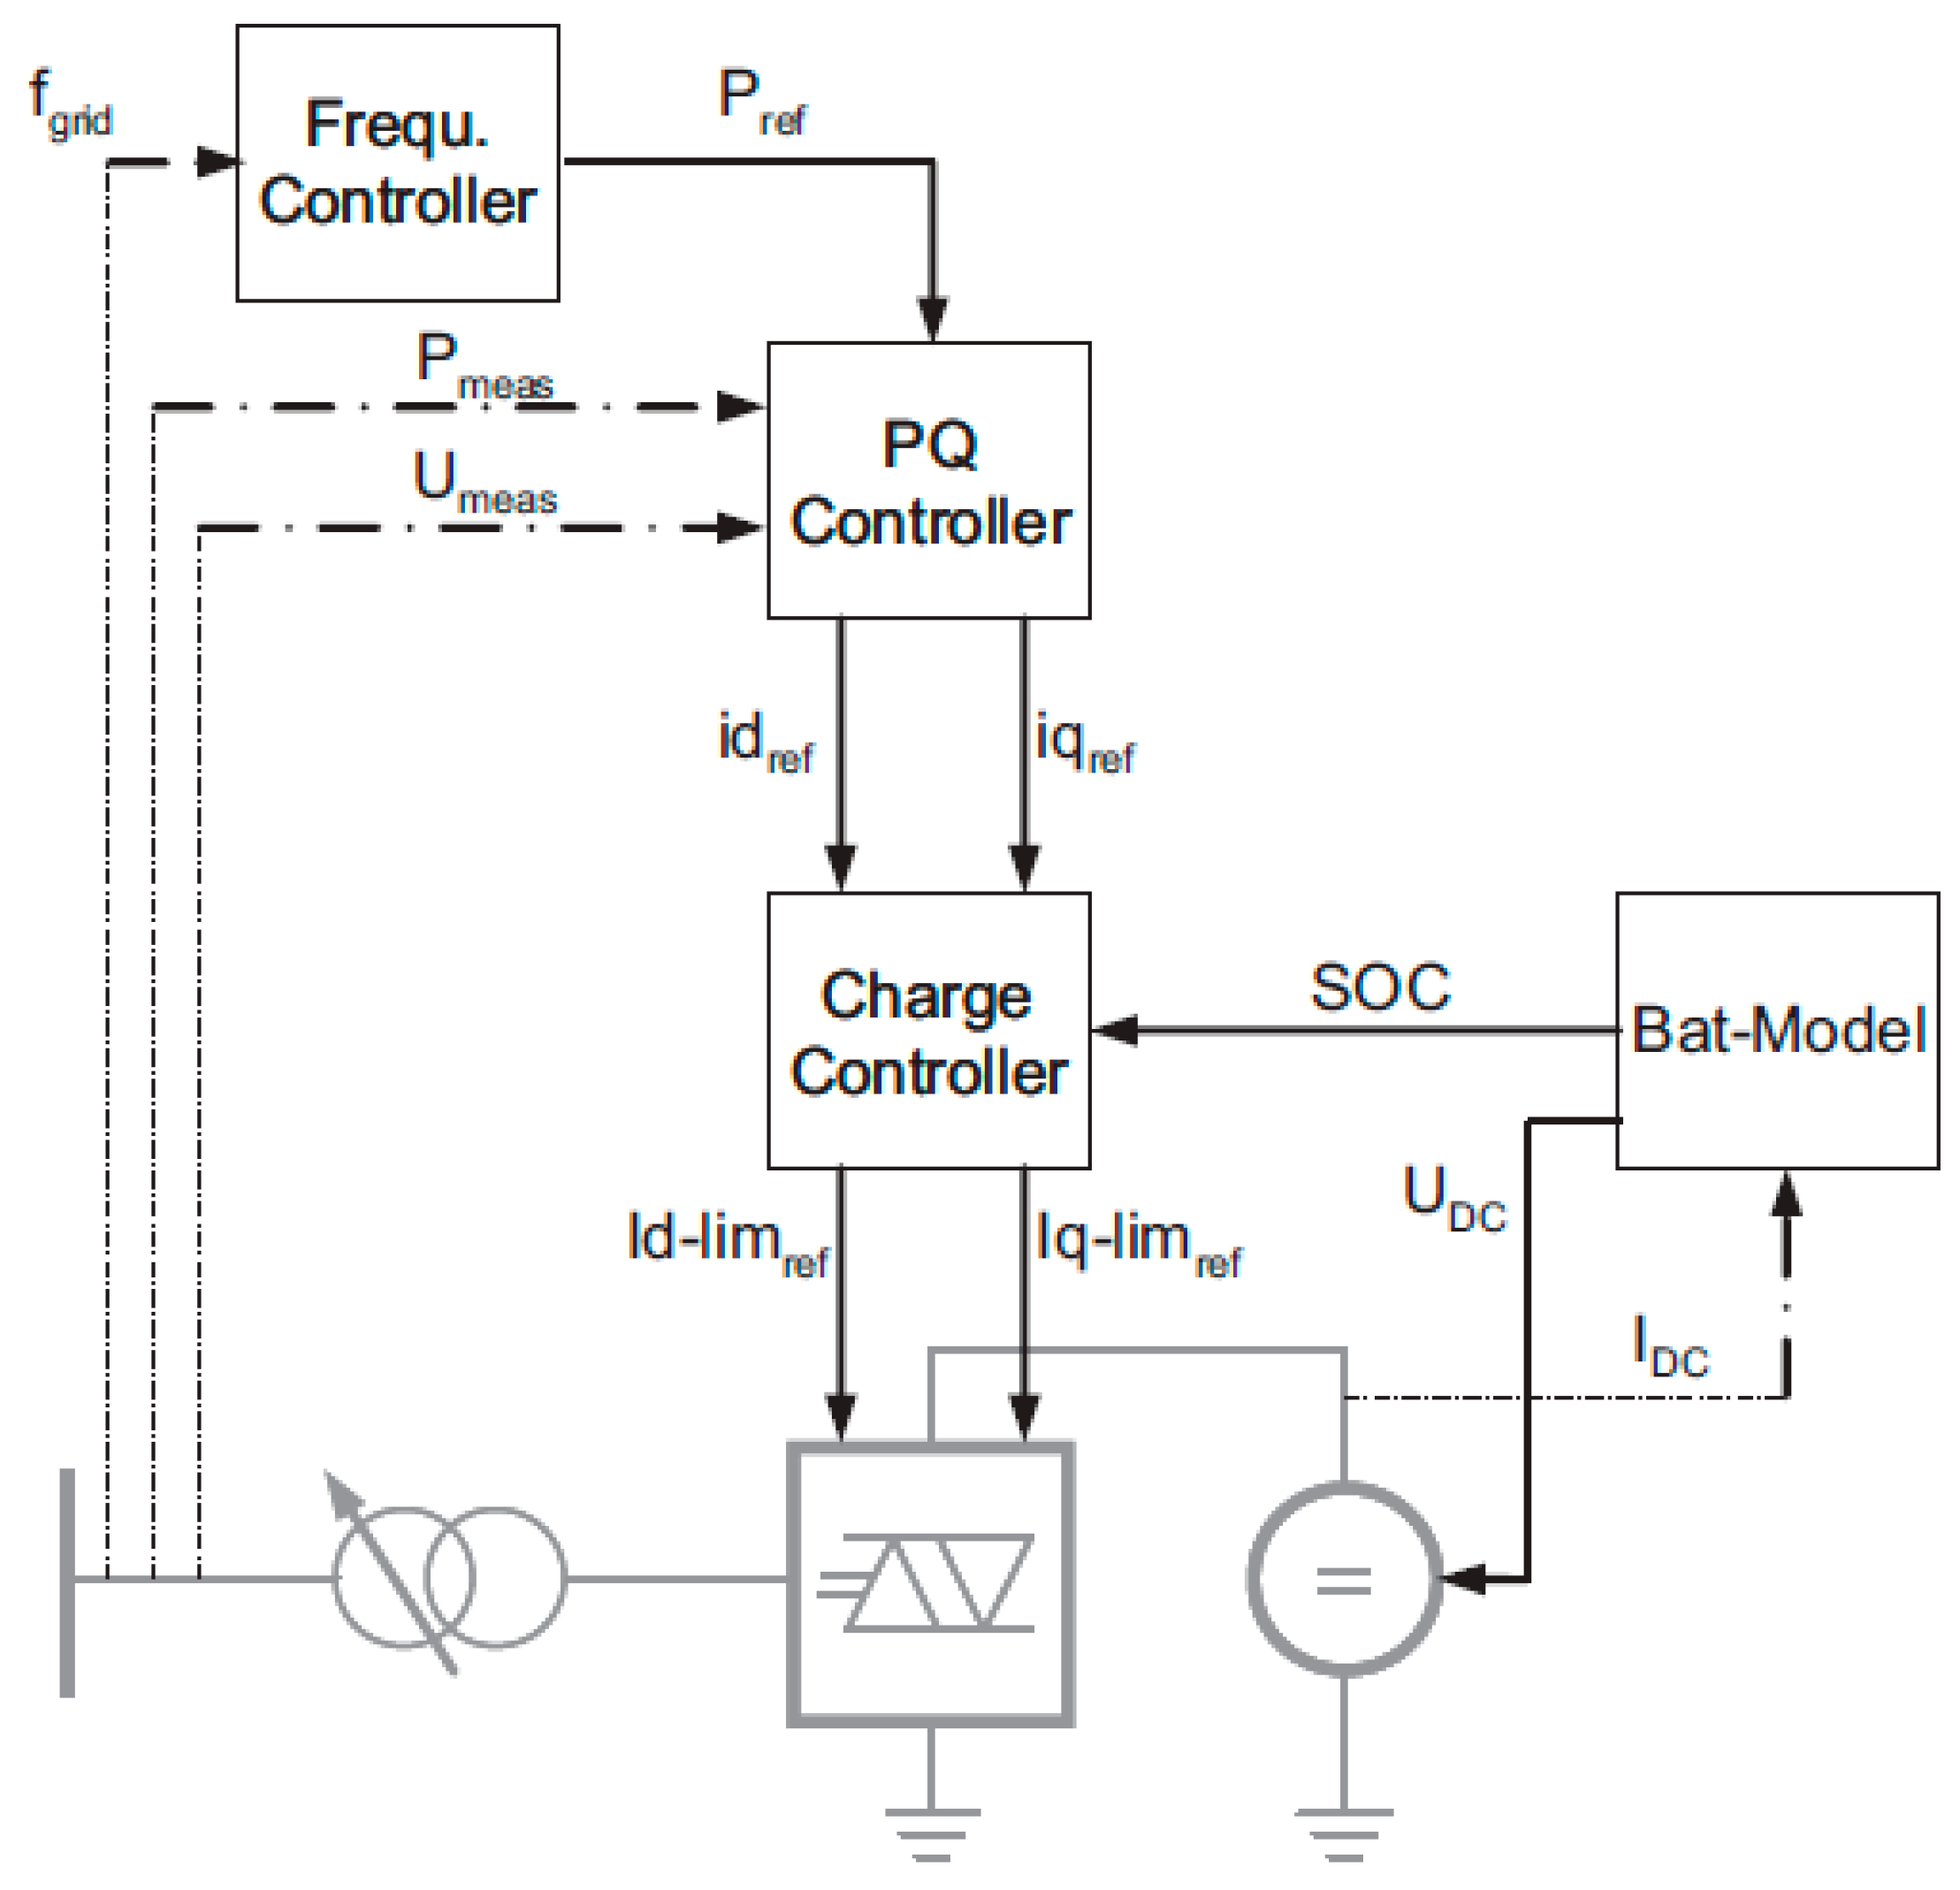
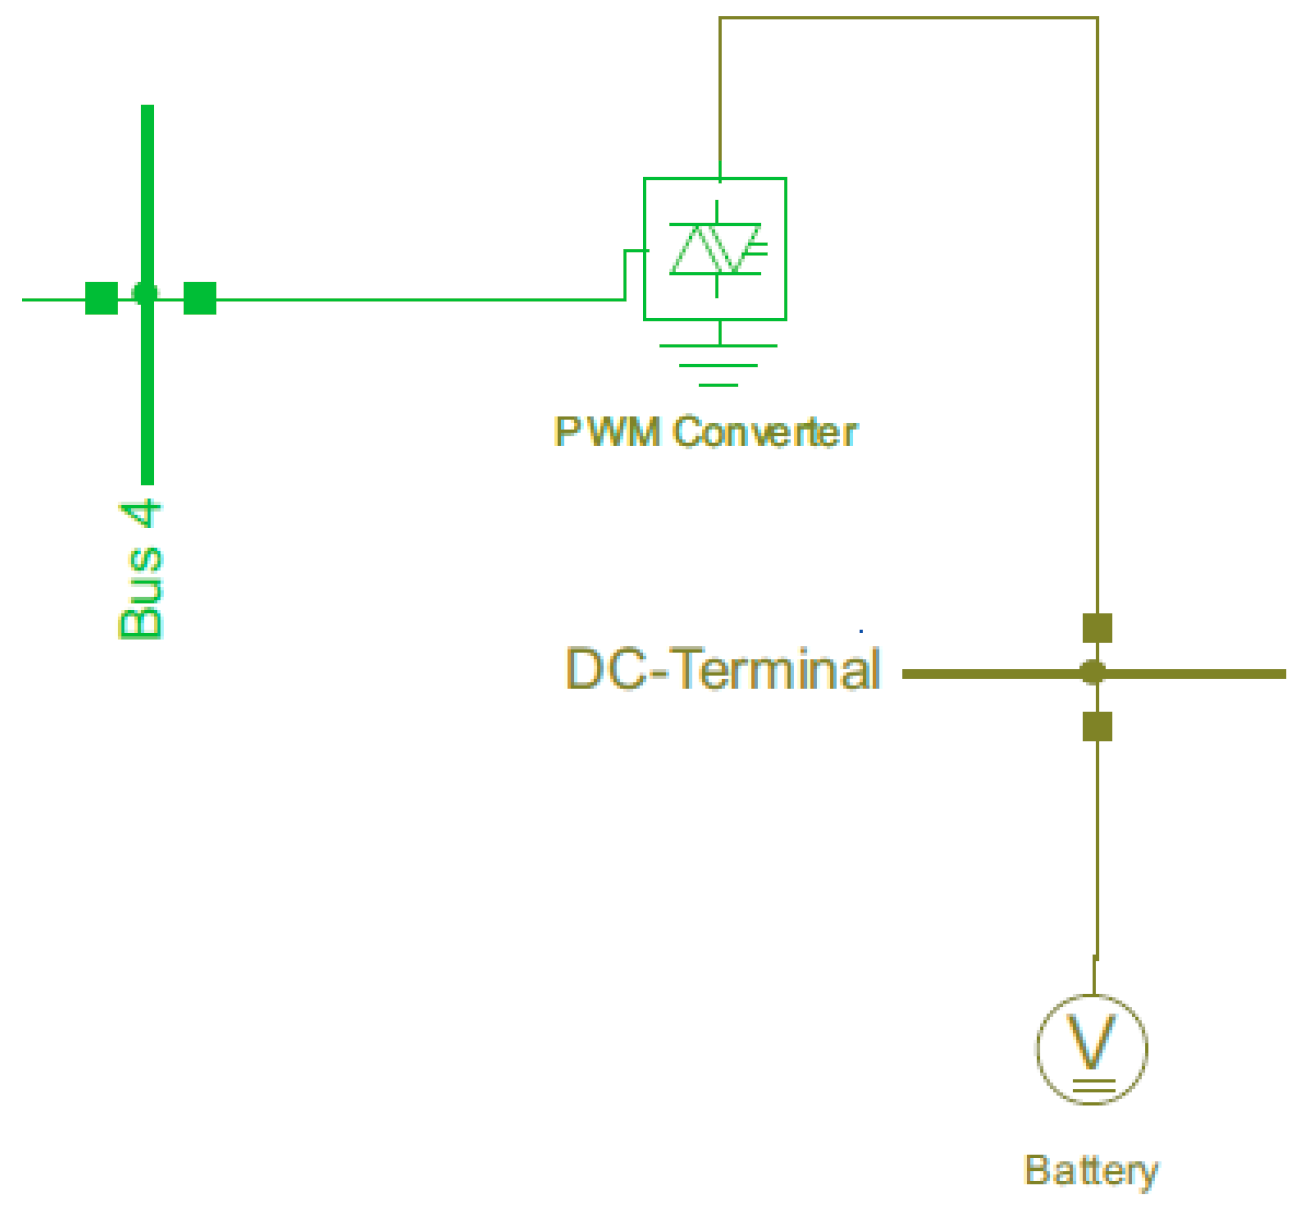
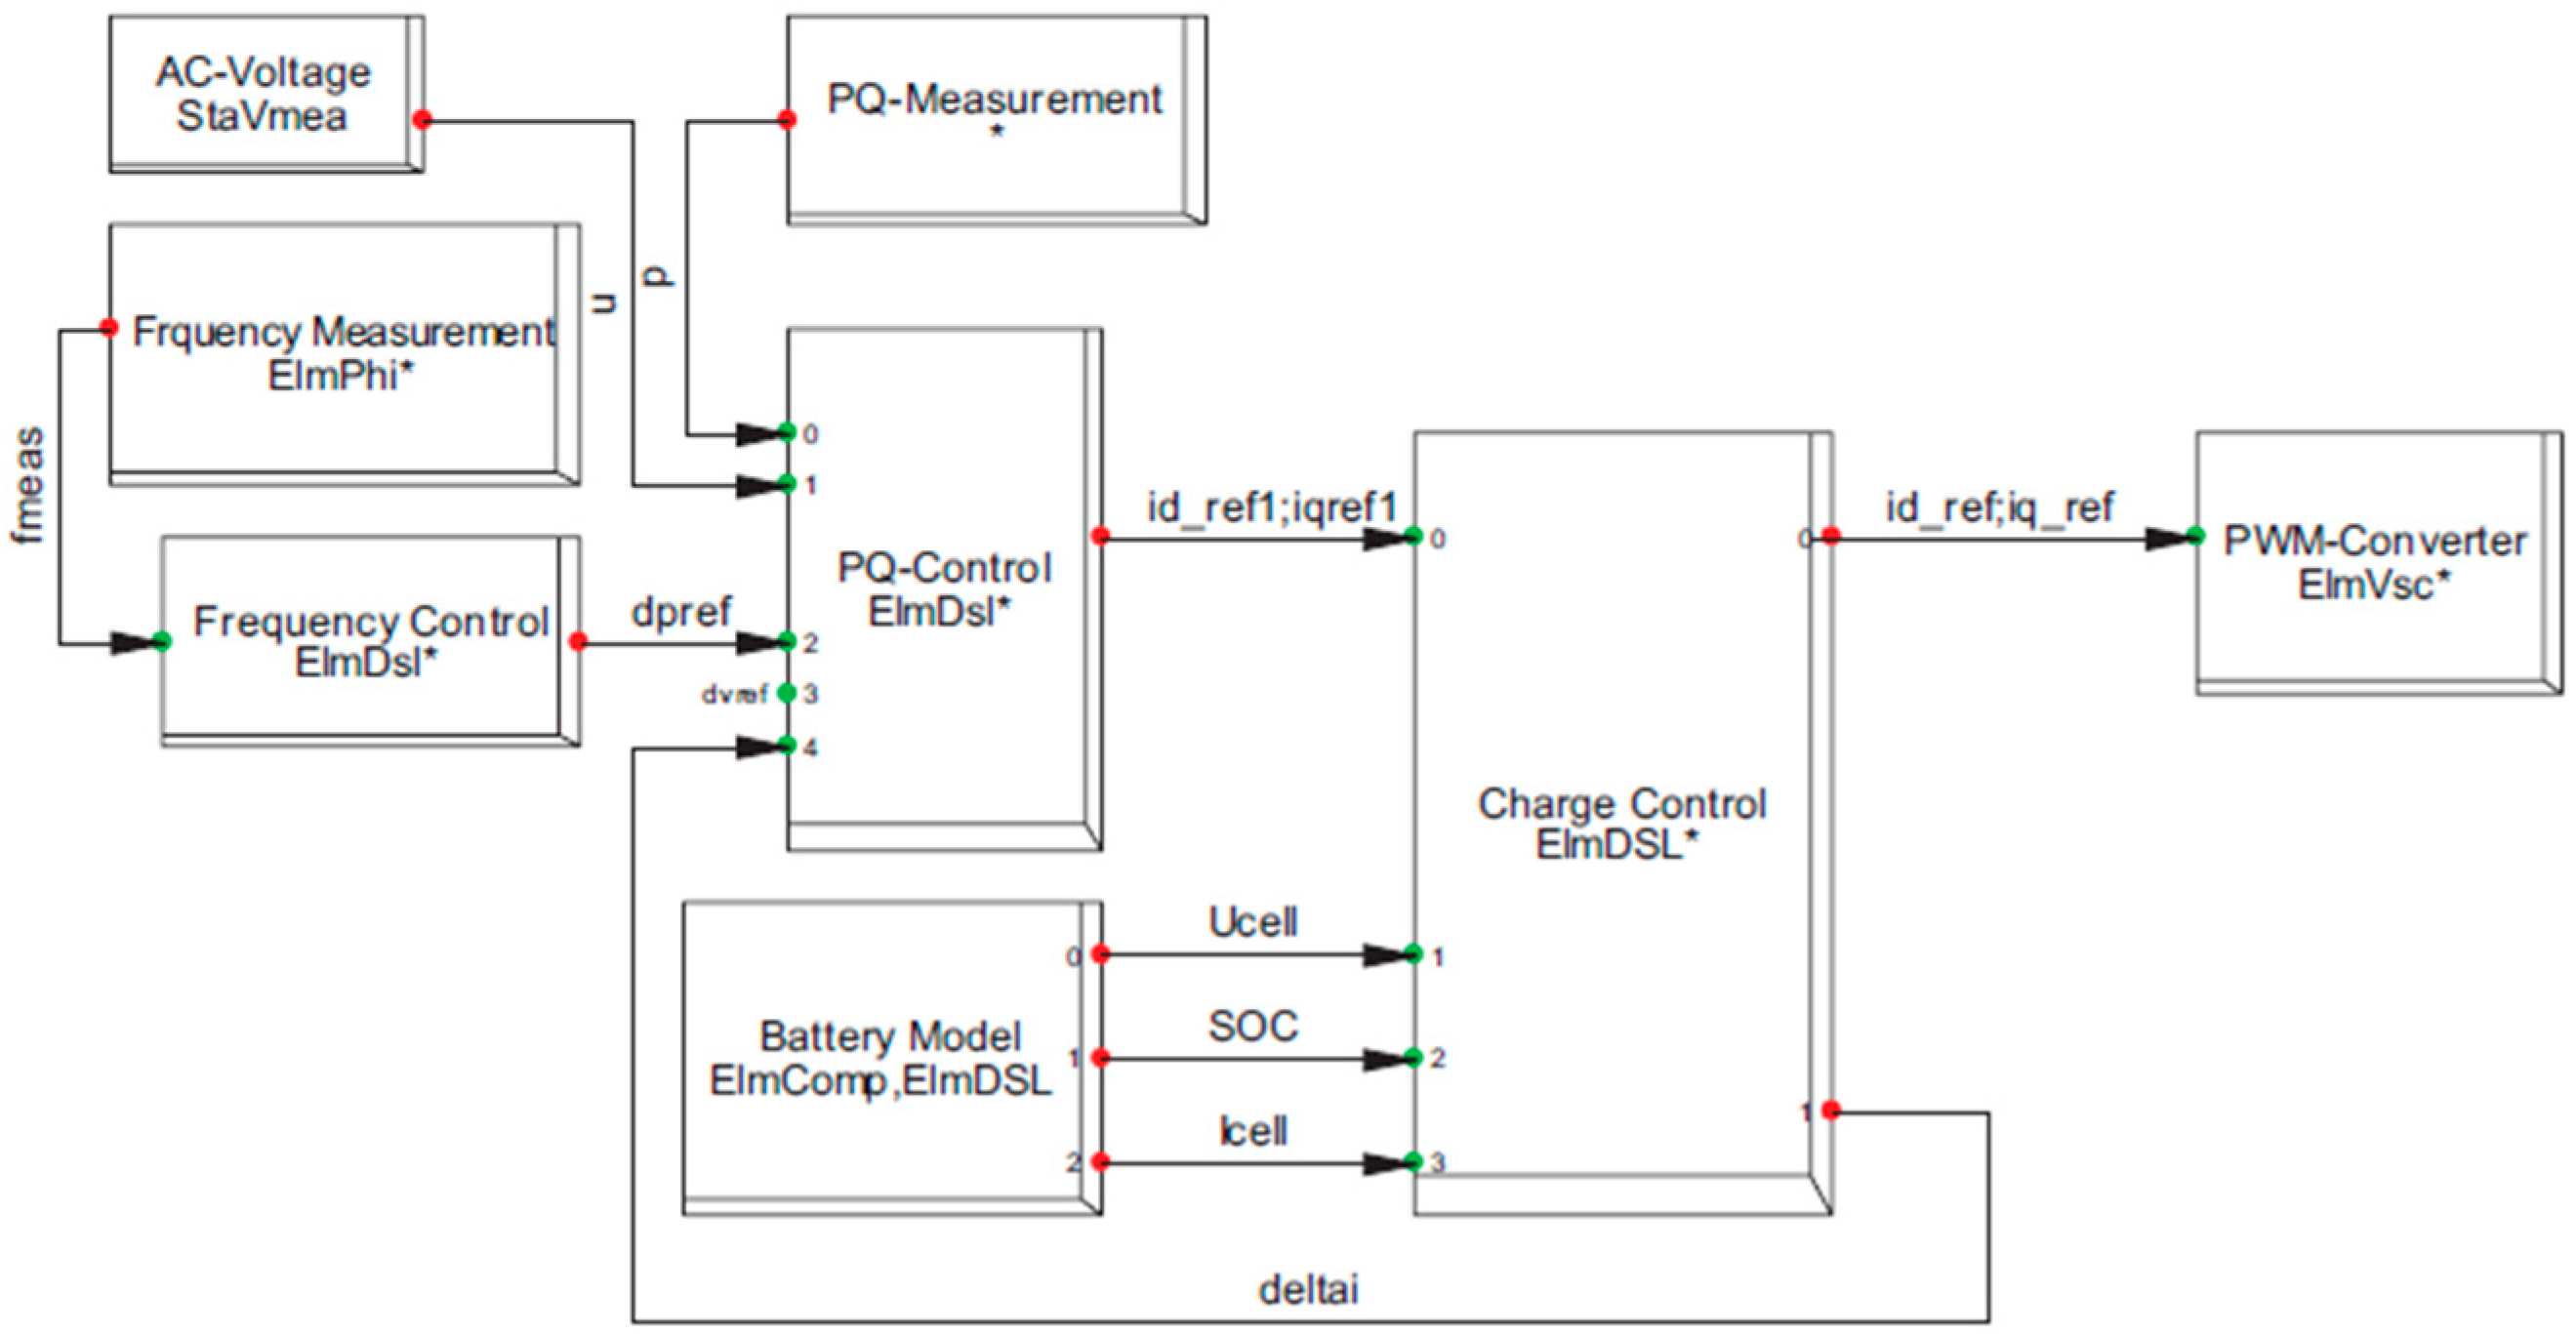
In this study, a distributed BESS topology is adopted, with a 0.4 MWh battery deployed at each node (a total of 110 nodes). This approach enables localized voltage support, minimizes line losses, and maximizes renewable self-consumption. Centralized BESS configurations were not considered due to the high impedance and voltage drop challenges characteristic of rural Malaysian feeders. Before implementing a controller, it is important to understand its function. In the case of a BESS with an IGBT-based converter, there are two current parameters to control: one in the d-axis and one in the q-axis. The PI controller receives feedback from the BESS current and voltage and uses this information to adjust the output of the BESS converter. The goal of the PI controller is to maintain the output power of the BESS within a predetermined range. Figure 4 shows the general BESS control framework in PowerFactory, with each block’s function detailed in Appendix A. To control active power, the PI controller is set to track a reference signal for the real power output of the BESS. This reference signal can be constant or varied to simulate changes in load demand. To control voltage, the PI controller tracks a reference signal for the reactive power output of the BESS, which can also be constant or varied to simulate voltage imbalance. The BESS control framework in PowerFactory is used to manage both real and reactive power output. It also helps optimize grid operation, such as by reducing energy wastage. The detailed functions of each control block are provided in Appendix A.
  • Time-of-Use Profile
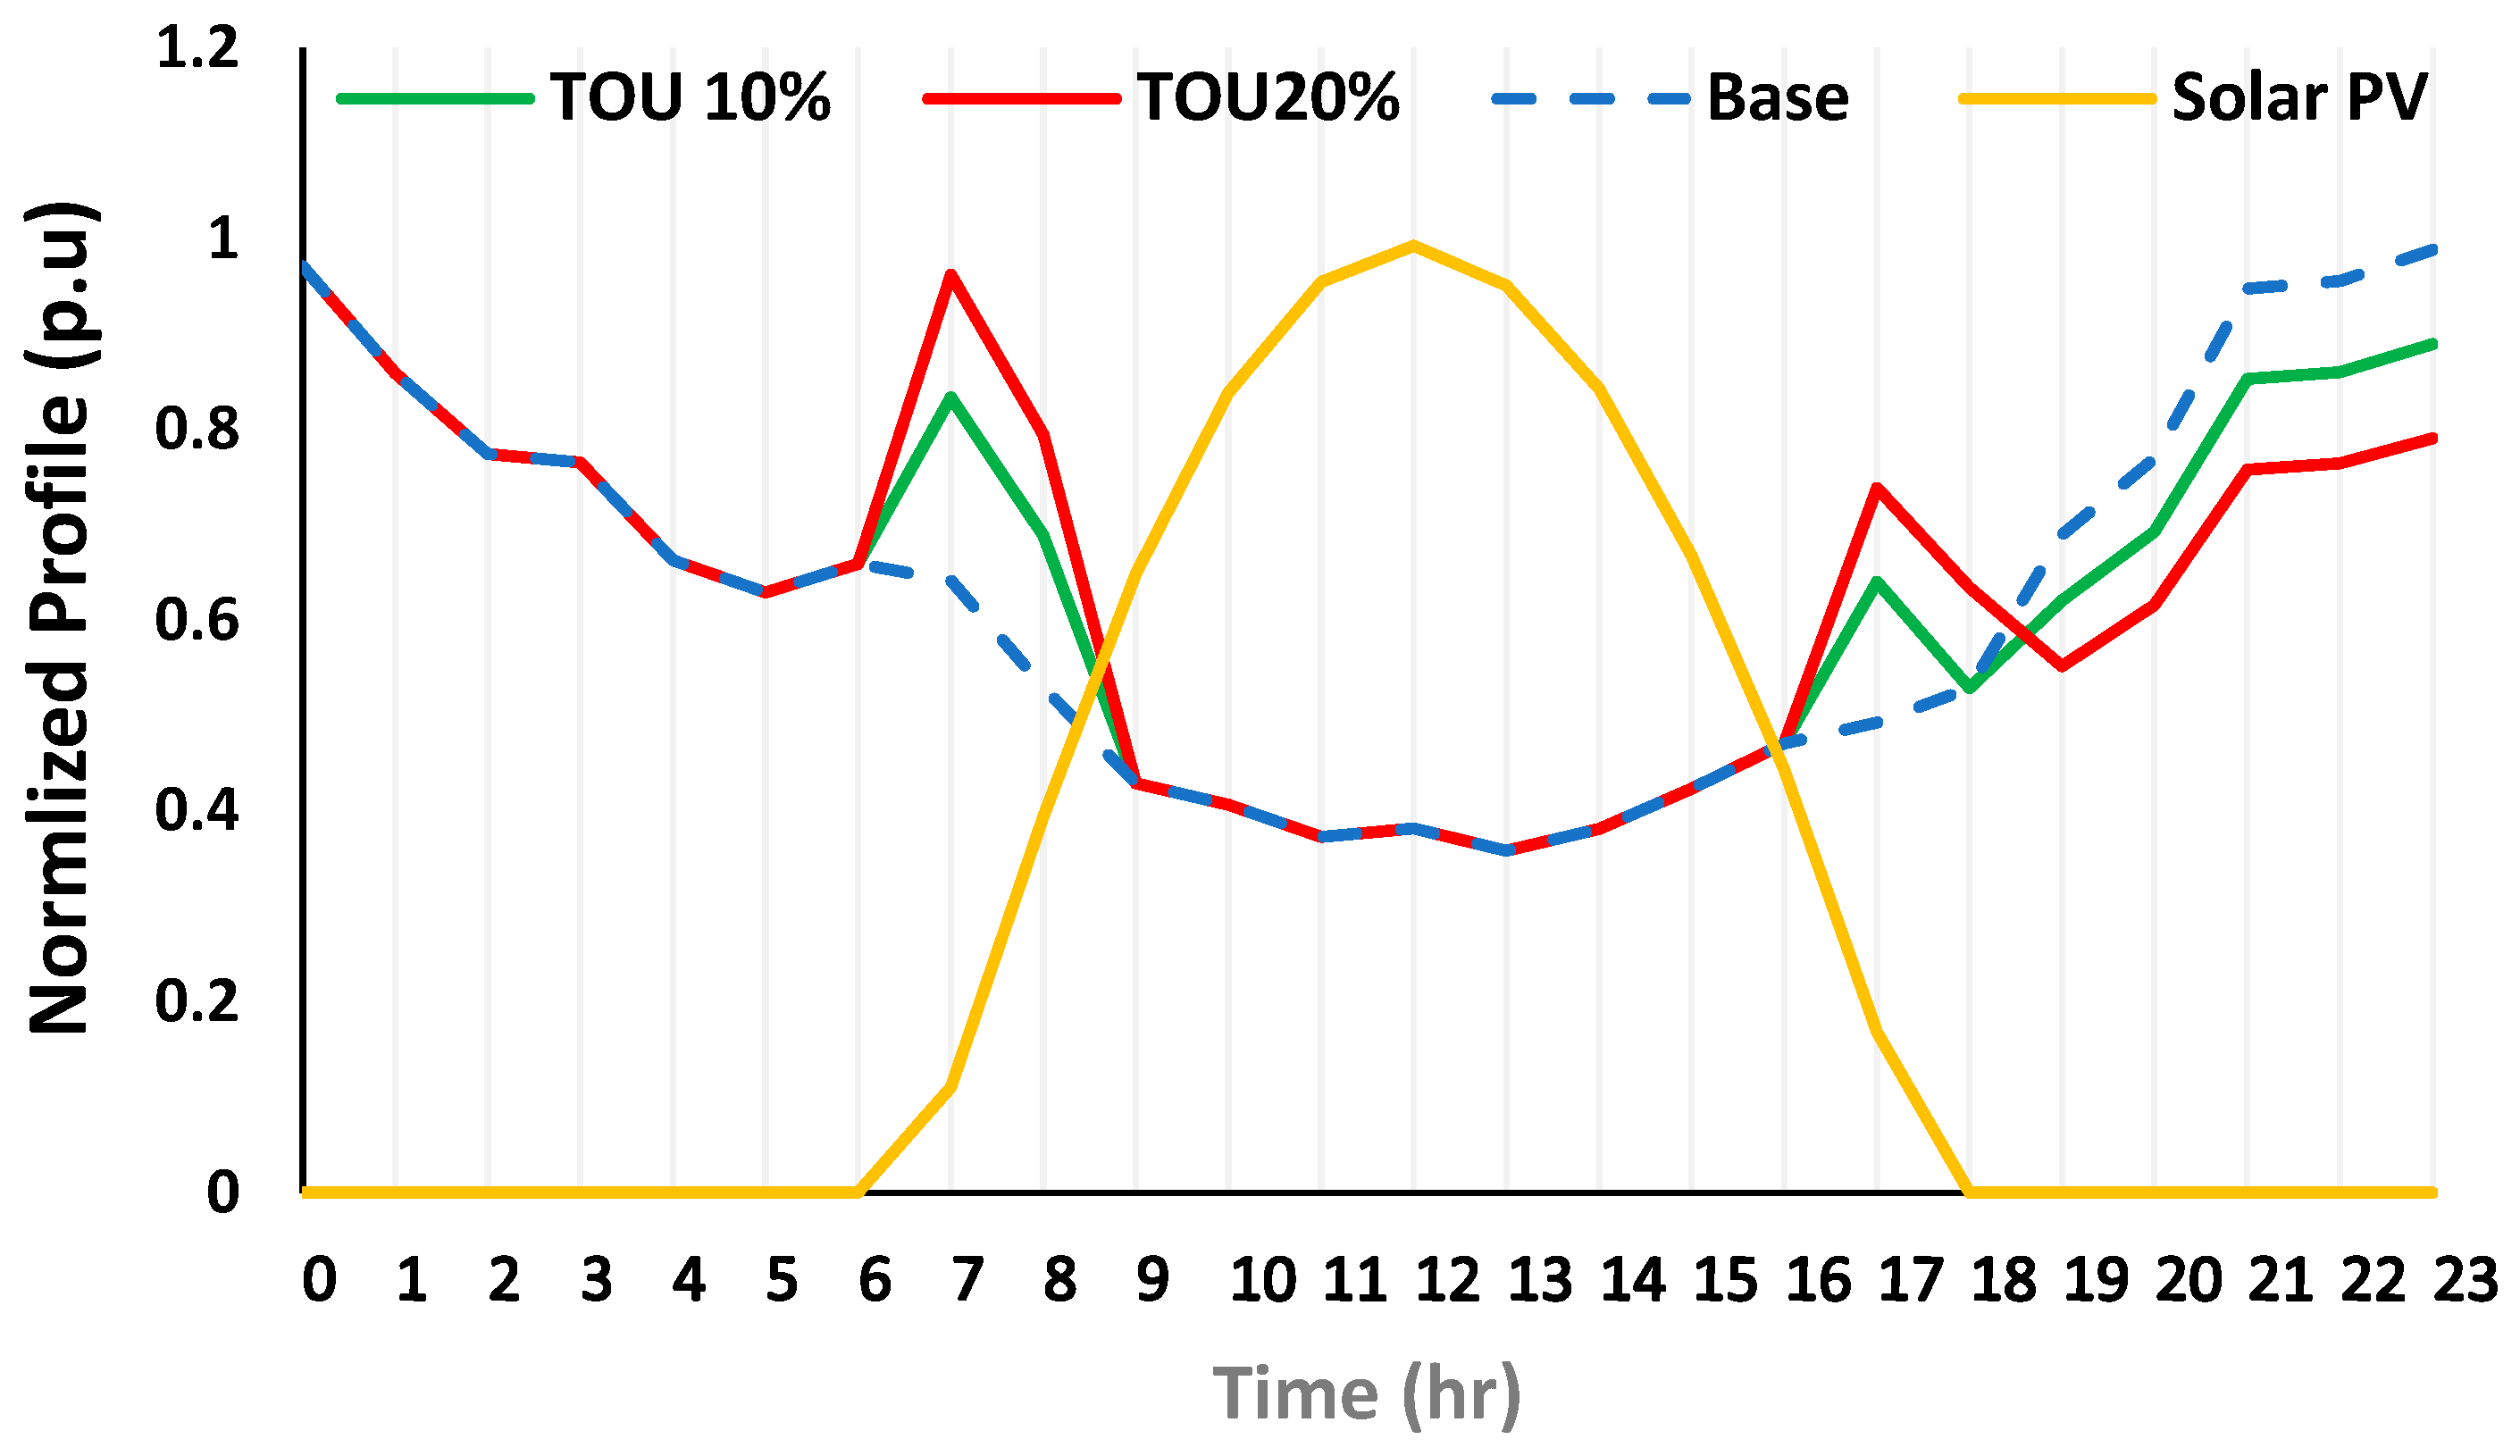
In grid-connected solar systems, TOU pricing offers both operational and economic advantages. It allows system operators to influence consumer behavior by encouraging electricity use during off-peak periods and reducing demand when the grid is under stress. This strategy not only supports voltage regulation but also helps balance supply and demand more effectively. TOU schemes are particularly beneficial in systems with high levels of PV penetration, where daytime generation can exceed demand and cause voltage instability. By encouraging users to shift consumption to align with solar production windows, TOU contributes to more stable grid operation and reduces reliance on traditional peaking resources. In this research, TOU was implemented specifically to shift residential electricity usage away from peak periods. The approach focused on managing peak load conditions by applying two different TOU rates: one for peak hours and another for low-demand hours. These rates were used to simulate behavioral changes in residential consumption patterns. The impact of this load-shifting mechanism is visualized in Figure 5, where TOU pricing was increased during high-demand periods to evaluate its effectiveness in reducing voltage violations. Two levels of TOU incentives were tested, represented by distinct color bands (green and red), to illustrate the extent of load movement from high-peak to low-peak time windows. TOU can also work synergistically with other mitigation techniques, such as BESS, to further enhance the grid’s response to solar integration—especially in rural networks, where infrastructure constraints make active control more challenging.
  • Hybrid mitigation techniques
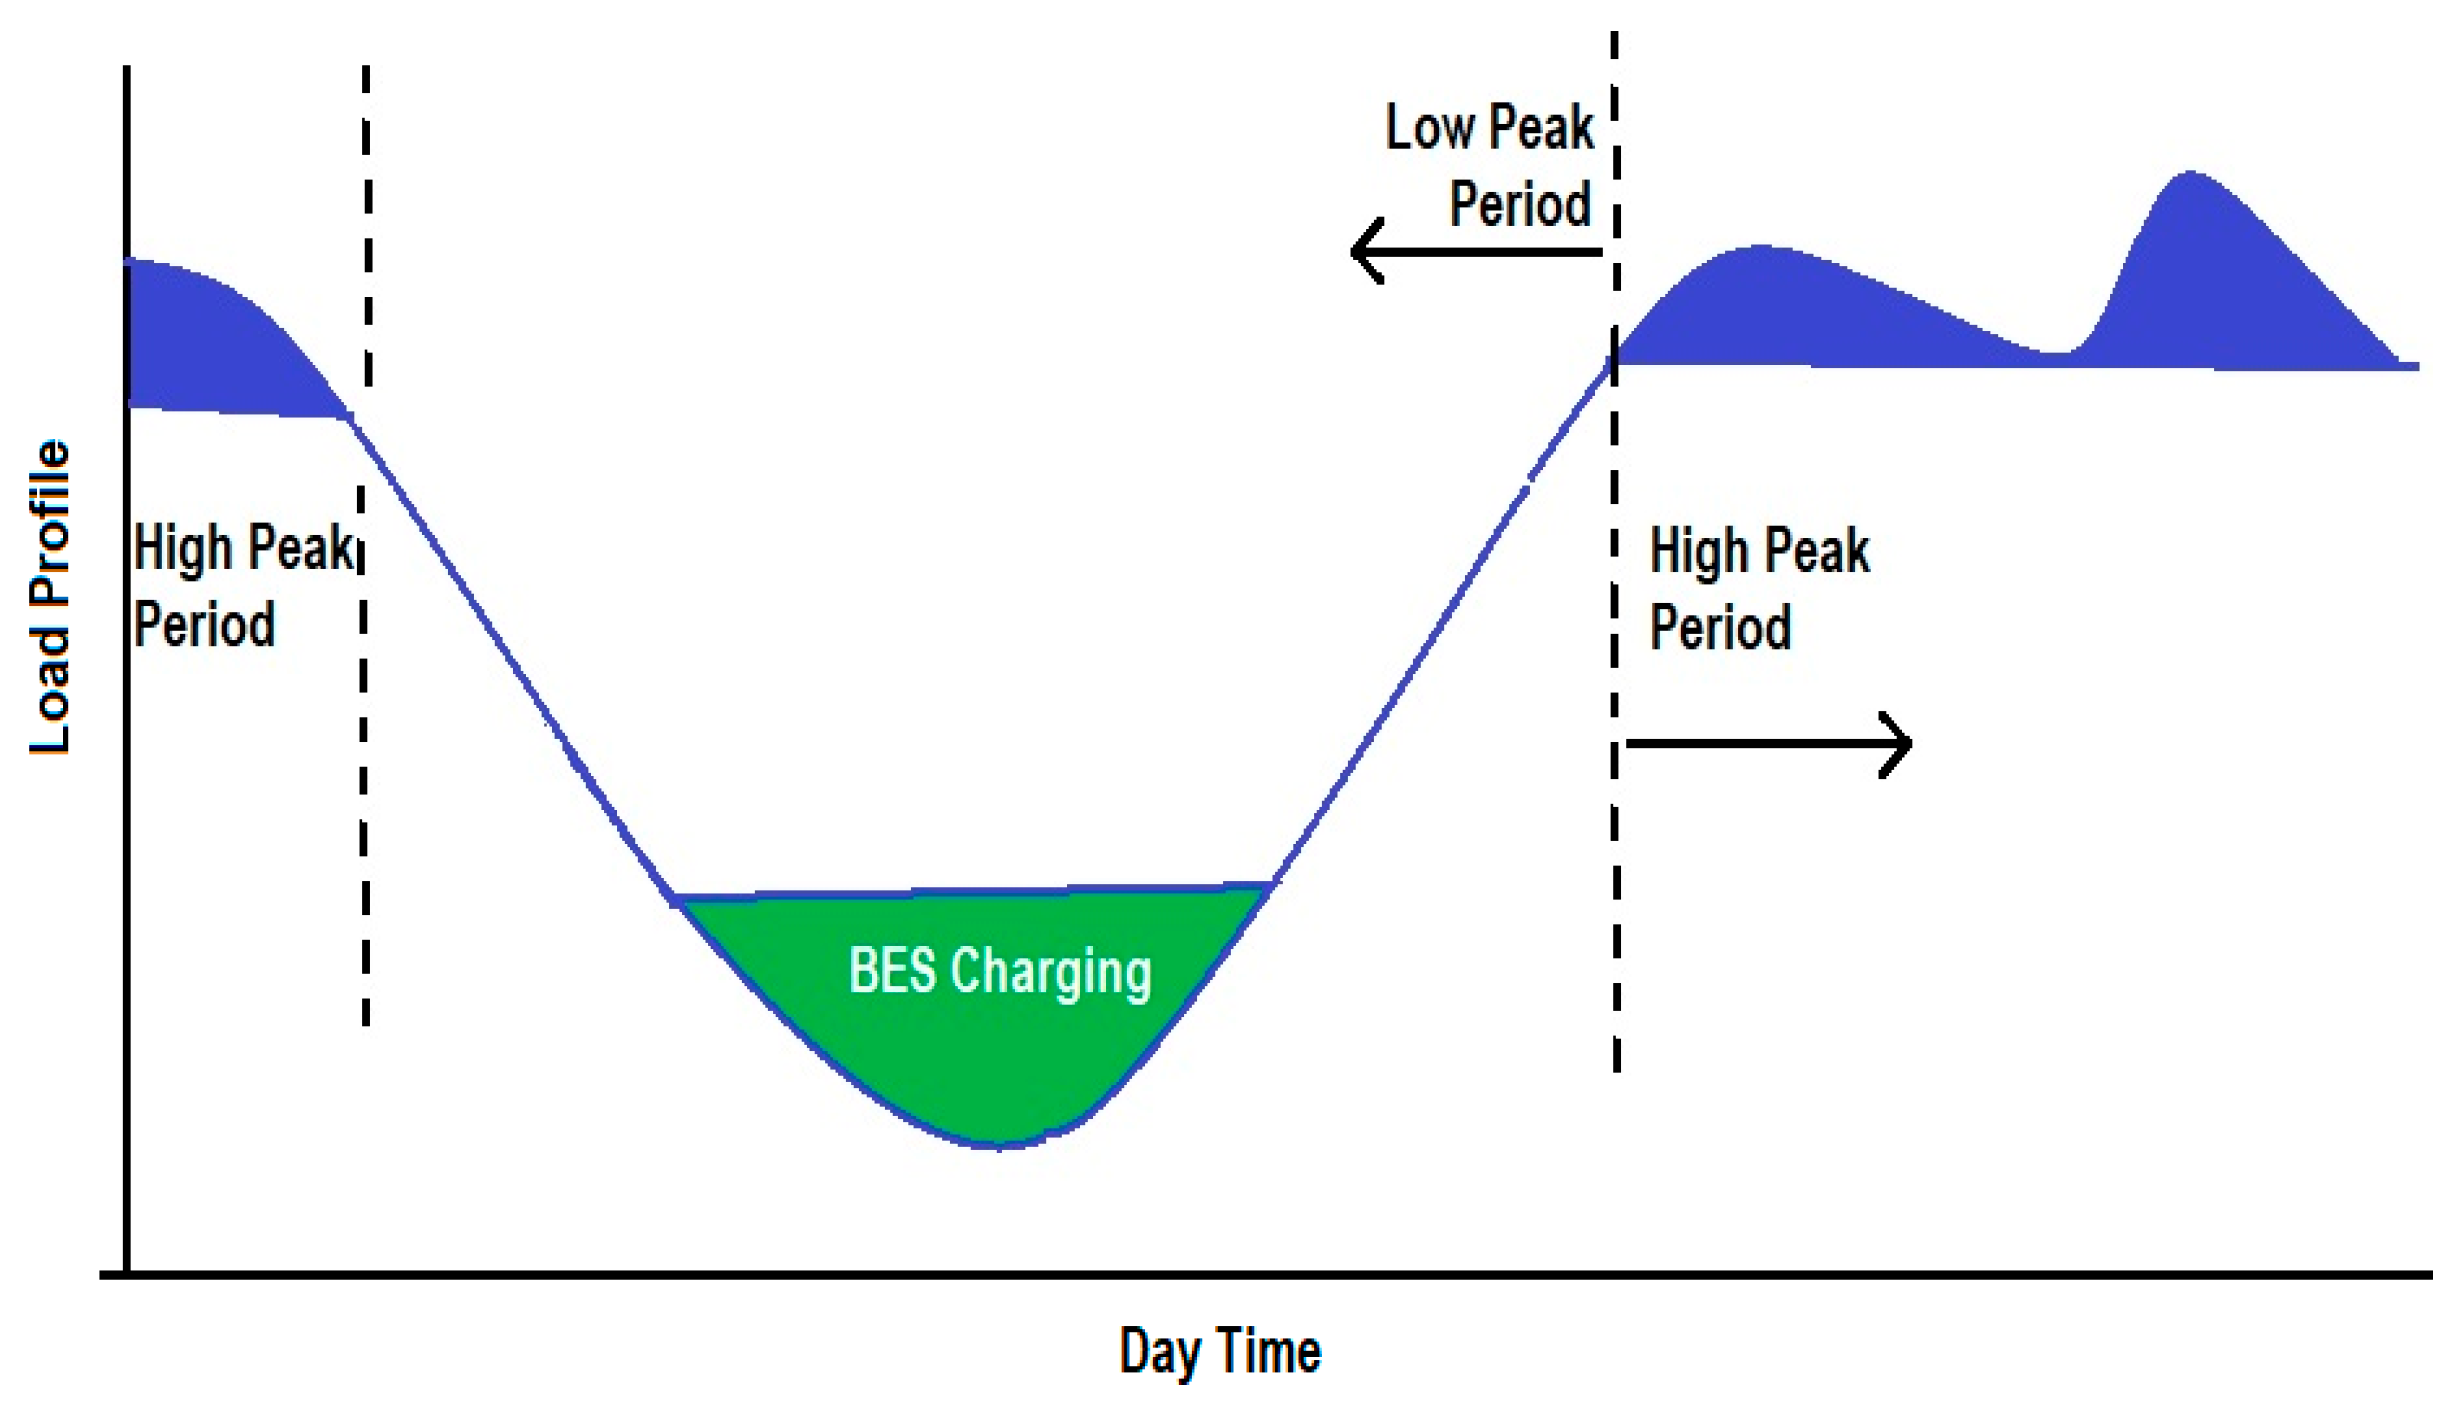
To effectively manage voltage-related challenges posed by high PV system integration—particularly during low-load and peak-load periods—this study proposed a combined mitigation framework utilizing both TOU demand shifting and BESS [5]. These tools were jointly implemented to enhance voltage stability and operational reliability under dynamic load and generation conditions. The hybrid mitigation concept integrates demand response and energy storage to proactively reduce voltage violations across the distribution network. As visualized in Figure 6, the strategy focuses on transferring energy demand from high-load periods to lower-demand times. During the low-peak window, when solar production often exceeds consumption, the BESS is charged. The stored energy is then dispatched during high-peak hours, reducing stress on the grid and helping maintain voltage within acceptable limits. This approach is particularly valuable in rural networks, where voltage fluctuations are more prominent due to long feeders and limited real-time control infrastructure. By aligning energy use patterns with PV generation profiles and providing backup support through stored energy, the hybrid technique maximizes system efficiency and minimizes the risk of undervoltage scenarios. While numerous studies have examined TOU or storage in isolation, fewer have investigated their combined application—especially in the context of multi-node solar integration across rural networks. The results from this study suggest that deploying TOU and BESS in tandem can offer a more resilient and cost-effective method for managing voltage deviations under high renewable energy penetration. Figure 7 presents the flowchart of hybrid mitigation.

3. Results and Discussion

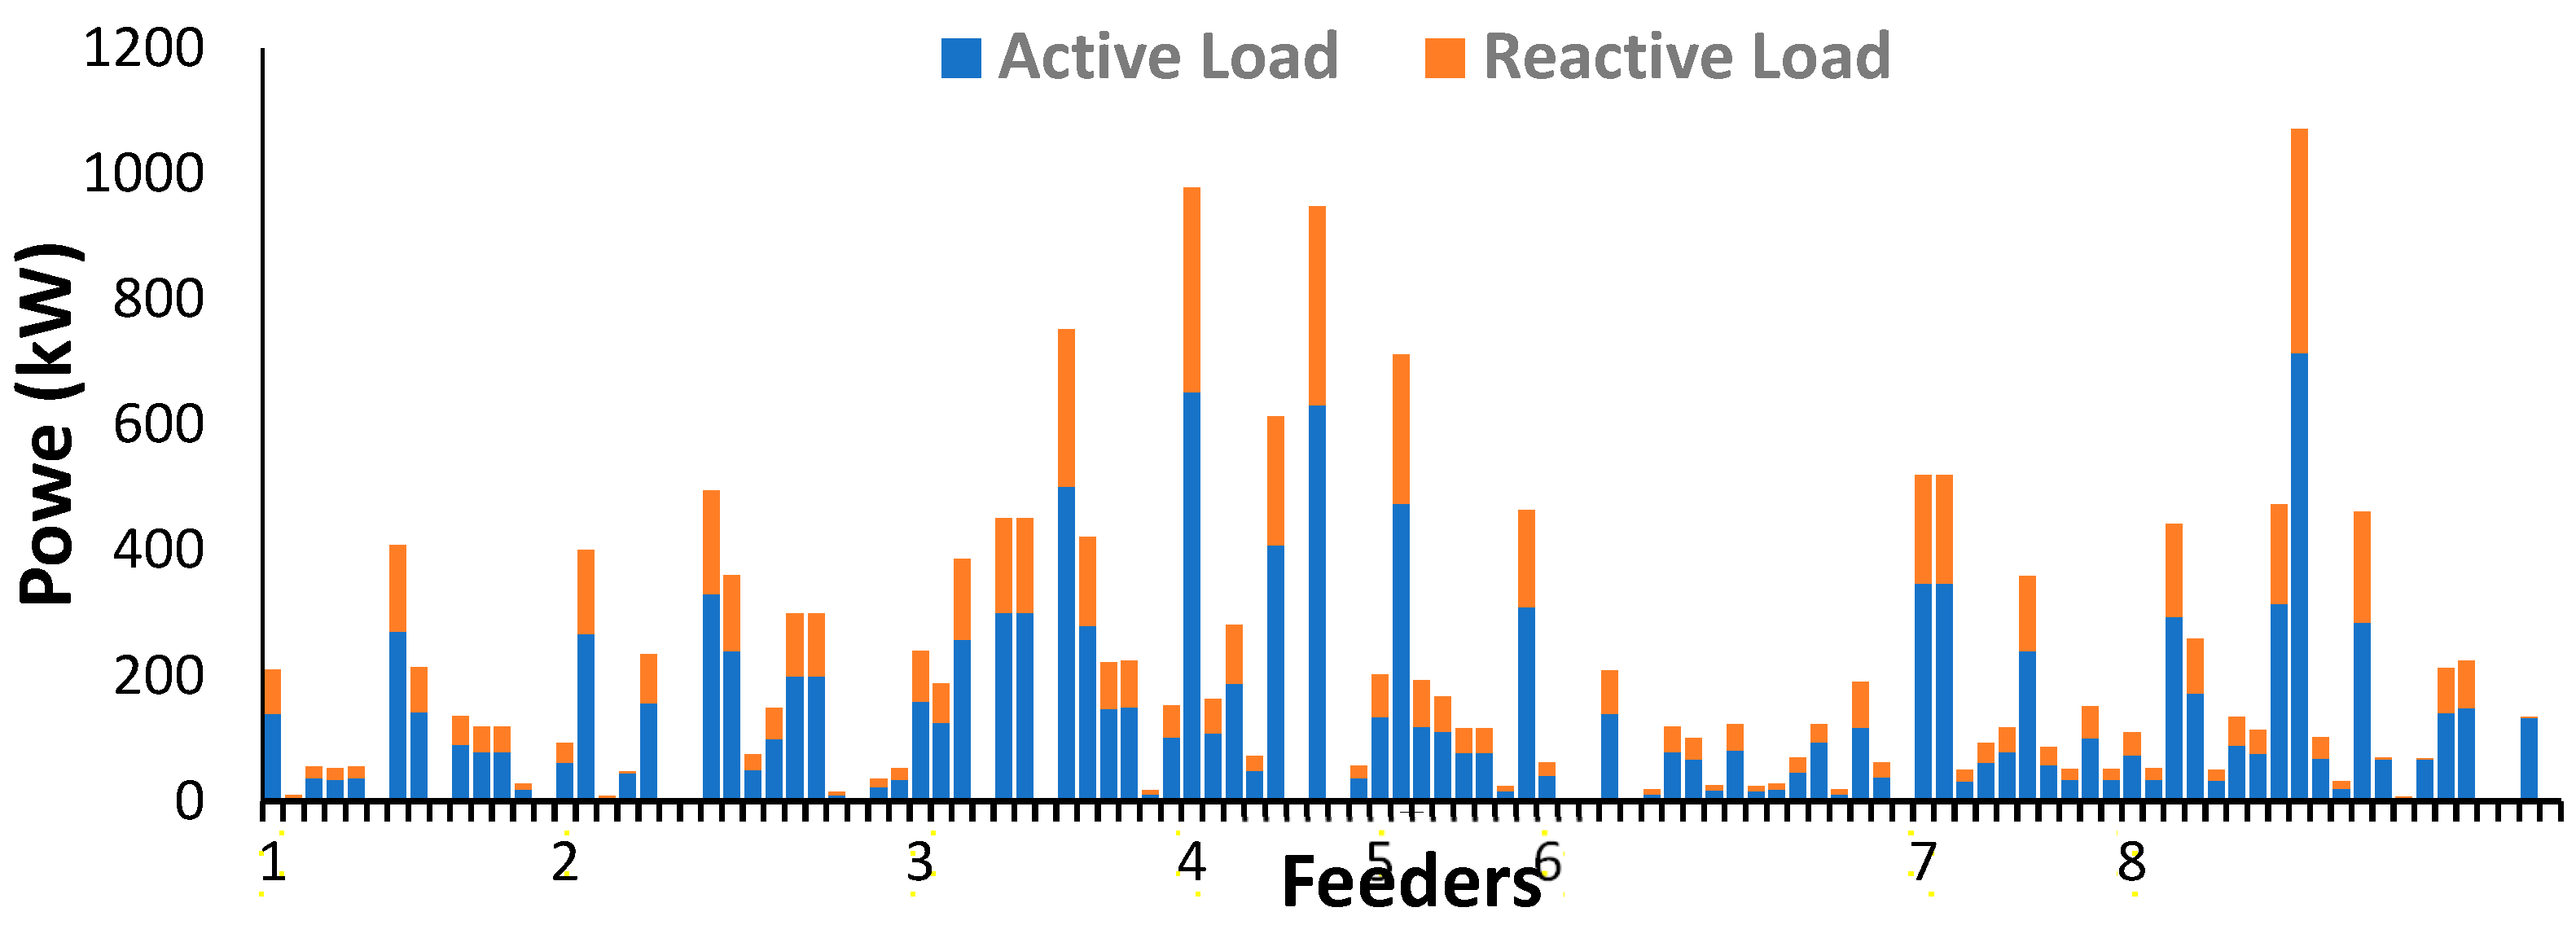
This section presents the outcomes of dynamic simulations performed on a typical Malaysian distribution network with an integrated PV system, focusing on how different mitigation approaches influence system performance. The analysis is organized into three main areas: the initial phase investigates how varying levels of PV penetration affect voltage stability when no corrective measures are in place, revealing critical points in the network that are prone to voltage violations. The second part explores the individual impact of two mitigation techniques, BESS and TOU programs, evaluating how each strategy independently helps in managing voltage fluctuations. The final phase examines a hybrid approach that combines BESS and TOU, aiming to enhance grid resilience through coordinated storage and load-shifting mechanisms. The active and reactive load distribution across the network is illustrated in Figure 8, where Feeder 8 stands out with the highest load demand, registering 714 kW of active and 357 kVAR of reactive power. This feeder is also the most geographically distant, located about 25 km from the substation, which naturally contributes to elevated line losses and a higher risk of voltage instability, conditions frequently encountered in rural electrical systems. These results underscore the importance of tailoring mitigation strategies to the unique layout and operational characteristics of rural networks. Long feeder spans, limited infrastructure, and uneven load distribution require not just technical upgrades but also demand-side participation to ensure reliable and efficient power delivery. The integration of BESS and TOU, especially in remote areas, offers a promising solution to support voltage regulation, minimize losses, and enhance overall grid performance under high renewable energy penetration.
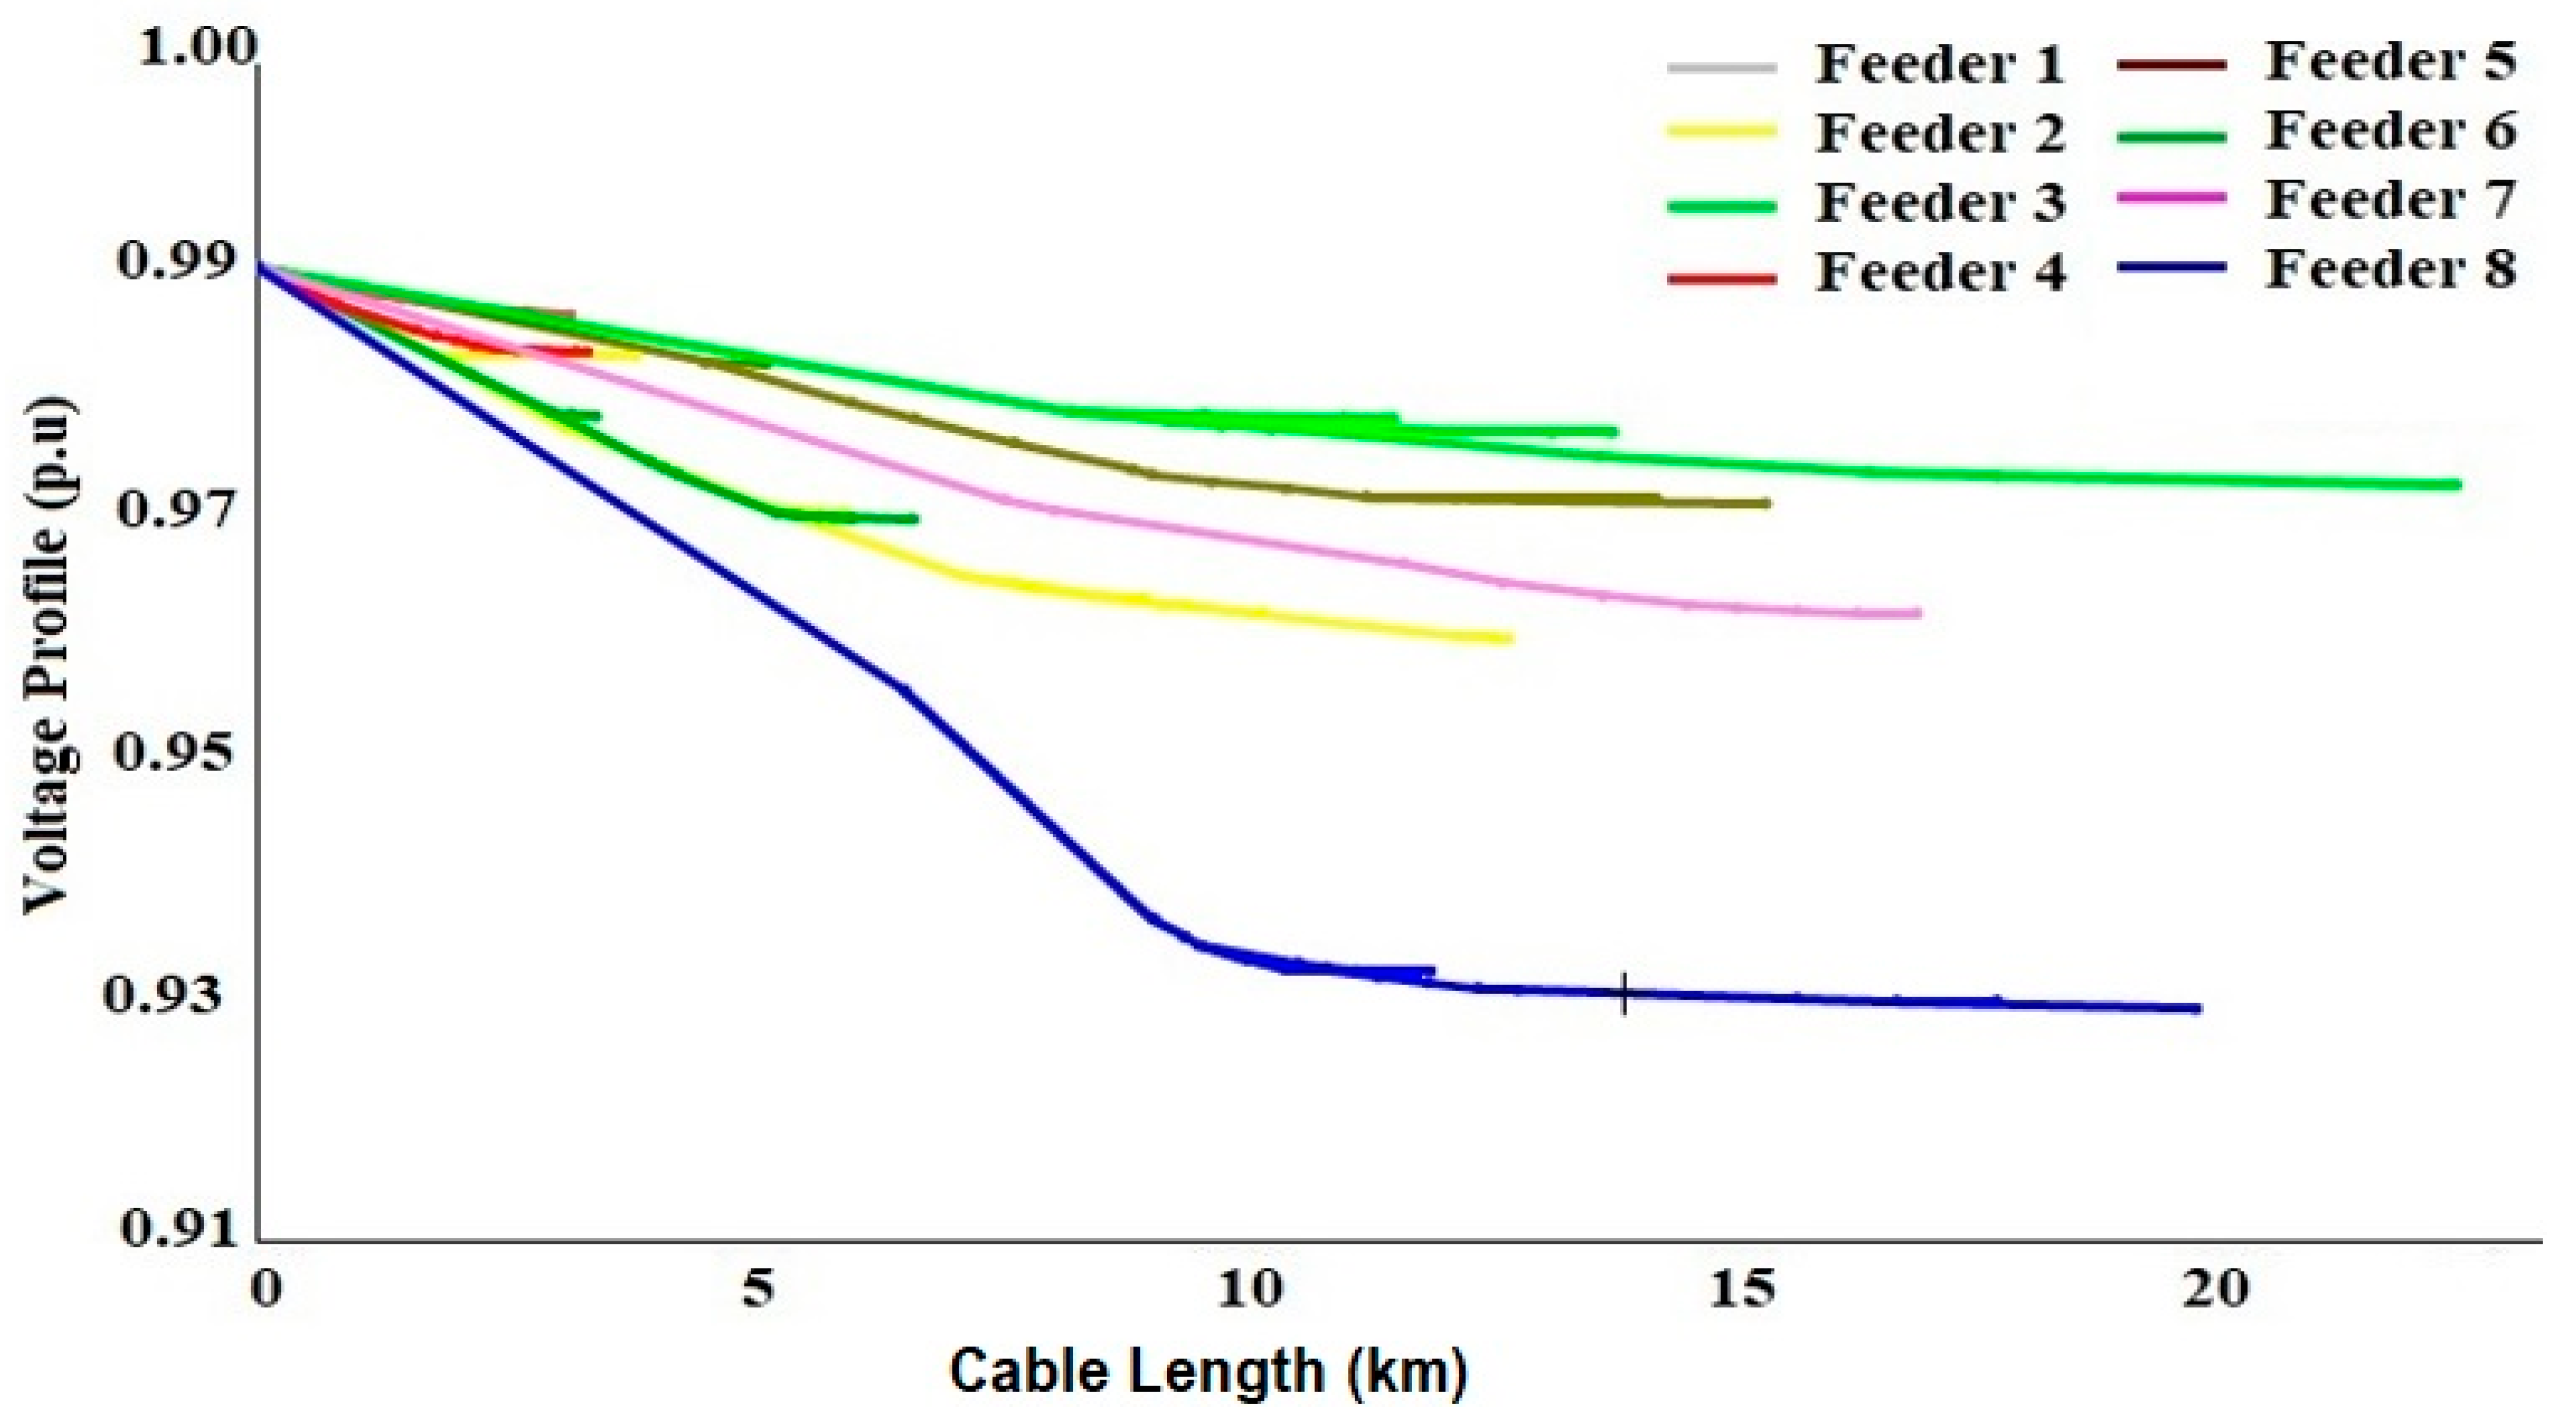
The primary objective of this study is to manage and stabilize voltage levels when PV systems are connected to the distribution grid. Figure 9 illustrates the system’s voltage behavior prior to the implementation of any mitigation measures. The modeled network comprises eight feeders, each distinguished by a separate color for clarity in analysis. Notably, Feeder 8 consistently exhibits the most severe voltage irregularities, making it a critical point of concern. These voltage deviations appear to be linked to the feeder’s distance from the substation as well as its load concentration. Interestingly, Feeder 6—despite being the longest in the system—shows stable voltage performance. This can be attributed to its relatively lower number of connected loads, which reduces cumulative voltage drops along the line. The figure also illustrates how voltage levels decrease with increased line length and electrical loading—a condition especially relevant in rural distribution networks, where feeder spans are typically long and serve scattered demand points.
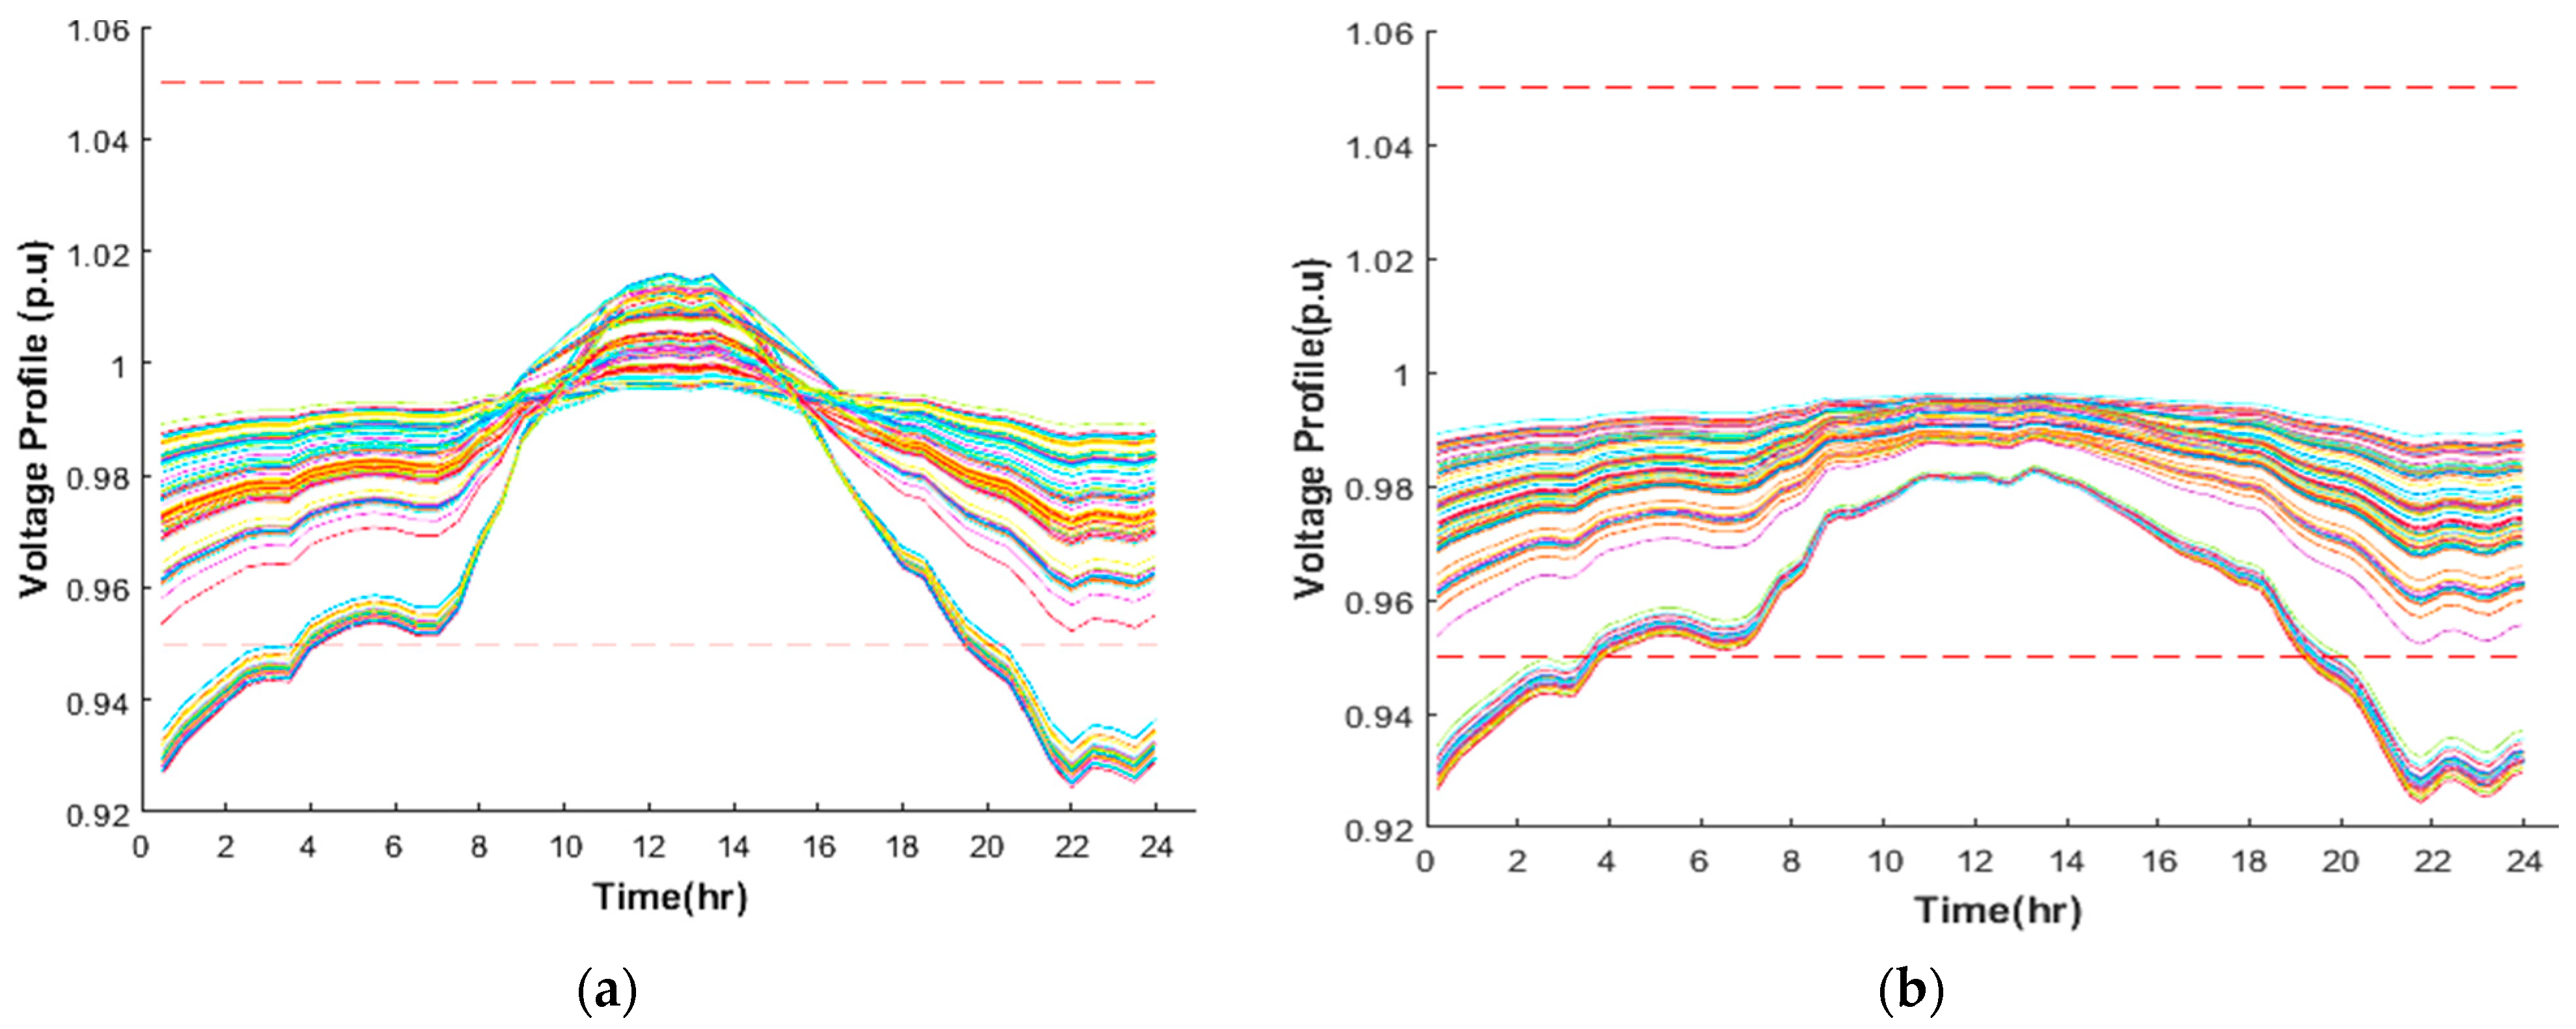
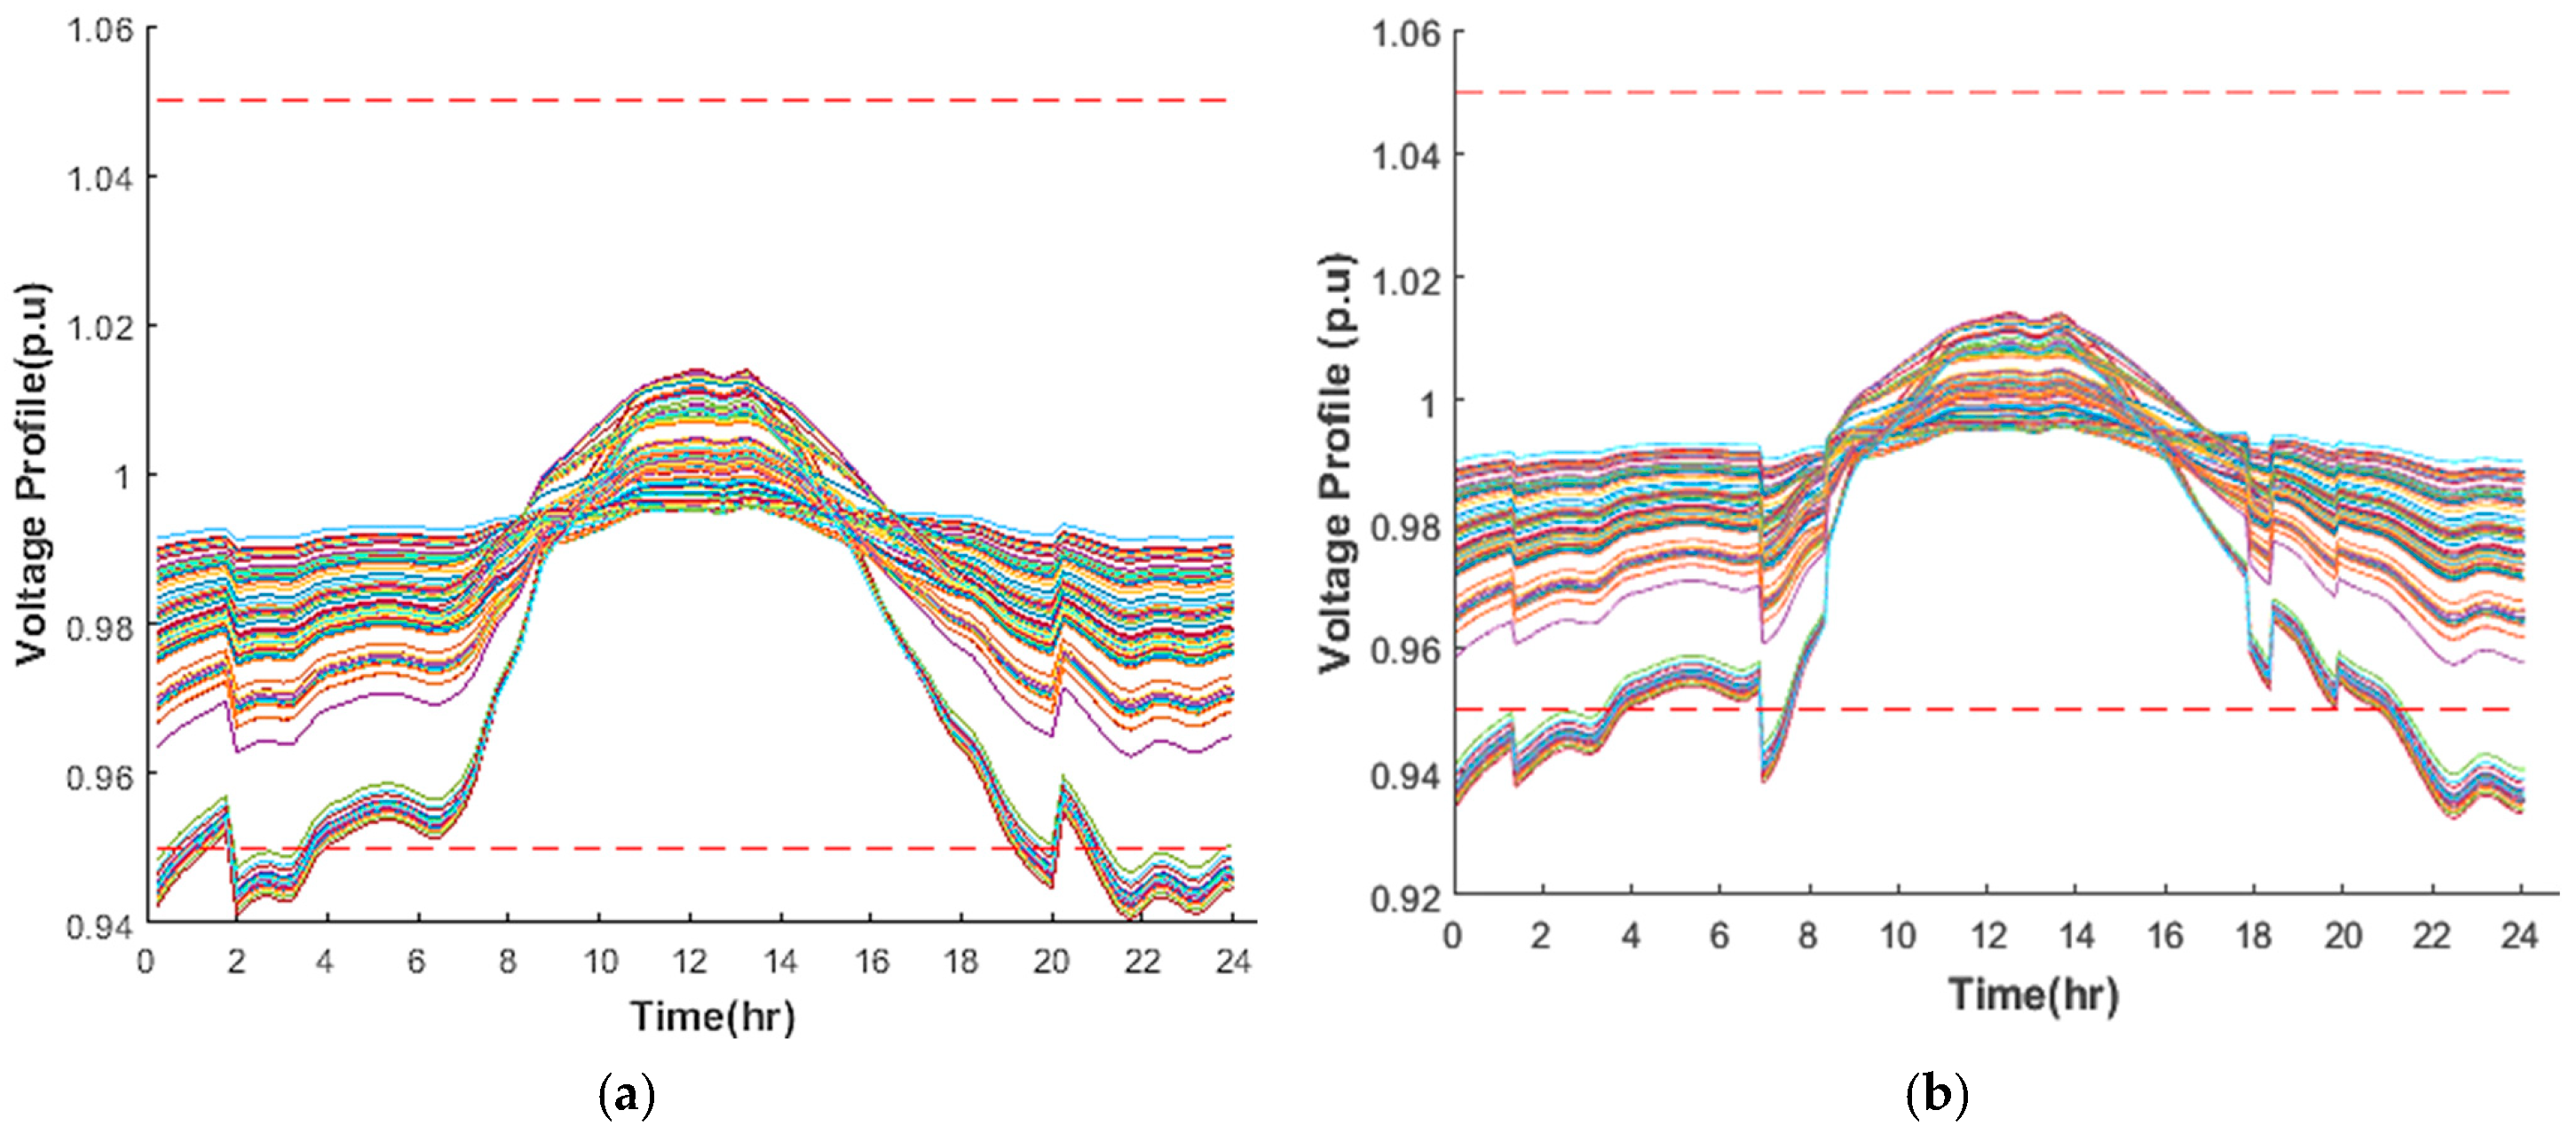
Integrating PV into rural power distribution networks presents a promising approach to improving voltage stability, especially in areas with long feeders and limited grid reinforcement. However, studies examining widespread PV deployment across rural nodes remain limited. In this investigation, each node in the rural test network was assigned a 100 kW PV system unit, and simulations were conducted to determine the impact of various penetration levels under both light and heavy loading conditions. The aim was to identify the most effective PV sizing strategy to support voltage regulation across rural grid segments. Figure 10 illustrates the voltage profiles for full (100 kW) and partial (20 kW) PV deployment scenarios. The results reveal that during daytime hours, voltage levels peak around 1.02 p.u., benefiting from abundant solar output. However, this excess generation can become problematic if not properly managed, especially when local demand is low. At night—between approximately 8:30 p.m. and 3:00 a.m.—the system exhibits voltage dips, with some nodes experiencing values below acceptable thresholds. This effect is more pronounced in rural grids, where longer feeder distances increase resistance and the risk of voltage drops, particularly in the absence of evening generation. To address these issues, a key recommendation is to shift daytime solar surplus to align with peak demand periods, ensuring that energy is available when it is most needed. This may involve integrating energy storage systems or deploying demand-side strategies to reshape rural consumption patterns. This study highlights that for rural networks, optimal PV deployment must be coupled with intelligent energy management to ensure voltage compliance and improve overall grid performance. Supporting this integration with policies and technologies tailored to rural conditions is essential for long-term sustainability.
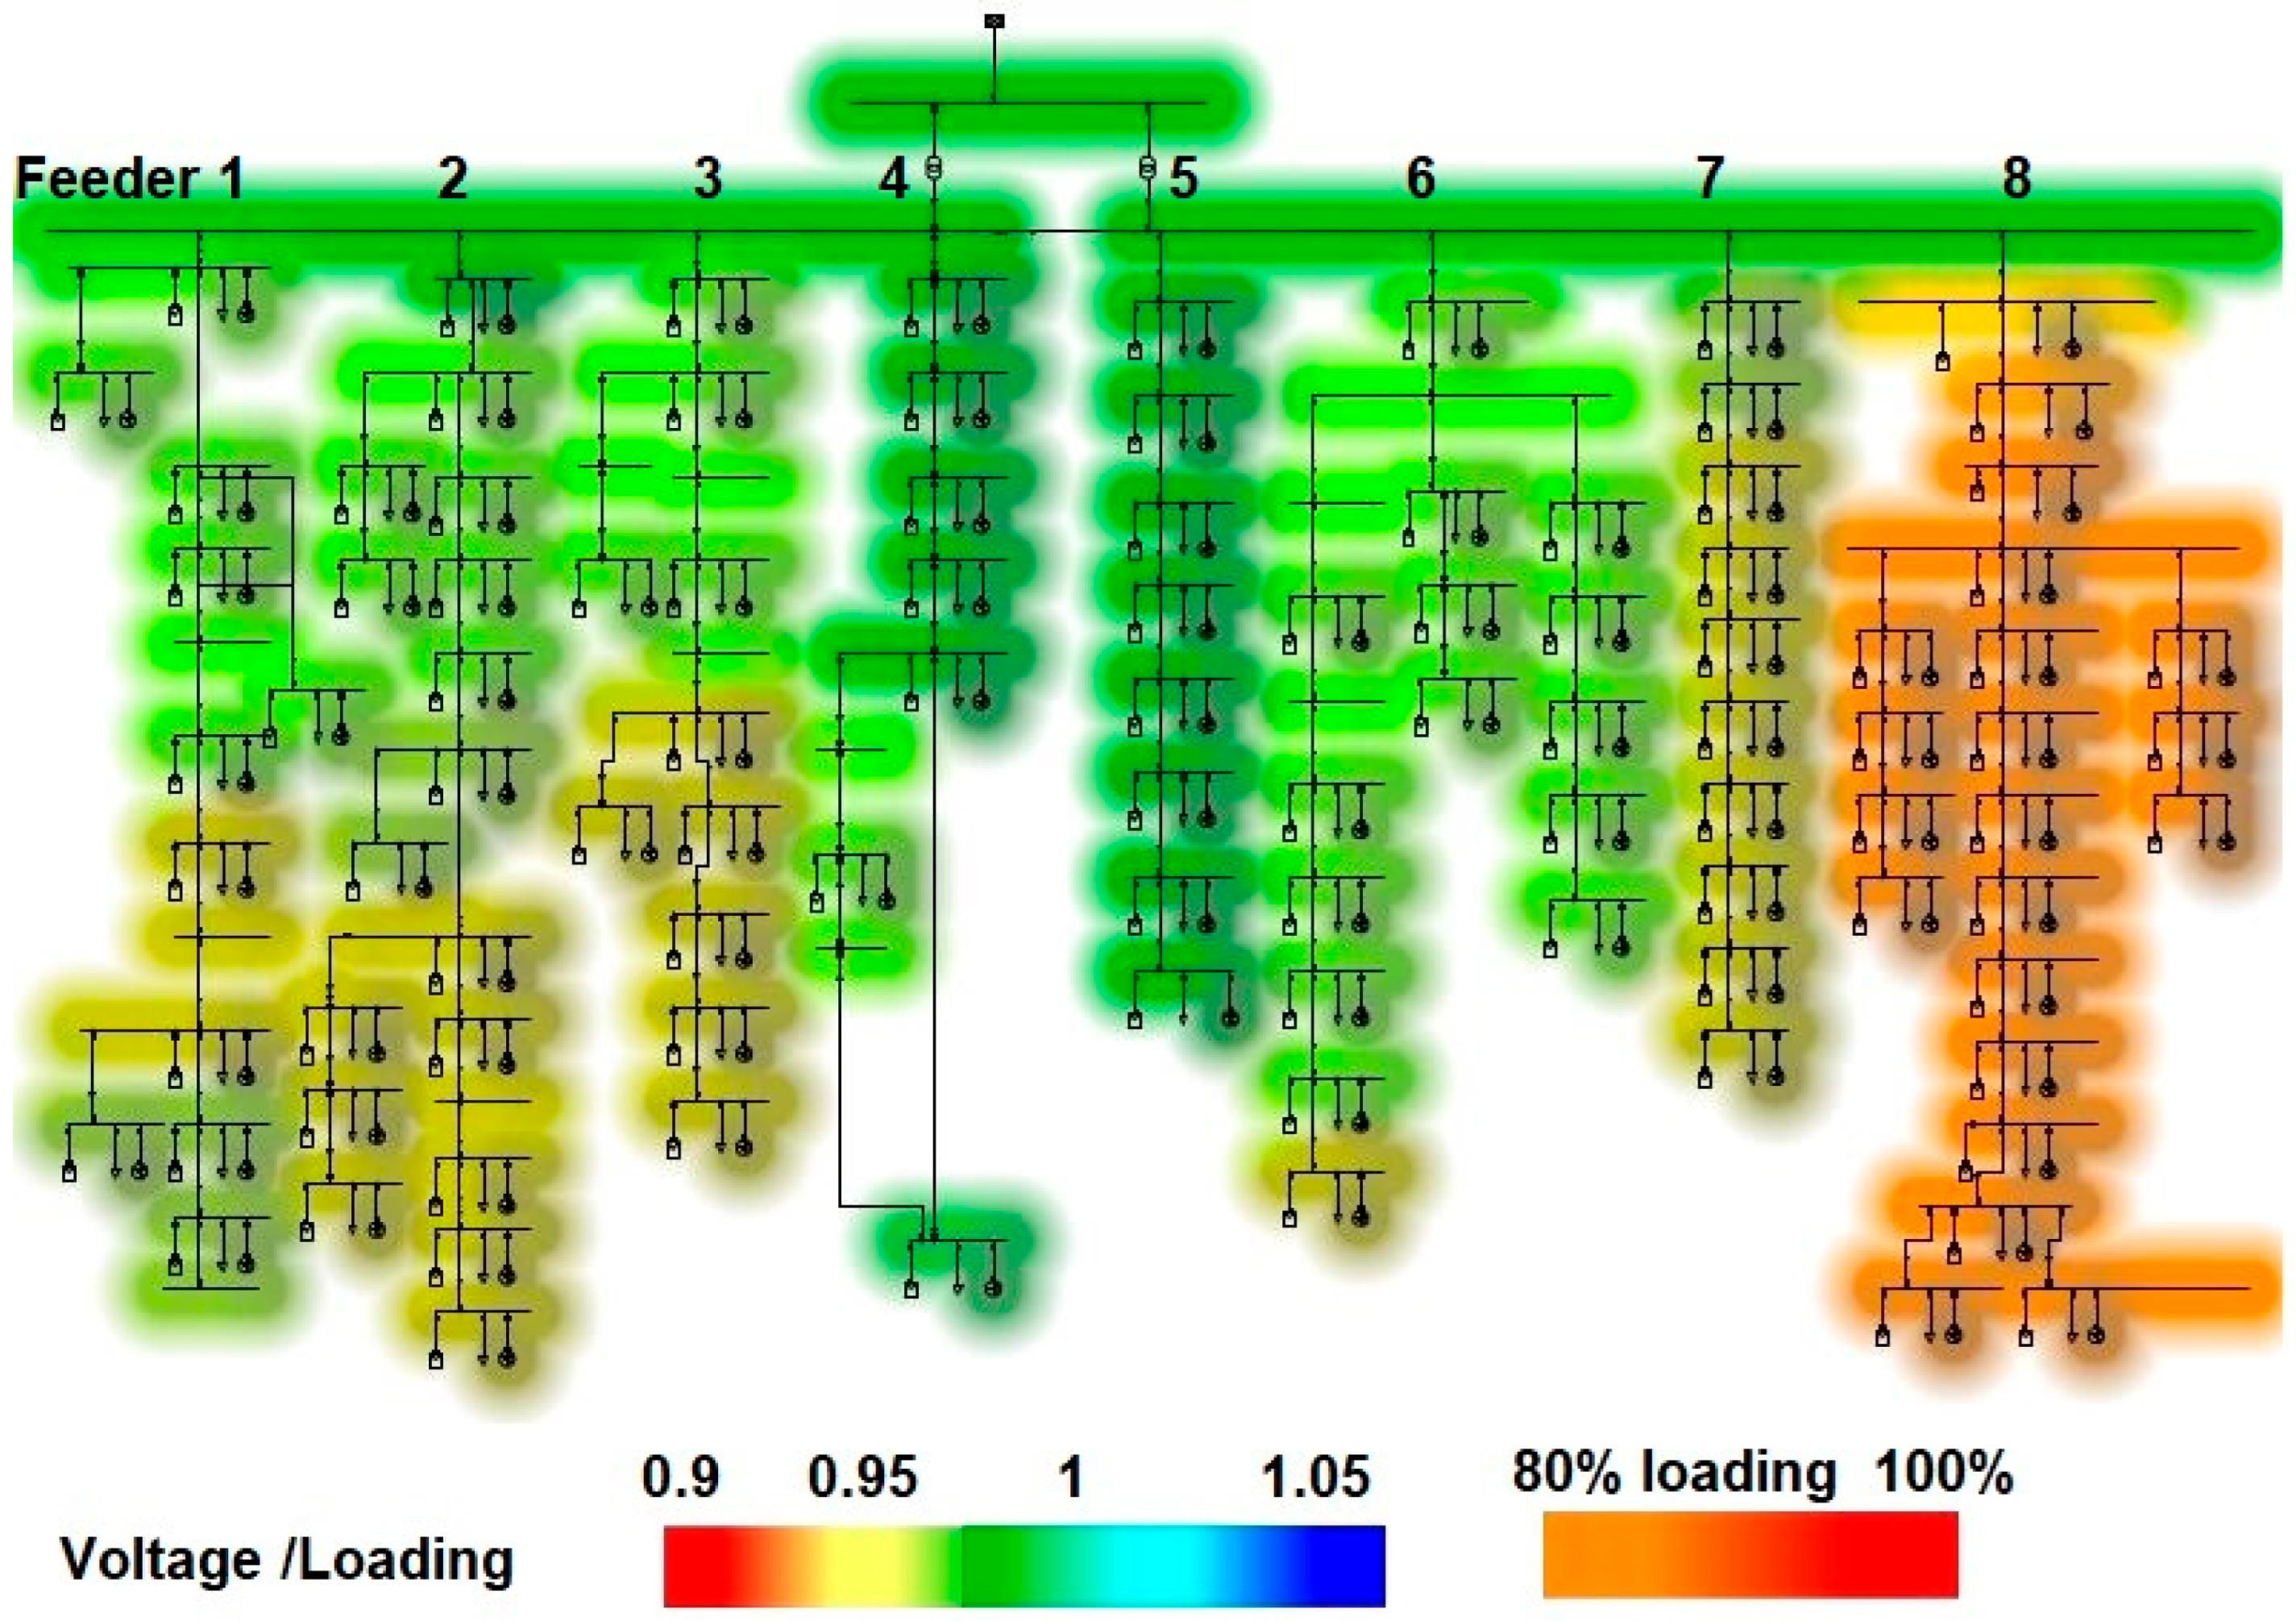
Figure 11 provides a comprehensive heat map of the voltage and loading profile across all nodes in the rural distribution network prior to the integration of PV systems or any mitigation strategies. Each feeder (labeled 1 through 8) is represented with color gradients to indicate both voltage magnitude and loading stress. The color scale at the bottom ranges from red (0.9 p.u., indicating critically low voltage) to yellow and green (0.95–1.0 p.u., nominal voltage range) and up to blue (1.05 p.u., potentially over-voltage). Orange and red overlays highlight regions of high loading, with 100% loading depicted in deep orange/red and 80% loading in lighter orange tones. A closer examination reveals that Feeders 3 and 8 are the most vulnerable segments within the network. Large areas within these feeders, especially at their farthest nodes from the substation, are shaded in orange and red, demonstrating both high loading (close to or exceeding 100%) and significant voltage drops—sometimes falling below the 0.95 p.u. threshold. This dual stress can be attributed to two main factors: (1) long feeder lengths, which inherently cause greater voltage drops due to higher impedance, and (2) higher aggregated load at the extremities, which exacerbates voltage depression. Such conditions increase the risk of undervoltage events and could lead to customer supply interruptions or equipment malfunction if left unaddressed. Feeders 1 and 2 also display moderate voltage drops and higher loading, predominantly at their terminal nodes. This reflects typical challenges in rural grids, where the combination of extended feeder lines and dispersed, but significant, loads pushes voltage below optimal levels, especially during periods of peak demand. In contrast, Feeders 4, 5, and 6 maintain relatively stable operation, indicated by consistent green coloration throughout their lengths. This suggests that these feeders benefit from shorter distances, lower aggregated loads, or a more favorable balance between load and supply, resulting in voltage profiles that remain close to the nominal value (1.0 p.u.) and within safe operating margins.
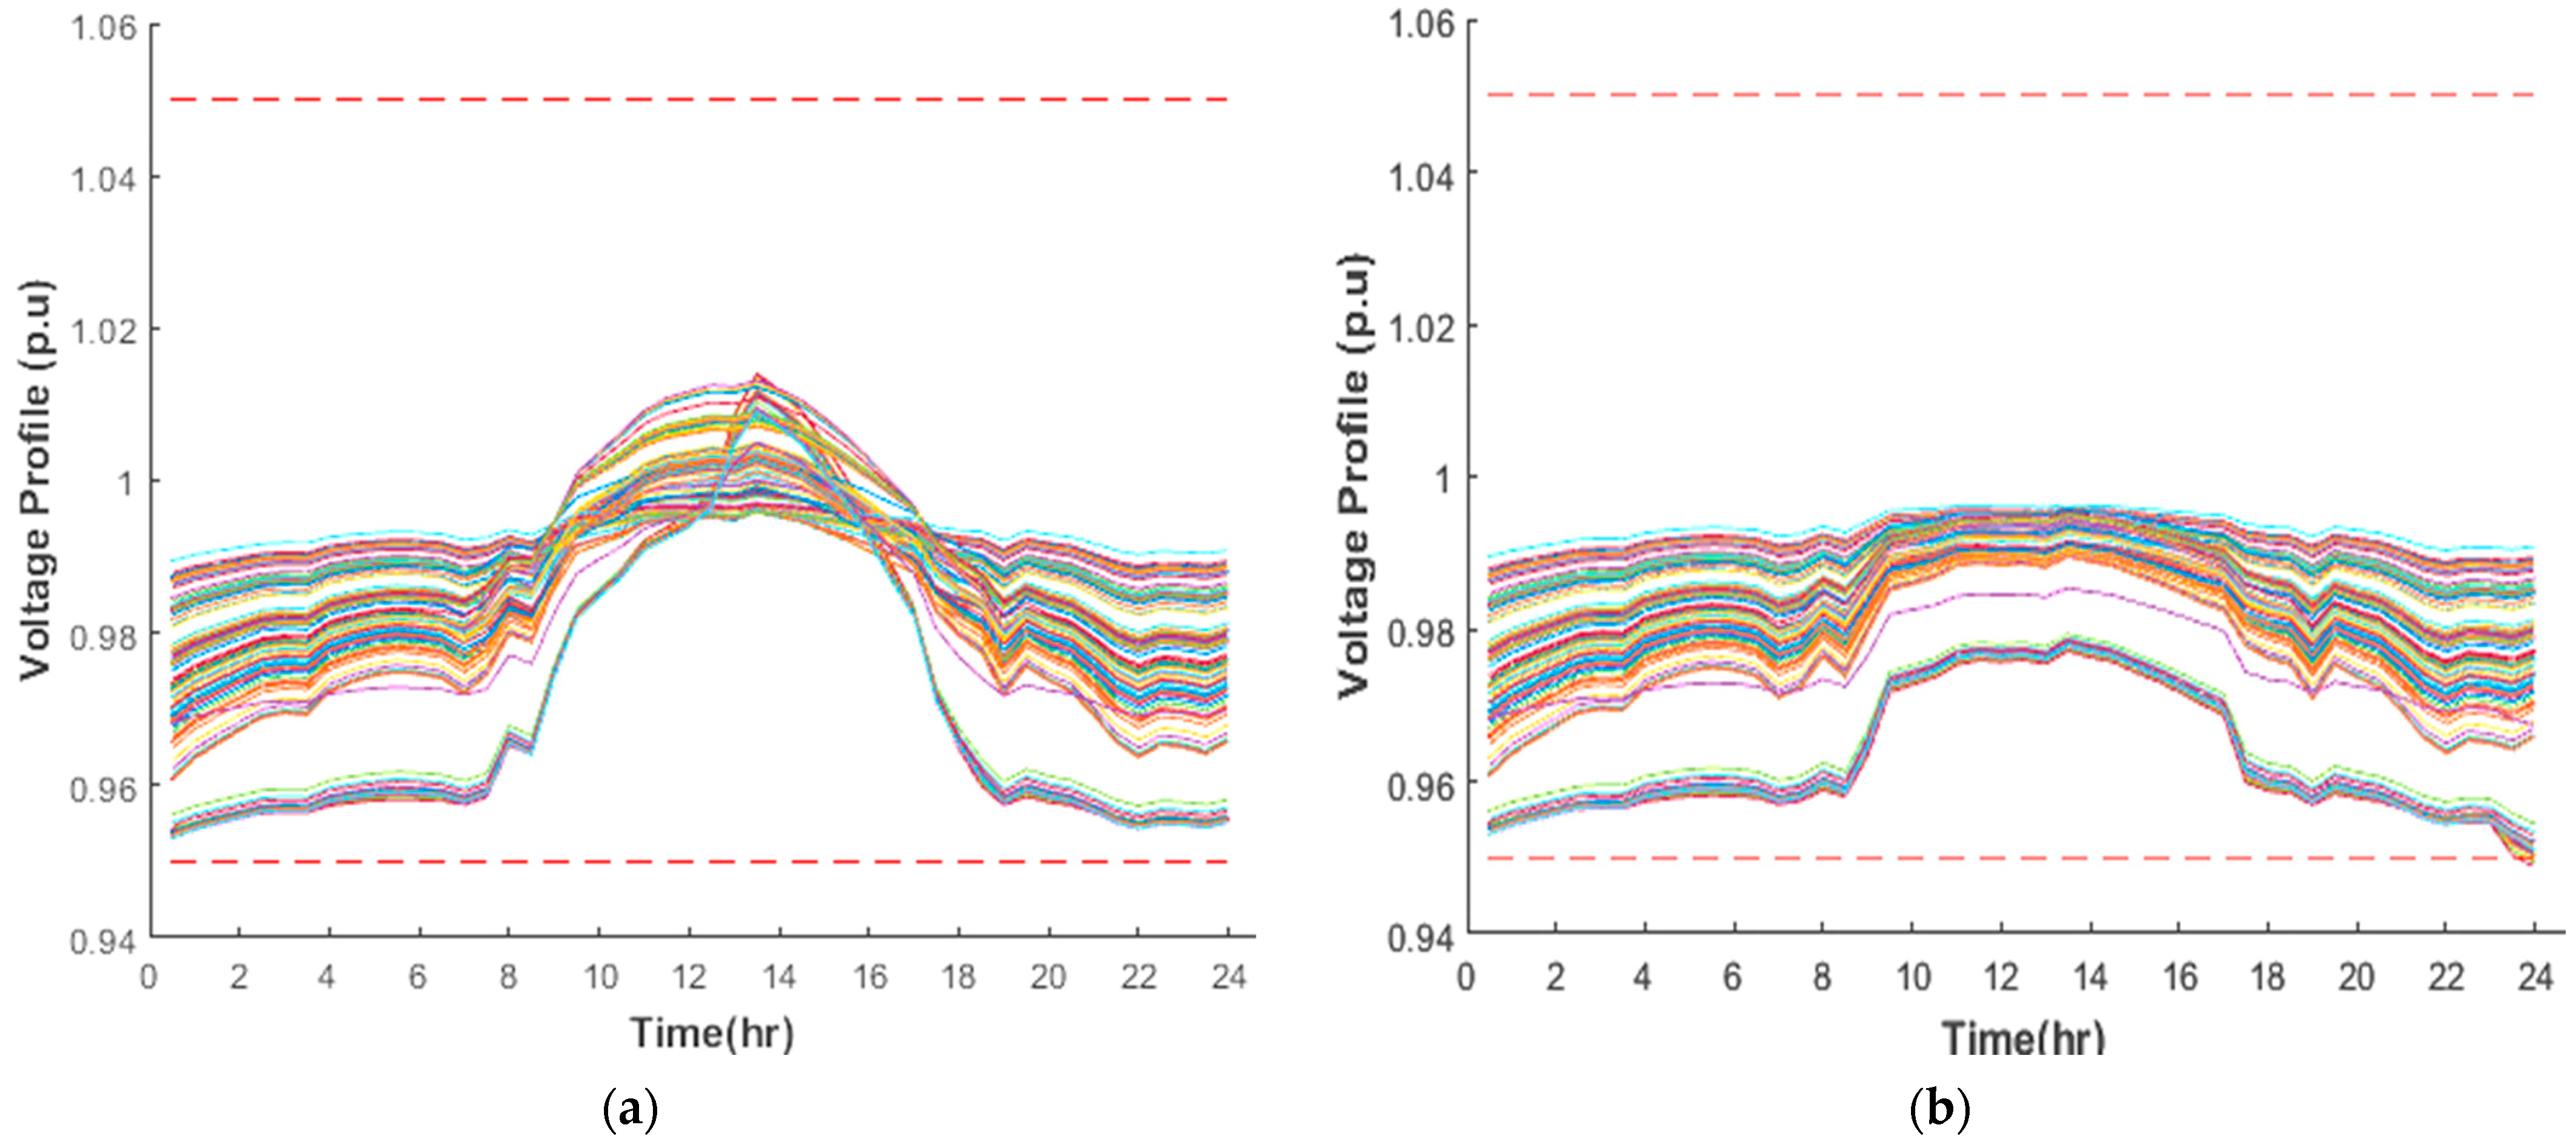
One of the initial strategies explored in this study was the use of the DR program combined with PV system integration to alleviate voltage issues, particularly during evening hours when generation drops. This method involved adjusting consumer demand patterns using TOU pricing, with Figure 12a illustrating the voltage response of the network under a 20% TOU implementation scenario. In rural power systems where infrastructure is limited and grid support is often weaker, DR programs have strong potential but also face unique challenges. The analysis reveals that TOU alone is insufficient to eliminate voltage violations, especially under high PV penetration. Even with a 20% participation rate, some nodes continue to experience undervoltage, particularly at night when solar output ceases and loads remain active. Interestingly, during daylight hours, voltage levels can spike, reaching as high as 1.02 p.u. due to excess generation not being matched by consumption. These fluctuations highlight the need for a more balanced approach to managing both surplus and deficit periods in rural distribution systems. Given that raising TOU participation beyond a certain point may not be practical or effective, especially in rural areas with limited consumer engagement or technological readiness, it becomes crucial to promote DR adoption more effectively. Outreach programs, incentives, and education can encourage rural consumers to participate in DR schemes. At the same time, combining DR with battery energy storage systems can provide the additional support needed to stabilize voltage and ensure consistent power quality. This underscores the need for hybrid mitigation strategies and greater policy focus on rural energy behavior, where the success of grid stability measures depends not only on technology but also on community participation.
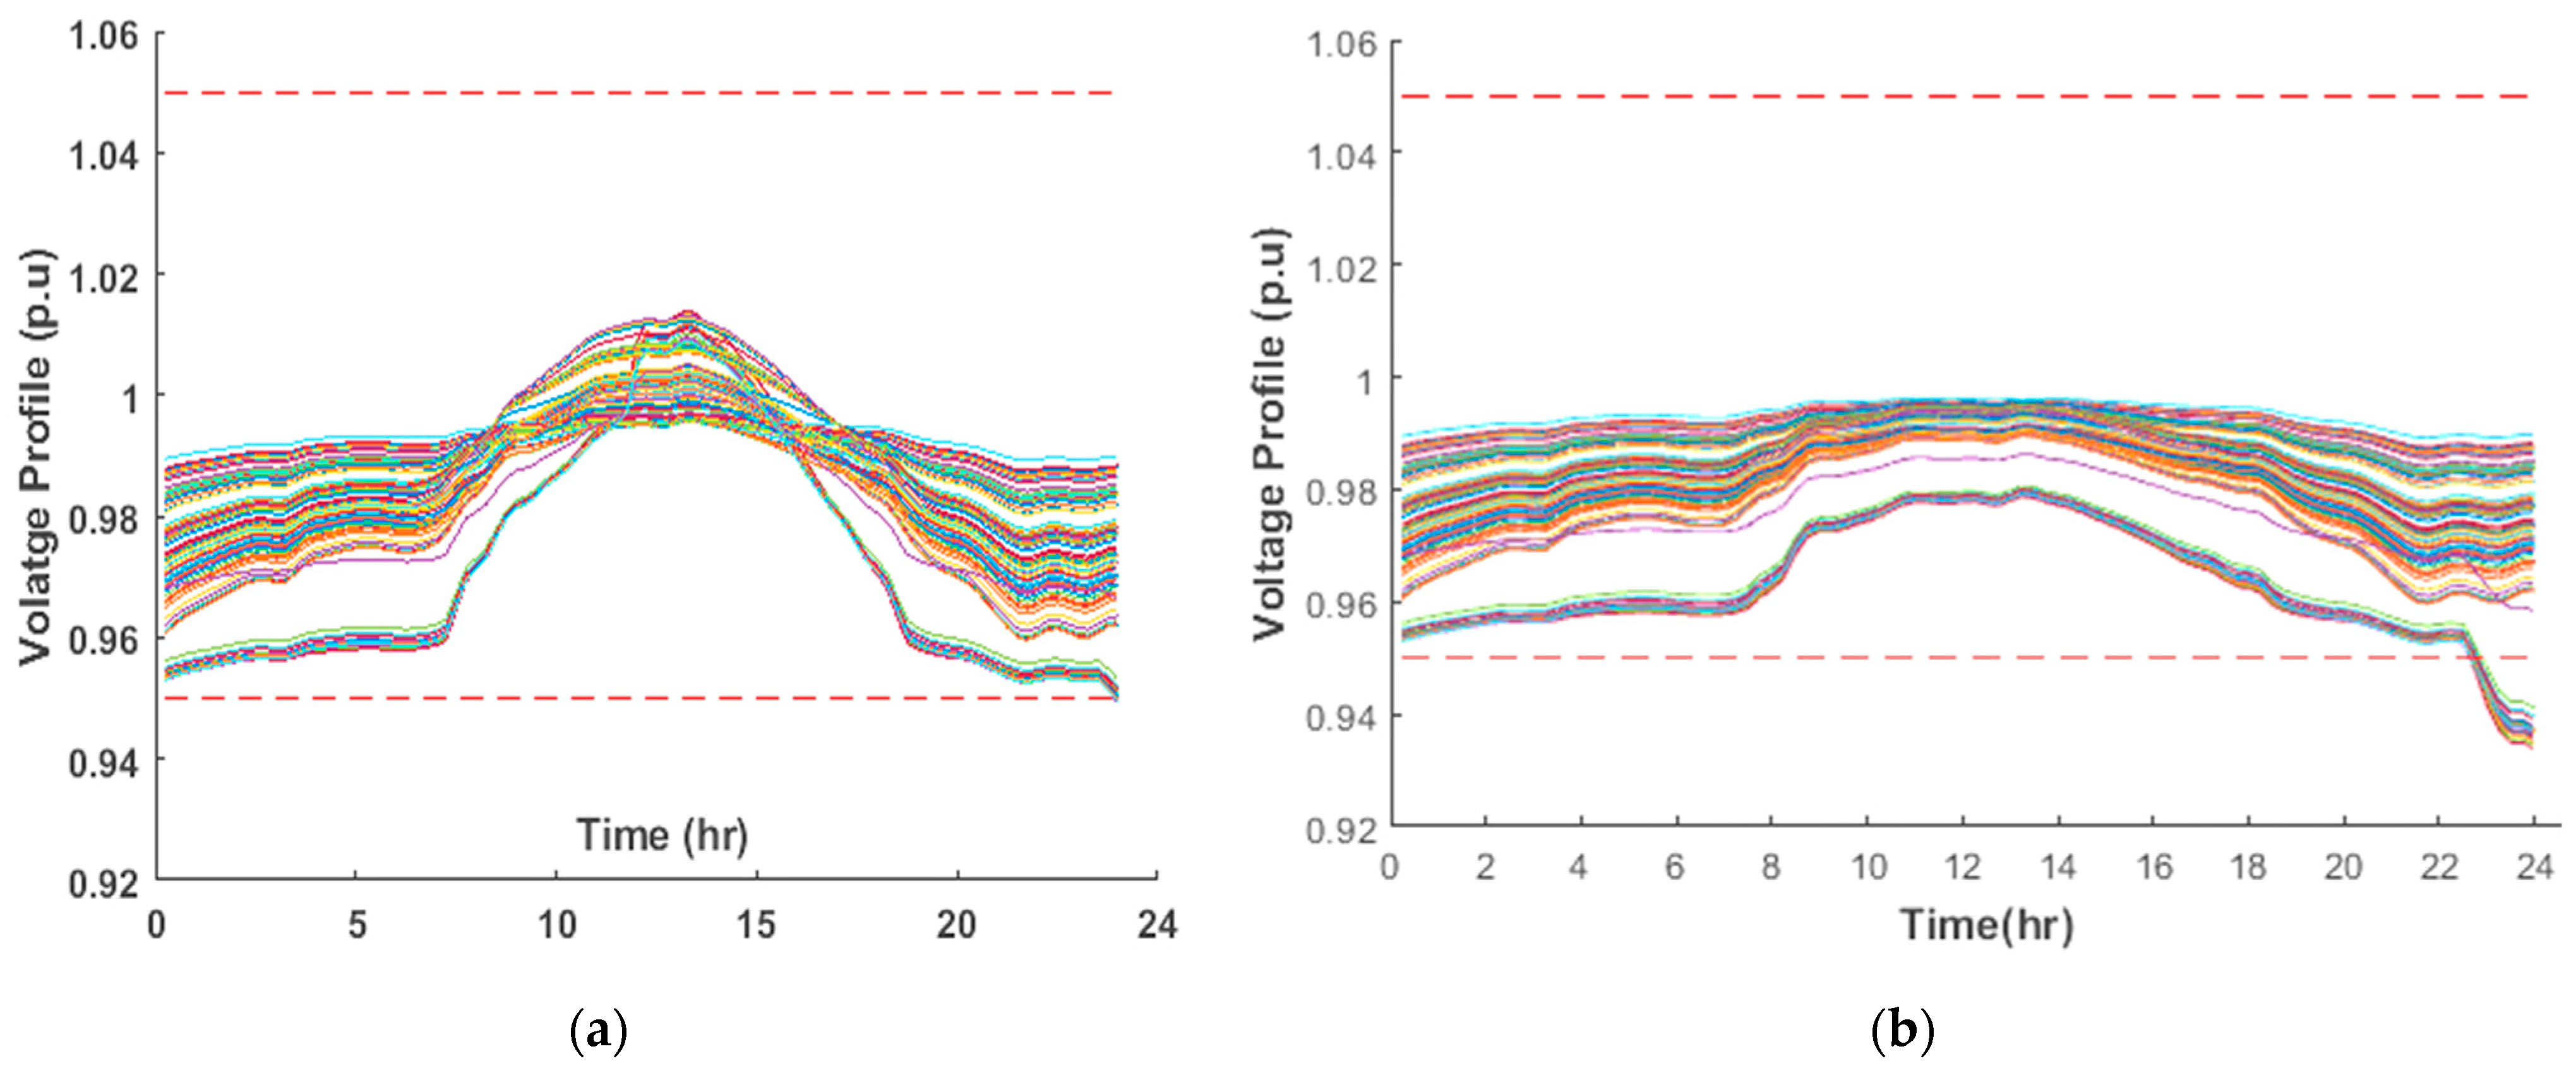
The effect of BESS on voltage stability in rural networks is illustrated in Figure 13a,b. These figures present the voltage profiles for all 110 nodes in the network over a 24 h period under two different PV penetration scenarios: (a) 100% and (b) 20%, with each node equipped with a 0.4 MWh BESS. As shown in Figure 13a, at 100% PV penetration, the BESS units significantly help maintain node voltages within the acceptable range (between the red dashed lines indicating 0.95 and 1.05 p.u.). During the daytime, abundant solar generation allows the BESS units to charge, and as solar output declines in the evening, the stored energy is released to support the network. This results in relatively stable voltage profiles, with most nodes remaining above the minimum threshold (0.95 p.u.) throughout the 24 h period. Only a few nodes—typically at the end of long feeders—approach the lower limit after midnight, but widespread voltage violations are avoided. In contrast, Figure 13b illustrates the situation at 20% PV penetration. Here, the available solar energy is much lower, which limits the amount of energy that can be stored in the BESS units during the day. As a result, after sunset, the BESS units are unable to sufficiently support the evening and nighttime load, leading to more nodes experiencing voltage drops below the 0.95 p.u. threshold, particularly after 10 p.m. This is especially pronounced in areas of the network with higher line impedance and longer feeders. Together, these results clearly show that while BESS can greatly enhance voltage stability at high levels of PV penetration, their effectiveness is constrained by both the total amount of solar energy available for storage and the storage capacity itself. At lower PV penetration levels, BESS alone may not be sufficient to prevent voltage violations during periods of peak demand or low solar generation. Therefore, as indicated by the comparison of Figure 13a,b, an integrated approach—combining BESS with additional demand-side management strategies such as TOU load shifting—may be necessary to ensure reliable voltage regulation across the entire rural network, especially when solar generation is limited.
Conducting a detailed sensitivity analysis is essential when evaluating the performance of mitigation strategies under varying levels of PV integration—especially in rural power systems, where grid stability is inherently more vulnerable. Rural networks typically involve long feeders, uneven load distribution, and limited control infrastructure, making voltage regulation more complex. The analysis summarized in Table 4 explores how different configurations of BESS and TOU participation influence voltage behavior across the system. The findings indicate that higher TOU engagement, particularly at 20%, significantly reduces voltage violations and also lowers the required BESS capacity. For instance, under full PV penetration (100%) with a 0.6 MWh BESS, only a small number of nodes still experienced undervoltage conditions. When just 10% TOU participation was added, many of these violations were resolved. Furthermore, the analysis reveals that even with a smaller BESS capacity (0.4 MWh), incorporating TOU at modest levels (up to 20%) under full PV penetration can shift a considerable portion of violations into the acceptable range. This is particularly beneficial for rural systems, where upgrading infrastructure can be costly and slow. Ultimately, this sensitivity assessment demonstrates the importance of tailoring mitigation solutions to grid-specific conditions. In rural environments, hybrid approaches—leveraging both demand-side and storage-based strategies—offer a practical pathway to maintaining voltage within regulatory limits, even under variable PV penetration scenarios.
Previous analysis indicated that relying on a single mitigation method is often insufficient to address voltage irregularities under varying levels of distributed generation penetration—particularly in rural electrical networks. These networks are typically characterized by long feeder distances and uneven load distribution, making them more susceptible to voltage instability. This section explores how combining two approaches—BESS and TOU demand management—can better support voltage control under these challenging conditions. Figure 14 presents the voltage behavior of the network with both techniques applied at DG penetration levels of 100% and 20%. Results from Table 4 and the visual data clearly show that a hybrid approach significantly improves voltage levels, especially with a 0.4 MWh BESS paired with a 20% TOU participation rate. In lower penetration scenarios, such as 20%, the system still shows minor violations, although improved, as illustrated in Figure 14b. This improvement can be attributed to TOU’s ability to shift demand away from peak periods, smoothing out the load curve, and reducing stress on the grid. Meanwhile, BESS serves as a buffer, capturing excess energy when generation exceeds demand and releasing it when needed. However, in rural setups, planners must also consider factors such as weaker grid infrastructure, limited monitoring capabilities, and delayed system response times, which can further complicate mitigation efforts. Ultimately, this investigation highlights that a hybrid strategy is more suitable for rural power systems, offering improved voltage stability compared to standalone methods. Yet, successful deployment also requires addressing rural-specific limitations, including grid accessibility, economic feasibility, and consumer participation in smart energy programs.
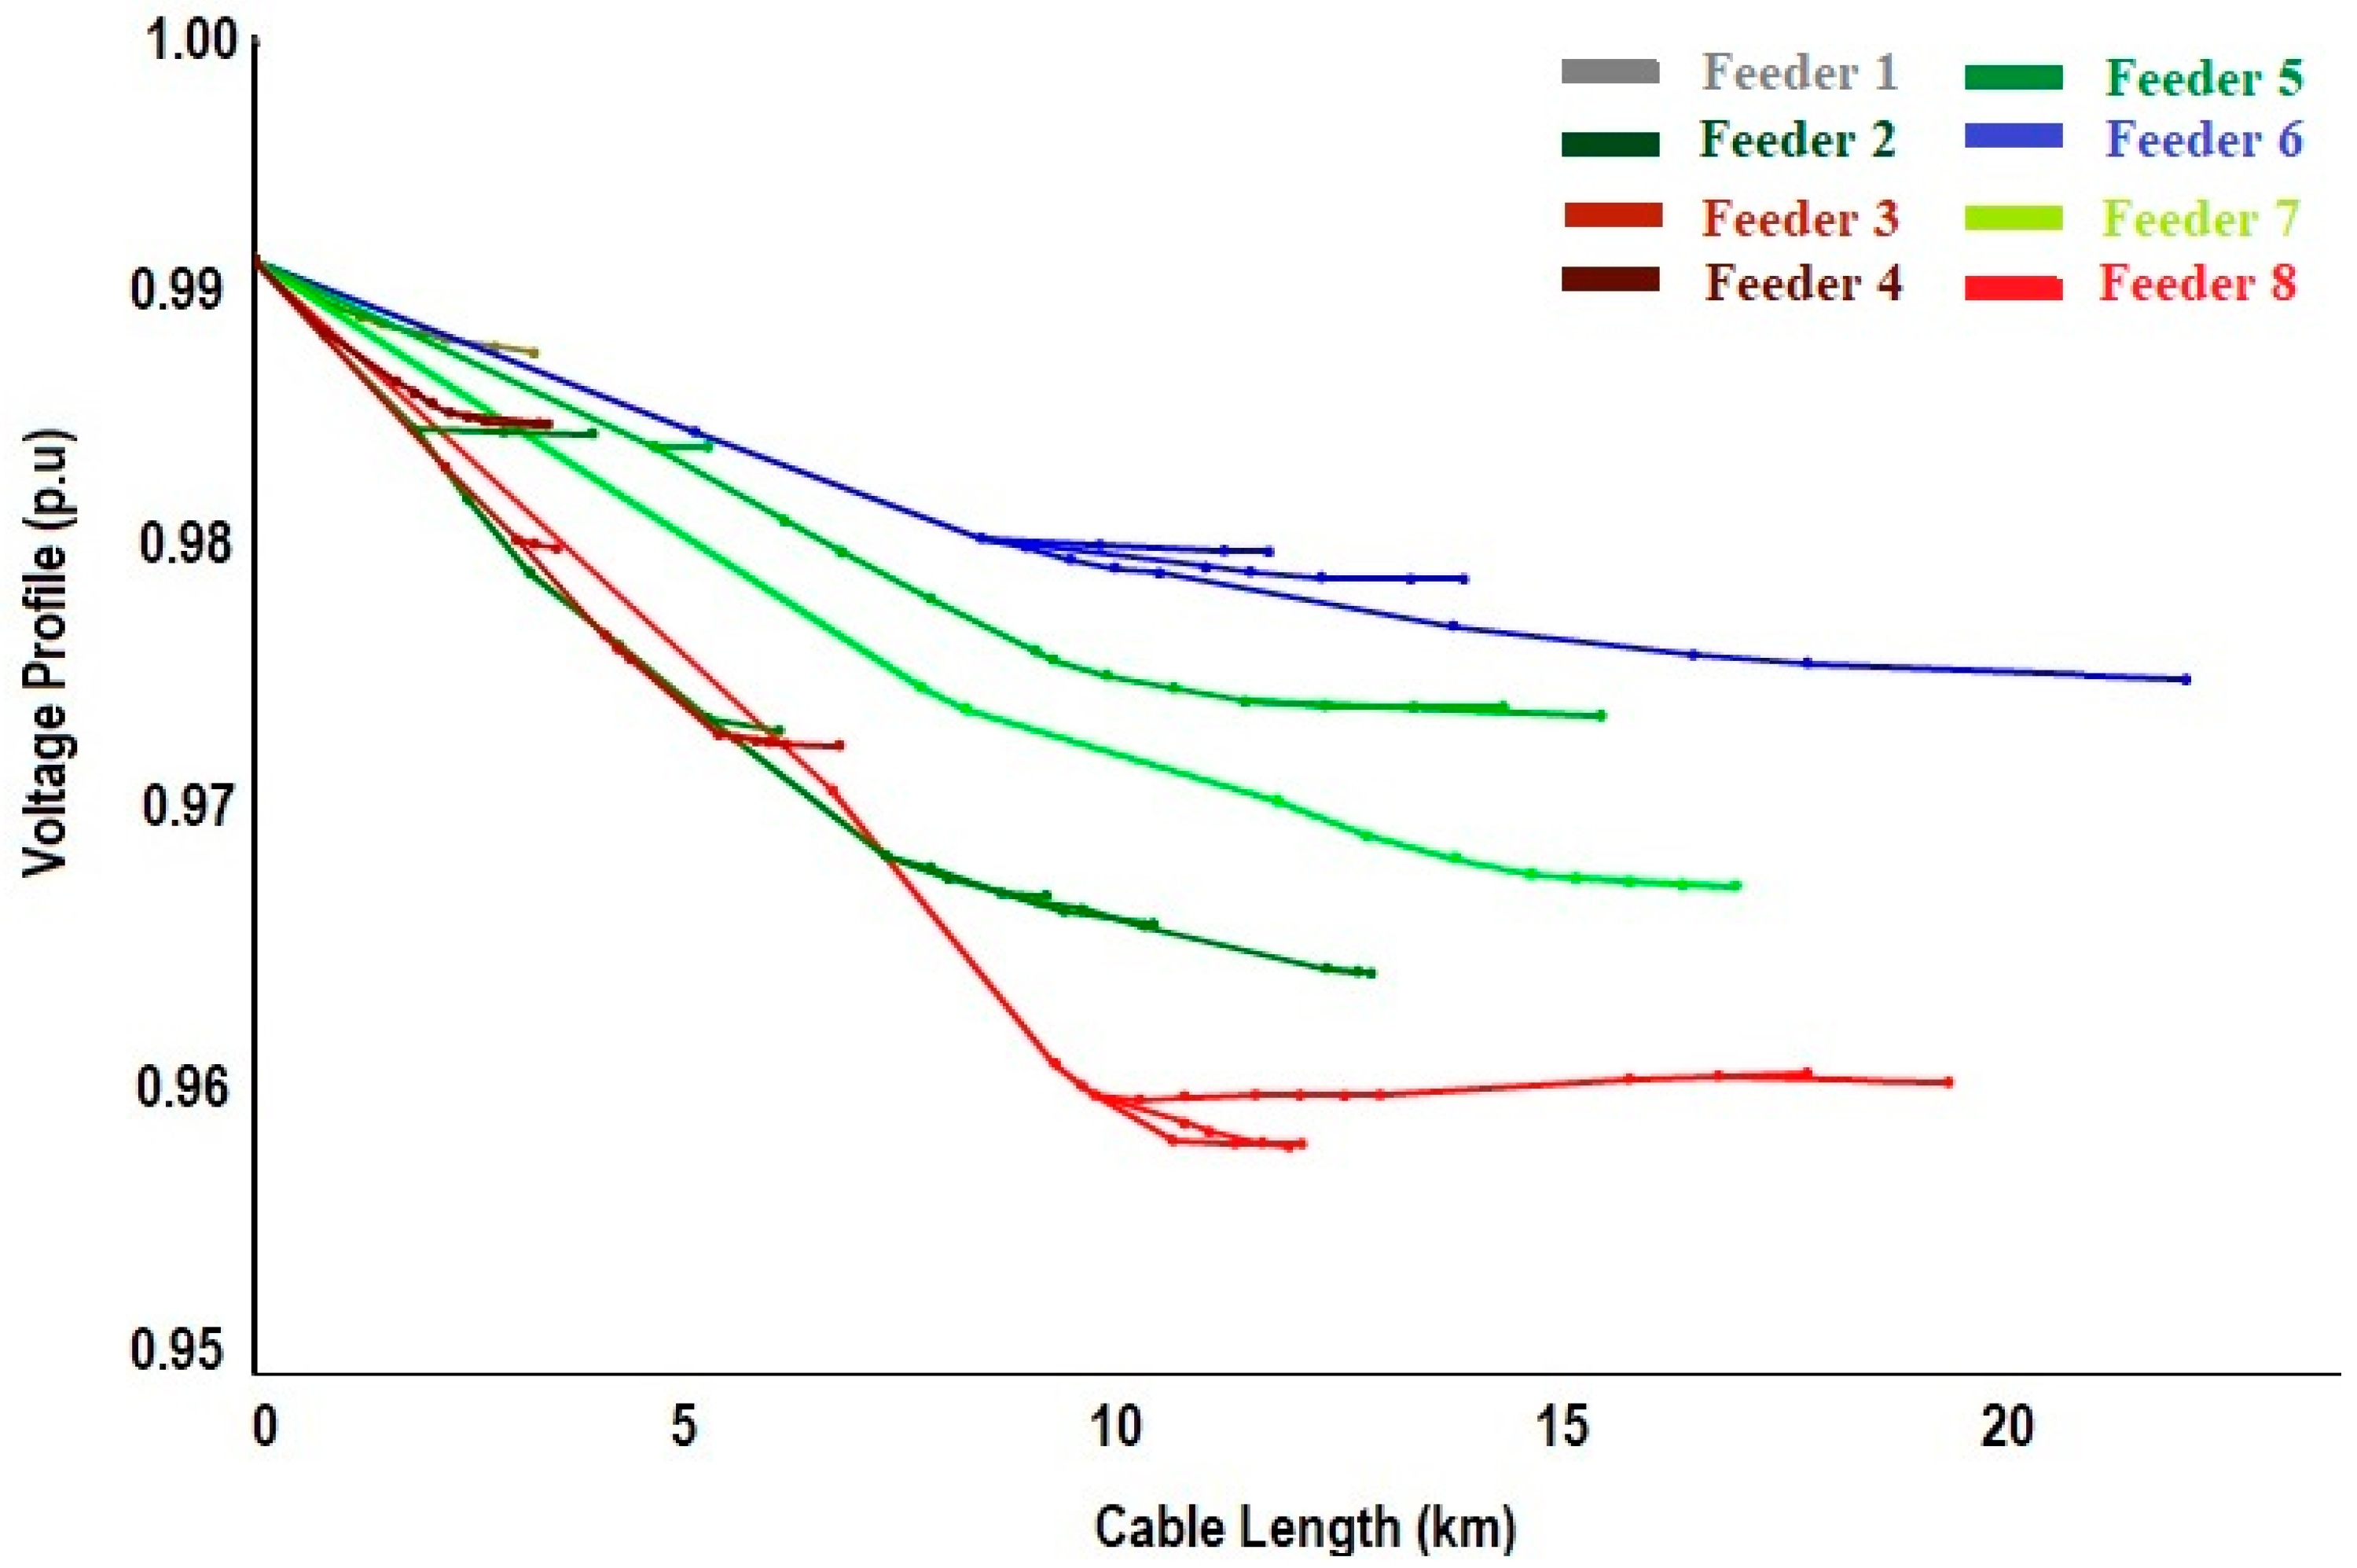
In rural power distribution networks, maintaining voltage quality across extended feeder lines presents a significant challenge due to long distances and dispersed load centers. Unlike urban systems, where substations and loads are more compactly arranged, rural feeders must span wide geographical areas to supply power to scattered consumers. This investigation specifically examines how feeder length and load density impact voltage profiles, even after mitigation strategies have been applied. Figure 15 illustrates voltage trends across several feeders within a rural grid configuration. Feeders positioned furthest from the substation—namely Feeder 6 and Feeder 8, located approximately 24 km and 20 km away—displayed the most noticeable voltage drops, particularly near their terminal nodes. Despite Feeder 6 being the longest, it maintained a better voltage profile than Feeder 8, largely due to having fewer connected loads (18 versus 21). This observation highlights that voltage deviation is not solely a function of distance, as well as how electrical loads are distributed along the feeder. In contrast, Feeder 5, which is only 4 km in length and serves a small cluster of six loads, experienced much smaller voltage variations, maintaining a minimum value of 0.987 p.u. compared to 0.978 p.u. for Feeder 6 and 0.958 p.u. for Feeder 8. This study is particularly valuable for rural grid planners and operators, as it demonstrates that even with advanced hybrid mitigation techniques—such as the integration of BESS and TOU pricing—voltage stability in rural networks remains highly sensitive to feeder length and node configuration. These insights are essential for designing more resilient rural electrical infrastructures, where grid reinforcement and targeted mitigation must be prioritized based on geographical and load characteristics.
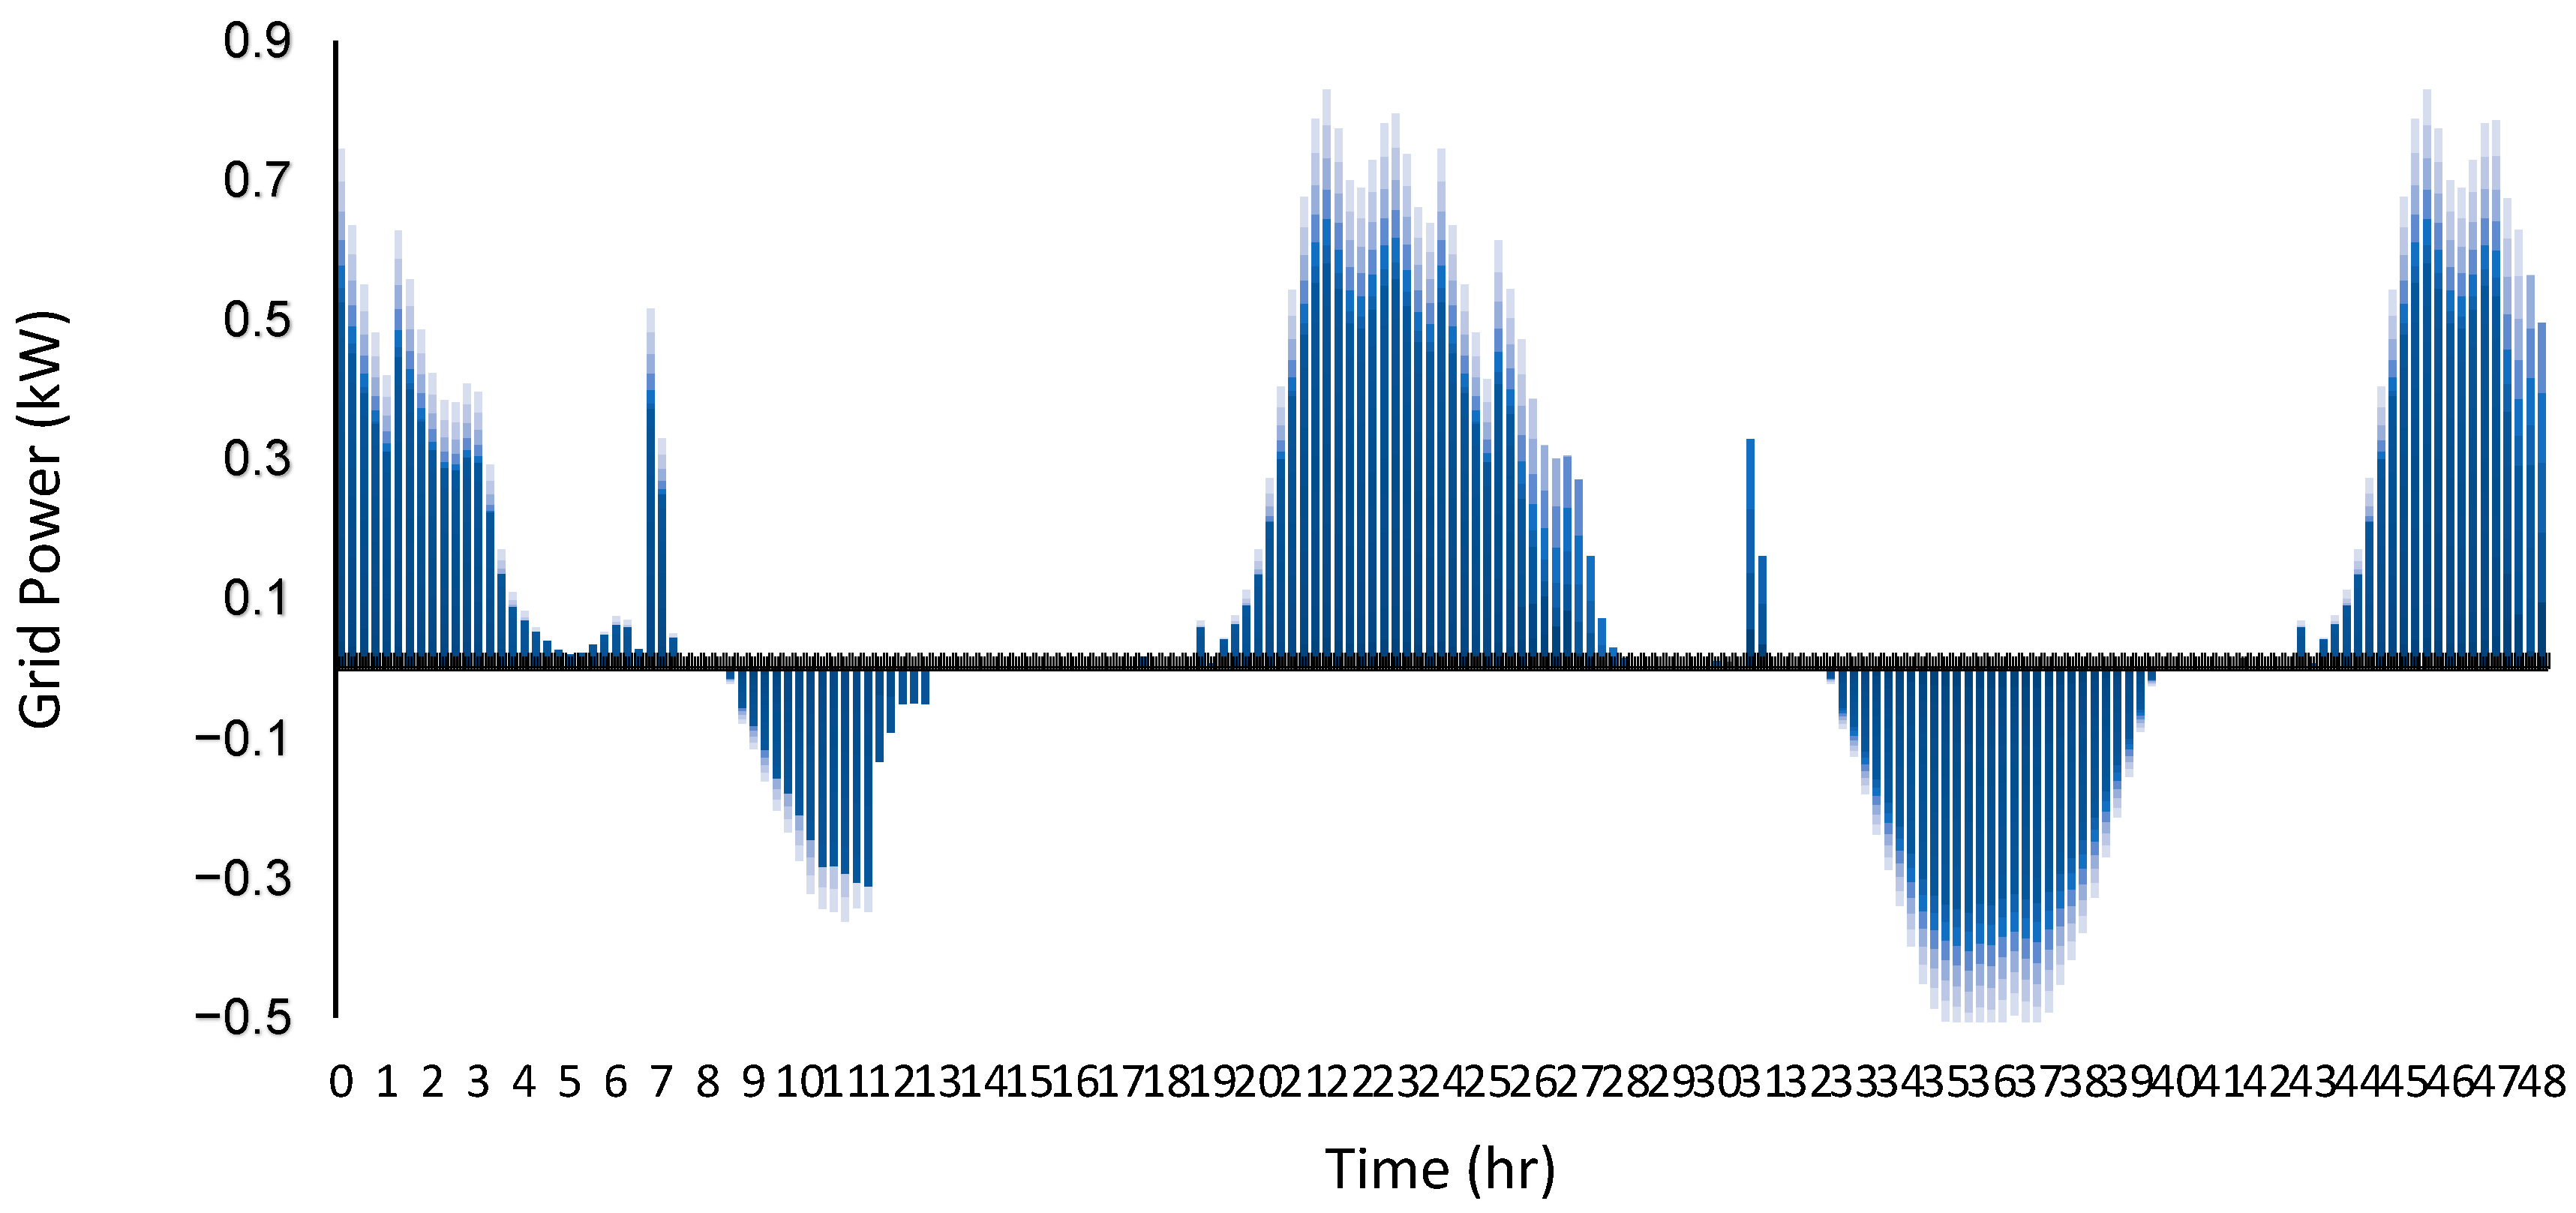
To enhance the system’s ability to manage surplus solar generation, BESS units were strategically deployed at each node within the network. The control logic, implemented via DPL scripting (see Appendix B), actively monitors the state of charge (SOC) of the batteries. When excess power is detected at a node, the control system assesses the SOC and initiates charging if capacity is available. Figure 16 illustrates the cumulative active power of BESS over a 48 h period. At night, when solar output drops to zero, the BESS responds to demand by discharging. During daylight hours, PV generation first supplies the local load; only when a surplus remains and SOC is below the maximum does the BESS begin to charge. In the early hours (6:30 to 8:30 a.m.), all solar output is consumed by the load, leaving no surplus. However, between 8:30 a.m. and 1:00 p.m., available solar exceeds demand, enabling the batteries to gradually reach full charge. By midday, most BESS units reach maximum SOC. Later in the evening, as solar contribution declines (from 6:30 p.m. onward), batteries begin discharging again to meet demand, depending on load conditions. Importantly, when TOU pricing is incorporated, it causes a shift in load behavior, resulting in noticeable early morning activity—particularly around 8:00 a.m. This is reflected in the high level of grid power shown in the figure, indicating that TOU incentives have successfully reshaped demand patterns. The BESS discharges approximately 0.5 kWh by 8:00 a.m., demonstrating its effectiveness in supporting grid operations during shifted peak periods.
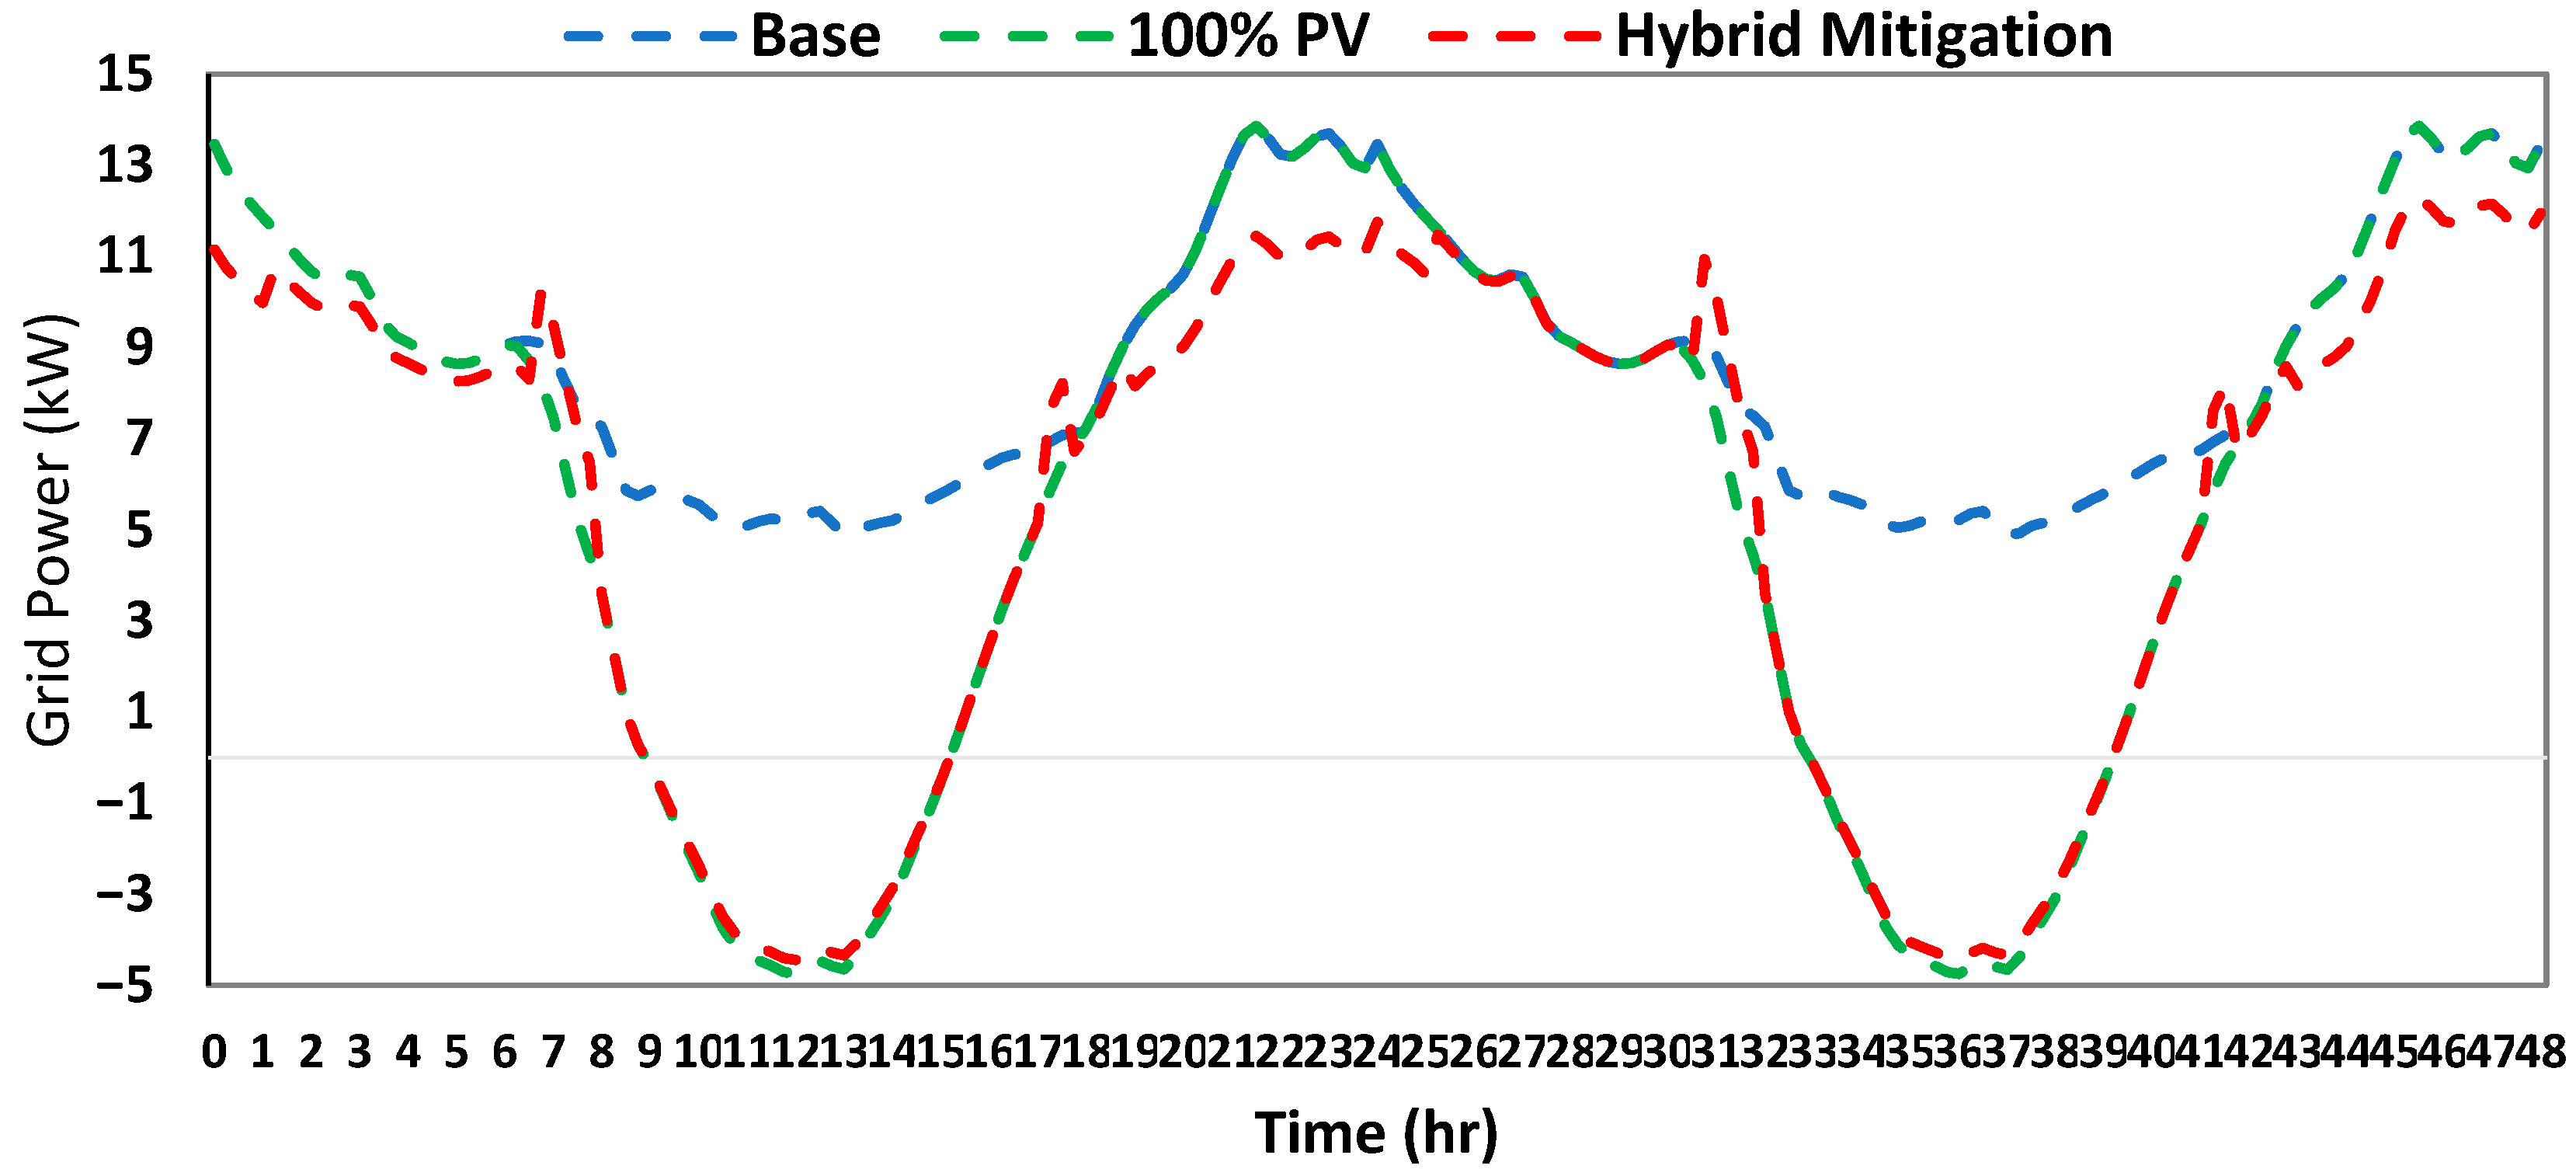
The power capacity and operational flexibility of the distribution grid are critical factors in determining its ability to accommodate additional generation from PV systems. An effective grid must be capable of absorbing the variable output from PV installations while maintaining voltage stability and overall reliability. In this study, grid performance was evaluated under three distinct scenarios: (1) a baseline condition without PV integration, (2) full PV penetration without mitigation strategies, and (3) full PV penetration with hybrid mitigation measures, including BESS and TOU pricing. As illustrated in Figure 17, under the baseline scenario, grid power remained within acceptable operational limits. However, with 100% PV penetration, the system experienced increased voltage violations and power fluctuations, indicating significant stress on the network. The implementation of hybrid mitigation strategies led to a marked improvement in system performance. BESS played a key role by storing excess energy during periods of low demand and discharging it during peak demand, while TOU pricing effectively shifted consumption away from high-stress intervals. These findings underscore the importance of hybrid mitigation techniques in preserving power quality and voltage regulation in distribution grids with high levels of PV integration. Nevertheless, the effectiveness of such strategies is highly dependent on local grid characteristics, load profiles, and solar generation patterns. Therefore, tailored planning and system-specific optimization are essential to ensure the successful deployment of these solutions across diverse grid configurations.
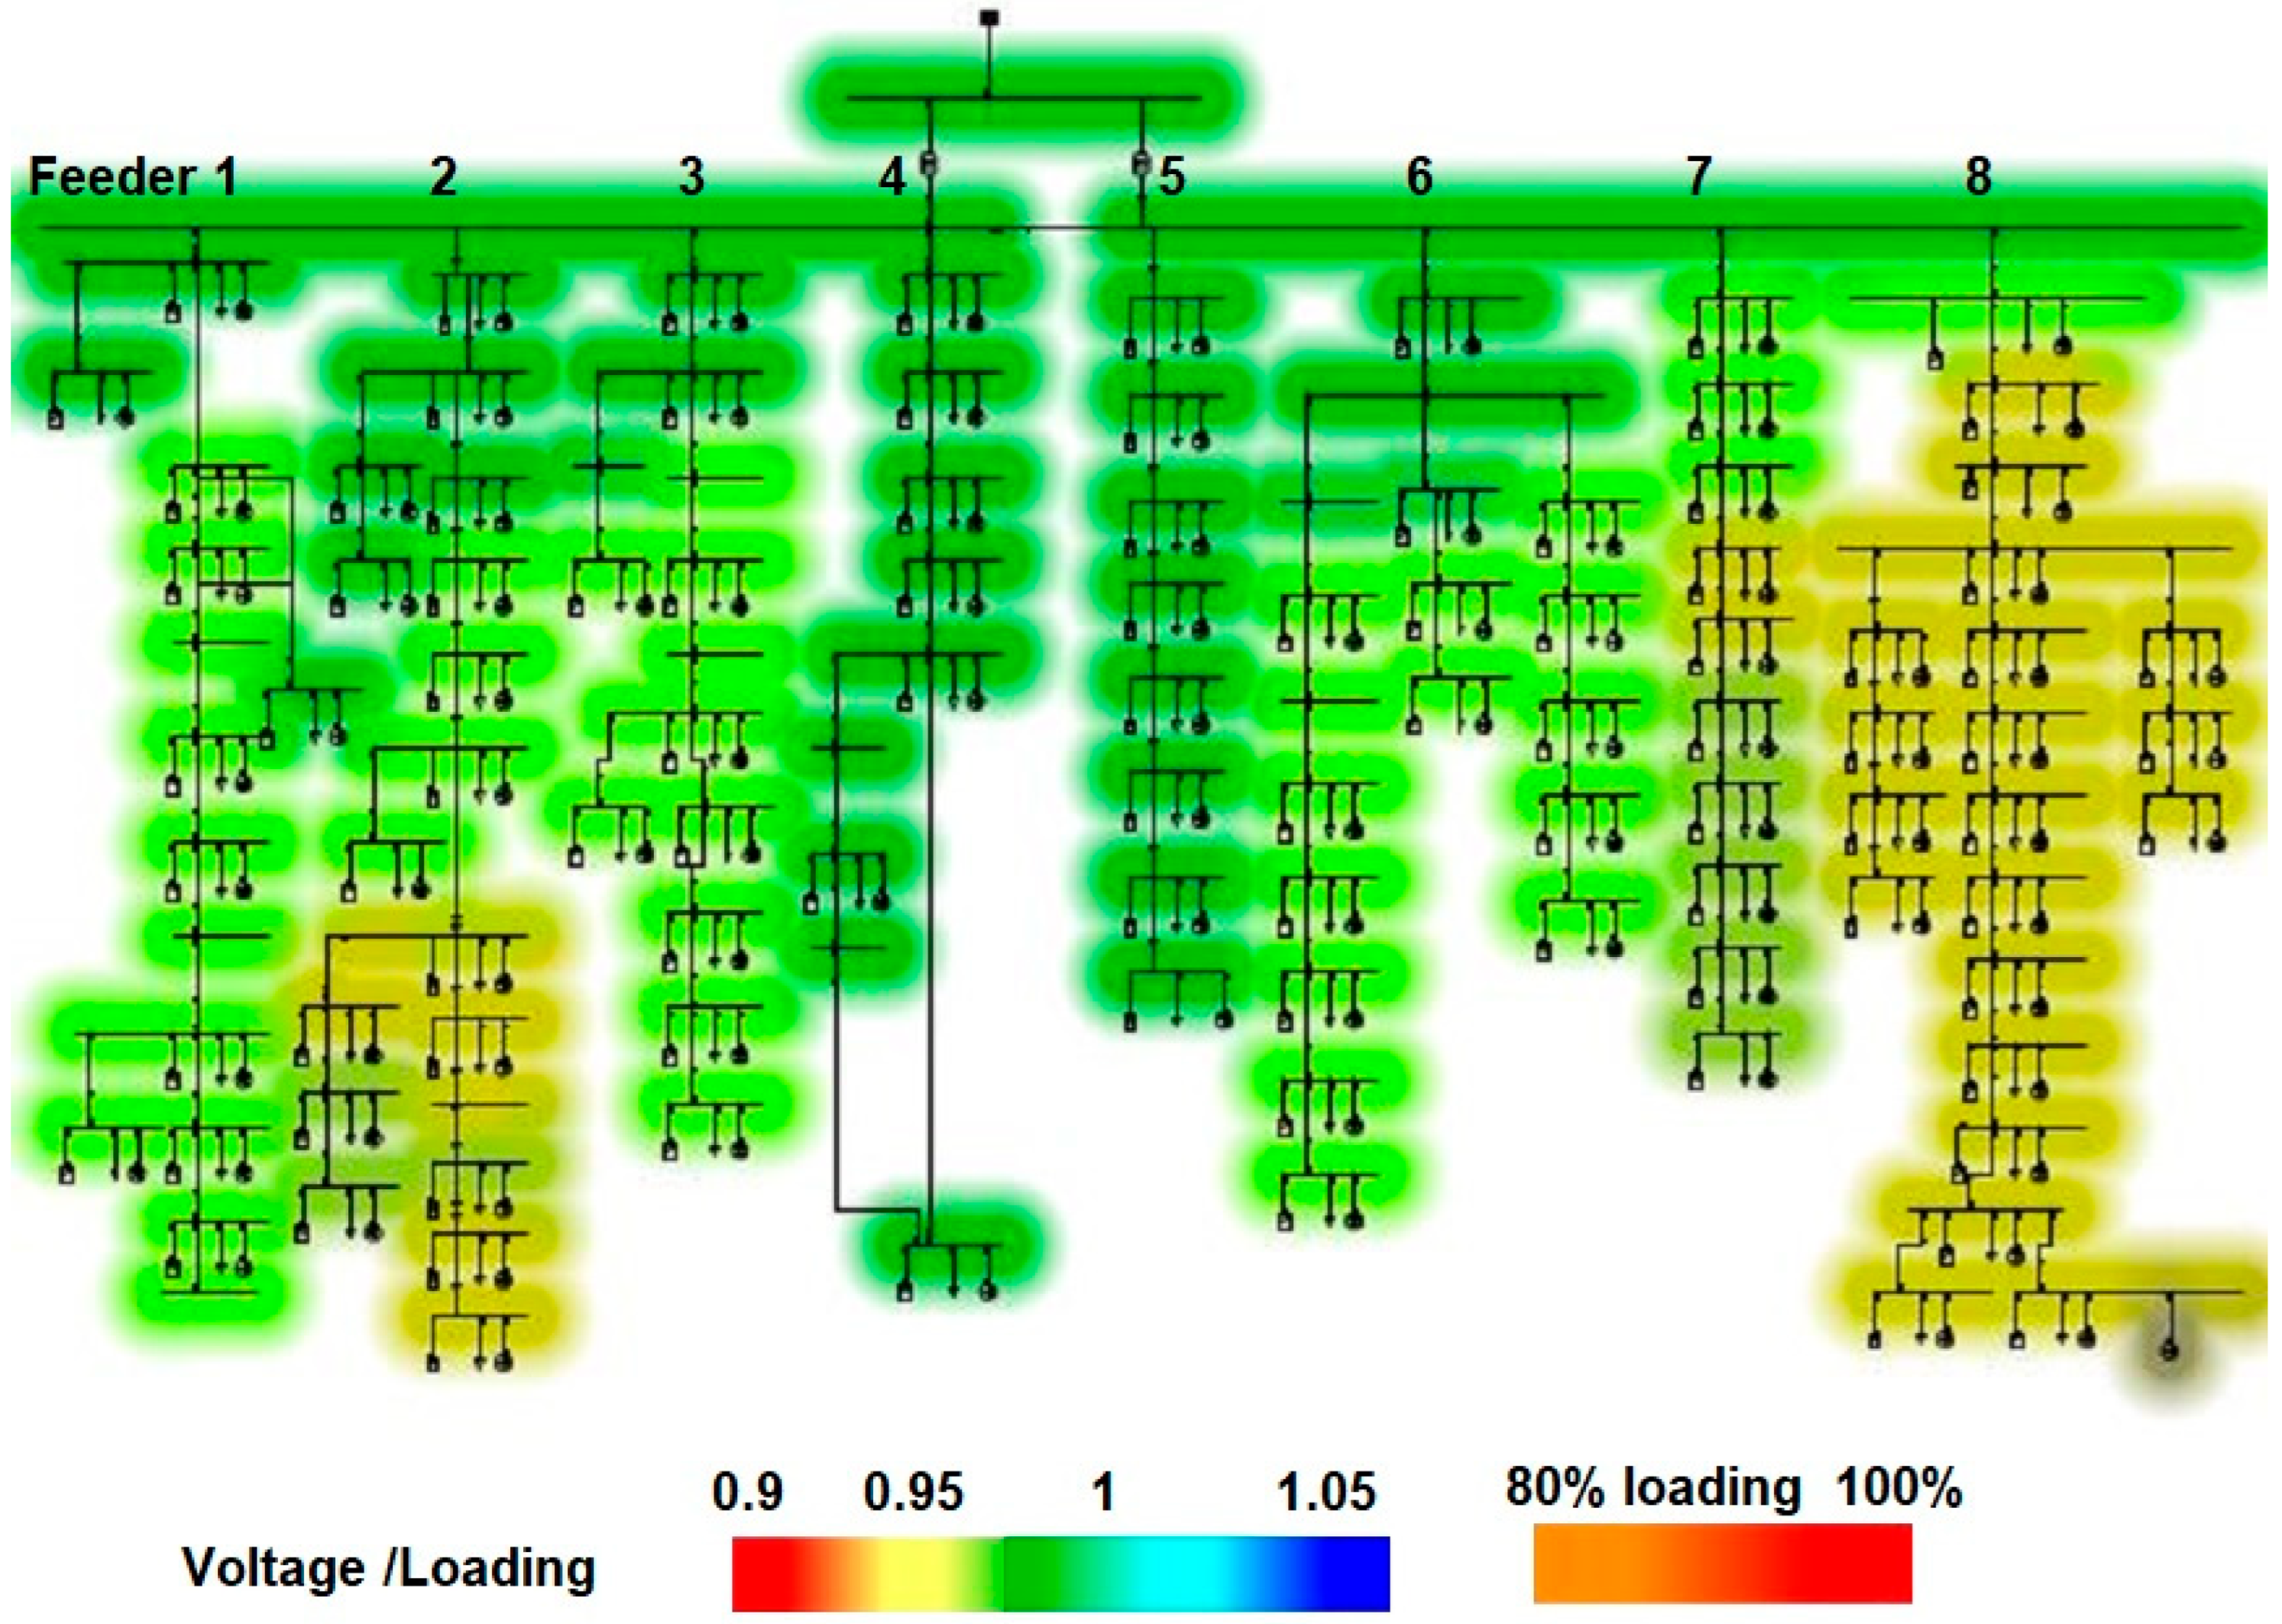
The updated heat map presents the voltage and loading profile of the rural distribution network following the integration of PV systems and the implementation of hybrid mitigation strategies—specifically, BESS and TOU load shifting. Unlike the pre-mitigation scenario, this map shows a significant improvement in voltage regulation across all feeders, now clearly labeled from Feeder 1 through Feeder 8. Notably, areas that previously exhibited undervoltage or overloading—particularly in Feeders 1, 3, and 8—have shifted into a stable operating range, with most nodes now shaded in green, indicating voltage levels close to the nominal 1.0 per unit. Minor yellow hues in parts of Feeders 1 and 8 suggest localized areas of moderate loading, but all values remain within acceptable operational limits. This uniform voltage profile reflects the success of the hybrid mitigation strategy in reducing voltage fluctuations and alleviating peak demand pressure. The coordinated use of BESS to absorb excess daytime PV generation and discharge it during evening hours, combined with TOU-driven load shifting, has optimized energy distribution and improved system stability. As illustrated in Figure 18, the application of the hybrid mitigation strategy (BESS + TOU) resulted in a well-balanced voltage profile across the network, effectively eliminating undervoltage violations and confirming the enhanced operational reliability of the rural grid under high PV penetration.
Figure 19 presents a comparative analysis of accumulated power losses across all feeders in the distribution network, highlighting the impact of the hybrid mitigation strategy—which integrates PV generation, BESS, and TOU load shifting. In the pre-mitigation scenario, total system losses peaked at over 320 kW, particularly during nighttime hours (00:00–06:00 and 20:00–24:00), when demand remained high and PV generation was unavailable. These losses were most pronounced in Feeder 8, which contributed more than 60% of the total loss due to its long distance from the substation, high concentration of load, and lack of localized voltage support. This pattern is typical of rural distribution systems, where feeders often extend over long distances to serve scattered loads, resulting in elevated resistance and voltage drops. The lack of voltage regulation infrastructure in such areas further exacerbates energy losses, especially during peak load periods when current flow through long feeder lines is highest. Following the implementation of the hybrid mitigation approach, a substantial reduction in power losses was observed across all feeders. Peak losses decreased to approximately 140–160 kW, representing a 50–55% improvement in system efficiency. This reduction is primarily attributed to the strategic deployment of BESS, which discharged stored energy during high-demand evening hours, reducing reliance on upstream supply and minimizing line losses. In parallel, the TOU load shifting strategy successfully redistributed consumption to mid-day periods when PV system output was at its peak, flattening the load curve and easing pressure on the grid. Feeder 8, which initially exhibited the most critical loss profile, showed the greatest improvement after mitigation—with its peak losses nearly halved. Other rural feeders, such as Feeders 2, 3, and 7, also recorded consistent reductions, although to a lesser extent, due to their moderate baseline loads. The distributed nature of PV systems allowed local generation to directly serve nearby loads, thus reducing the need for long-distance power transfer—a key benefit in rural areas where transmission distances inherently lead to inefficiencies.
Compared to recent approaches that employ advanced reinforcement learning for energy market optimization [22] and adaptive management in constrained islanded systems [23], this study presents a more practically deployable solution for rural medium-voltage distribution networks. While those works demonstrate strong performance in environments with access to high-level control infrastructure and centralized coordination, they may face implementation challenges in rural contexts where communication systems and real-time control capabilities are limited. In contrast, our hybrid mitigation strategy—combining BESS with TOU demand response—requires minimal infrastructure changes and leverages existing consumer behavior. By using a real-world Malaysian rural network model and focusing on system-wide voltage stability and power loss reduction, this work offers a robust, scalable alternative that aligns with the operational realities of rural grids.

4. Limitations

This study is based on detailed network models and typical utility data for Malaysian rural feeders; however, the simulation results were not benchmarked against measured feeder voltage profiles or actual utility billing records due to data availability constraints. Likewise, the performance of the modeled 100 kW PV systems was not directly validated with local irradiance and temperature measurements. In addition, the analysis assumes a uniform fixed-tilt PV installation of 100 kW (and alternative scenarios of 60 kW and 20 kW) at each node, using a single derating factor to account for general system losses. Site-specific factors such as available roof area, local shading, and inverter capacity limits were not explicitly modeled. To partially address these uncertainties, a ±20% sensitivity analysis on PV capacity was conducted, which indicated that the main conclusions regarding mitigation strategy effectiveness remain robust despite performance variations. Nevertheless, the results may still be subject to uncertainties due to differences between assumed and real-world operating conditions. Future research will focus on obtaining at least one week of measured feeder voltage and PV performance data, as well as incorporating more detailed modeling of physical installation constraints, to further validate and improve the simulation framework.
Equipping all 110 nodes with 0.4 MWh of BESS implies a total district storage capacity exceeding 44 MWh. Given current market prices for LFP battery systems, this scale of deployment would require tens of millions of dollars in capital expenditure (capex), presenting a significant economic challenge for most rural utilities. The uniform, fully distributed storage model used in this study was selected to explore the maximum technical benefit for voltage stability; however, in practice, economic constraints may favor more centralized or selectively deployed BESS solutions. Future research should include comprehensive techno-economic analyses to determine the optimal balance between technical performance and investment costs, as well as explore strategies such as shared community storage, phased deployment, or integration with other grid-support technologies to improve cost-effectiveness and practical feasibility.
Additionally, the DPL script used for BESS operation in this study employs a simple rule-based strategy: batteries are charged whenever surplus solar generation exists and discharged when local load exceeds PV output. This approach does not consider reserving SOC headroom for anticipated evening peak demands, nor does it account for the economic implications of battery cycling or degradation costs. As a result, the operational performance and cost-effectiveness of the BESS may be overestimated. Future studies should incorporate predictive or optimization-based control strategies and include battery lifetime and cycling costs for a more realistic assessment.
Moreover, this study assumes flat TOU participation rates of 10% and 20% without reference to actual market data, tariff values, or consumer price elasticity curves. The absence of detailed price signals and elasticity assumptions limits the accuracy of projected load-shifting behavior and its impact on grid performance. Future research should aim to incorporate real TOU tariff structures, estimate consumer responsiveness to price signals, and perform sensitivity analyses over a wider range of participation levels to more accurately model demand response effectiveness in rural networks.
5. Conclusions

With the continuous rise of distributed generation (DG), particularly PV systems, modern power grids are increasingly exposed to operational challenges such as voltage instability, reverse power flow, and coordination issues. This study evaluated the impact of high PV penetration, specifically, the integration of 100 kW PV systems across 110 nodes in a simulated 11 kV network in Malaysia. Initial results demonstrated that PV penetration without mitigation leads to persistent voltage violations at multiple nodes, particularly below the lower voltage limit. To address these violations, two strategies were independently tested: TOU pricing programs and BESS. The application of TOU alone at a 20% customer participation rate resulted in partial mitigation of voltage violations, though some nodes continued to experience instability. When BESS was implemented, with a 0.4 MWh storage capacity per node, voltage conditions improved further, yet a few violations remained. The combined application of TOU and BESS proved to be the most effective strategy. This hybrid approach not only helped reduce voltage issues significantly but also optimized energy usage by shifting excess daytime PV generation to peak demand periods. By leveraging both consumer behavior (via TOU) and technological flexibility (via BESS), the grid demonstrated improved resilience and stability. It is imperative that energy stakeholders actively promote the adoption of TOU programs. These pricing schemes play a vital role in influencing consumer energy usage patterns, which in turn can substantially alleviate grid stress and enhance voltage regulation. Government incentives, public awareness campaigns, and regulatory frameworks should be introduced to encourage broader consumer participation in TOU schemes. Widespread adoption can transform passive consumers into active participants in grid stability. While this study validates the effectiveness of TOU and BESS in mitigating voltage instability, several avenues remain open for future exploration:
  • Scalability and Economic Feasibility: Future research should analyze the cost–benefit ratio of implementing BESS across a wider range of distribution networks, considering different battery types, lifespans, and capital investments;
  • Advanced Control Strategies: Integration of smart inverters, AI-based demand forecasting, and real-time energy management systems could enhance the effectiveness of TOU-BESS hybrids;
  • Variable TOU Adoption Rates: Investigating the impact of varying levels of customer participation in TOU programs (e.g., 40%, 60%, or higher) will provide better insights into its scalability and practical effectiveness;
  • Cybersecurity and Resilience: With increasing digitalization, future studies must assess the cyber risks associated with distributed energy resource management and propose robust security frameworks;
  • Consumer Behavior Modeling: A deeper understanding of household load behavior, PV production variability, and storage preferences can aid in designing more effective and user-friendly TOU programs;
  • Integration with Electric Vehicles (EVs): As EV adoption rises, their synergy with TOU and BESS systems presents both challenges and opportunities for dynamic grid support [24];
  • Economic Trade-offs between Increasing BESS Capacity and Enhancing TOU Participation: Future work will focus on evaluating this research area to support more cost-effective and scalable deployment strategies in rural PV-integrated networks.
By continuing to explore these aspects, future work can contribute to building smarter, more stable, and economically viable power systems in the era of high DG penetration.

Author Contributions

Conceptualization, M.R.M. and J.P.; methodology, M.R.M. and J.P.; software, M.R.M.; validation, A.G.O.M., J.E. and J.P.; formal analysis, M.R.M. and J.P.; investigation, A.G.O.M., J.E. and J.P.; resources, J.P.; data curation, J.P.; writing—original draft preparation, M.R.M. and J.P.; writing—review and editing, A.G.O.M., J.E. and J.P.; visualization, M.R.M. and J.P.; supervision, A.G.O.M., J.E. and J.P. All authors have read and agreed to the published version of the manuscript.

Funding

This research received no external funding.

Institutional Review Board Statement

Not applicable.

Informed Consent Statement

Not applicable.

Data Availability Statement

Data are attached to this paper.

Acknowledgments

The authors would like to express gratitude to Tenaga Nasional Berhad (TNB), Malaysia; Universiti Tenaga Nasional; and the Strategic Research Institute (SRI), Asia Pacific University of Technology and Innovation, for supporting the research work.

Conflicts of Interest

The authors declare no conflicts of interest.

Nomenclature

D p v PV derating factor
G T Incident solar radiation (kW/m2)
α p Power temperature coefficient (%/°C)
η c Charging efficiencies
η d Discharge efficiencies
P D B Discharge rate
B m i n Battery’s minimum capacities
B m a x Battery’s maximum capacities
P j h Active power
Q j h Reactive power
V j h Voltage magnitude
P m a x Maximum hourly discharging power

Abbreviation

TOUTime of Use
BESSBattery energy storage system
AVRsAutomatic voltage regulators
BESSBattery energy storage system
PVPhotovoltaic
DRDemand response program
DGDistributed generation
PVPPV penetration
PCCPoint of connection
SOCState of charge
RPCReactive power control
APCActive power control

Appendix A

Battery Charging and Discharging DPL Code
double u;
SOC = SOCini;
u = 1.;
! voltage operation area
if ({uFullStore <= uStartStore}.or.{uStartFeed <= uFullFeed}) {
chargeU = 0; ! Error
Warn(‘uFullStore must be > than uStartStore and uStartFeed > than uFullFeed’);
}
else if (u < uStartFeed) {
chargeU = 3;
}
else if (u > uStartStore) {
chargeU = 1;
}
else {
chargeU = 2;
}
! energy operation area
iniSOCoob = 0; ! Inside bounds
if (SOCmin >= SOCmax) {
chargeE = 0; ! Error
Warn(‘SOCmin must be < than SOCmax.’);
}
else if (SOC > SOCmax) {
chargeE = 3;
iniSOCoob = 1;
}
else if (SOC = SOCmax) {
chargeE = 3;
}
else if (SOC = SOCmin) {
chargeE = 1;
}
else if (SOC < SOCmin) {
chargeE = 1;
iniSOCoob = 1;
}
else {
chargeE = 2;
}
Load Flow DPL Code
double Pgen,
Qgen,
redFac;
redFac = 1.0;
if ({chargeU = 3}.and.{chargeE >= 2}.and.{chargeE > 0}) {
if (uGen > uFullFeed) {
redFac = 1 − ((uGen − uFullFeed)/(uStartFeed − uFullFeed));
}
Pgen = Pfeed * redFac; ! discharge = GEN, feeding
Qgen = Qfeed * redFac; ! discharge = GEN, feeding
}
else if ({chargeU = 1}.and.{chargeE <= 2}.and.{chargeE > 0}) {
if (uGen < uFullStore) {
redFac = 1 − ((uFullStore − uGen)/(uFullStore − uStartStore));
}
Pgen = -Pstore * redFac; ! charge = LOAD, storing
Qgen = -Qstore * redFac; ! charge = LOAD, storing
}
else {
Pgen = 0.;
Qgen = 0.;
}
SetEquation(0, Pset − Pgen);
SetEquation(1, Qset − Qgen);

Appendix B

Table A1. Battery energy storage (BES) specifications.
Energy storage size, MWh0.4
Initial state of charge, %100
Minimal state of charge, %20
Maximal state of charge, %80
Charging rate, MW0.1
Discharging rate, MW0.1
Figure A1. BESS single-line diagram.
Technologies 13 00339 g0a1
Figure A2. BES control structure.
Technologies 13 00339 g0a2
Figure A3. PQ frame control.
Technologies 13 00339 g0a3
Figure A4. Charging control.
Technologies 13 00339 g0a4

Appendix C

Table A2. Cable line characteristics.
TypePos Seq R (ohms/km)Pos Seq X (ohms/km)Zero Seq R (ohms/km)Zero Seq X (ohms/km)Pos Seq Charging AdmittanceRating
A11UG240X0.16090.15240.18140.0312147.3598350
A11UG500X0.080.091.040.03199.89570
A11UG1850.200.082.390.04218.05250
A11UG150X0.260.160.300.04119.46280
A11UG0700.5240.09383.9360.0422148160
Table A3. Solar PV specifications.
Peak Power (MPP)500 WTechnologies 13 00339 i001
Rated Voltage (MPP)80 V
Rated Current (MPP)6 A
Open Circuit Voltage90 V
Short Circuit Current7 A
ModelSingle-crystalline silicon (Mono-Si)
Penetration Level100 kW
Number of Panels per Inverter18
Number of Inverters15

References

  1. Mansouri, N.; Lashab, A.; Sera, D.; Guerrero, J.M.; Cherif, A. Large photovoltaic power plants integration: A review of challenges and solutions. Energies 2019, 12, 3798. [Google Scholar] [CrossRef]
  2. Bian, Y.; Xie, L.; Ma, L.; Cui, C. A novel two-stage energy sharing model for data center cluster considering integrated demand response of multiple loads. Appl. Energy 2025, 384, 125454. [Google Scholar] [CrossRef]
  3. Maghami, M.R.; Pasupuleti, J.; Ling, C.M. A static and dynamic analysis of photovoltaic penetration into MV distribution network. Processes 2023, 11, 1172. [Google Scholar] [CrossRef]
  4. Maghami, M.R.; Vahabzadeh, S.; Mutambara, A.G.O.; Ghoushchi, S.J.; Gomes, C. Failure analysis in smart grid solar integration using an extended decision-making-based FMEA model under uncertain environment. Stoch. Environ. Res. Risk Assess. 2024, 38, 3543–3563. [Google Scholar] [CrossRef]
  5. Maghami, M.R.; Pasupuleti, J.; Ekanayake, J. Energy storage and demand response as hybrid mitigation technique for photovoltaic grid connection: Challenges and future trends. J. Energy Storage 2024, 88, 111680. [Google Scholar] [CrossRef]
  6. Maghami, M.R.; Pasupuleti, J.; Sundaram, S. Impact of time of use program on widely distribution generation interconnection in urban power network. J. Energy Storage 2024, 101, 113789. [Google Scholar] [CrossRef]
  7. Do Nascimento, A.D.J.; Rüther, R. Evaluating distributed photovoltaic (PV) generation to foster the adoption of energy storage systems (ESS) in time-of-use frameworks. Sol. Energy 2020, 208, 917–929. [Google Scholar] [CrossRef]
  8. Barman, P.; Dutta, L.; Bordoloi, S.; Kalita, A.; Buragohain, P.; Bharali, S.; Azzopardi, B. Renewable energy integration with electric vehicle technology: A review of the existing smart charging approaches. Renew. Sustain. Energy Rev. 2023, 183, 113518. [Google Scholar] [CrossRef]
  9. Maghami, M.R.; Mutambara, A.G.O.; Gomes, C. Assessing cyber attack vulnerabilities of distributed generation in grid-connected systems. Environ. Dev. Sustain. 2025, 1–27. [Google Scholar] [CrossRef]
  10. Li, S.; Wu, H.; Zhou, Y.; Bi, R.; Qi, X.; Sun, M.; Xu, B. Two-stage voltage control strategy in distribution networks with coordinated multimode operation of PV inverters. IET Renew. Power Gener. 2023, 17, 66–82. [Google Scholar] [CrossRef]
  11. Ariyaratna, P.; Muttaqi, K.M.; Sutanto, D. A novel control strategy to mitigate slow and fast fluctuations of the voltage profile at common coupling Point of rooftop solar PV unit with an integrated hybrid energy storage system. J. Energy Storage 2018, 20, 409–417. [Google Scholar] [CrossRef]
  12. Comello, S.; Reichelstein, S.; Sahoo, A. The road ahead for solar PV power. Renew. Sustain. Energy Rev. 2018, 92, 744–756. [Google Scholar] [CrossRef]
  13. Adetokun, B.B.; Ojo, J.O.; Muriithi, C.M. Reactive power-voltage-based voltage instability sensitivity indices for power grid with increasing renewable energy penetration. IEEE Access 2020, 8, 85401–85410. [Google Scholar] [CrossRef]
  14. El-Bahay, M.H.; Lotfy, M.E.; El-Hameed, M.A. Computational methods to mitigate the effect of high penetration of renewable energy sources on power system frequency regulation: A comprehensive review. Arch. Comput. Methods Eng. 2023, 30, 703–726. [Google Scholar] [CrossRef]
  15. Sediqi, M.M.; Nakadomari, A.; Mikhaylov, A.; Krishnan, N.; Lotfy, M.E.; Yona, A.; Senjyu, T. Impact of time-of-use demand response program on optimal operation of Afghanistan real power system. Energies 2022, 15, 296. [Google Scholar] [CrossRef]
  16. Philipo, G.H.; Chande Jande, Y.A.; Kivevele, T. Demand-side management of solar microgrid operation: Effect of time-of-use pricing and incentives. J. Renew. Energy 2020, 2020, 6956214. [Google Scholar] [CrossRef]
  17. Pallonetto, F.; De Rosa, M.; Milano, F.; Finn, D.P. Demand response algorithms for smart-grid ready residential buildings using machine learning models. Appl. Energy 2019, 239, 1265–1282. [Google Scholar] [CrossRef]
  18. Crawley, J.; Martin-Vilaseca, A.; Wingfield, J.; Gill, Z.; Shipworth, M.; Elwell, C. Demand response with heat pumps: Practical implementation of three different control options. Build. Serv. Eng. Res. Technol. 2023, 44, 211–228. [Google Scholar] [CrossRef]
  19. Pimm, A.J.; Cockerill, T.T.; Taylor, P.G. Time-of-use and time-of-export tariffs for home batteries: Effects on low voltage distribution networks. J. Energy Storage 2018, 18, 447–458. [Google Scholar] [CrossRef]
  20. Minelli, F.; D’Agostino, D.; Migliozzi, M.; Minichiello, F.; D’Agostino, P. PhloVer: A modular and integrated tracking photovoltaic shading device for sustainable large urban spaces—Preliminary study and prototyping. Energies 2023, 16, 5786. [Google Scholar] [CrossRef]
  21. D’Agostino, D.; Minelli, F.; D’Urso, M.; Minichiello, F. Fixed and tracking PV systems for Net Zero Energy Buildings: Comparison between yearly and monthly energy balance. Renew. Energy 2022, 195, 809–824. [Google Scholar] [CrossRef]
  22. Zhang, N.; Yan, J.; Hu, C.; Sun, Q.; Yang, L.; Gao, D.W.; Guerrero, J.M.; Li, Y. Price-matching-based regional energy market with hierarchical reinforcement learning algorithm. IEEE Trans. Ind. Inform. 2024, 20, 11103–11114. [Google Scholar] [CrossRef]
  23. Yang, L.; Li, X.; Sun, M.; Sun, C. Hybrid policy-based reinforcement learning of adaptive energy management for the Energy transmission-constrained island group. IEEE Trans. Ind. Inform. 2023, 19, 10751–10762. [Google Scholar] [CrossRef]
  24. Maghami, M.R. The Role of Solar Energy in Mitigating the Impact of EV Charging Modes on Distribution Networks. Results Eng. 2025, 27, 106009. [Google Scholar] [CrossRef]
Figure 1. (a) illustrates a network comprising 110 nodes distributed over 8 feeders, all linked to an 11 kV busbar via two parallel-connected 132/11 kV, 15 MVA transformers. (b) Flowchart of the research methodology, illustrating the sequence from data collection and network modeling in DIgSILENT PowerFactory through identification of weak nodes, simulation of mitigation strategies (BESS, TOU, and hybrid approaches), sensitivity analysis, and performance evaluation, with representative voltage profiles and heatmaps before and after mitigation.
Technologies 13 00339 g001
Figure 2. Dynamic simulation evaluation strategy.
Technologies 13 00339 g002
Figure 3. Two-busbar network system model.
Technologies 13 00339 g003
Figure 4. The frame control of BESS.
Technologies 13 00339 g004
Figure 5. Normalized load behavior under various TOU schemes and solar energy generation.
Technologies 13 00339 g005
Figure 6. Hybrid mitigation technique using DR and BESS to solve the lower voltage limit.
Technologies 13 00339 g006
Figure 7. Hybrid mitigation flowchart.
Technologies 13 00339 g007
Figure 8. Distribution of active and reactive loads across multiple feeders.
Technologies 13 00339 g008
Figure 9. Voltage profile of the network before PV penetration to the grid.
Technologies 13 00339 g009
Figure 10. Voltage profiles of all 110 nodes in the distribution network after PV system penetration at two levels: (a) 100% and (b) 20%. The red dashed lines indicate the upper and lower limits.
Technologies 13 00339 g010
Figure 11. Voltage profile for all the nodes before PV penetration.
Technologies 13 00339 g011
Figure 12. Voltage profiles of all 110 nodes in the distribution network after mitigation using TOU at two participation levels: (a) 20% and (b) 10%.
Technologies 13 00339 g012
Figure 13. Voltage profiles of all 110 nodes in the distribution network with mitigation using BESS at two PV penetration levels: (a) 100% and (b) 20%.
Technologies 13 00339 g013
Figure 14. Voltage profiles of all 110 nodes in the distribution network after applying the hybrid mitigation strategy (PV + BESS + TOU) at two different PV penetration levels: (a) 100% and (b) 20%.
Technologies 13 00339 g014
Figure 15. Voltage profile of feeders after applying hybrid mitigation with BESS and TOU, showing reduced voltage drops along the cable length.
Technologies 13 00339 g015
Figure 16. Battery charging and discharging activity over a two-day period.
Technologies 13 00339 g016
Figure 17. Comparison of grid power usage across various case scenarios.
Technologies 13 00339 g017
Figure 18. Heat map after hybrid mitigation.
Technologies 13 00339 g018
Figure 19. Accumulated power losses among different feeders.
Technologies 13 00339 g019
Table 1. Overview of recent study on PV system penetration and mitigation techniques.
RefMethodStrategiesSimulationResult
[15]Pumped Hydro StoragePeak shifting 64MW ↓MATLAB↓ the system cost from USD 317,000 to USD 302,000
[16]Based on TariffsLoad shifting, schedule load reductionMATLAB↓ load shifting and schedule load reduction can s a v e 19% and 49% in terms of costs, respectively
[17]Targeting the Building Energy ConsumptionReal-time pricingMATLAB↓ 15% reduction in energy cost
[18]Heat-PumpedPeak shifting-56–90% electricity reduction during peak period
[11]Heat-Pumped and Thermal StorageUsing a machine learning rule base and predictive algorithmBuilding simulation software↓ in electricity consumption, 20% (rule-based) and 42% (predictive algorithm); ↓ in cost generation, 19% (rule-based) and 39% (predictive algorithms); and ↓ in carbon emissions, 21% (rule-based) and 38% (predictive algorithms)
[2]Hybrid Solar Energy StoragePeak shifting, tariffHOMER↓ in cost of energy, ↓ net present cost, and ↓ net present value
[19]Home Batteries, Solar-EV Storage, Heat-PumpedPeak shaving, tariff-Cost saving, finding appropriate level, ↑ e v e n i n g   p e a k
Table 2. Case study definitions.
ScenariosPV SystemTOU ApproachBESS ApproachHybrid Approach
Scenario 1
Scenario 2
Scenario 3
Scenario 4
Table 3. Load specification among feeders.
FeederActive (kW)Reactive (kVAR)Bus No
110485251, 2, 3, 4, 5, 6, 7, 8, 9, 10, 11, 12, 13, 14
2189693315, 16, 17, 18, 19, 20, 21, 22, 23, 24, 25, 26, 27, 28, 29, 30, 31
32174108832, 33, 34, 35, 36, 37, 38, 39, 40, 41, 42, 43, 44
42072103745, 46, 47, 48, 49, 50, 51, 52, 53
5132467554, 55, 56, 57, 58, 59, 60, 61
678339562, 63, 64, 65, 66, 67, 68, 69, 70, 71, 72, 73, 74, 75, 76, 77, 78, 79
7135267780, 81, 82, 83, 84, 85, 86, 87, 88, 89,
82745128290, 91, 92, 93, 94, 95, 96, 97, 98, 99, 100, 101, 102, 103, 104, 105, 106, 107, 108, 109, 110
Total13,3946612
Table 4. Sensitive analysis for determining the optimum mitigation using TOU and BESS.
PV PBESS CapacityT0UVminNo. of Nodes Violated
100 kWBESS 0.4 MWh0%0.94618
10%0.9485
20%0.9510
BESS 0.6 MWh0%0.9546
10%0.9550
Without BESS00.92420
10%0.92720
20%0.94020
60 kWBESS 0.4 MWh0%0.94620
10%0.95010
20%0.9510
BESS 0.6 MWh0%0.94710
10%0.9540
Without BESS00.92420
10%0.92720
20%0.94020
20 kWBESS 0.4 MWh0%094620
10%0.94710
20%0.94810
BESS 0.6 MWh0%0.94520
10%0.94610
20%0.94710
Without BESS00.92420
10%0.93220
20%0.94020
Disclaimer/Publisher’s Note: The statements, opinions and data contained in all publications are solely those of the individual author(s) and contributor(s) and not of MDPI and/or the editor(s). MDPI and/or the editor(s) disclaim responsibility for any injury to people or property resulting from any ideas, methods, instructions or products referred to in the content.