1. Introduction
The design process of wind turbine blades involves multiple characteristics such as aerodynamics, noise, structural integrity, manufacturing, and so on. Specifically, the process starts with an aerodynamic study where the aim is to accurately model the energy extraction from the wind and the structural loads that can be generated. A key element in the aerodynamic design process is the use of airfoils that, depending on their shape, can increase or reduce the relationship between energy capture and load. But this accuracy can be affected in the manufacturing process by various causes directly influencing the decrease in aerodynamic performance. This work focuses on how geometric variation directly affects the efficiency of an airfoil.
Related studies have been reported such as the case of [
1] where they propose a method for efficiently designing an airfoil family satisfying aerodynamic and geometric compatibility based on prescribed pressure gradient distributions. By performing a geometric variation for a 600 kW turbine, they showed an estimated reduction in blade fatigue load of up to 15% with the same annual energy yield and a reduction in blade weight and strength at the same time. On the other hand, frost ice accumulation affects the resulting flow field of wind turbine blade profiles. In [
2], where a study of this effect was conducted, the analyses were carried out with Reynolds numbers ranging from 2.5 × 10
6 to 5.5 × 10
6, corresponding to operational wind speeds and angles of attack ranging from −10 degrees to +20 degrees; the results showed an increase in the lift and drag coefficients of wind turbine blade profiles with ice on the leading edge. Su et al. [
3] focus on the design of a wind turbine airfoil by using numerical optimization. In the optimization process, the geometric shape of the airfoil is varied, obtaining high efficiency airfoil for the outer part of a blade, and the results are compared with existing wind turbine airfoils. On the other hand, roughness causes a geometrical variation in the airfoil. In Tempelis and Mishnaevsky [
4], the effects of accumulated surface roughness of wind turbine blades on the flow field and power generation are analyzed. These roughness elements, depending on their size, location, and density, can disturb the flow field and reduce the power produced by the machine. The work of Song et al. [
5] specifies how variations in rotor blade geometry influence aerodynamic loads that also affect the reliability of other wind turbine components. These can arise from manufacturing tolerances and operational wear of the blades. Quantifying the uncertainty in predicting aerodynamic performance in wind rotors after the manufacturing process is challenging. Broatch et al. [
6] evaluated the aerodynamic performance of a turbofan; the basis of this study was optical scanning of the first rotor followed by the application of CFD. Corrugated coatings provide a good solution for transforming wings due to their highly anisotropic behavior. If the low stiffness corrugation plane is aligned in the chord direction, shape change in the airfoil is possible. In Zhang et al. [
7], the effect of a corrugated cladding on the overall aerodynamics of an airfoil, particularly on the lift and drag characteristics, was investigated.
Contamination and erosion at the leading edge of blade tips adversely affect the annual energy production (AEP) of wind turbines. Han et al. [
8] quantitatively analyzed the effects of contamination and erosion on the aerodynamic performance of a blade tip airfoil (NACA 6414 618) and, in turn, on the AEP loss of wind turbines; transient computational fluid dynamics simulations and AEP calculations were performed for a 5 MW National Renewable Energy Laboratory wind turbine. An increase in rotor diameter implies an increase in relative wind speed (with respect to each cross-section in the blade radial direction) near the blade tip region. A computational fluid dynamics (CFD) analysis was performed by Tempelis et al. [
9] to analyze the correlation between leading edge erosion damage and blade output performance. CFD simulations were performed using a tip airfoil (NACA 64_618) and a full-scale wind turbine (NREL 5 MW).
Surface erosion of wind turbine blades is one of the most critical problems in wind energy development. Recent studies on the mechanisms, models, and prevention possibilities of wind turbine blade surface erosion is discussed in [
10]. The latest research in the area of leading-edge erosion (LEE) is summarized from different points of view, based on meteorology, aerodynamics, materials science, and computational mechanics.
In the design of wind turbine blades, a process of airfoil selection is carried out where a family of airfoils can be used or combined with other families that vary their thickness depending on the blade area, where for the structural area that covers up to one third of the rotor radius, greater relative thickness of the airfoil is used and in the aerodynamic area, which corresponds from the structural area to the tip of the blade, the airfoils have lower relative thickness and thus achieve greater lift [
11].
To perform this process, Qblade software is used, which integrates the Xfoil airfoil design and analysis tool with which the airfoil polar data is obtained, which is used as input data in a code on the blade element moment method (BEM) developed in Matlab vR2023b software. This allows for the iterative process characteristic of BEM, where the aerodynamic loads, position, chord and twist angle of each section dividing the blade must be obtained.
The objective of the present study is to investigate the effect of airfoil geometry variations in wind turbine blades due to incorrect manufacturing and how this influences the airfoil coefficients and airfoil efficiency, resulting in a decrease in the rotor power coefficient. To determine the manufacturing errors, a scan of the blade is performed using the laser triangulation technique, where a camera records the image of a line projected on a section of the blade and the shape of the profile is reconstructed [
12,
13]. Using the coordinates of the reconstructed airfoil and the original airfoil in each section and using the Xfoil panel code implemented in the Qblade and CFD, the aerodynamic coefficients of each are obtained; thus determining how the aerodynamic efficiency varies when deforming the geometry of the original airfoil due to manufacturing.
The design and optimization of airfoils for wind turbines has been a topic of great interest in renewable energy research [
14]. Several studies have addressed the challenges associated with manufacturing, geometric variations, and environmental effects on blade aerodynamic performance. The following is an extension of the state of the art with key references that complement the study presented in the article.
Aminjan et al. [
15] explore the use of numerical optimization techniques to design high-efficiency airfoils. The study demonstrates that numerical optimization can significantly enhance the aerodynamic performance of airfoils, comparing the results with existing profiles and highlighting the importance of precision in design to maximize energy capture. Alam [
16] analyzes how surface roughness on wind turbine blades affects the flow field and energy generation. The author discusses the impact of roughness on power loss and proposes methods to mitigate these effects, which is crucial for maintaining wind turbine efficiency under real operating conditions. Shen et al. [
17] investigate how ice accumulation on the leading edge of wind turbine blades affects lift and drag coefficients. The results show that ice can significantly increase aerodynamic resistance and reduce airfoil efficiency, emphasizing the need to consider these effects in blade design for cold climates. Riley et al. [
18] analyze how geometric variations in wind turbine blades—caused by manufacturing tolerances and operational wear—affect aerodynamic loads and component reliability. This study highlights the importance of controlling geometric variations during manufacturing to ensure optimal performance. Mishnaevsky et al. [
19] analyze the effects of erosion on aerodynamic performance and propose prevention and protection methods, which are essential for extending blade lifespan and maintaining energy efficiency. Torres-Moreno et al. [
20] present an optical measurement technique to assess the aerodynamic shape and twist of wind turbine blades. This technique is useful for validating designs and detecting deformations, enabling improved manufacturing precision and blade performance. Zhang et al. [
21] quantitatively analyze the effects of contamination and erosion on the aerodynamic performance of blade tip airfoils. The results show that these factors can significantly reduce annual energy production, underscoring the need for maintenance and protection strategies.
Siddiqui et al. [
22] discuss computational and experimental techniques used to analyze aerodynamic performance in horizontal-axis wind turbines. The authors highlight the role of CFD in blade design and optimization, enabling a better understanding of flow behavior and aerodynamic efficiency. Guangxing et al. [
23] present the development of a family of airfoils designed to reduce fatigue loads on wind turbine blades. The authors demonstrate that maintaining high energy performance while reducing blade weight and solidity contributes to increased durability and efficiency. Zhang et al. [
24] analyze how geometric variations in blade profiles affect aerodynamic performance and blade row interactions in turbines. This study highlights the importance of controlling geometric variations to ensure optimal performance and increased reliability in wind energy systems.
2. Materials and Methods
Among the methods for designing and analyzing wind turbine blades, the BEM theory is widely used due to its short computation time and satisfactory results [
25]. This theory combines one-dimensional momentum theory with blade element theory, following an iterative process that does not account for the flow field [
26]. The equations of the BEM method used in the design of the blades are as follows.
The theoretical or ideal blade design begins with the selection and placement of aerodynamic airfoils along its longitudinal axis. Initially, the local flow angle (
ϕr) is calculated, which depends on the local speed ratio (
λr =
rΩ/
Uv) [
27]. For this purpose, the design assumes an axial induction factor of
a = 1/3 and
a′ = 0. The twist angle is then calculated (Equations (1) and (2)) as the difference between the flow angle and the optimal angle of attack, where (
CL/
CD) is maximized.
Using the blade shape model for an ideal rotor with wake rotation, the equation to calculate the local chord (
cr) is defined as Equation (3).
The turbine has a total of
B blades. Therefore, the thrust force and torque on each element
dr are given by Equations (4) and (5), respectively.
where
ρ is the air density,
Urel is the relative velocity, Ω is the rotor’s rotational speed, and
F is the tip loss correction factor.
On the other hand, CFD is a powerful tool applied in the design and analysis of wind turbines to study flow fields, such as the flow behavior on the blade surface and the wake of wind turbines [
28]. The physical characteristics of fluid motion around a turbine blade can be solved using the Navier–Stokes equations with axial symmetry in cylindrical coordinates to determine the velocity field. These equations are expressed in Equations (6)–(8):
In this study, three widely used computational fluid dynamics (CFD) tools, such as EllipSys3D, OpenFOAM v2406; and ANSYS Fluent 2025 R1.08, were employed to analyze the aerodynamic performance of wind turbine blades. All three platforms solve the Navier–Stokes equations using the finite volume method, allowing for detailed simulation of fluid flow around complex geometries such as airfoils. EllipSys3D is tailored for wind energy applications and is particularly effective in modeling turbulent flows over wind turbine blades, utilizing advanced turbulence models like k-ωSST to accurately capture boundary layer behavior and flow separation. OpenFOAM is an open-source CFD toolbox that offers flexibility in mesh generation, solver selection, and post-processing, making it suitable for custom aerodynamic studies and validation against experimental data. ANSYS Fluent is a commercial CFD package known for its robust solver capabilities and user-friendly interface, supporting a wide range of turbulence models and multiphysics simulations.
In all cases, the analysis workflow consists of three main stages: pre-processing (geometry and mesh generation, boundary condition definition), solution (solving the governing equations and modeling turbulence), and post-processing (extracting aerodynamic coefficients such as lift and drag, and visualizing flow fields). For this research, these tools were used to quantify the impact of geometric deviations—measured via laser triangulation—on the aerodynamic efficiency of the manufactured airfoils, focusing on changes in lift, drag, and overall power coefficient.
By leveraging these established CFD platforms, the study ensures accurate, validated predictions of aerodynamic performance, while the integration with experimental geometry measurements highlights the practical implications of manufacturing-induced deformations on wind turbine efficiency [
29,
30,
31,
32,
33].
A comparison of the models is presented in
Table 1.
To conduct this study of the airfoil profile, the ANSYS Fluent software is used. The procedure followed is as follows:
Design the airfoil geometry, control surface, and a circular-shaped surrounding zone aimed at refining the mesh, as seen in
Figure 1.
Mesh generation: The triangular meshing method was used. The element size on the control surface was set to 0.021 m, and 0.014 m in the circular zone. Ten inflation layers were applied to the airfoil geometry. In the intrados and extrados regions, 600 divisions were implemented, and 4 divisions were made at the trailing edge zone [
34].
Previously, the effect of the mesh size was investigated. For this case, a mesh independence study was applied, which consists of meshing in x number of elements and observing the behavior of the value of the lift (
CL) and drag (
CD) coefficients. The simulations to obtain the value of
CL and
CD were performed at an angle of attack α = 0° and a velocity of 8.75 m/s.
Figure 2 shows the results of the mesh independence study, where an optimal value of
CL was obtained in a mesh with 120,400 elements [
35]. Subsequently, meshes were made by increasing the number of elements on the control surface, but the trend remained the same with an increase of 0.1 [
36].
Figure 3 shows the meshing applied to the control surface: (a) original airfoil, where 120,260 elements and 63,738 nodes were generated, and (b) scanned airfoil, where 129,440 elements and 71,629 nodes were generated.
Configuration of Boundary Conditions
The turbulence model used in this study is k-ωSST; the properties of the fluid (air) are as follows: density, = 1.225 kg⁄m3, viscosity μ = 1.7894 × 10⁻⁵ kg⁄ms. The boundary conditions are as follows: In the inlet zone the velocity specification method used is magnitude and direction, using the Vm, Vd, and Vs and an initial pressure of 0 Pa. The flow direction used is component X = cos(α) and Y = sen(α), where for this study, a range of 0° ≤ α ≤ 20° was used.
3. Case of Study
In this study, the wind turbine blade prototypes were fabricated entirely by hand, a process that inherently introduces unique sources of geometric deformation distinct from those found in industrial or automated manufacturing. Manual fabrication, while offering flexibility and adaptability, is particularly susceptible to several factors that can lead to deviations from the intended airfoil geometry.
Firstly, the precision of the mold is a critical factor in any manufacturing process. In our case, the molds were also handcrafted, and even with careful attention, small inaccuracies in shaping, alignment, or surface finishing are difficult to avoid. These imperfections can propagate to the final blade geometry, resulting in local or global deviations from the design profile.
Secondly, during manual layup and assembly, human error can introduce additional variability. The placement and orientation of composite layers, application of adhesives, and joining of blade halves are all operations that depend heavily on the skill and consistency of the operator. Variations in pressure, alignment, or material handling can cause warping, uneven thickness, or asymmetry in the airfoil sections.
Thirdly, material behavior during curing is another source of deformation. Even with manual control, factors such as uneven resin distribution, inconsistent compaction, or uncontrolled environmental conditions (temperature and humidity) can lead to non-uniform shrinkage or residual stresses. These effects are often amplified in hand-made processes due to the lack of precise control mechanisms available in industrial settings.
It is important to emphasize that these sources of geometric deviation are not exclusive to manual manufacturing but are typically more pronounced when automation and quality control systems are limited. The results of our study, which quantify the aerodynamic impact of these deformations, highlight the importance of improving manual fabrication techniques and implementing quality assurance measures, even in small-scale or prototype production. By understanding and documenting the specific ways in which manual processes affect blade geometry, future efforts can focus on targeted improvements, such as more accurate molds, standardized assembly protocols, and controlled curing environments, to minimize geometric errors and their negative effects on aerodynamic efficiency.
This study was conducted on the blade of a 3 kW wind turbine, designed and built at the Wind Energy Laboratory of the Universidad del Istmo. The input parameters for the BEM method are shown in
Table 2.
After applying the BEM method, the rotor blade design parameters were obtained, as shown in
Table 3. In the aerodynamic region of the blade, the NACA 4421 airfoil was used.
Figure 4 shows the maximum thickness (
tm), with a value of 21% at position (
xtm) of 29.8% with respect to the leading edge. Also, the maximum curvature (
Cm) of 4% is located at position (
xCm) of 41.50% with respect to the leading edge.
Table 4 shows the parameters in the profiles located in the aerodynamic zone and specifically in sections 4 to 8, which is where most deformations occur due to the manufacturing process.
Once the blades were manufactured, the laser triangulation technique was implemented to reconstruct the geometry of various sections of interest along the blade. This technique has previously been used to evaluate airfoil shapes in wind turbine blades [
11,
12,
13].
The implementation of the technique used for blade testing is shown in
Figure 4. The blade is mounted on a rotational mechanical system of a CNC (Computer Numerical Control) machine. The upper surface of the blade is scanned, and to obtain the complete profile, the system is rotated 180° to scan the lower surface. The instrument is mounted on a rail to allow translation along the blade axis, enabling the evaluation of different sections. The resolution achieved with the system was 0.1 mm along the Z-axis.
In measurement processes using optical techniques on wind turbine blades (see
Figure 5), the expected resolution depends on the following: (a) The type of defect or geometric deviation to be detected, for example, surface roughness, global shape deviations, erosion, delamination, etc. (b) The optical technique used, photogrammetry, laser triangulation, deflectometry, interferometry, etc. (c) The size of the component; blades for low power wind turbines (1 kW to 5 kW) can measure from 1.25 to 3 m in length. In this work, the geometry of the blade profile in different sections is evaluated, so the typical expected resolution, for a macroscopic evaluation, according to industry standards and the literature [
11,
12,
13] is 0.1 to 1 mm. For a more detailed analysis of surface defects, microscopic evaluation, the expected resolution is 10 to 100 mm. The resolution achieved with the optical technique, 0.1 mm, is sufficient to geometrically evaluate the shape of the profile, even allowing microscopic details to be seen, but it does not have a significant impact on aerodynamic efficiency due to the dimensions of the blade.
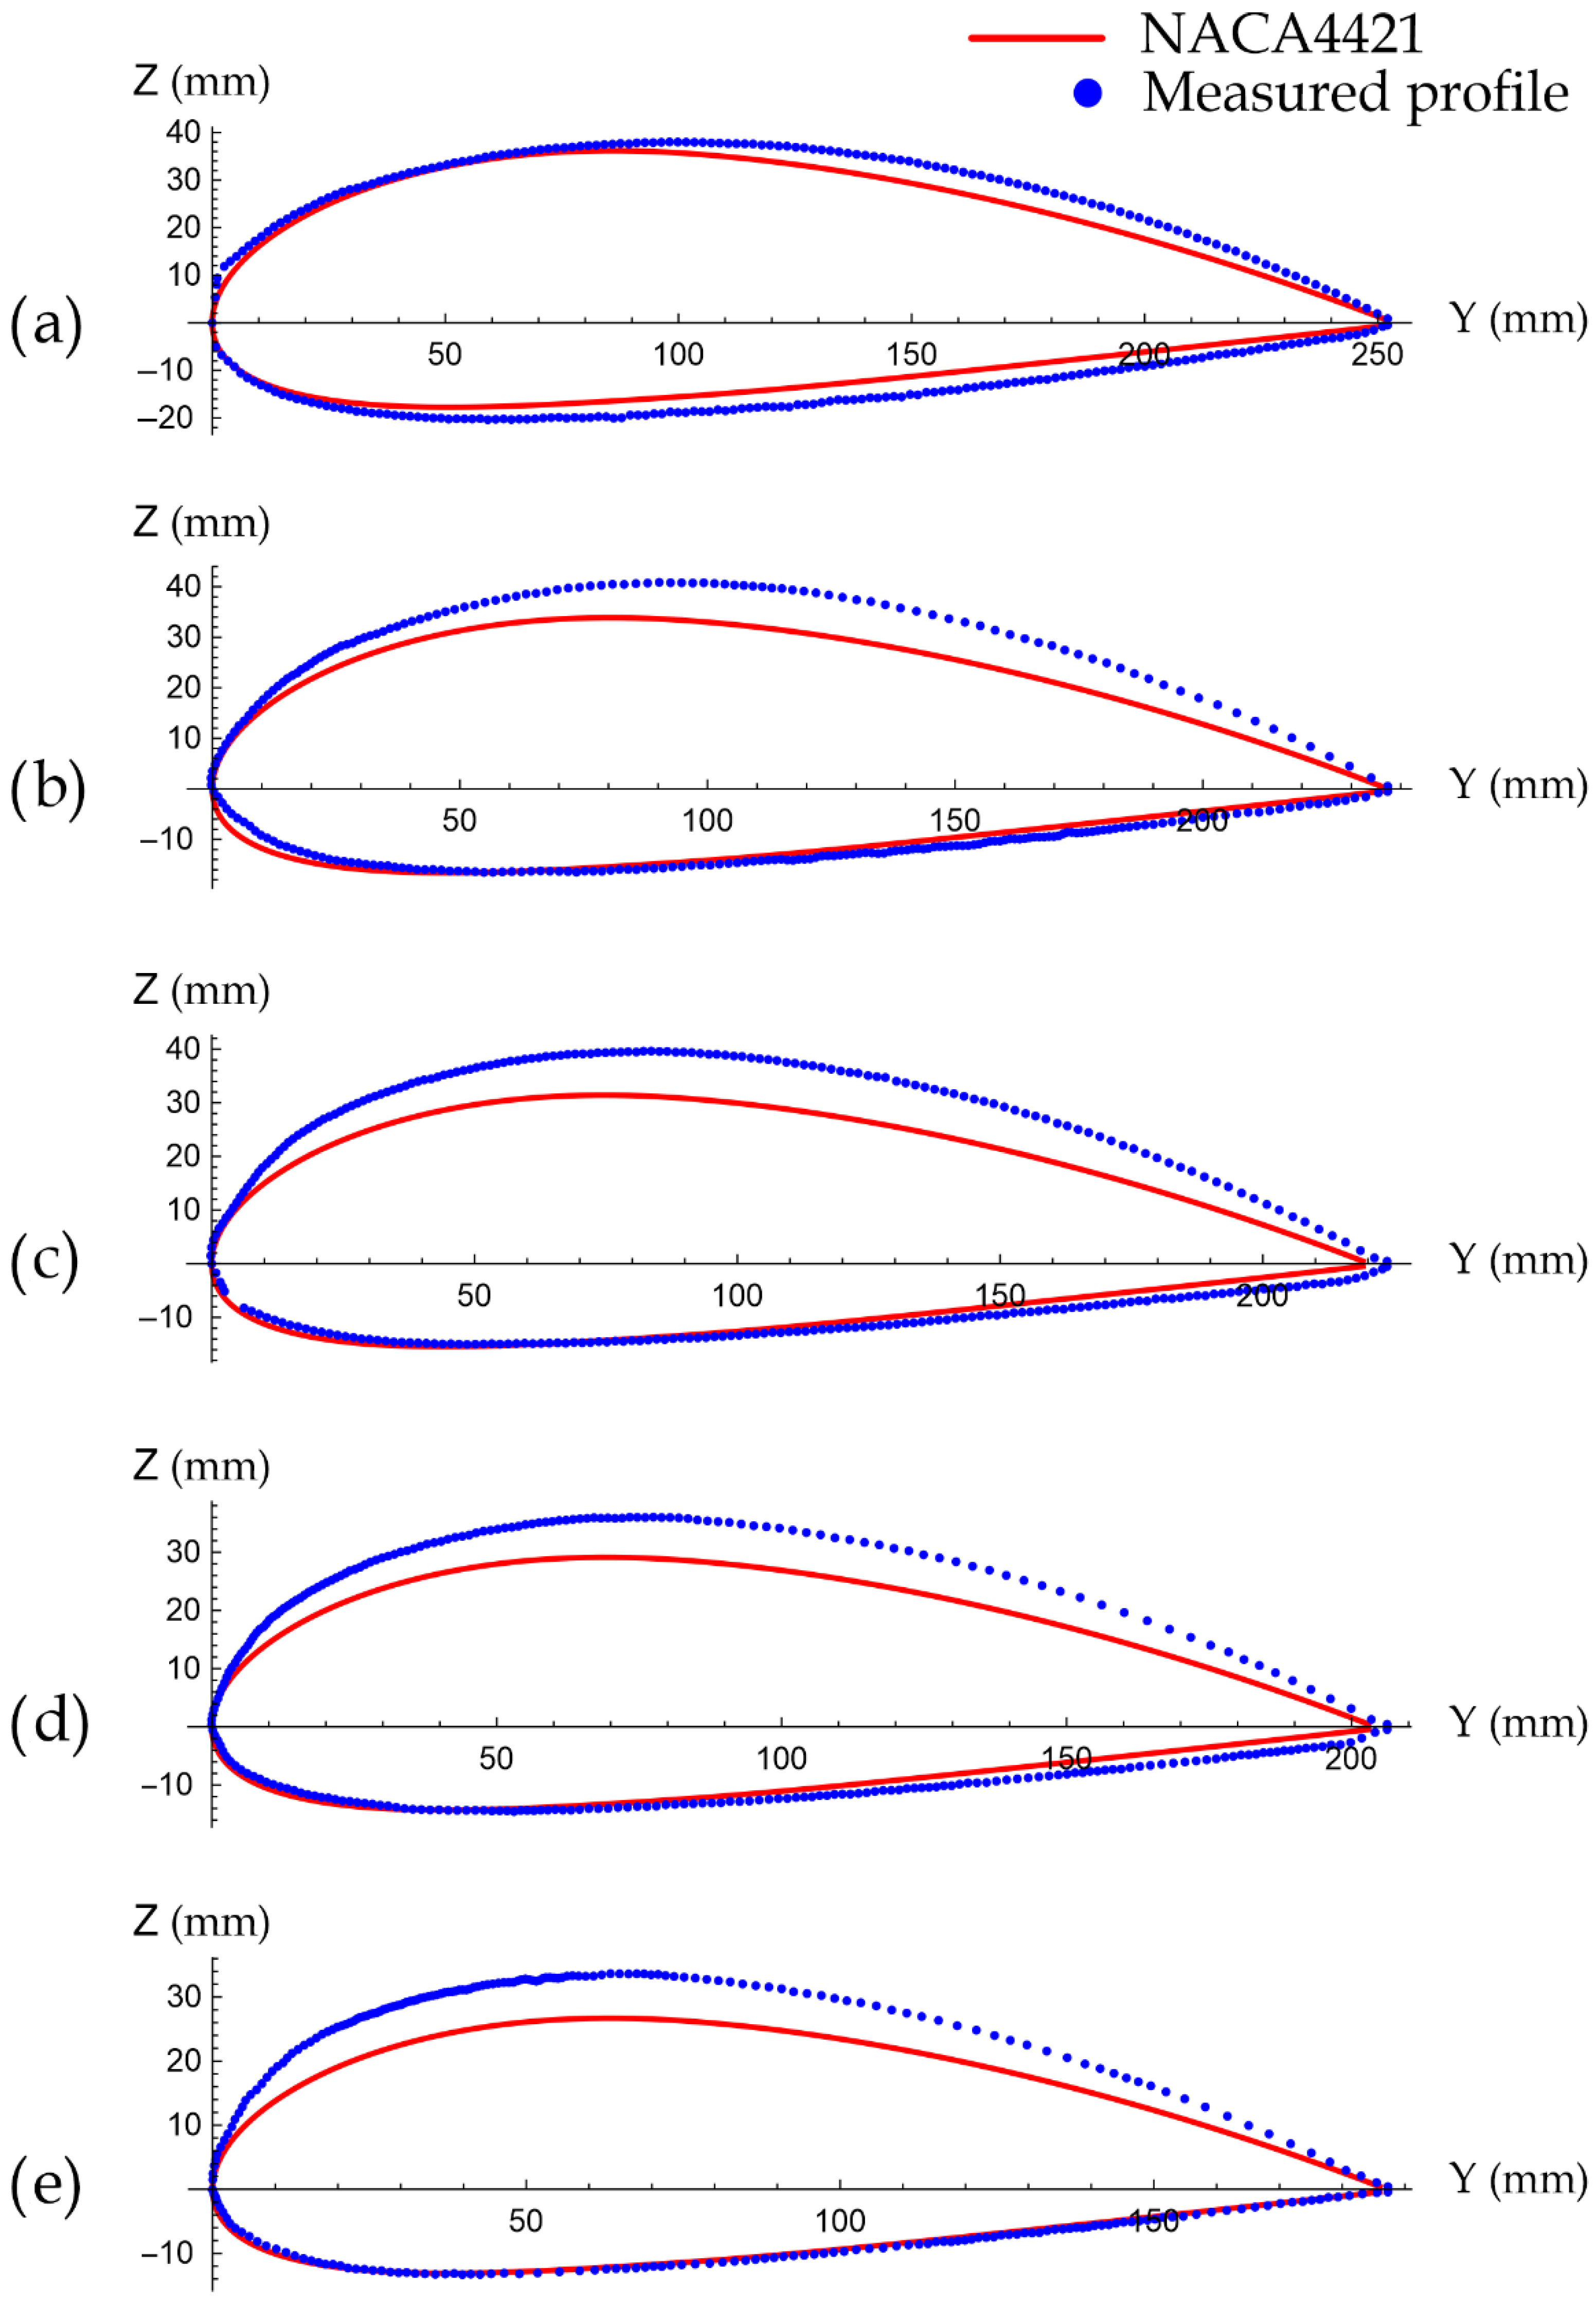
Figure 6 shows the reconstructed airfoils of sections 4 to 8, corresponding to the aerodynamic zone of the blade, and compared with the theoretical airfoil, i.e., the NACA4421 airfoil.
Table 5 shows the results of
Figure 5 as the maximum thicknesses of the original profile (
tm) and of the intrados (
tm,i) and extrados (
tm,e) and total (
tm,T) of the scanned profile at the same position of the original profile (
xtm). The case of the profile of section 8 was the one that presented the highest percentage increase (I) of 17.51%.
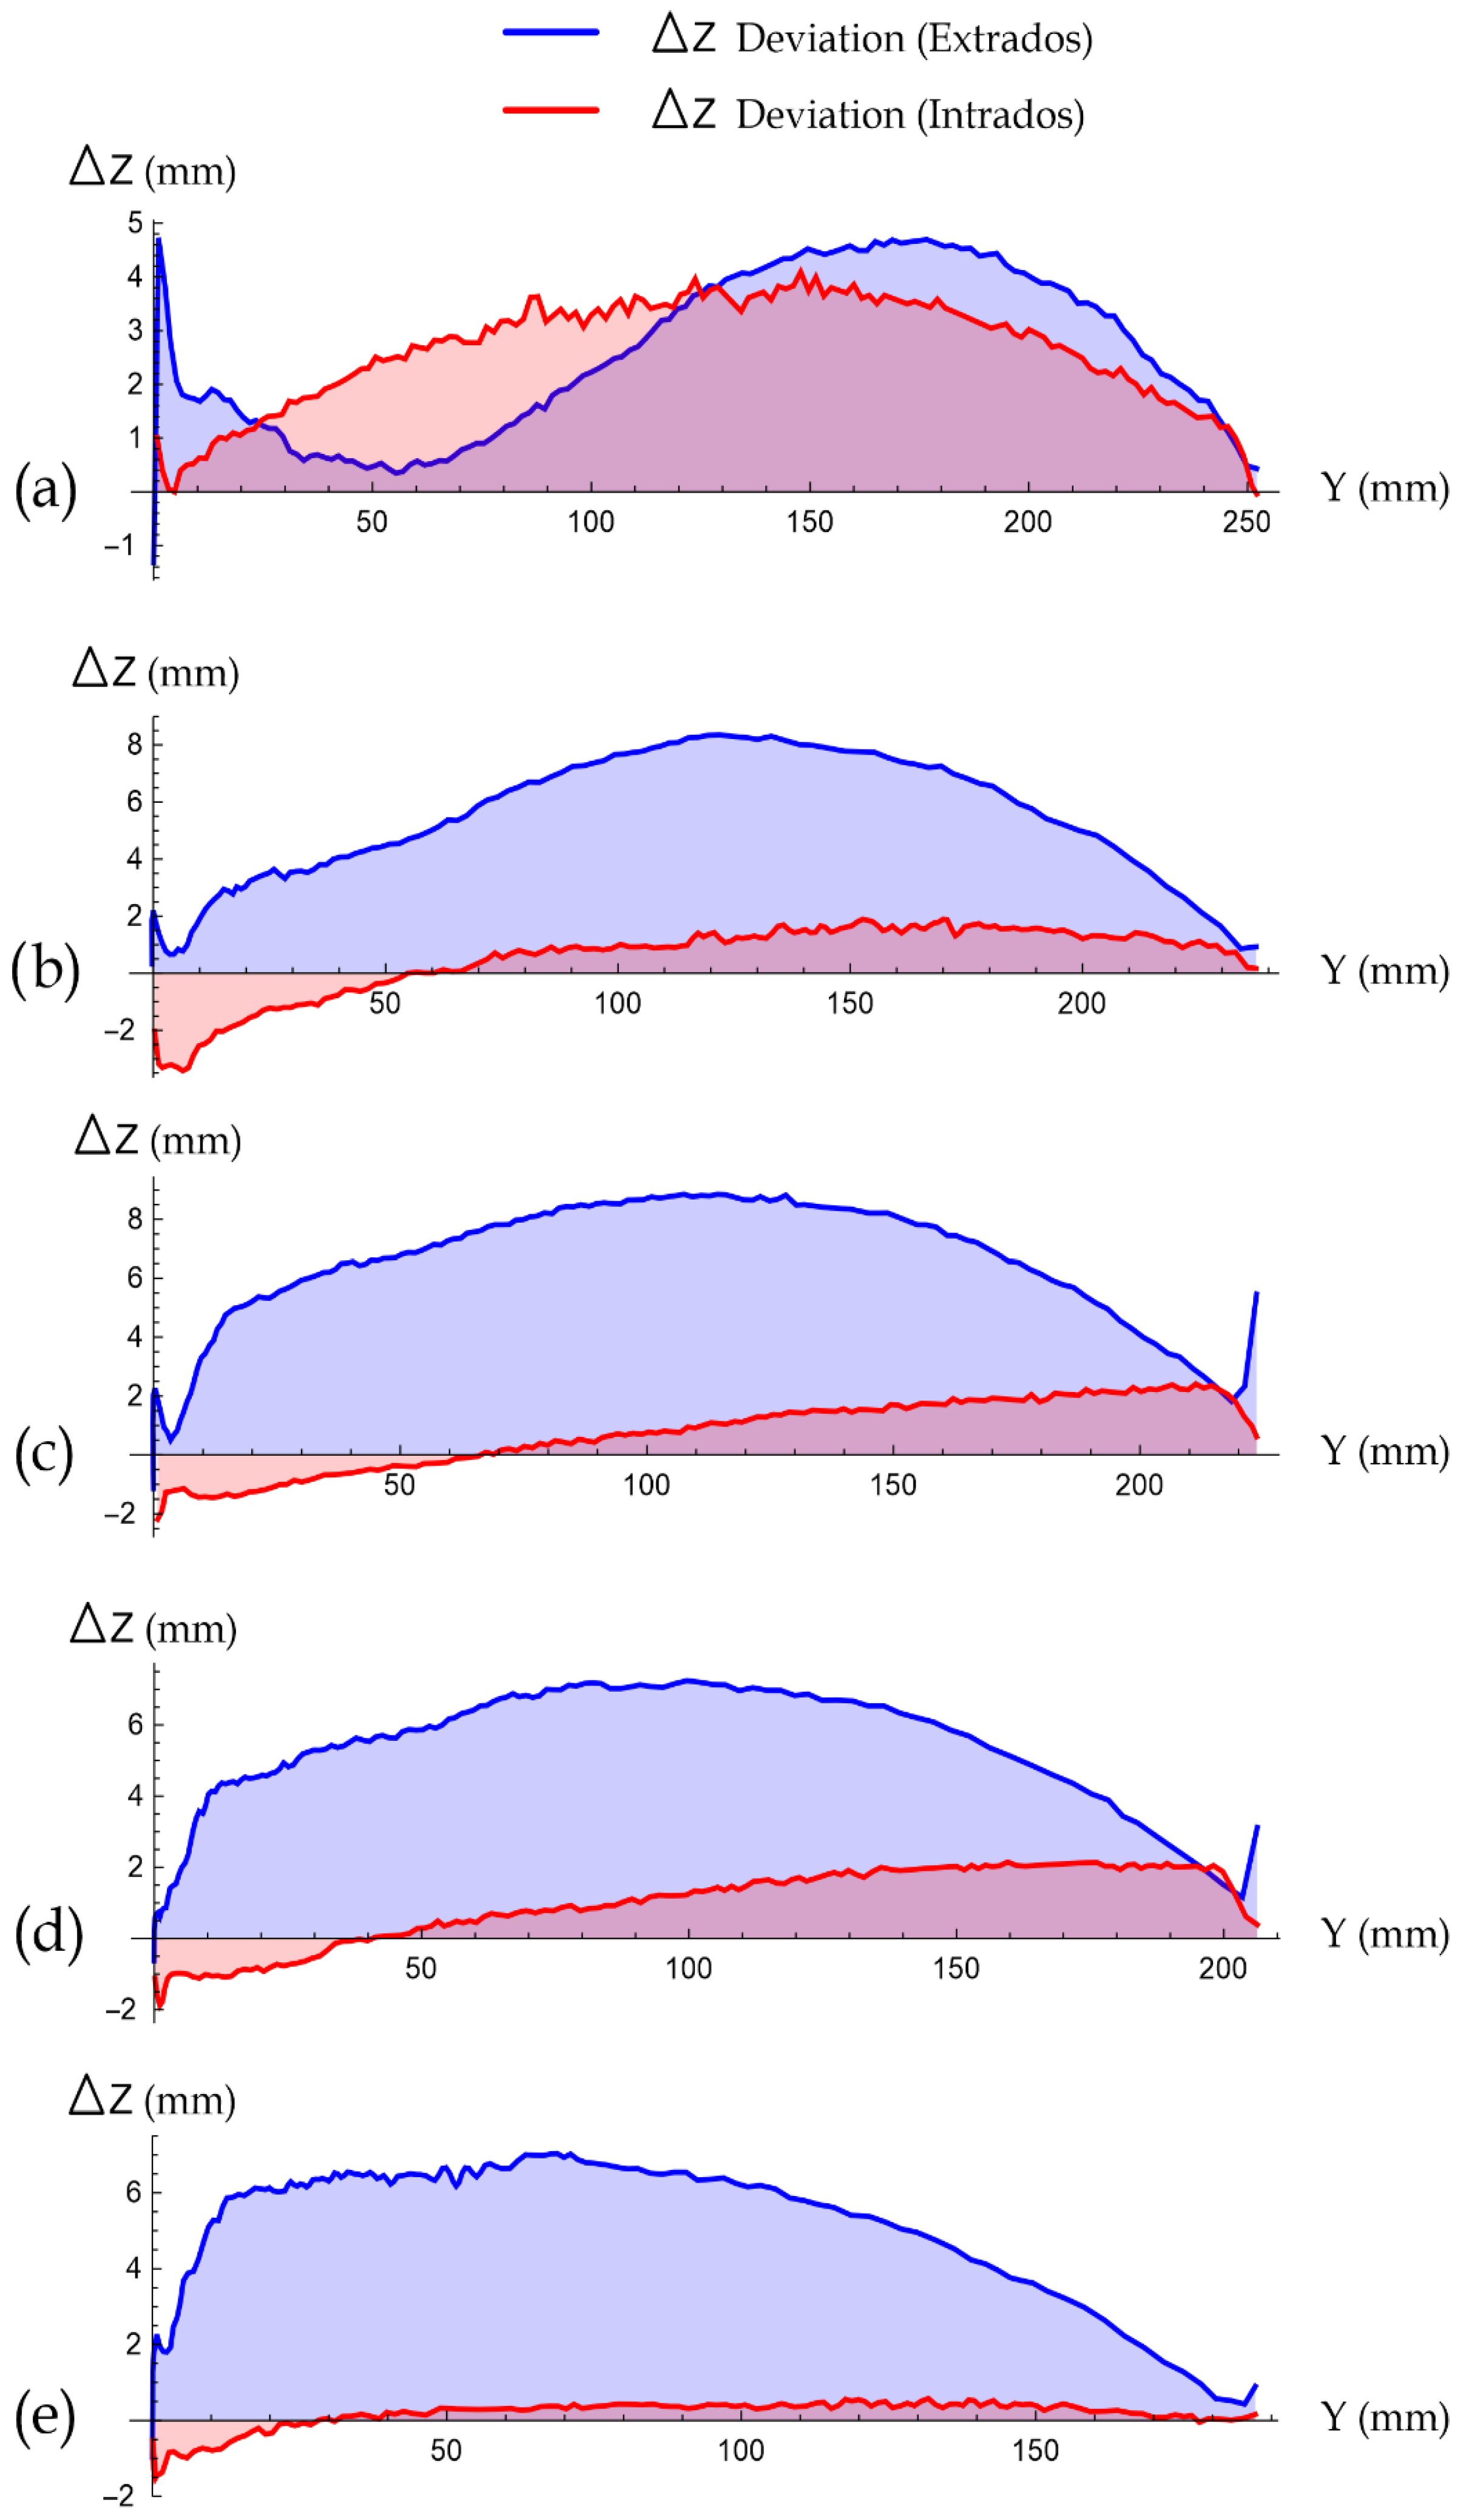
Figure 7 shows the difference between the scanned profile and the original profile in both the extrados and intrados, and
Table 6 shows the values of the errors in the intrados and extrados at the position of the maximum thickness and the maximum error of each one.
The manufacturing deviations or errors are summarized in
Table 6, where the differences Δz
rms and Δz
max for the upper and lower blade surfaces are presented.
3.1. Aerodynamic Coefficients of Original Airfoil Using XFOIL and CFD
Using the XFOIL code (combination of the panel method and an integral boundary layer formulation), for the analysis of the potential flow around the airfoils and a CFD simulation using ANSYS-FLUENT software, applying the turbulent transition model k-ω SST, the behavior of the lift, drag, and aerodynamic efficiency coefficients is predicted for the values of the mean, design, and exit velocity (
Table 1); the Reynolds number Re = 360,758 (
Table 3) corresponds to section 8 (P8) of the original airfoil.
Table 7 shows the aerodynamic coefficients for
Vm = 5.75 m/s.
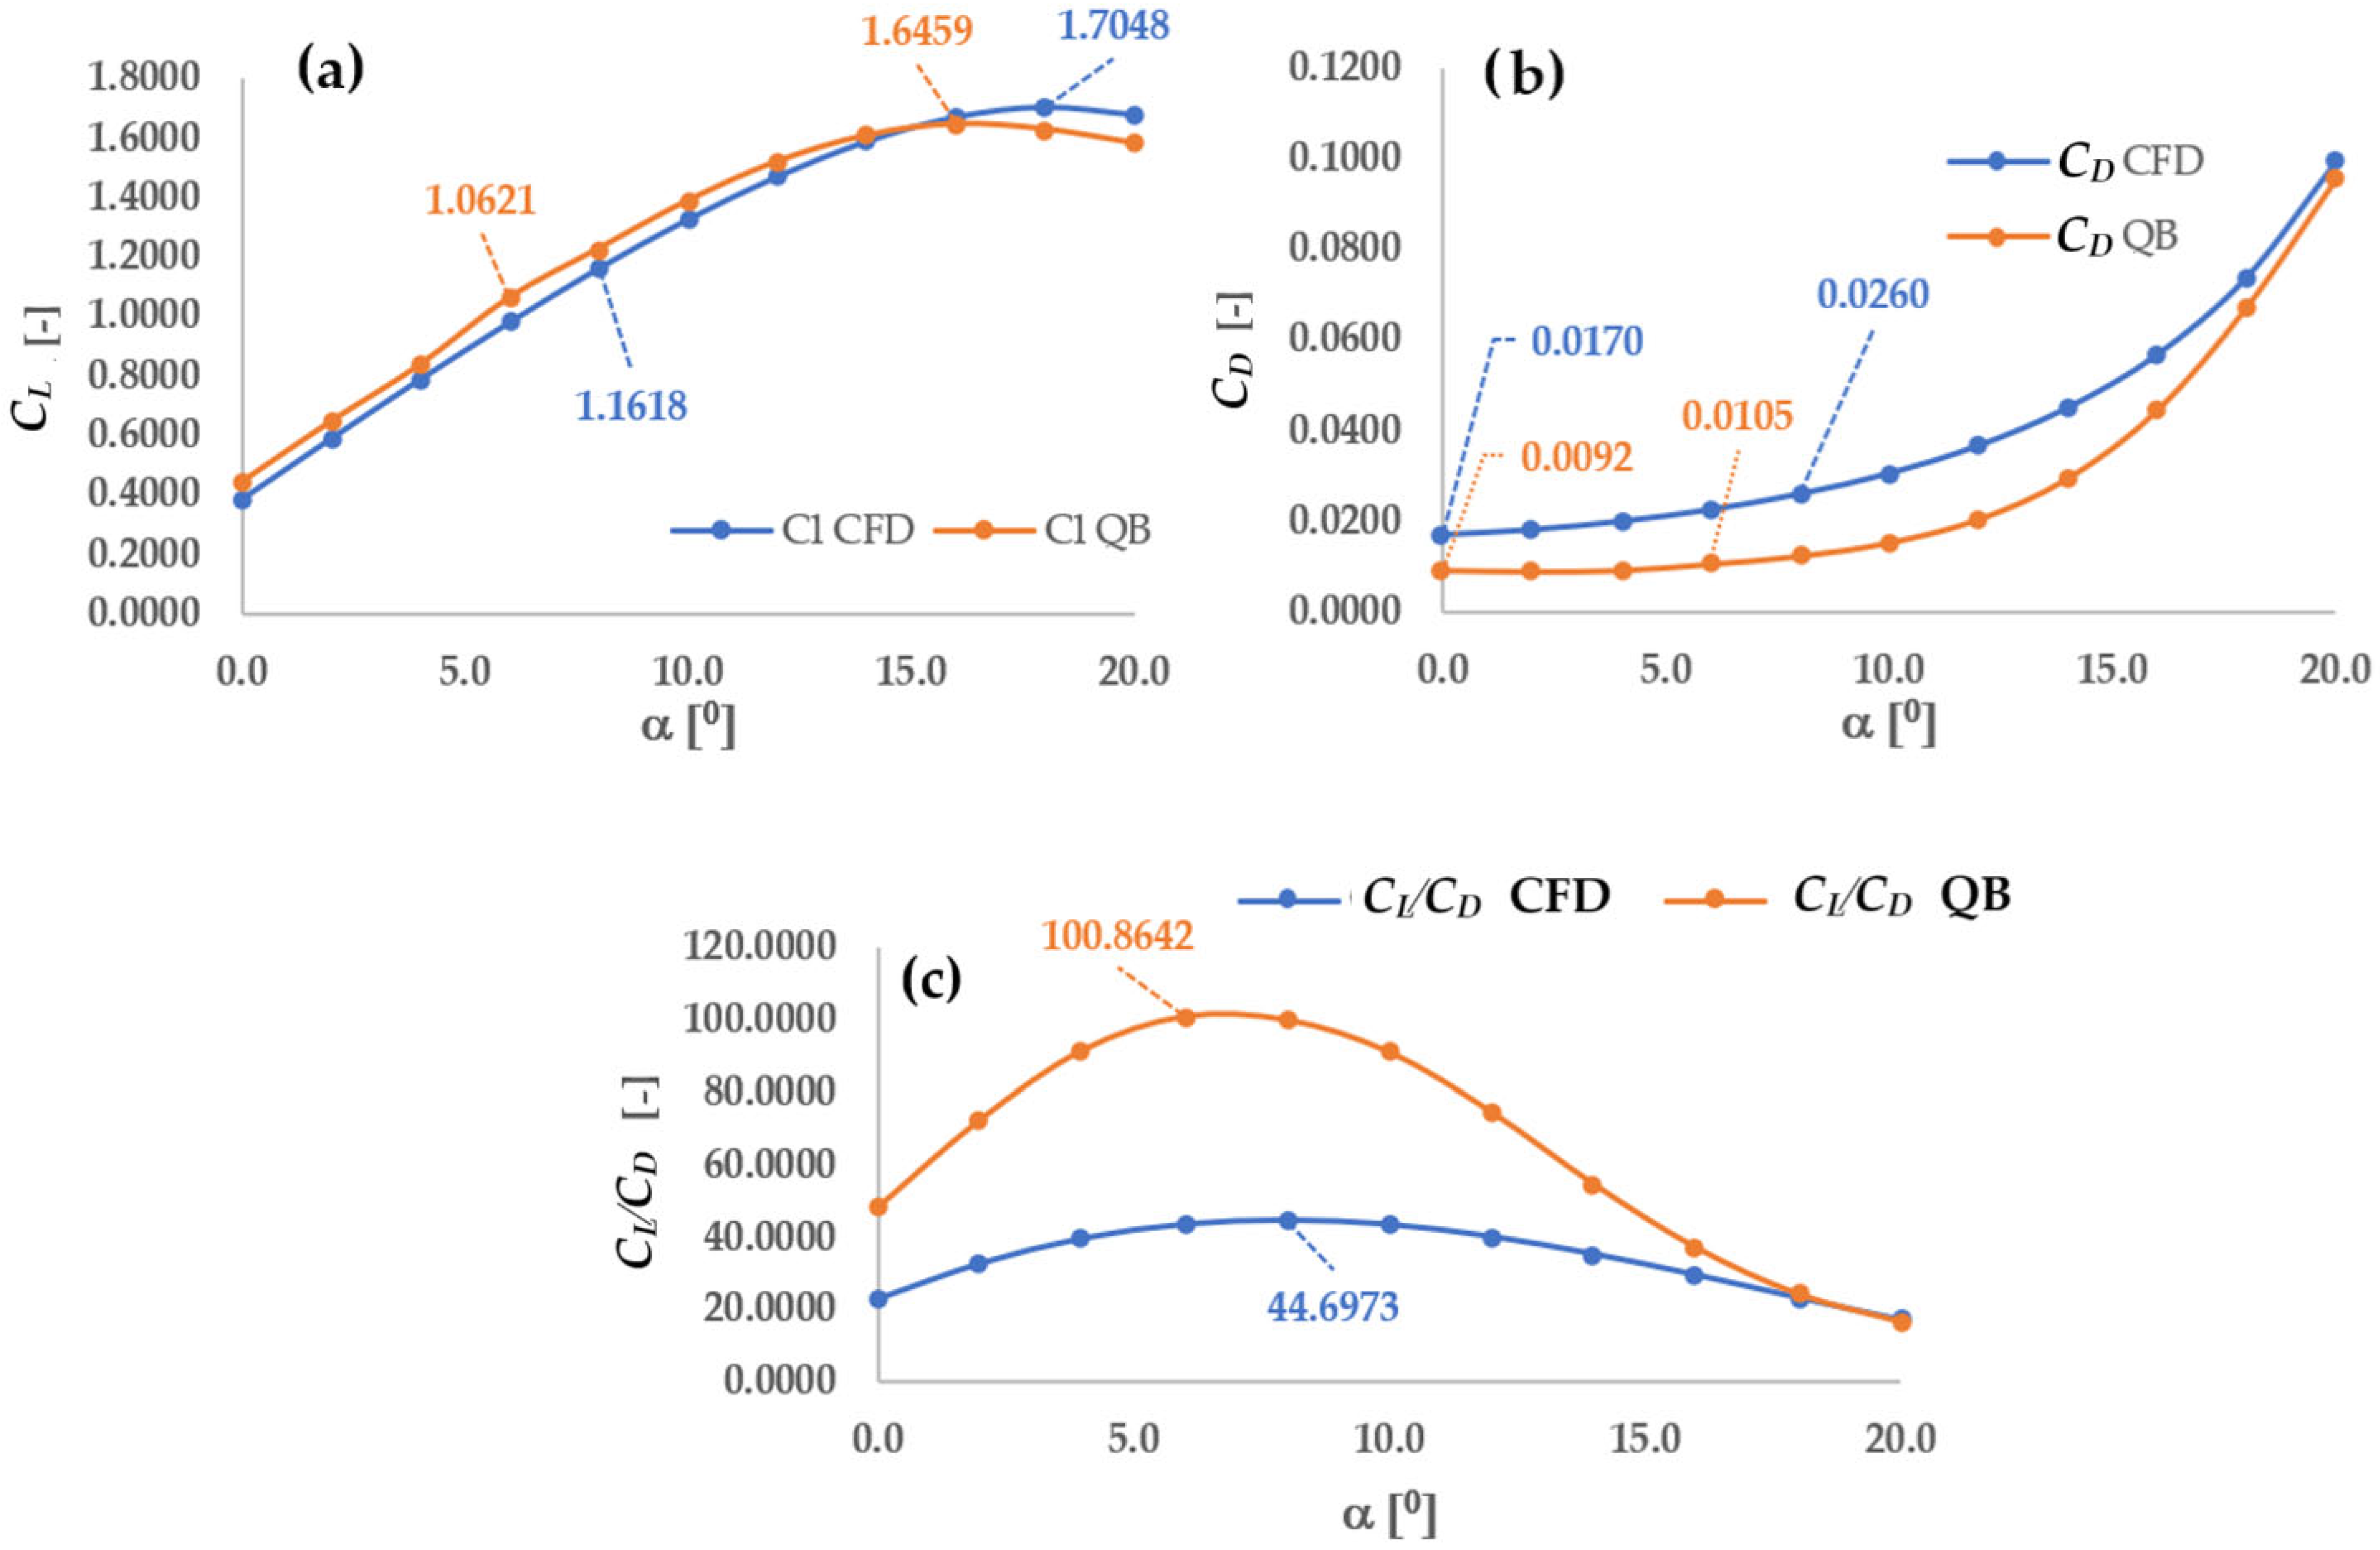
Figure 8 shows the polarity of the profile in section 8 for the average speed: (a) lift coefficient, (b) drag coefficient, and (c) aerodynamic efficiency. For the lift coefficient the highest value using CFD had a decrease with respect to the XFOIL of 1.38% [
37]; in the case of drag it presented an increase of 40.8%. The aerodynamic efficiency decreased by 50.5%.
Figure 9 shows the polar of the airfoil at section 8 for the outlet velocity, including (a) lift coefficient, (b) drag coefficient, and (c) aerodynamic efficiency. The maximum lift coefficient obtained using CFD showed an increase of 3.45% compared to the results from XFOIL. In the case of the drag coefficient, an increase of 42.93% was observed. Conversely, the aerodynamic efficiency decreased by 55.69%.
3.2. Aerodynamic Coefficients of Original and Modified Airfoil Using CFD Analysis
To analyze the polar behavior of the original and modified airfoil at section 4 under the velocity conditions
Vm,
Vd, and
Vs, CFD was employed using ANSYS software. The results using
Vm are presented in
Table 8 and
Figure 10, while the results using
Vd are shown in
Table 9 and
Figure 11.
As shown in
Figure 10, for the mean wind velocity, the lift coefficient of the original airfoil at section 8, which has a value of 1.5265, decreased to 1.0757 in the modified airfoil, representing a reduction of 29.5%. In contrast, the drag coefficient showed the opposite trend, with the aerodynamic efficiency being maximized. For the original airfoil, which has a value of 0.0306, it increased to 0.0412, representing a 25.7% increase. Consequently, the aerodynamic efficiency for the original airfoil is 36.0432, which decreased to 20.4570, reflecting a 43.2% reduction.
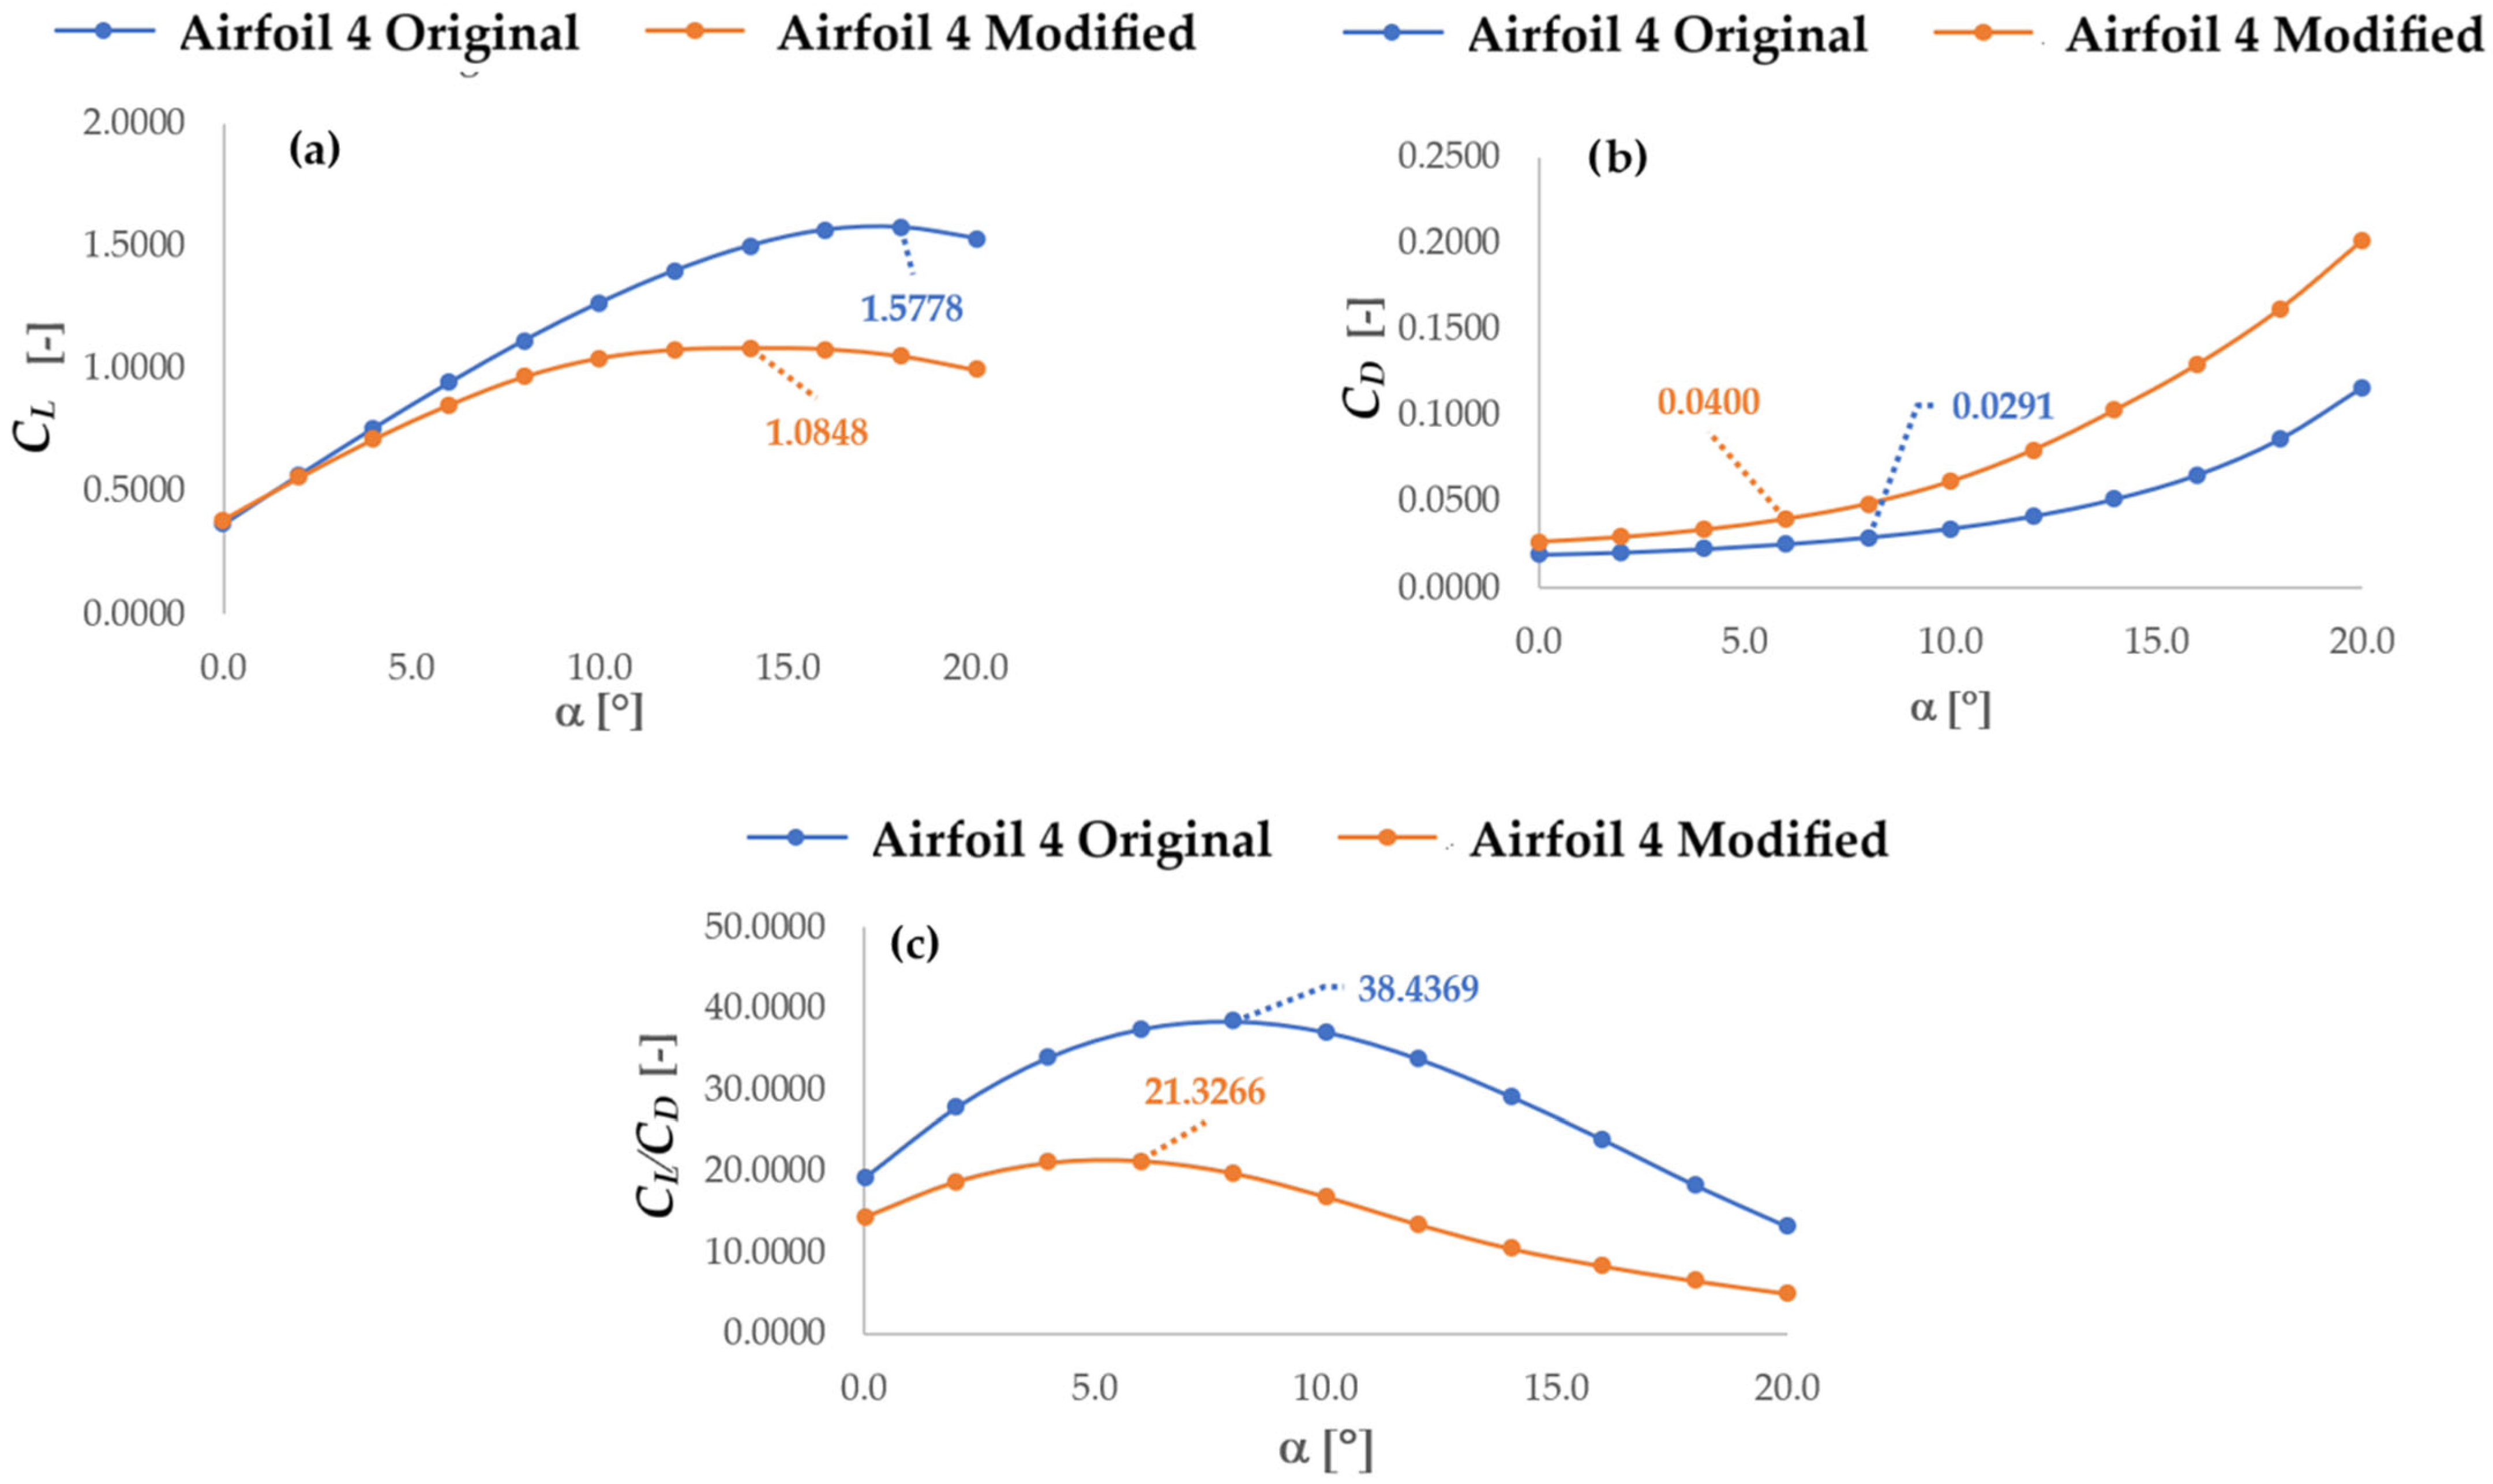
For the case of nominal velocity, as shown in
Figure 11, the lift coefficient of the airfoil at section 8 was 1.5778 for the original profile and decreased to 1.0848 for the modified profile, representing a reduction of 31.2%. Conversely, the drag coefficient increased: for the original profile—where aerodynamic efficiency is at its maximum—the value was 0.0291, which rose to 0.0400, indicating a 27.3% increase. As a result, the aerodynamic efficiency of the original airfoil, which was 38.4369, dropped to 20.4570, representing a 47.2% decrease.
3.3. Power Coefficient
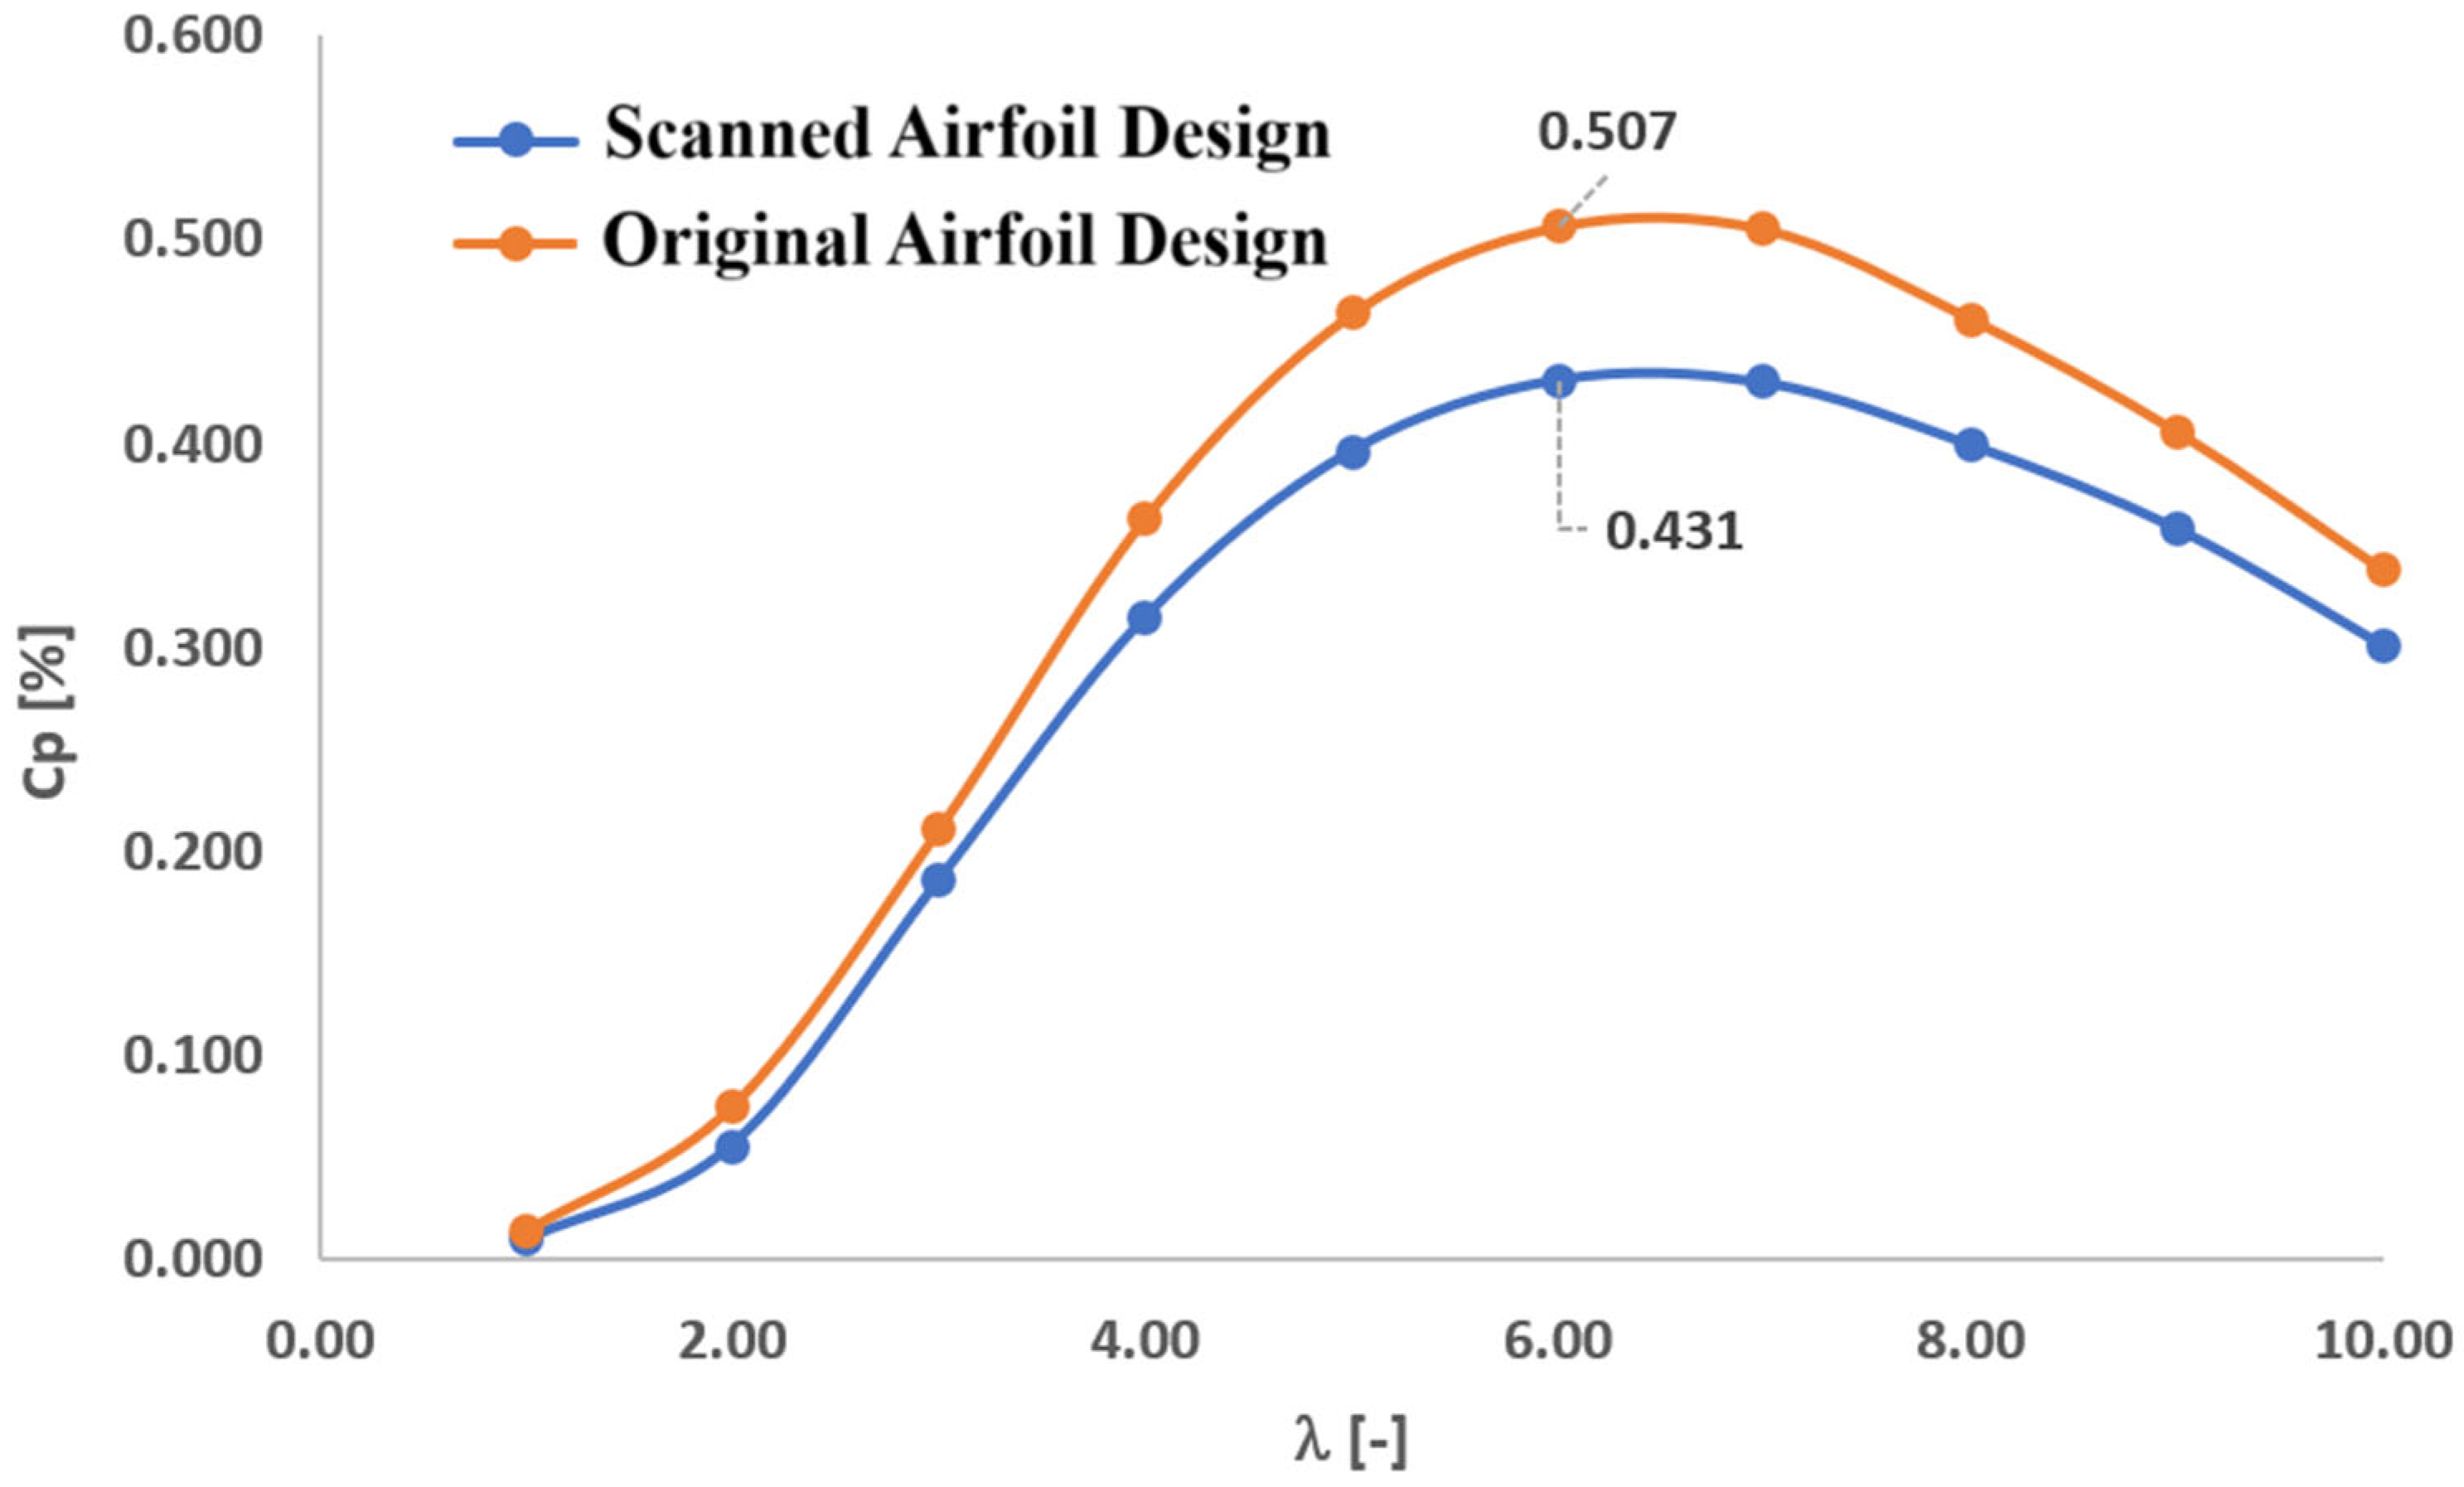
Once the airfoil aerodynamic coefficients were determined for sections 4 through 8 (P4–P8), the next step was to calculate the wind turbine rotor power coefficient using the scanned airfoils of these sections and compare the results with the power coefficient obtained from the original airfoil design.
Figure 12 shows the rotor power curve for design-specific speed ratios in the range of 1 ≤ λ ≤ 10. In the design case corresponding to a design-specific speed of 6 (see
Table 1), the power coefficient decreased by 14.9% compared to the original design.


