1. Introduction
High-speed railways have gained wide public support and popularity due to their significant advantages of punctuality, comfort, energy efficiency, safety, speed, and low pollution, leading a new era of railway development worldwide. Meanwhile, high-speed railways impose extremely stringent requirements on operational safety, with fatigue failure use being the primary mode of failure in railway vehicle structural strength.
Although vibration-induced fatigue damage patterns in critical components of electric multiple units (EMUs) have been studied for years, traditional assessment methods may underestimate structural failure risks in China Standardized EMUs. Prolonged high-speed operation exposes trains to high-frequency dynamic loads from both wheel–rail interactions and onboard equipment. These excitations can trigger structural modal vibrations within the vehicle system, inducing cascading vibration fatigue issues that significantly reduce the structural fatigue lifespan of rolling stock. As high-speed electric multiple units (EMUs) continue to advance in operational speed and structural complexity, conventional gearbox strength design—primarily based on quasi-static assumptions—may underestimate fatigue risks induced by high-frequency dynamic excitations.
Foreign research on the fatigue of railway vehicle structures began relatively early and has matured theoretically. In 1945, M. A. Miner proposed the Palmgren–Miner linear cumulative damage rule [
1], based on extensive experimental studies on fatigue cumulative damage, which remains a widely used calculation method in fatigue strength design today. In 1963, American researcher Paris developed the renowned Paris formula [
2] based on fracture mechanics, establishing the foundation for studying fatigue crack propagation. In the field of railway vehicle fatigue design, Japanese railway authorities conducted extensive experiments and in-depth research on the fatigue design of bogie components such as axles and welded frames, leading to the development of JIS design methods for railway vehicles [
3,
4]. European countries have established International Union of Railways (UIC) standards [
5,
6] that cover bogie design, load evaluation methods, and other aspects. Standards such as Germany’s DIN [
7], the UK’s BS [
8], and Europe’s EN [
9] all adopt the infinite-life design philosophy premised on maximum load and material fatigue limits. However, these standards differ in the selection of evaluation indices for welded joints, giving rise to various assessment methods, such as the nominal stress method [
10,
11,
12], structural stress method [
13,
14,
15], hot-spot stress method [
16,
17,
18], and master S-N curve method [
19,
20,
21,
22]. In terms of testing technology, European railway vehicle design companies represented by Siemens have established sophisticated bench-testing and in-service monitoring systems.
Ashutosh Sharma and others [
23] have reviewed the research progress in the field of fatigue failure, focusing on the research status of fatigue failure and very-high-cycle fatigue (VHCF) in metals, alloys, and steels. Ultrasonic fatigue testing, historical correlation, main testing principles, and equipment were also discussed.
Mingyang Yuan et al. [
24] investigated the very-high-cycle fatigue (VHCF) behavior of Ti-6Al-4V with equiaxed and bimodal microstructures, identifying distinct crack initiation modes associated with each. Their study proposed a model linking the observed shift in crack initiation mechanism to the underlying micro-texture. Furthermore, the results demonstrated that the bimodal microstructure conferred significantly enhanced VHCF properties compared to the equiaxed microstructure.
Xavier Lesperance [
25] investigated the long fatigue life characteristics of AlSi10Mg and AlSi7Mg aluminum alloys produced via direct metal laser sintering (DMLS) technology. The study utilized a self-assembled ultrasonic fatigue testing machine to conduct fatigue tests on heat-treated AlSi10Mg and AlSi7Mg alloy specimens under constant-amplitude symmetric tension–compression loading. The fatigue life data obtained from these additive manufacturing (AM) aluminum alloys were compared with previously published data under both heat-treated and non-heat-treated conditions. It was found that the fatigue data of the tested specimens were closer to those of specimens without any heat treatment. The fatigue test results indicated that further research is needed on the influence of heat treatment on the high-cycle fatigue (HCF) and very-high-cycle fatigue (VHCF) performance of AM alloys, considering the background of microstructural changes.
Domestic research on the fatigue of railway vehicle structures started relatively late, yet with the rapid development of high-speed EMUs in China over the past decade, studies on railway vehicle fatigue issues have become increasingly sophisticated. A trinity research framework integrating simulation analysis, in-service testing, and bench testing has been established for investigating bogie fatigue problems in railway vehicles.
Weihua MA and Shihui LUO from Southwest Jiaotong University [
26] proposed a combinatorial approach for typical operating conditions based on the actual line data of the Beijing–Tianjin Intercity Railway. By integrating high-speed train dynamics models and using measured track spectra for dynamic simulations of typical scenarios, they obtained a representative load spectrum for the swing arm nodes of 350 km/h high-speed EMUs.
The Structural Strength Laboratory at Beijing Jiaotong University, led by Longxiu Miao, Shouguang Sun, and colleagues [
27], elaborated a stress-spectrum testing protocol for welded bogie frames of passenger trains. The protocol involves first identifying weak spots prone to fatigue failure as measurement points, then obtaining stress–time histories at these locations through strain gauge measurements, compiling stress spectra, and conducting fatigue strength evaluations for the corresponding structures. The team calibrated bogie frames as force-measuring fixtures for experimental and in-service measurements and decoupled the data to obtain individual load systems, marking the first domestic application of on-track load identification and measurement for intercity train bogie frames.
Southwest Jiaotong University established a “small-roller” test rig for wheel polygonization [
28], providing an experimental basis for studying abnormal vibrations caused by wheel polygonization.
To evaluate the contribution of gear meshing to fatigue damage in the gearbox housing of a high-speed EMU, the gearbox was selected, and fatigue specimens were sectioned from the housing. The S-N curve of the cast aluminum alloy was obtained through fatigue testing. Based on field-measured data and high-frequency response bench tests under driving excitation, it was demonstrated that significant local modal vibrations were induced in the housing during actual operation by gear meshing. Subsequently, the contribution of gear meshing to the stress response of the housing was investigated. Ultimately, the impact of gear meshing on the fatigue damage of the housing was assessed.
3. Analysis of Bench Test for High-Frequency Response Under Driving Excitation
3.1. Test Scheme
The comprehensive test bench for the gear transmission system is used to conduct tests on the structural response of the gearbox housing under high-frequency driving excitation. The principle of the bench test is shown in
Figure 3.
The test equipment consists of an axle, a driving motor, a load motor, and two completely identical gearboxes. One of them is the gearbox under test, and the other is the accompanying test gearbox. They are connected to the driving motor and the load motor, respectively. The gearbox under test is installed on the axle, and the other end of the axle is connected to the accompanying test gearbox through a flange. Bearings are assembled at both ends of the axle and fixed on the test bench. The pinion ends of the two gearboxes and the installation interfaces of the frame are secured to the test bench through the tooling. During the bench test, it is as close as possible to the vehicle running state, and the modal results obtained are also consistent with the actual state of the vehicle running. The measured motor torque on the track is subjected to low-pass filtering to remove the pulsating part of the torque and retain only the quasi-static torque. The motor torque required to accelerate from 0 km/h to 360 km/h and then decelerate to 0 km/h is obtained and input to the driving motor of the test bench to provide the same torque as that on the track for the gear-meshing test of the gearbox.
3.2. Layout of Measuring Points
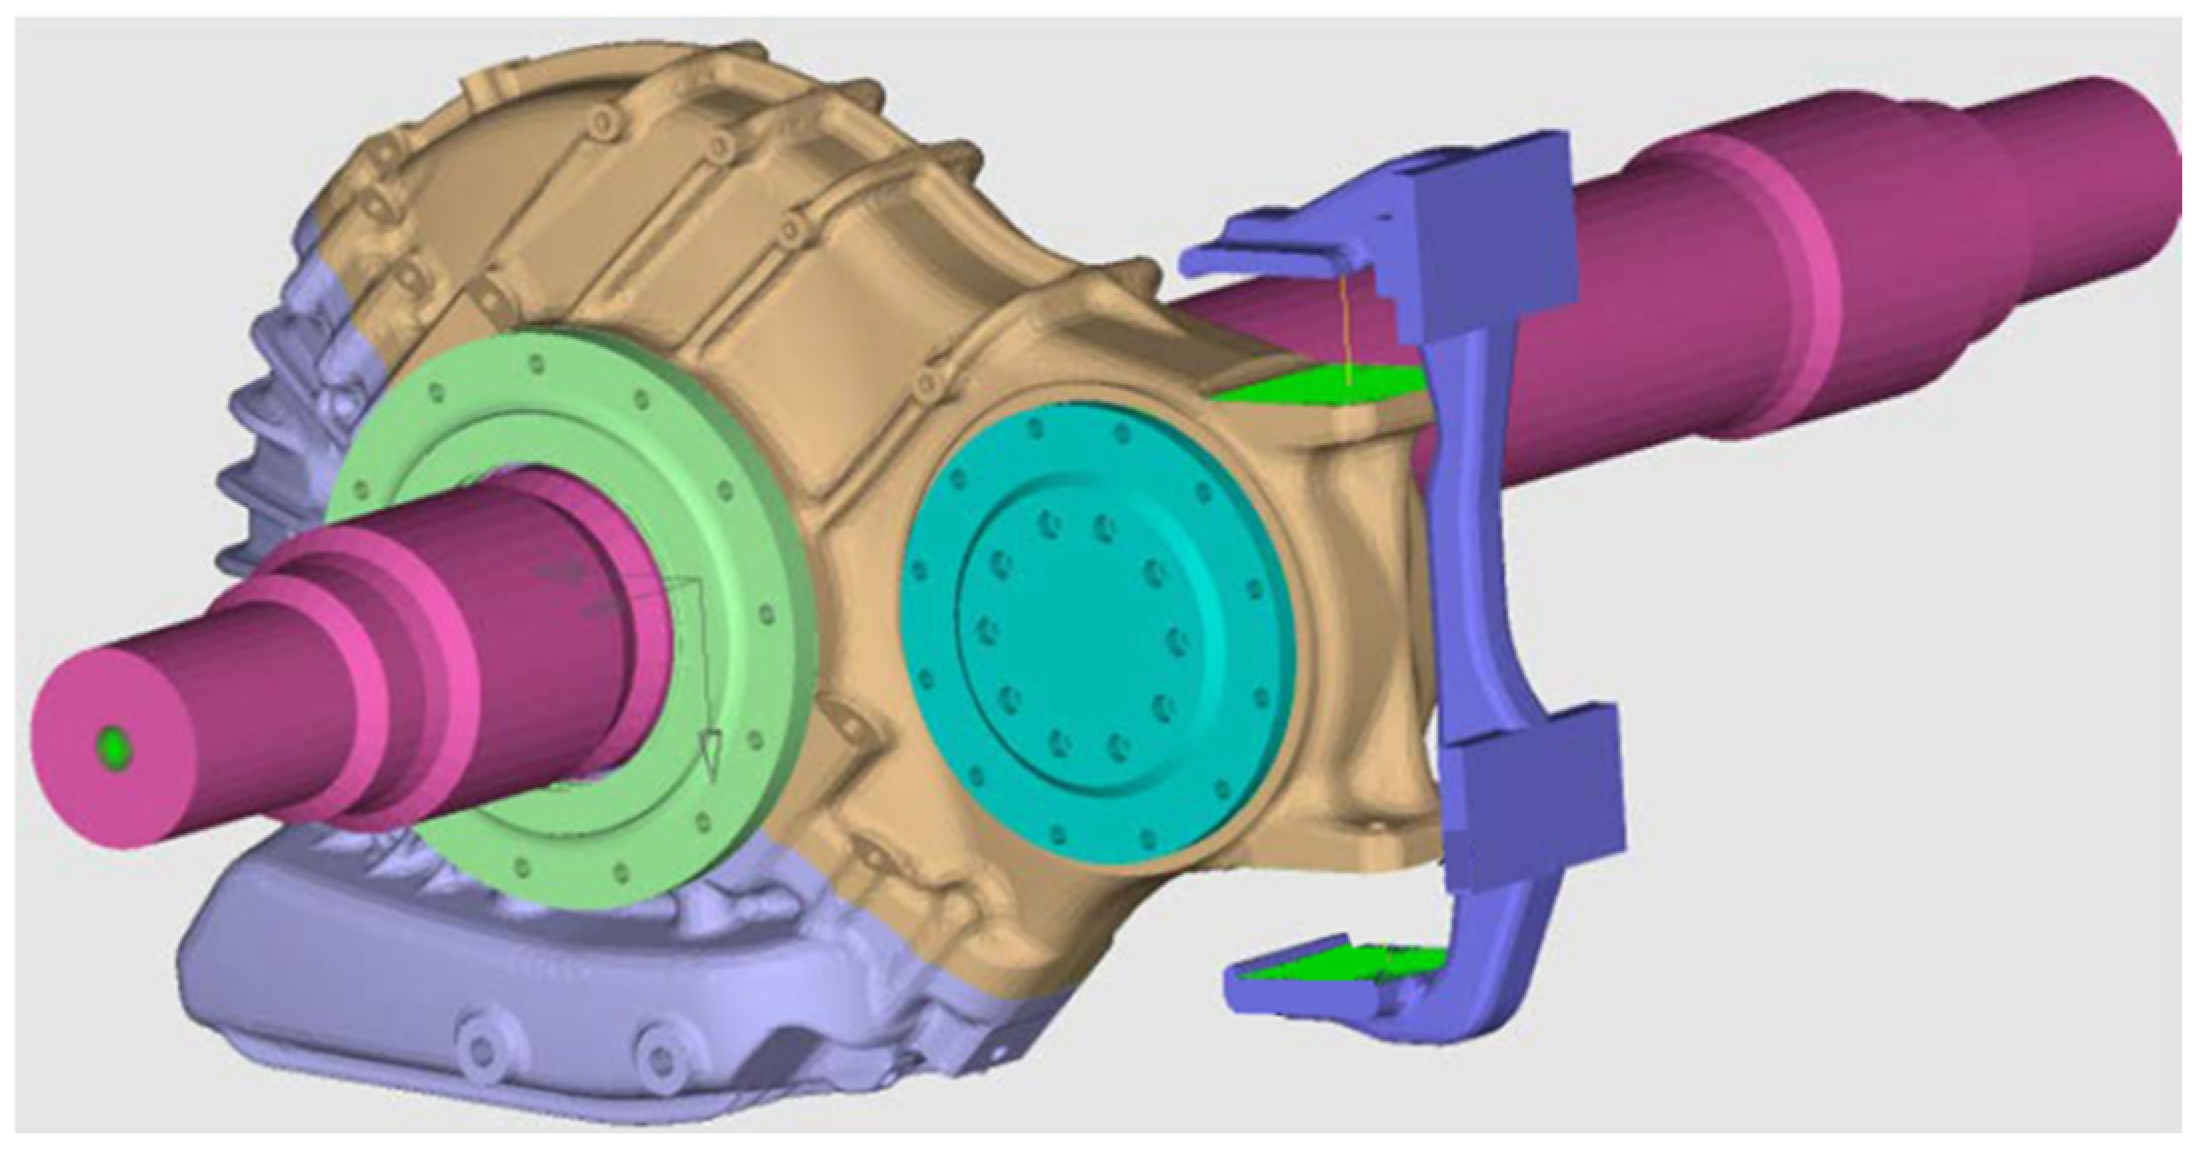
In order to analyze the influence of gear meshing on the vibration response of the gearbox housing under the operating condition of 300 km/h, a finite element model of the gearbox is established, and modal simulation analysis is performed under this working state.
When meshing the model according to the principle of ensuring calculation accuracy and controlling the calculation scale in finite element modeling, selecting the appropriate grid element length, grid shape, and order is necessary to ensure both calculation accuracy and calculation scale. Firstly, the surface of the gearbox structure is divided into two-dimensional grids with a size of 10 mm and the shape of a triangle, so that the gearbox structure becomes a closed body composed of two-dimensional shell grids. Finally, the closed body is filled with three-dimensional tetrahedral grids, and the first-order tetrahedral grids are transformed into second-order tetrahedral grids. The element type is SOLID92. When checking and modifying the quality of the divided 2D mesh, the low-quality mesh should be adjusted without changing the original characteristics of the model, such as merging nodes or deleting meshes with too small an angle or side lengths. The whole gearbox body is divided into 709,898 units and 1,071,217 nodes.
The constraint conditions of the finite element model are as follows: full constraint is applied at the installation position of the C-shaped support, three-dimensional displacement constraint is applied at the end of the axle away from the gearbox, vertical and longitudinal displacement constraints are applied at the end of the axle close to the gearbox, and lateral displacement constraint is applied at the coupling position. The gearbox and C-shaped support are connected by a spring unit, with vertical stiffness of 8200 n/mm and transverse stiffness of 245 n/mm, as shown in
Figure 4.
The results show that there are two inherent modes with relatively close frequencies at approximately 2500 Hz, as shown in
Figure 5.
According to the results of the modal simulation calculation combined with the track test data, the bench test arranges vibration acceleration and strain gauge measuring points in the ten regions shown in
Figure 6, which is a schematic diagram of the gearbox model.
3.3. Results Analysis
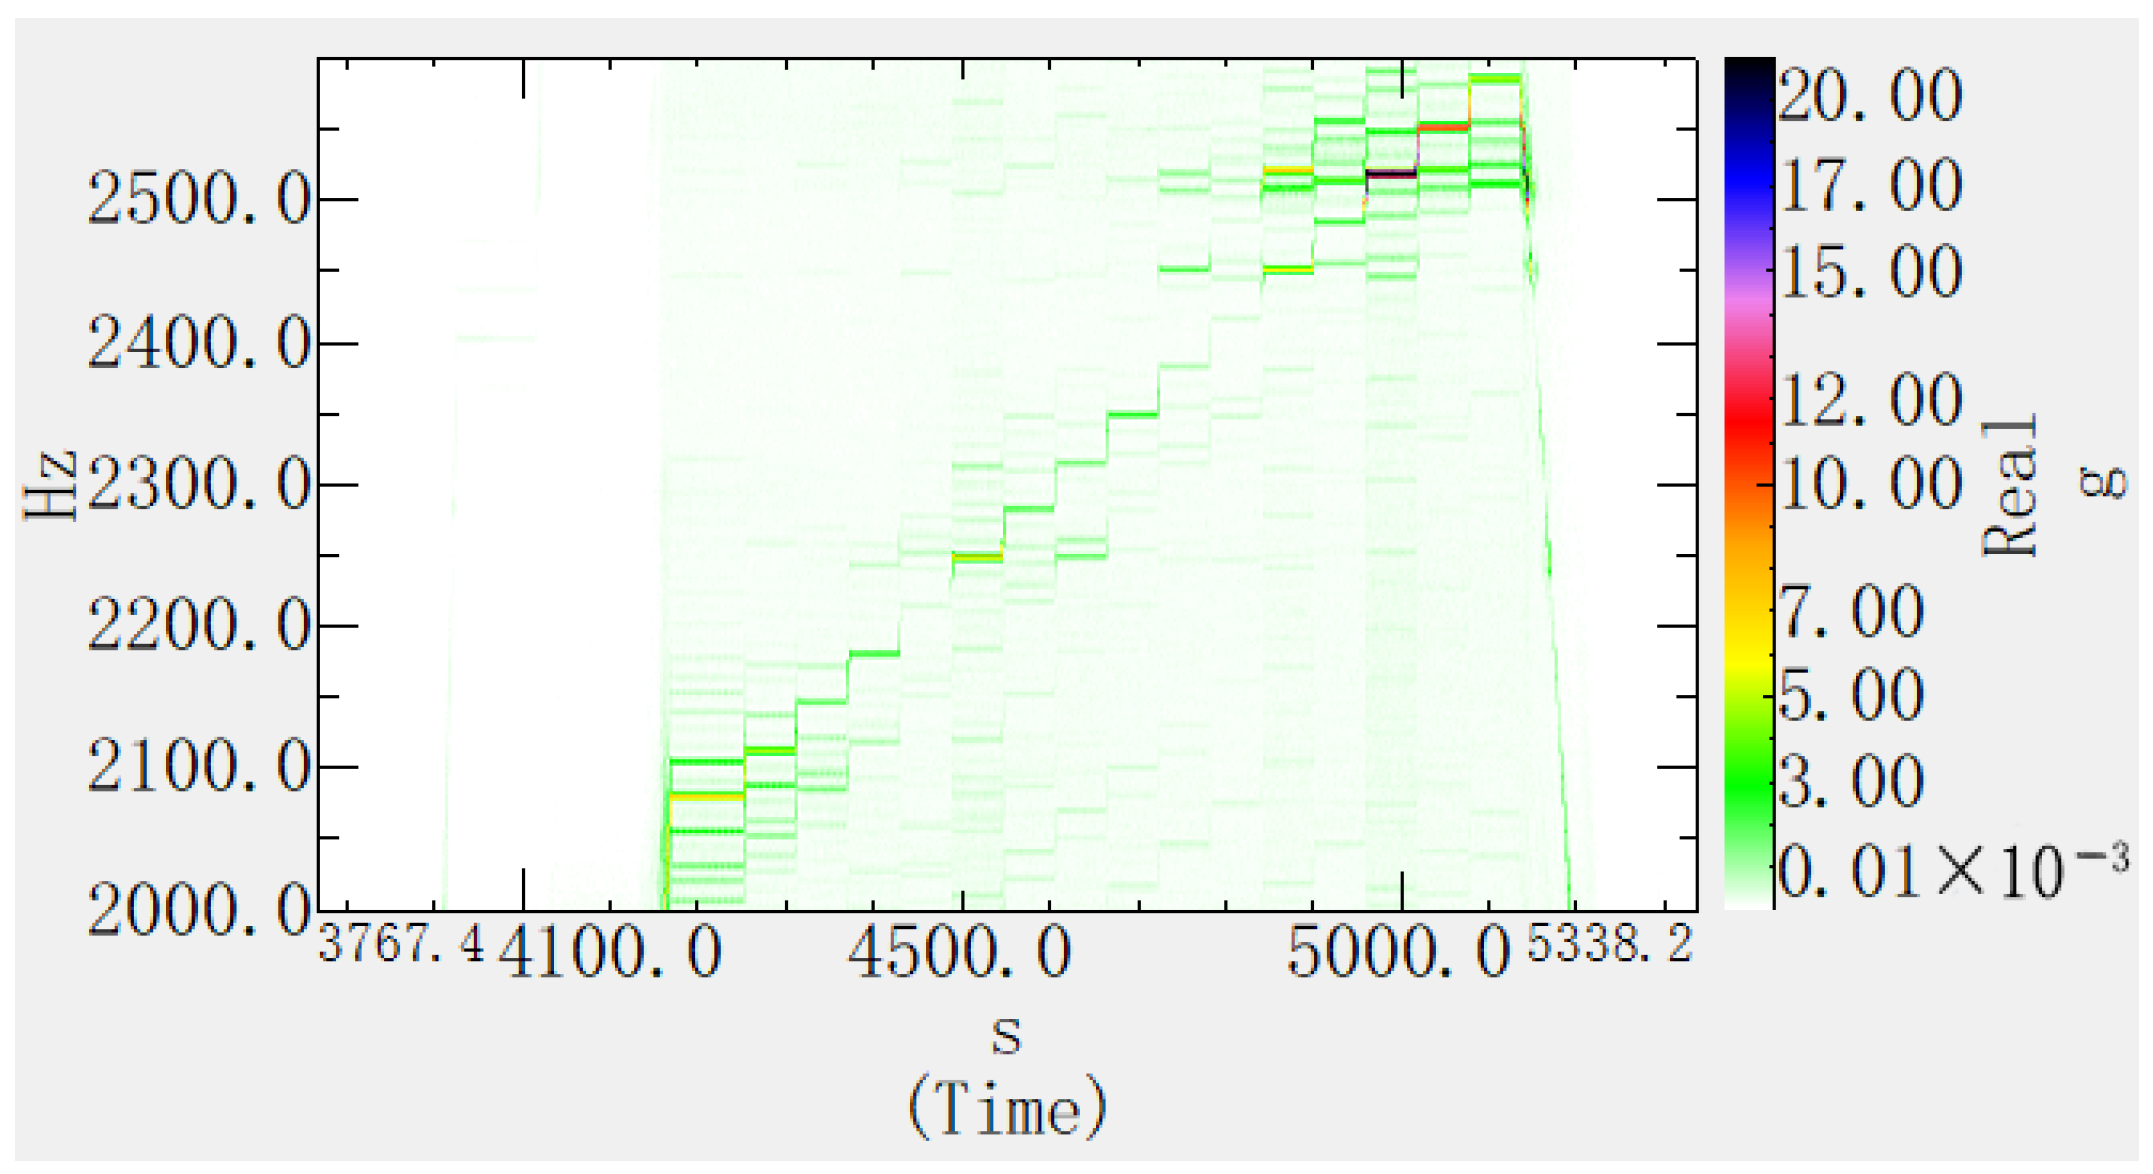
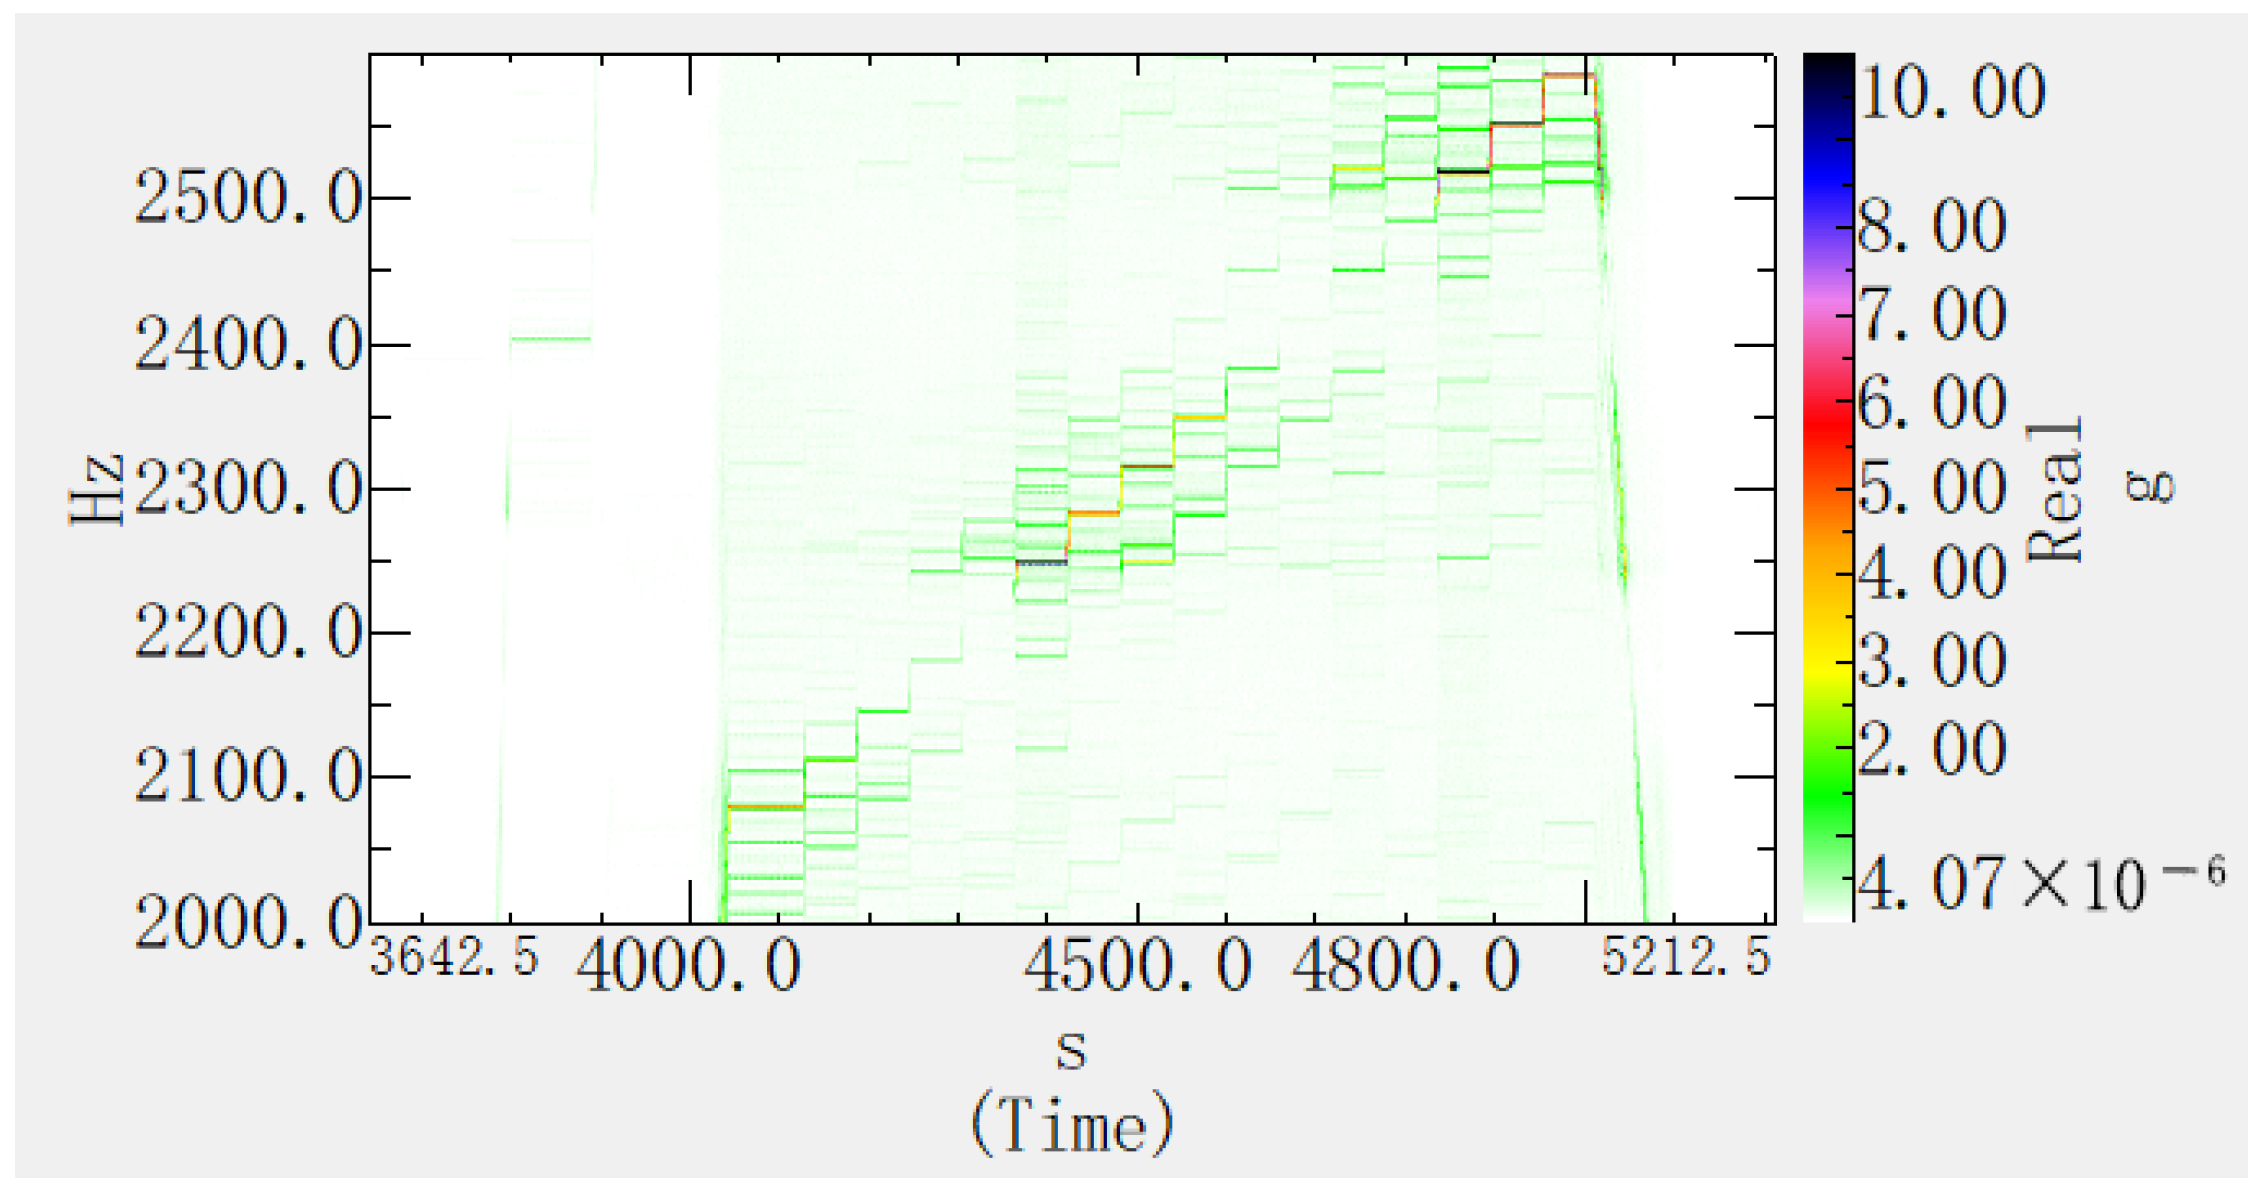
See
Figure 7 and
Figure 8 for the vibration time–frequency diagram results of the No. 3 and No. 7 measuring points.
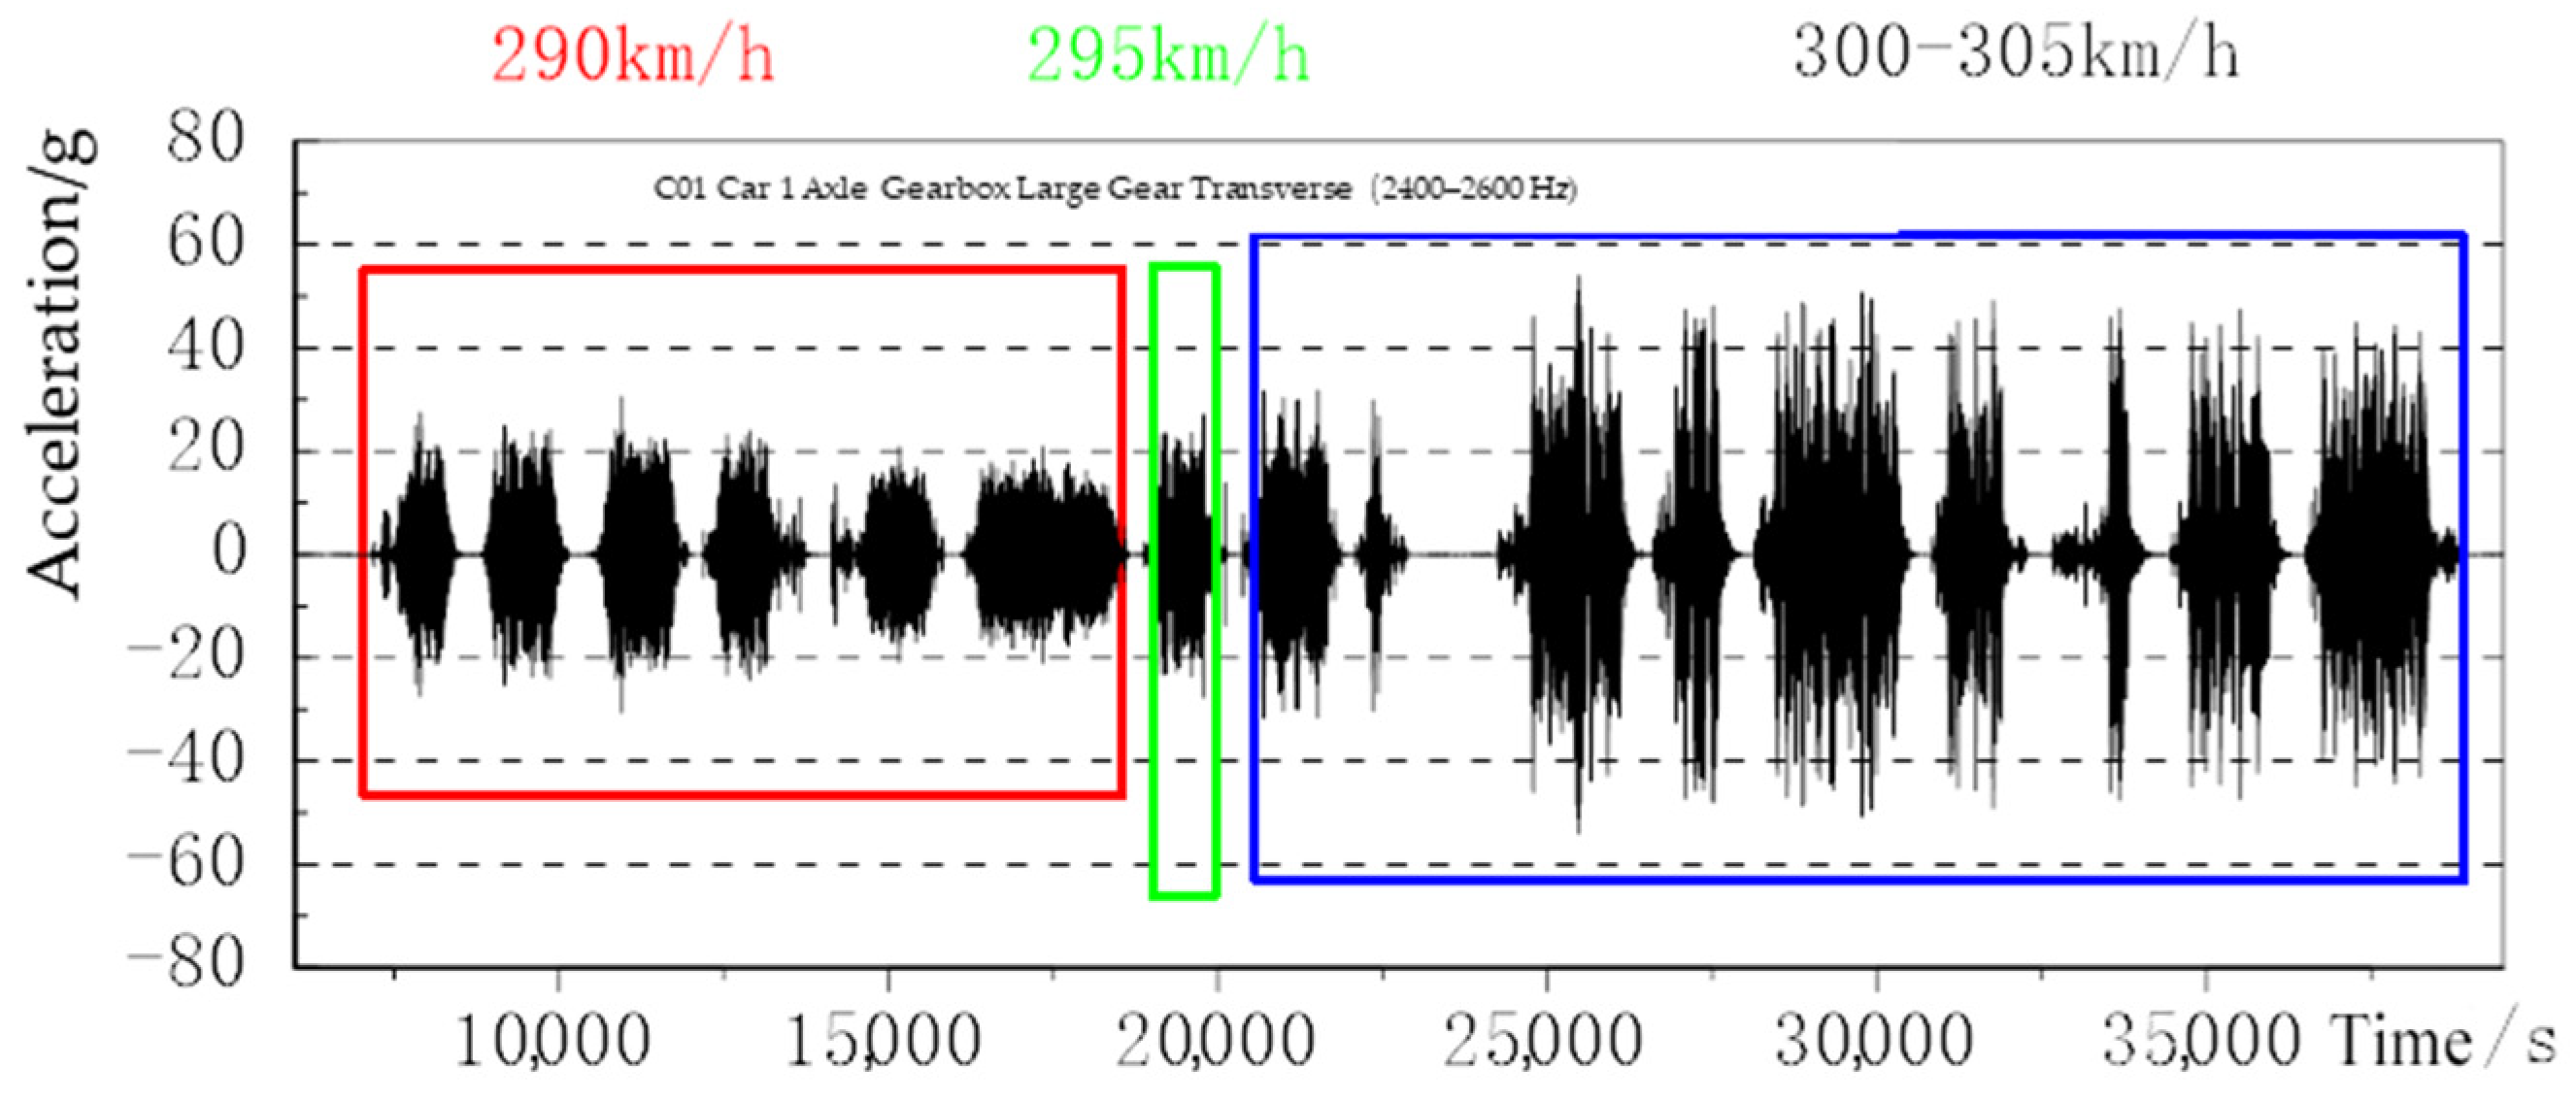
When the gear-meshing frequency is approximately 2500 Hz, measuring points No. 3 and No. 7 of the gearbox exhibit resonance characteristics at a frequency of 2512 Hz, which is similar to the position of maximum deformation calculated by the modal analysis, but there is a difference in frequency. Under the working state of the gearbox, the contact relationship of the gear pair, the flow and lubrication effects of the lubricating oil, etc., may all have an impact on the structural mode, and it is difficult to accurately simulate in the simulation analysis. For the modal analysis of the high-order vibration of the structure, existing simulation technology can obtain relatively accurate mode shape results, but there are certain differences in the frequency results.
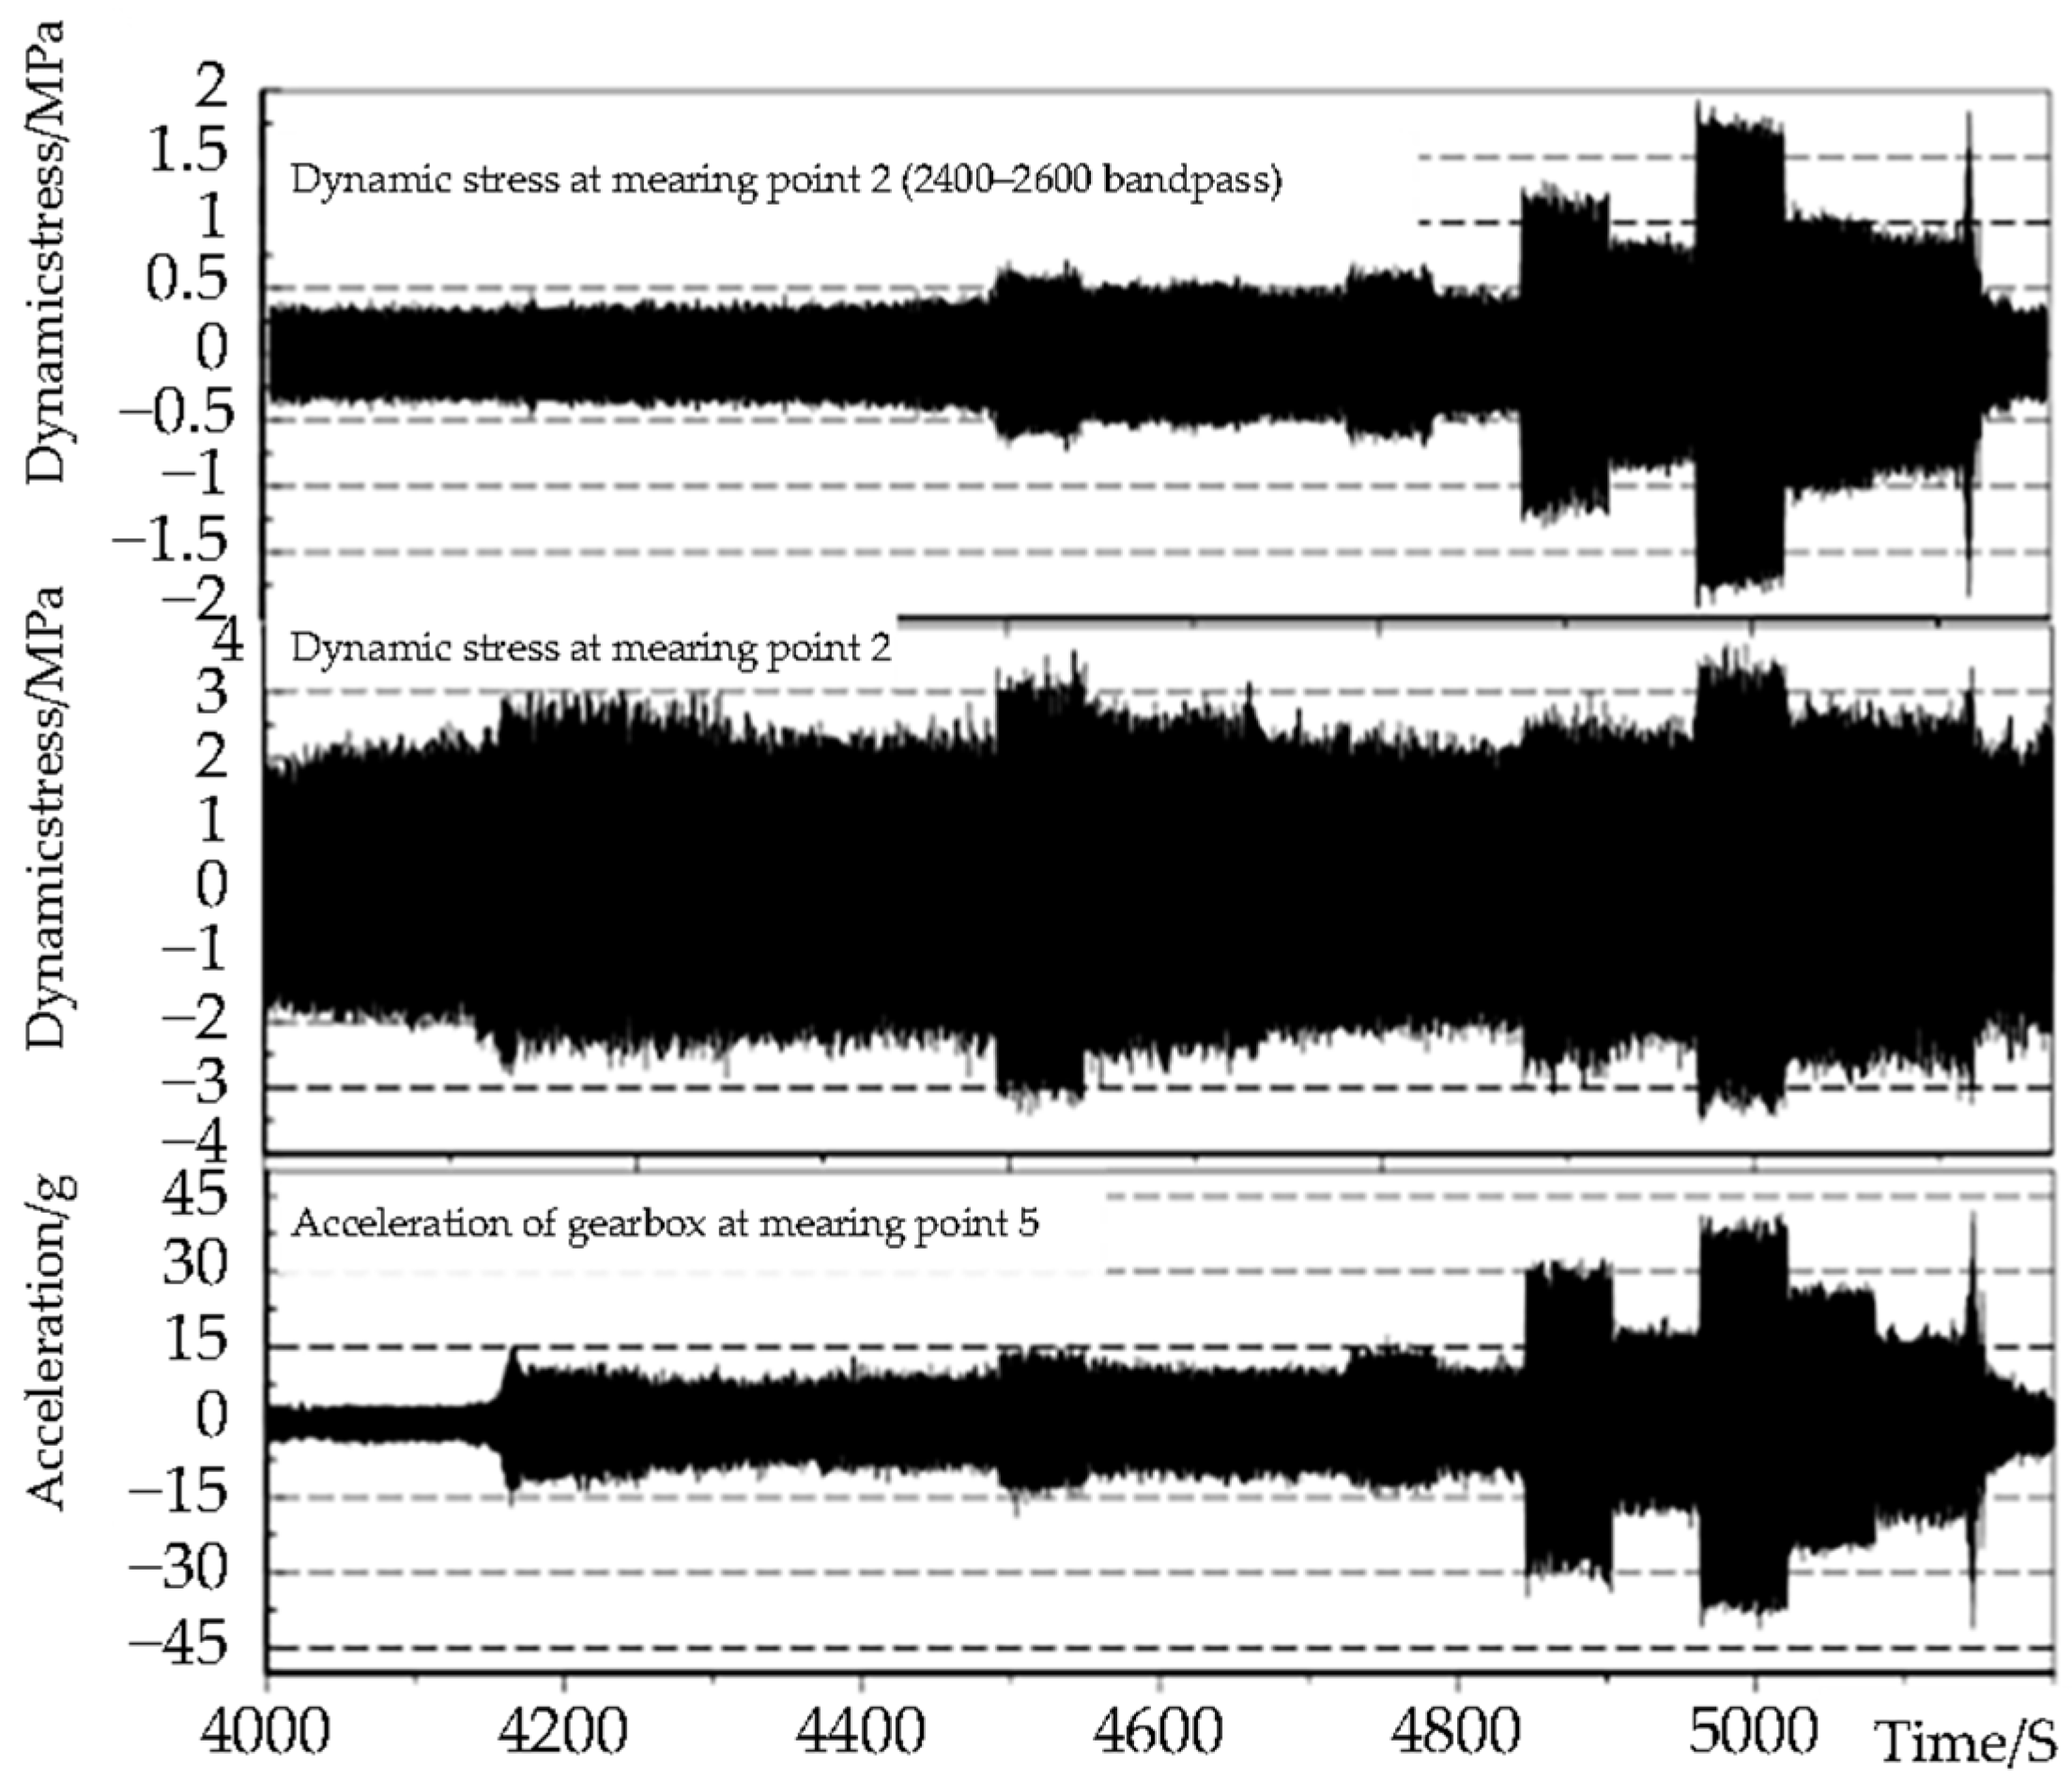
As shown in
Figure 9 and
Figure 10, the stress test results show that the stress result at measuring point No. 2 also exhibits a main frequency of 2512 Hz, and the stress amplitude is approximately 3.5 MPa. After performing a band-pass filtering on the stress test signal within the frequency range of 2400–2600 Hz, the stress amplitude at approximately 2512 Hz is 1.8 MPa.
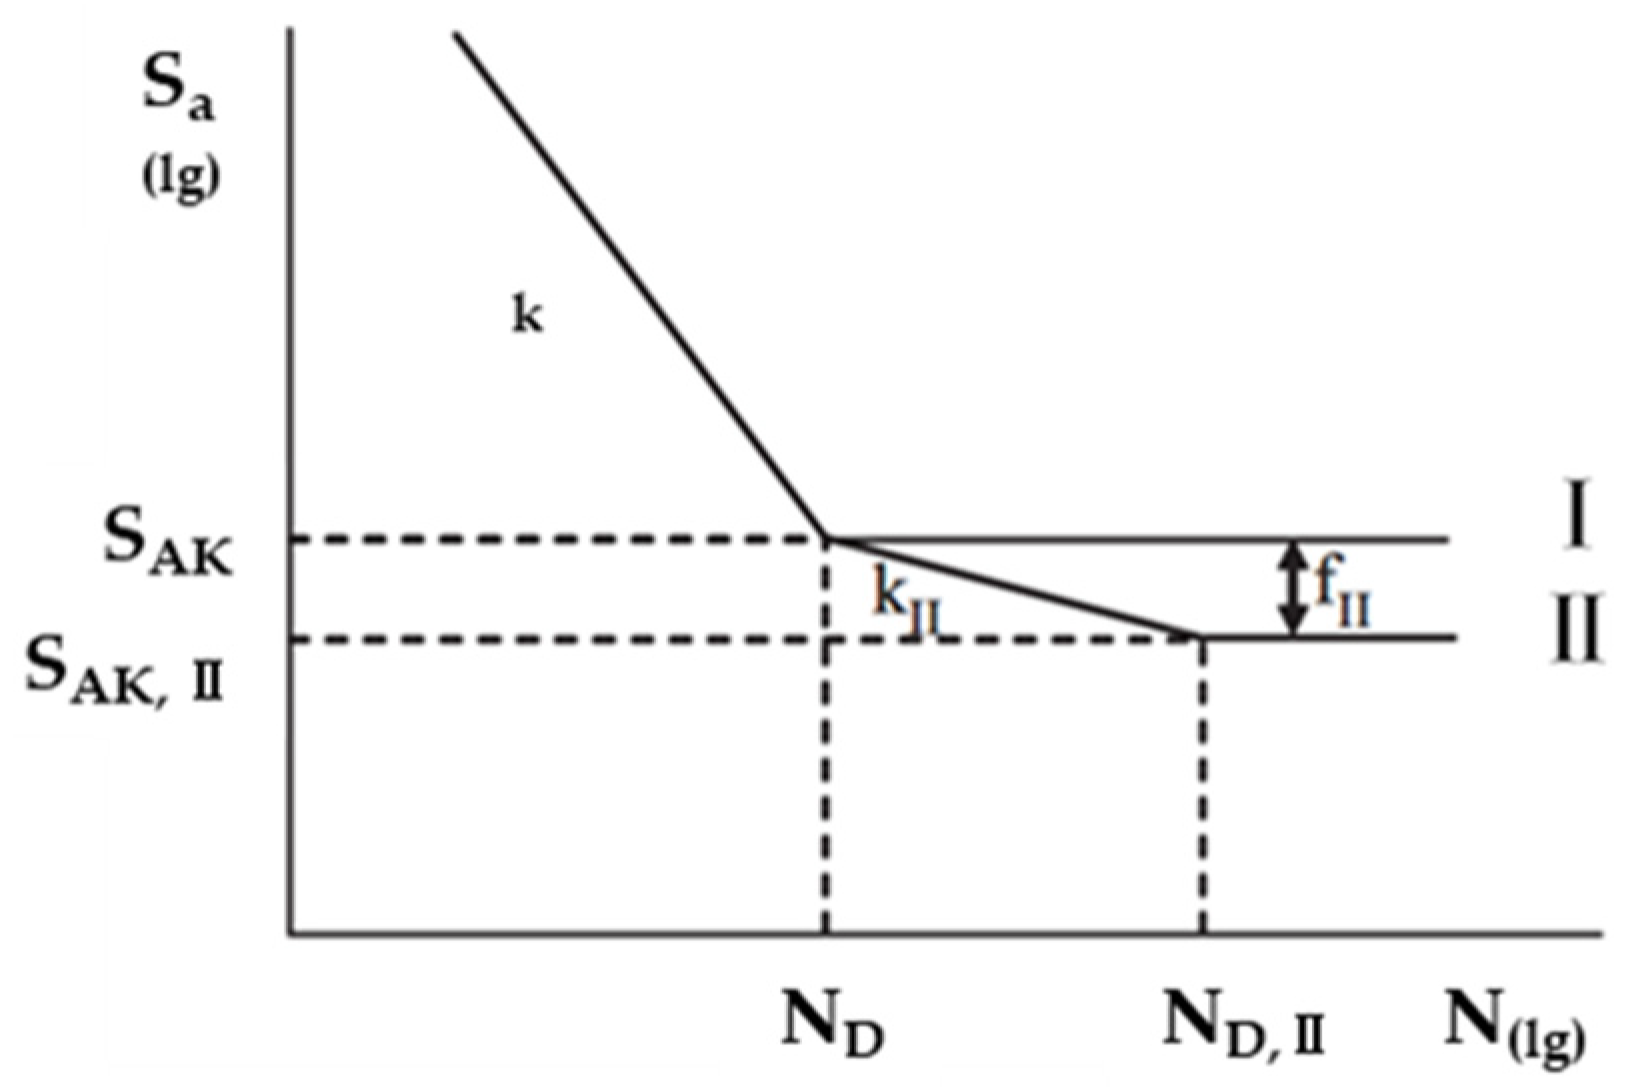
4. Evaluation of the Ultra-High-Cycle Fatigue Performance of the Gearbox
Based on the above analysis, at an operating speed of 300 km/h, the meshing frequency of the gearbox is approximately 2512 Hz. In the existing standards, the stress cycle number corresponding to the fatigue limit is 108, which corresponds to an operating time of 11.1 h. This is far from meeting the requirements of the full life cycle. If the S-N curve continues to decline at 108 cycles instead of being a flat section, there is a possibility of underestimating the fatigue damage of the gearbox.
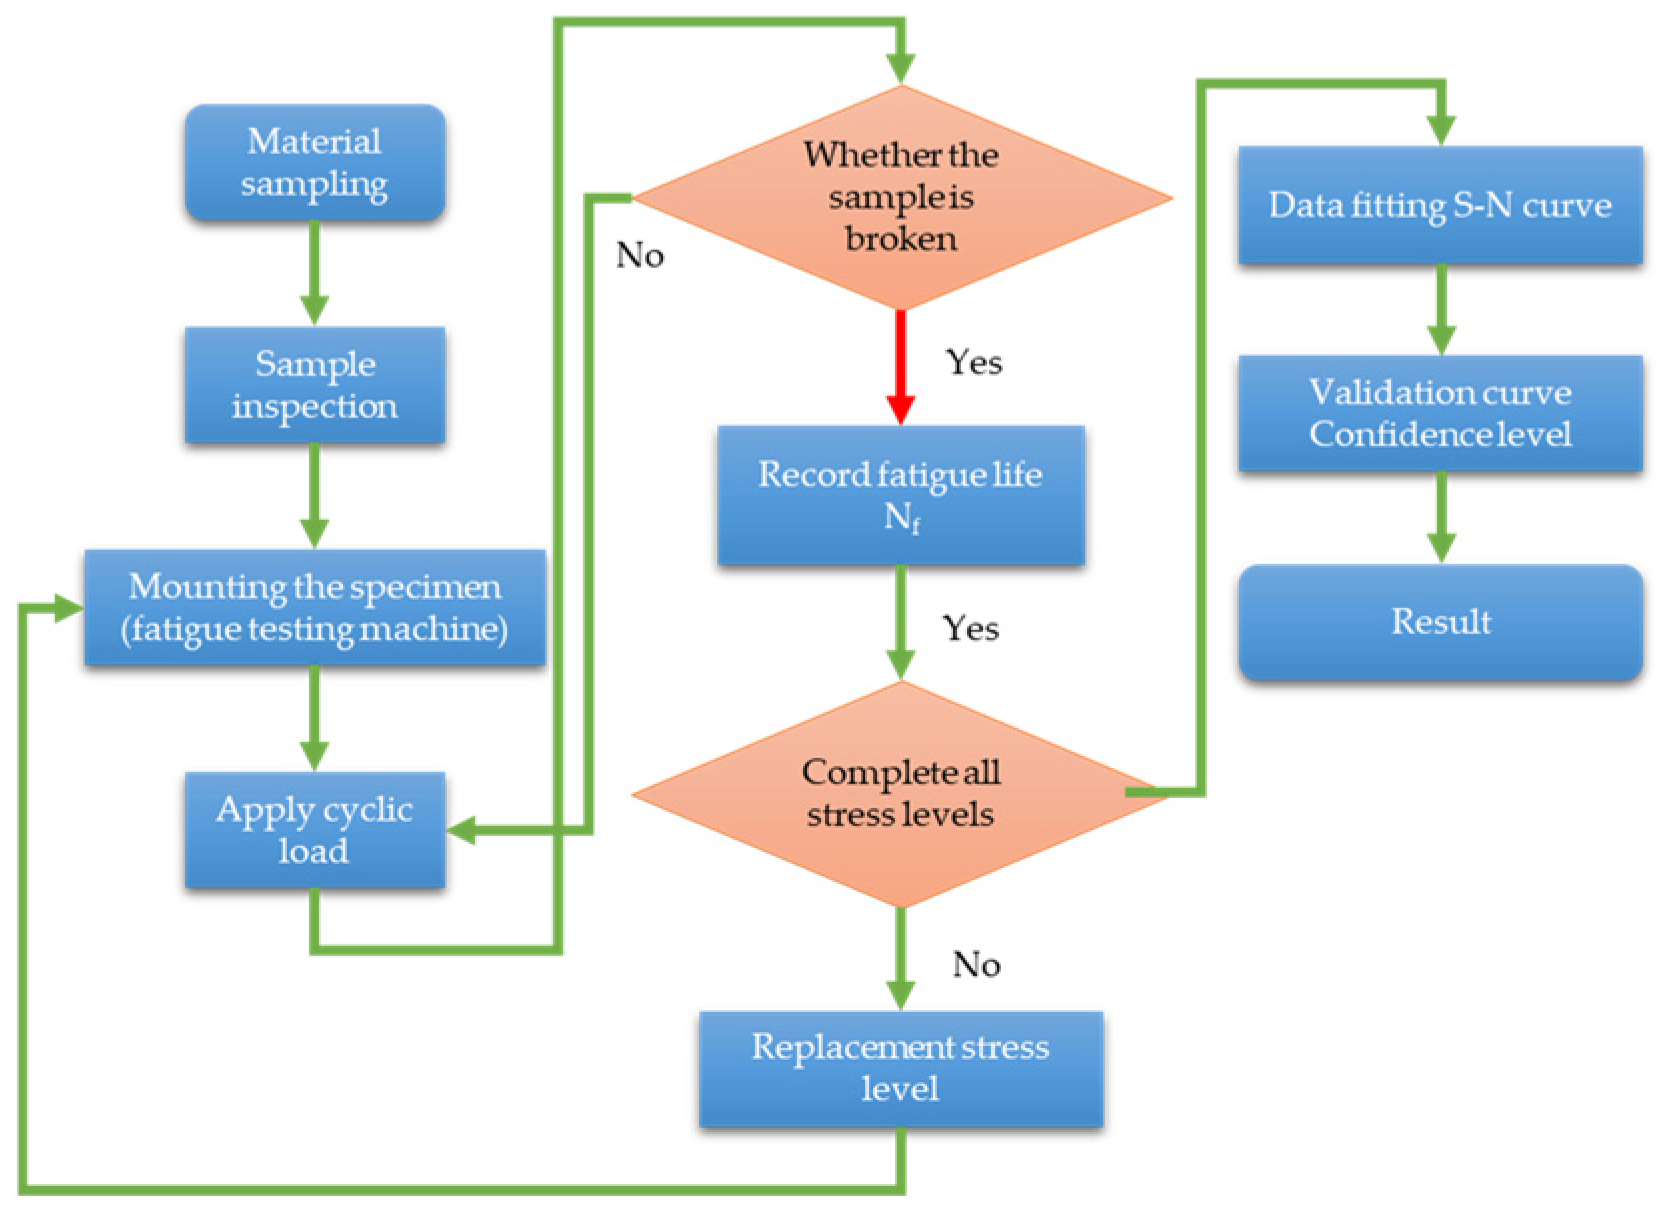
4.1. Test on the Characteristics of the Ultra-High-Cycle Fatigue S-N Curve of the Gearbox
In order to study the characteristics of the S-N curve of the aluminum alloy material (AlSi7Mg0.3) used for the gearbox after 10
8 stress cycles, samples are cut from the real gearbox housing to carry out the test on the characteristics of the ultra-high-cycle fatigue S-N curve. See
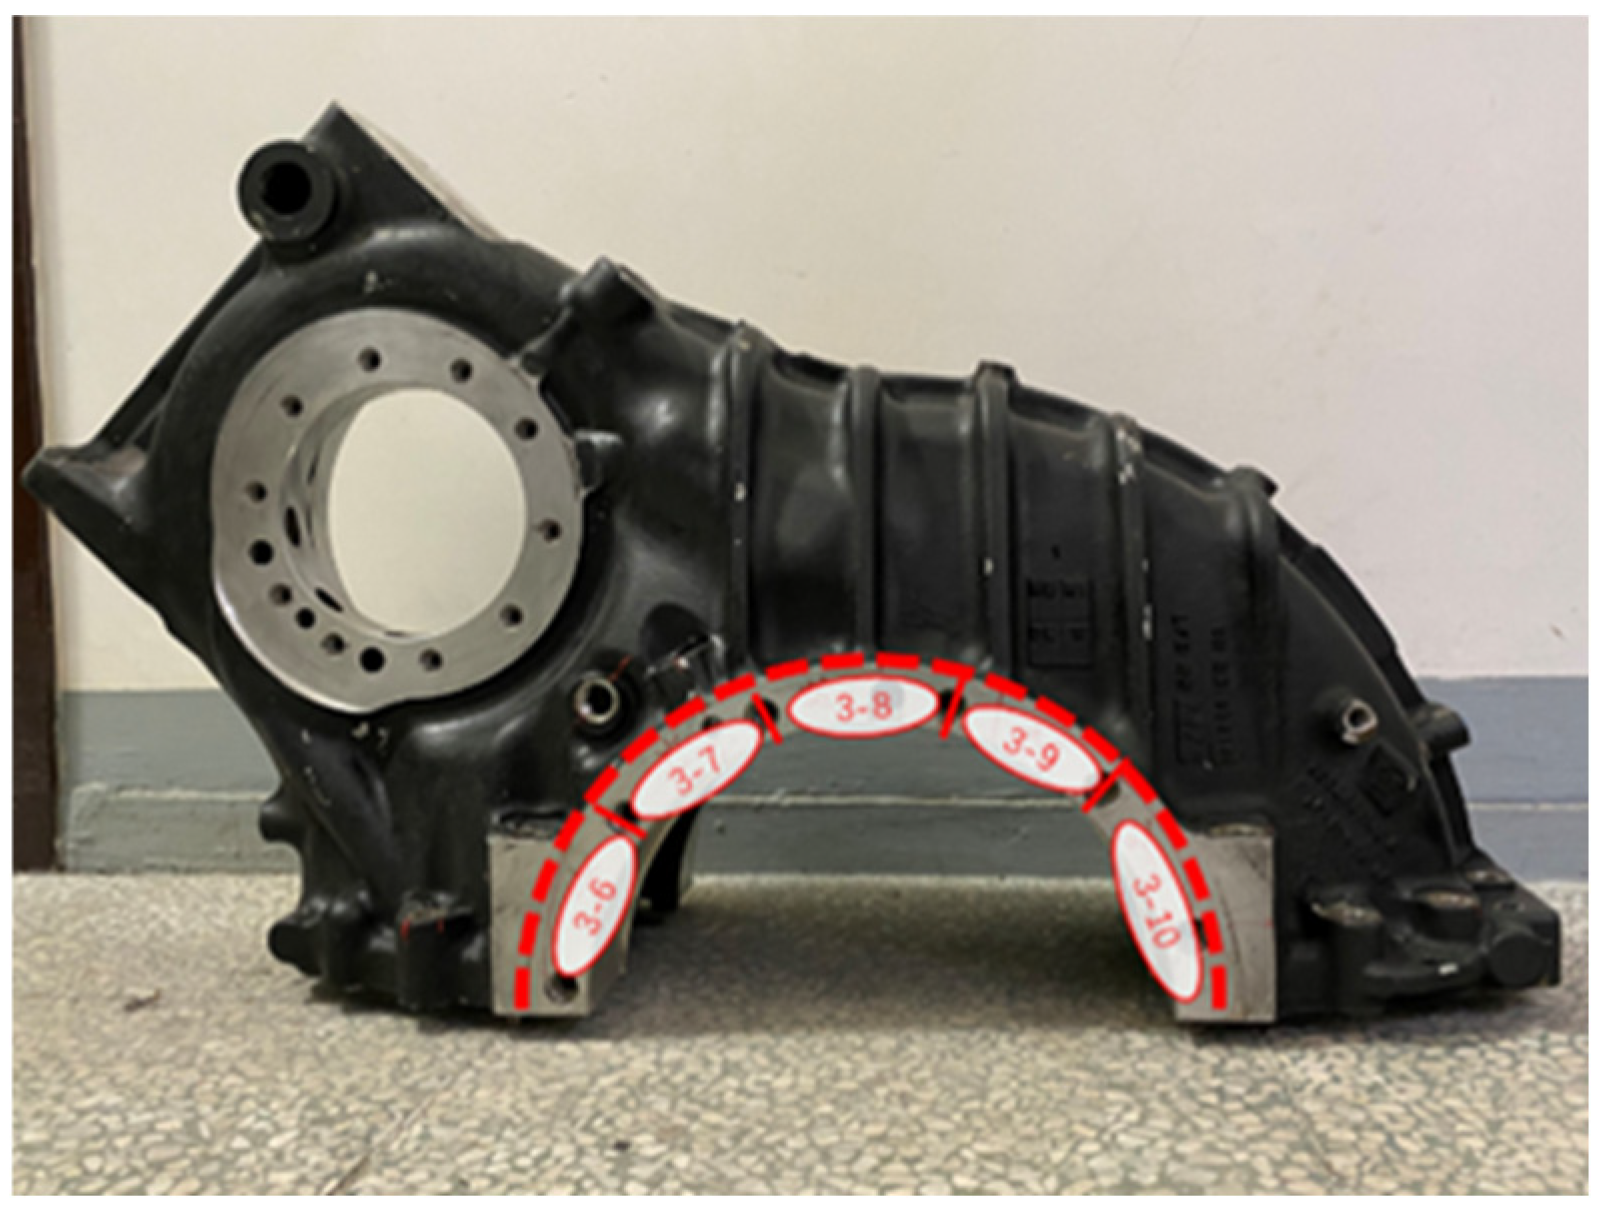
Figure 11 for the test flow chart. Due to the relatively complex structure of the housing, most of the positions are characterized by curved surfaces and thin walls, and there are few positions suitable for concentrated sampling. In order to improve the efficiency of non-destructive testing and detect as many casting defects as possible in the housing material, a method of first cutting small pieces and then performing radiographic examination is adopted. Wire electrical discharge machining is performed on the circled part in
Figure 12 to obtain the blank. After that, according to the GB/T 3075-2021 standard [
30], the specimens for the fatigue performance test shown in
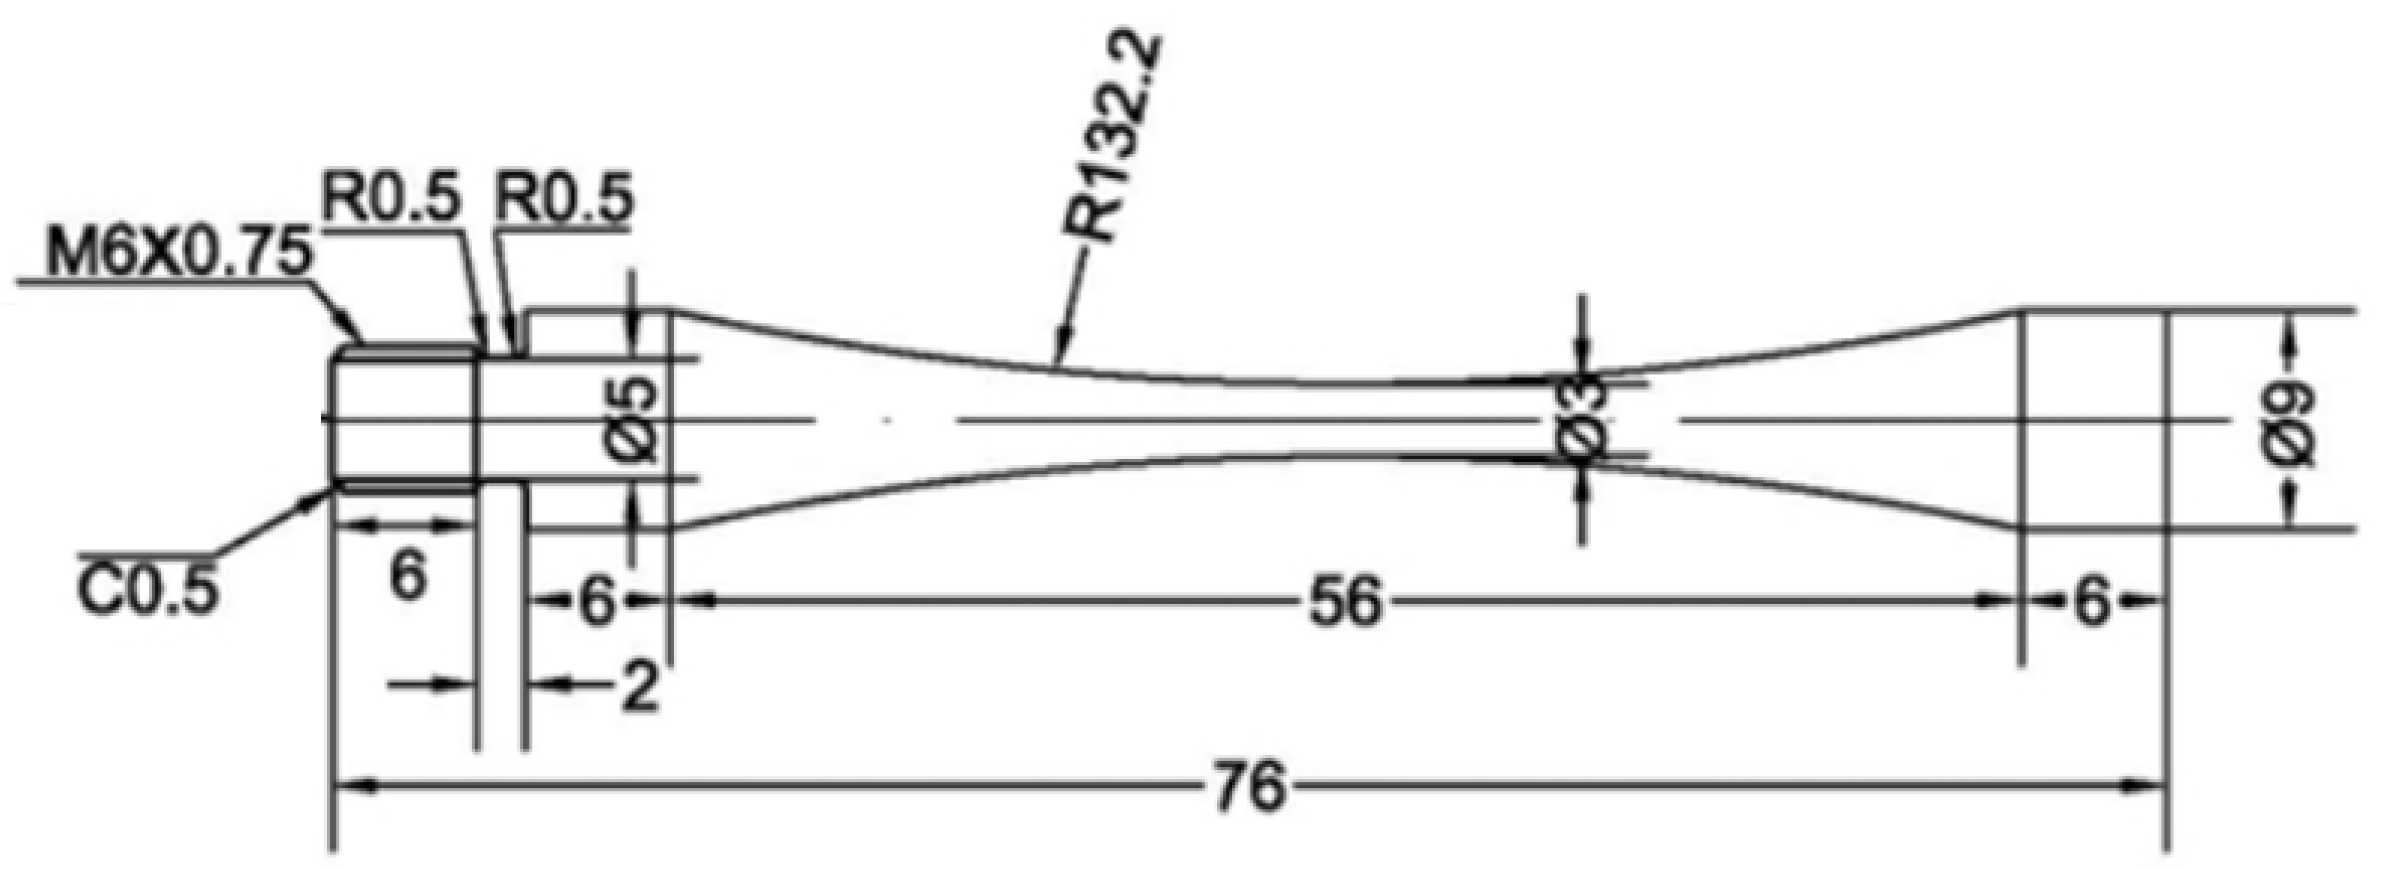
Figure 13 are cut from the blank, which can represent the defect level of the casting box.
Figure 13 shows the ultra-high-cycle fatigue specimen utilizing ultrasonics. The dimensions of the specimen are as shown in the figure. The diameter of the threaded hole is 6 mm, and the pitch is 0.75 mm. Multiple fillets help to remove the burrs on the edge of the part, facilitate assembly, and reduce stress concentration.
According to
Table 1, AlSi7Mg0.3 is mainly composed of Al. In addition, it contains small amounts of Si, Fe, Cu, Mn, and Mg.
The test is conducted using an ultrasonic fatigue testing machine with a test frequency of 20 kHz, which is the highest test frequency of the test equipment. Selecting this frequency can shorten the test time as much as possible. According to the fatigue test specifications, a maximum number of cycles of 8.06 × 10
9 is applied, with a completely reverse symmetric cyclic load having a stress ratio of R = −1, as shown in Equation (1).
—: minimum stress in cyclic loading.
—: maximum stress in cyclic loading.
During the test process, a handheld infrared thermometer is used to measure the temperature of the minimum cross-section of the specimen under 100 MPa. The cross-sectional temperature is 29.4 °C, which indicates that the thermal effect is not obvious.
The fatigue S-N curves of standard test pieces were tested by the group method and the lifting method. The group method is used to test the medium and short life zones, and the lifting method is used to test the fatigue limit. The specific methods of the group method and lifting method are as follows:
For the medium and short life zones, the group method is used for the test. Generally, 3–4 samples are used for an exploratory test to first determine the load level of the group test. After the group test load level is determined, the fatigue life test is conducted at a level 4 stress level, and 4–6 specimens are repeated at each stress level.
For stress selection, the group method test can be conducted according to the stress level corresponding to the typical fatigue life of the S-N curve of similar materials, and the stress interval is evenly distributed as far as possible. In the test, the fatigue load of the next level can be adjusted according to the fatigue life of the previous level.
- (2)
Lifting method
The fatigue strength corresponding to the fatigue limit life is measured by the lifting method, and the number of effective pairs is required to reach three pairs. After the stress level of the last level of the group method test is properly reduced, the first sample of the lifting method test is conducted. The increment of stress level in the lifting method is approximately 5% of the expected fatigue limit value.
When conducting the lifting method test, keep the stress ratio unchanged and raise and lower it by no more than 5% of the test stress. If the specimen fails to reach the cycle base N0 under the action of the i-level maximum stress
Si, it will fail, while it “escapes” under the action of the lower i + 1-level maximum stress
Si+1 (it will not fail when reaching the specified number of cycles). If the difference between the two stresses (
Si Si+1) is the determined stress increment value Δ
S, the average value of
Si and
Si+1 will be taken as the corresponding fatigue strength of the current pair; that is,
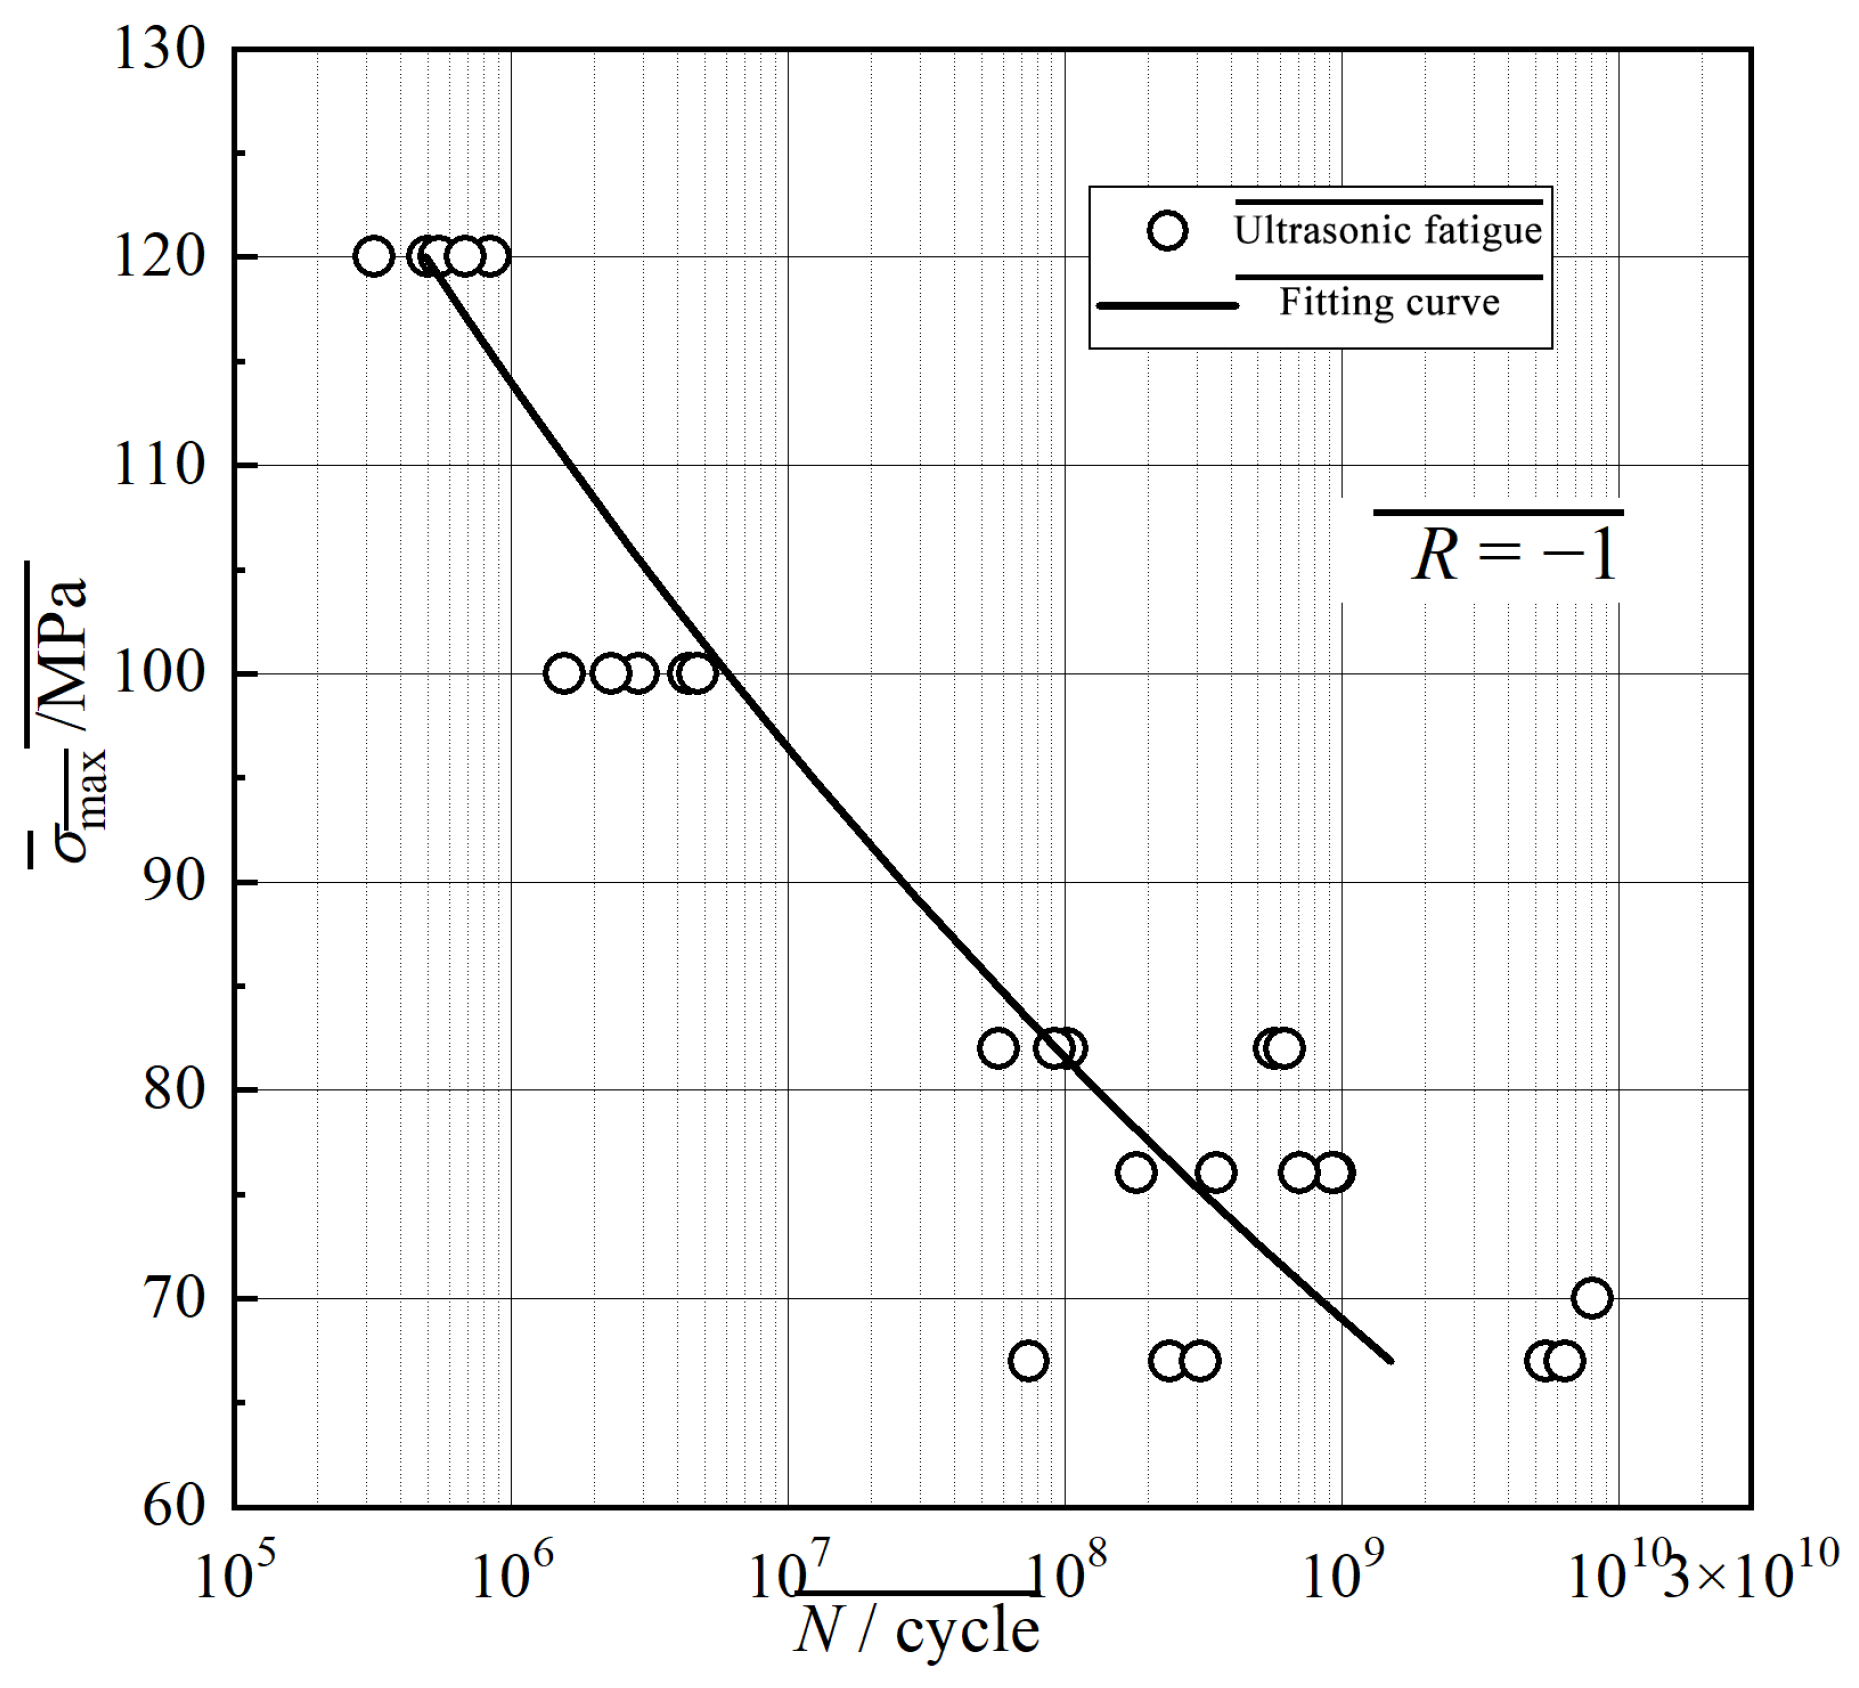
When the above tests are repeated, the paired data will appear randomly, to obtain multiple fatigue strength Sri values corresponding to the same specified life. Then take the average of these fatigue strengths to obtain the fatigue limit value. The number of fatigue samples tested is 45. See
Table 2 for the test data on VHCF performance. The test results are shown in
Figure 14.
It can be seen from the S-N fitting curve that once the number of stress cycles is higher than 108, the curve does not enter the horizontal section but still maintains a downward trend.
4.2. Analysis of the Influence of Gear Meshing on Structural Reliability
Considering that the full-life mileage of a certain type of EMU is 12 million kilometers, the meshing frequency of the gearbox at 2516 Hz results in the number of stress cycles reaching 3.62 × 10¹¹ times within the full-life period, with an amplitude of 1.8 MPa. Based on the experimental data of the characteristics of the ultra-high-cycle fatigue S-N curve, a one-segment S-N curve is fitted. Taking the survival rate as 99.87% and using the extrapolation method, the calculated stress amplitude corresponding to 3.62 × 10¹¹ cycles is 17.4 MPa. According to the FKM standard, taking into account factors such as surface roughness, the hazard level of structural failure, and the maintenance situation, JS is taken as 1.0; the failure hazard level is taken as medium, and regular maintenance is conducted. According to Table 4.5.1 of the FKM specification, the material safety factor JF is taken as 1.25. The casting is then subject to nondestructive testing, and the casting coefficient JG shall be taken as 1.25. According to the calculation and analysis, KT,D is taken as 1.0. To sum up, the total safety factor for fatigue strength jD = 1.5625 is obtained. Then, under the condition of gear meshing, the utilization rate of the housing material is 0.16.


