Abstract
This research presents a novel Computer-Aided Diagnosis (CAD) system called BREAST-CAD, developed to support clinicians in breast cancer detection. Our approach follows a three-phase methodology: Initially, a comprehensive literature review between 2000 and 2024 informed the choice of a suitable dataset and the selection of Naive Bayes (NB), K-Nearest Neighbors (KNN), Support Vector Machines (SVM), and Decision Trees (DT) Machine Learning (ML) algorithms. Subsequently, the dataset was preprocessed and the four ML models were trained and validated, with the DT model achieving superior accuracy. We developed a novel, integrated client–server architecture for real-time diagnostic support, an aspect often underexplored in the current CAD literature. In the final phase, the DT model was embedded within a user-friendly client application, empowering clinicians to input patient diagnostic data directly and receive immediate, AI-driven predictions of cancer probability, with results securely transmitted and managed by a dedicated server, facilitating remote access and centralized data storage and ensuring data integrity.
1. Introduction
Fine Needle Aspiration (FNA) is a diagnostic approach commonly used for the cytological evaluation of breast lesions. Usually, FNA is carried out by extracting part of the infected breast using a fine needle, followed by analysis to determine the presence of malignant cells. Among its primary advantages are its simplicity, low risk, quick turnaround time, and suitability for outpatient settings. However, limitations include operator dependency, potential sampling errors, and lower sensitivity compared to core biopsy in certain cases, especially in non-palpable or cystic lesions. Recent developments have focused on enhancing FNA accuracy and clinical utility by integrating IoT technologies and ML algorithms into diagnostic workflows [1]. This integration allows digitized cytological slides and real-time procedural data to be transmitted via IoT-enabled microscopes or mobile devices to cloud-based ML models trained to classify benign and malignant samples, thus supporting remote analysis and automated decision-making.
The Wisconsin Diagnostic Breast Cancer (WDBC) is a publicly available dataset, and it serves as a significant enabler for these models. It contains digitized features derived from FNA tests of breast masses. The dataset encompasses 569 samples, with each sample defined by 30 numerical features related to cell nucleus properties, and each sample labeled to indicate whether the mass is benign or malignant. Its standardized format and balance of diagnostic classes make it highly suitable for training and benchmarking ML models [2]. These advancements highlight the potential of combining IoT and ML with traditional diagnostic techniques like FNA to deliver scalable, accurate, and accessible breast cancer diagnostic systems.
Despite the growing interest in leveraging ML and IoT technologies for medical diagnostics, their integrated application with FNA for breast cancer screening remains significantly underexplored. A critical review of the current literature indicates a clear research gap: while ML and IoT have individually demonstrated potential in improving diagnostic accuracy and accessibility, few studies have effectively combined these technologies within FNA-based diagnostic workflows to exploit their full synergistic benefits. In response to this identified gap, this study introduces BREAST-CAD, an IoT-enabled CAD system specifically engineered to detect breast cancer via FNA analysis [3].
The proposed system employs IoT-based data acquisition and ML-powered classification to support clinicians in informed and prompt decision-making. The development of this type of system demands careful consideration of several crucial components: the diagnostic procedure (FNA), the choice and preprocessing of high-quality breast cancer datasets, and the application of robust and interpretable classification algorithms [4]. This research advances the field by designing a modular, adaptable diagnostic model that integrates real-time IoT connectivity with ML analytics, effectively bridging the divide between clinical application and intelligent automation. The study aims to construct a comprehensive diagnostic prototype, BREAST-CAD, that not only facilitates remote screening and risk prediction but also improves diagnostic precision and operational efficiency in breast cancer care.
This research is guided by the following specific objectives:
- Comprehensive Literature Review: A systematic review of academic publications from 2000 to 2024 will be conducted to identify benchmark FNA-based breast cancer datasets and ML classification techniques.
- Dataset Selection: An appropriate breast cancer dataset will be identified. To ensure data quality, normalization, and suitability for ML analysis, the dataset will undergo a rigorous preprocessing phase.
- Development and Evaluation of ML Models: Four separate ML classification models including SVM, KNN, DT, and NB will be trained and their performance evaluated.
- Client–Server System Integration: The optimal ML model will be deployed within a client–server framework. The chosen model will be integrated into a client framework for real-time classification, connected with a centralized server for data management and sharing within healthcare authority.
2. Methodology
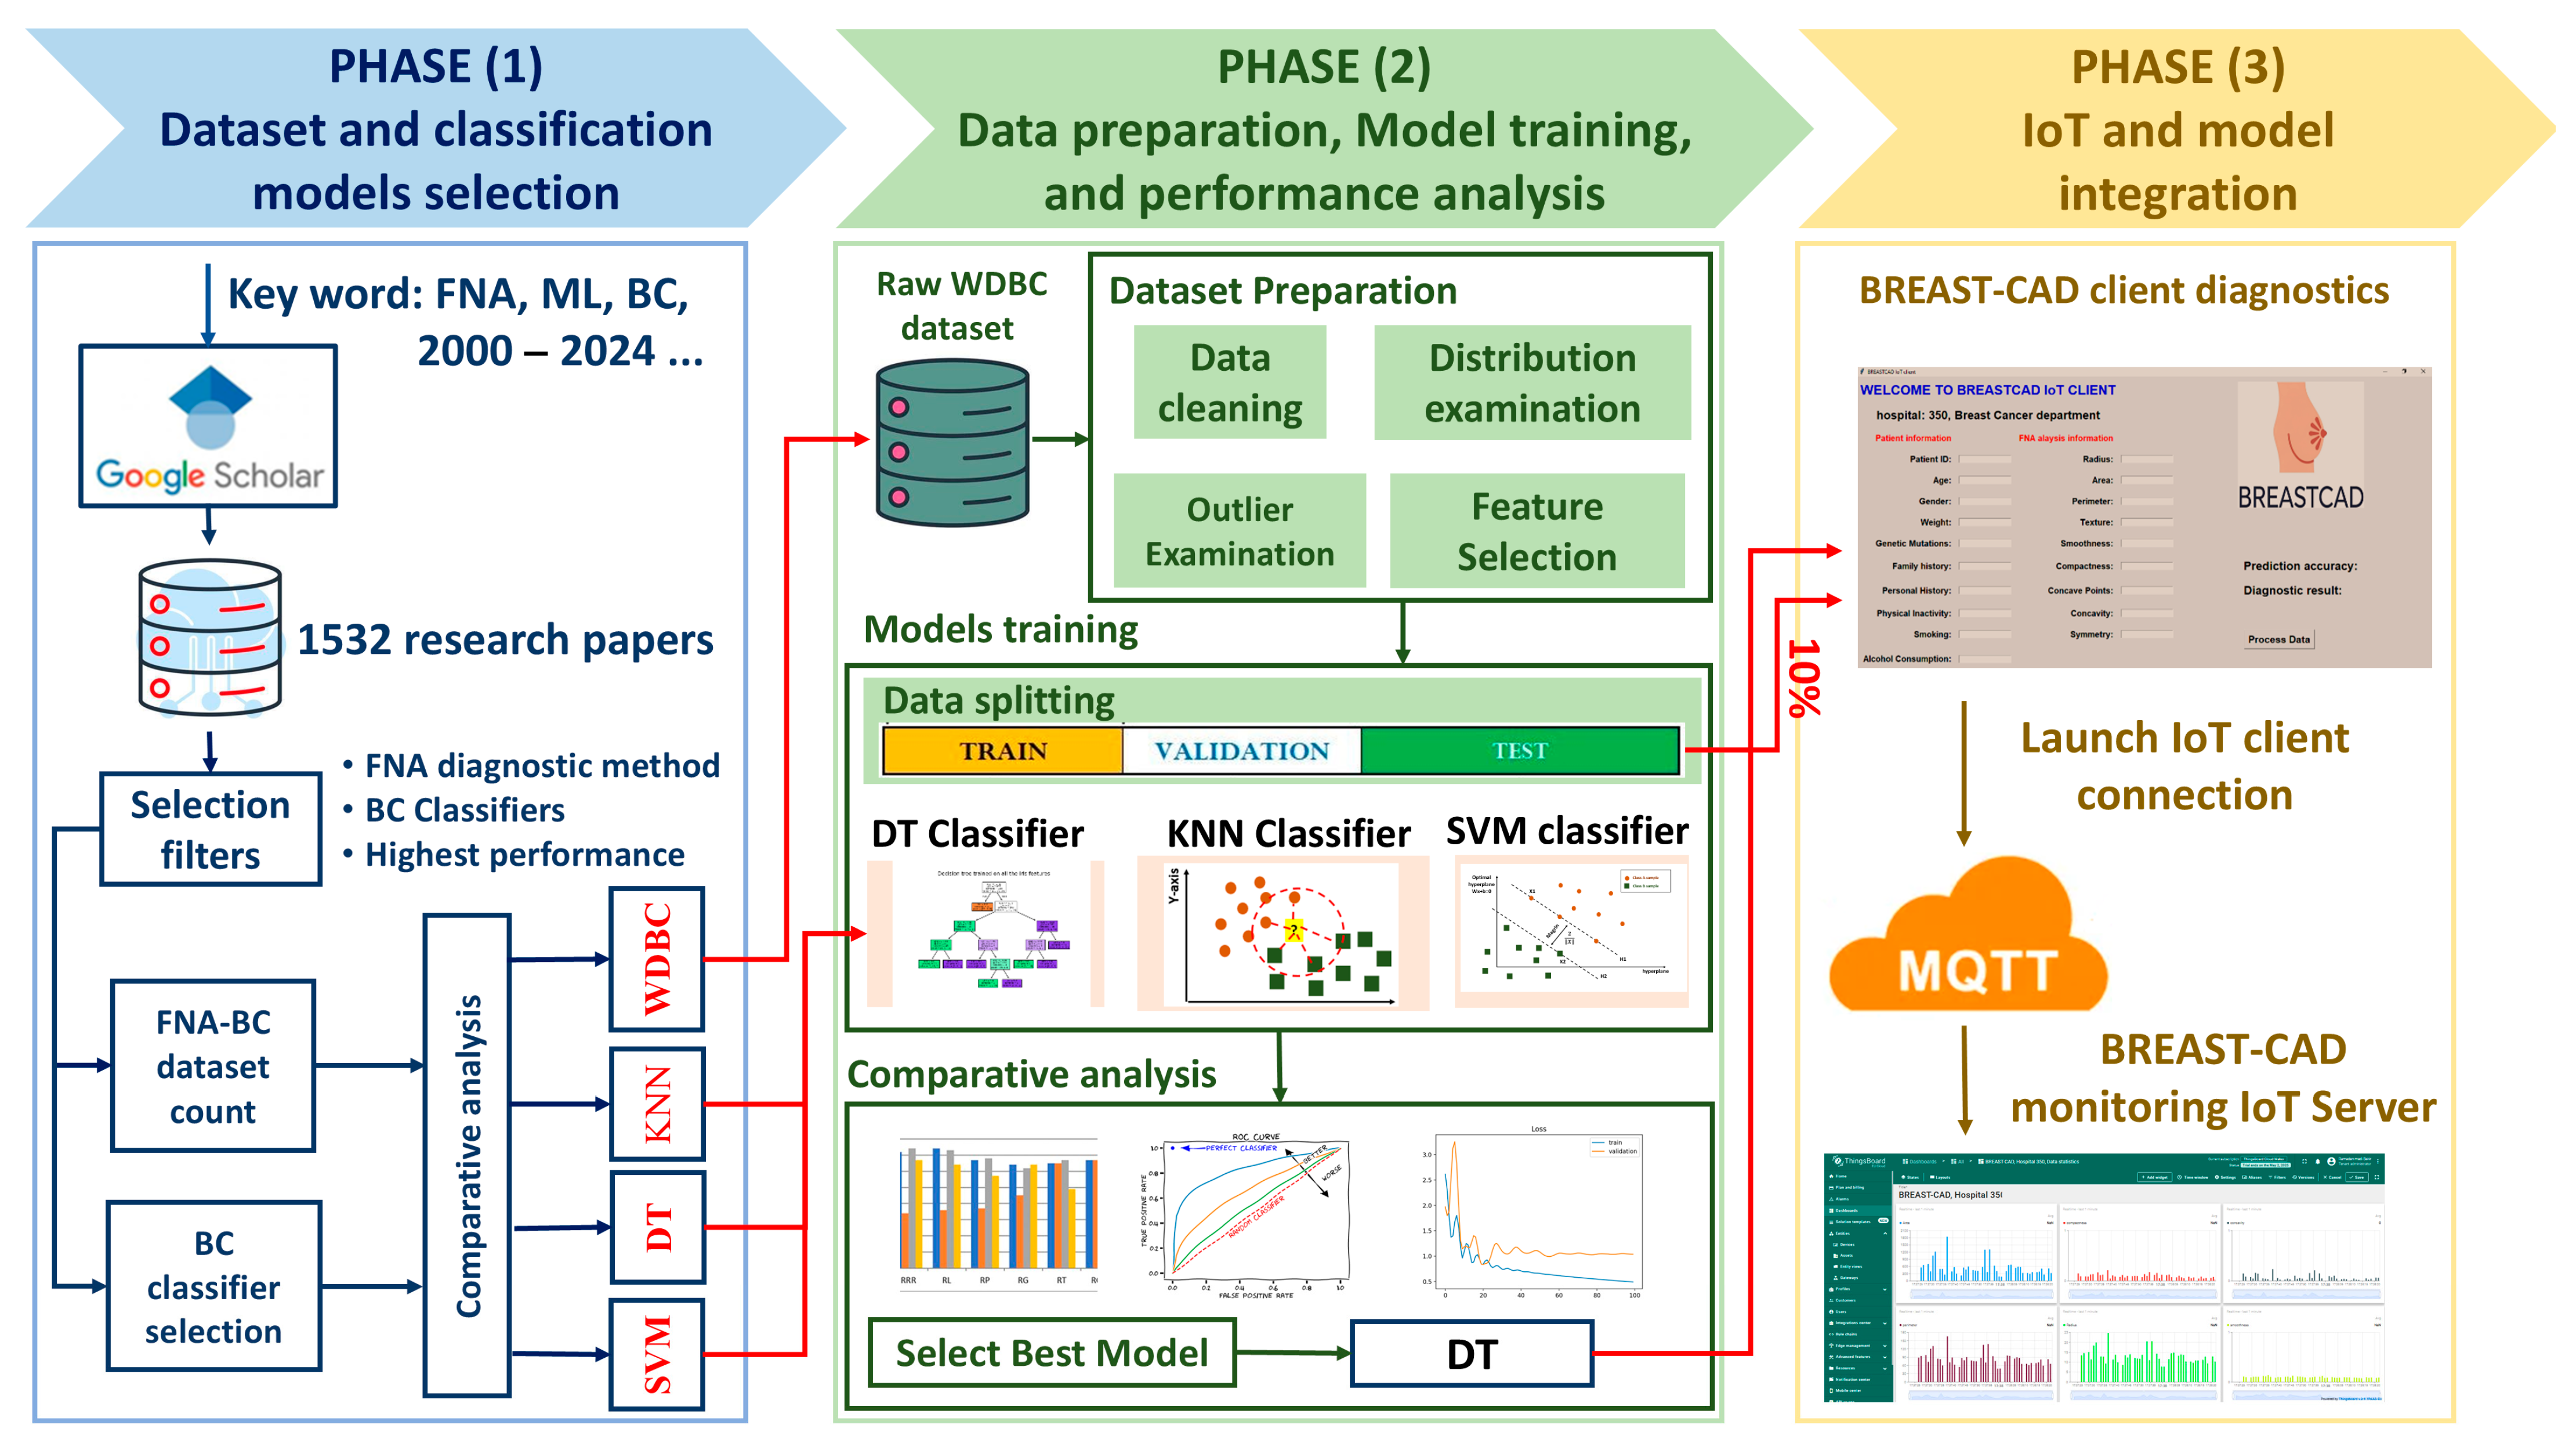
This study introduces a structured, three-phase methodology to design, develop, and evaluate the BREAST-CAD system that integrates FNA cytological data, ML classification techniques, and IoT infrastructure for real-time breast cancer diagnosis. The methodology and the workflow diagram illustrated in Figure 1 consist of the following key phases:
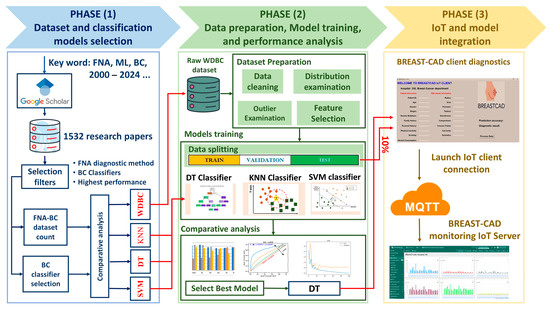
Figure 1.
This figure illustrates the three stages of our research methodology: (1) the selection of the dataset and classifiers based on a literature review, (2) data preprocessing and the evaluation of ML models, and (3) the integration of IoT for real-time diagnosis using the BREAST-CAD system.
- A.
- Phase 1: Dataset and Model Selection
The first phase focused on identifying a suitable breast cancer dataset and selecting high-performing ML classifiers. A systematic literature review used Google Scholar as the primary search engine. Boolean logic was applied with search terms including “Fine Needle Aspiration”, “Breast Cancer Dataset”, “Machine Learning”, and “2000–2024”. This process initially retrieved “1532” peer-reviewed publications, which were screened through a multi-stage filtering process based on relevance to classification models, diagnostic context, and methodological rigor. Our inclusion criteria were met by 34 studies, providing valuable perspectives on frequently employed datasets and high-performing ML in FNA-based breast cancer diagnosis. This carefully selected body of work revealed the WDBC dataset as the most prevalent and clinically significant resource, owing to its comprehensive features, actual FNA cytological measurements, and standardized format. The four top ML models chosen for implementation—SVM, DT, KNN, and NB—were selected due to their common use and consistently strong classification performance in medical diagnostics.
- B.
- Phase 2: Data Preparation, Model Training, and Evaluation
Phase 2 focused on establishing the predictive core of the BREAST-CAD system. The WDBC dataset was selected for model development. The WDBC dataset includes 569 instances, each characterized by 30 FNA features. A comprehensive preprocessing pipeline was implemented. Data quality and feature consistency were addressed through a series of steps: data cleaning to handle missing values, identification of outliers, and analysis of the distribution of each feature. Feature selection was performed using correlation-based filtering to retain features most strongly associated with malignancy while reducing multicollinearity, thereby improving model interpretability and preventing overfitting. The WDBC was partitioned into training (70%), testing (20%), and IoT-based evaluation (10%). This ensured class balance and the fair representation of malignant and benign cases across each subset. The optimization of learning performance was achieved via hyperparameter tuning. A detailed evaluation was performed and the DT model was identified as the most effective through comparative analysis.
- C.
- Phase 3: Real-Time Diagnosis
The final phase centered on integrating the optimal ML model within a networked diagnostic framework, resulting in the implementation of the BREAST-CAD system. This system consists of (1) a client application and (2) a centralized server. The client interface allows clinicians to input cytological FNA data, which are processed locally by the embedded DT model to generate a diagnostic prediction (benign or malignant). This output is then transmitted using the MQTT protocol to the cloud-hosted BREAST-CAD server. The server acts as a centralized node, receiving diagnostic results from multiple client nodes, enabling remote monitoring, centralized data storage, and real-time epidemiological analysis. The server’s architecture supports dynamic dashboards for healthcare administrators, offering trends in diagnostic patterns, flagging anomalies, and identifying potential geographic or demographic clusters. Furthermore, the system architecture is designed to support continuous model improvement. Aggregated data from real-world usage are anonymized and stored, forming a feedback loop that enables the ongoing retraining of ML models to enhance accuracy over time. This capability facilitates collaborative research, allowing institutions to build larger diagnostic datasets and contribute to a shared learning model.
3. Fine Needle Aspiration
FNA involves guiding a thin needle (typically of 22–27 gauge) into a breast lump that is either palpable or detected by imaging to extract cellular material for analysis. The aspirated sample is smeared on slides, stained, and evaluated under a microscope. Based on cellular features, the diagnostic output typically categorizes lesions as benign, malignant, suspicious, or non-diagnostic [5]. These include nuclear morphology (size, shape, chromatin texture), mitotic activity, nuclear membrane irregularity, cell uniformity, and background necrosis. In automated or AI-assisted systems such as those using the WDBC dataset, these features are transformed into numerical attributes used for computational classification models (e.g., SVM, KNN, DT, NB). FNA offers several advantages in breast cancer diagnosis. It is quick, cost-effective, and well tolerated by patients, making it ideal for high-volume screening or outpatient settings. It enables rapid diagnosis, often within 24 h, allowing timely clinical decisions. FNA facilitates repeated sampling and is suitable for the cytological evaluation of axillary lymph nodes or metastatic lesions. Additionally, when adequate, the material collected can be used for immunocytochemistry or molecular testing.
4. Results
4.1. Dataset and Model Selection Results
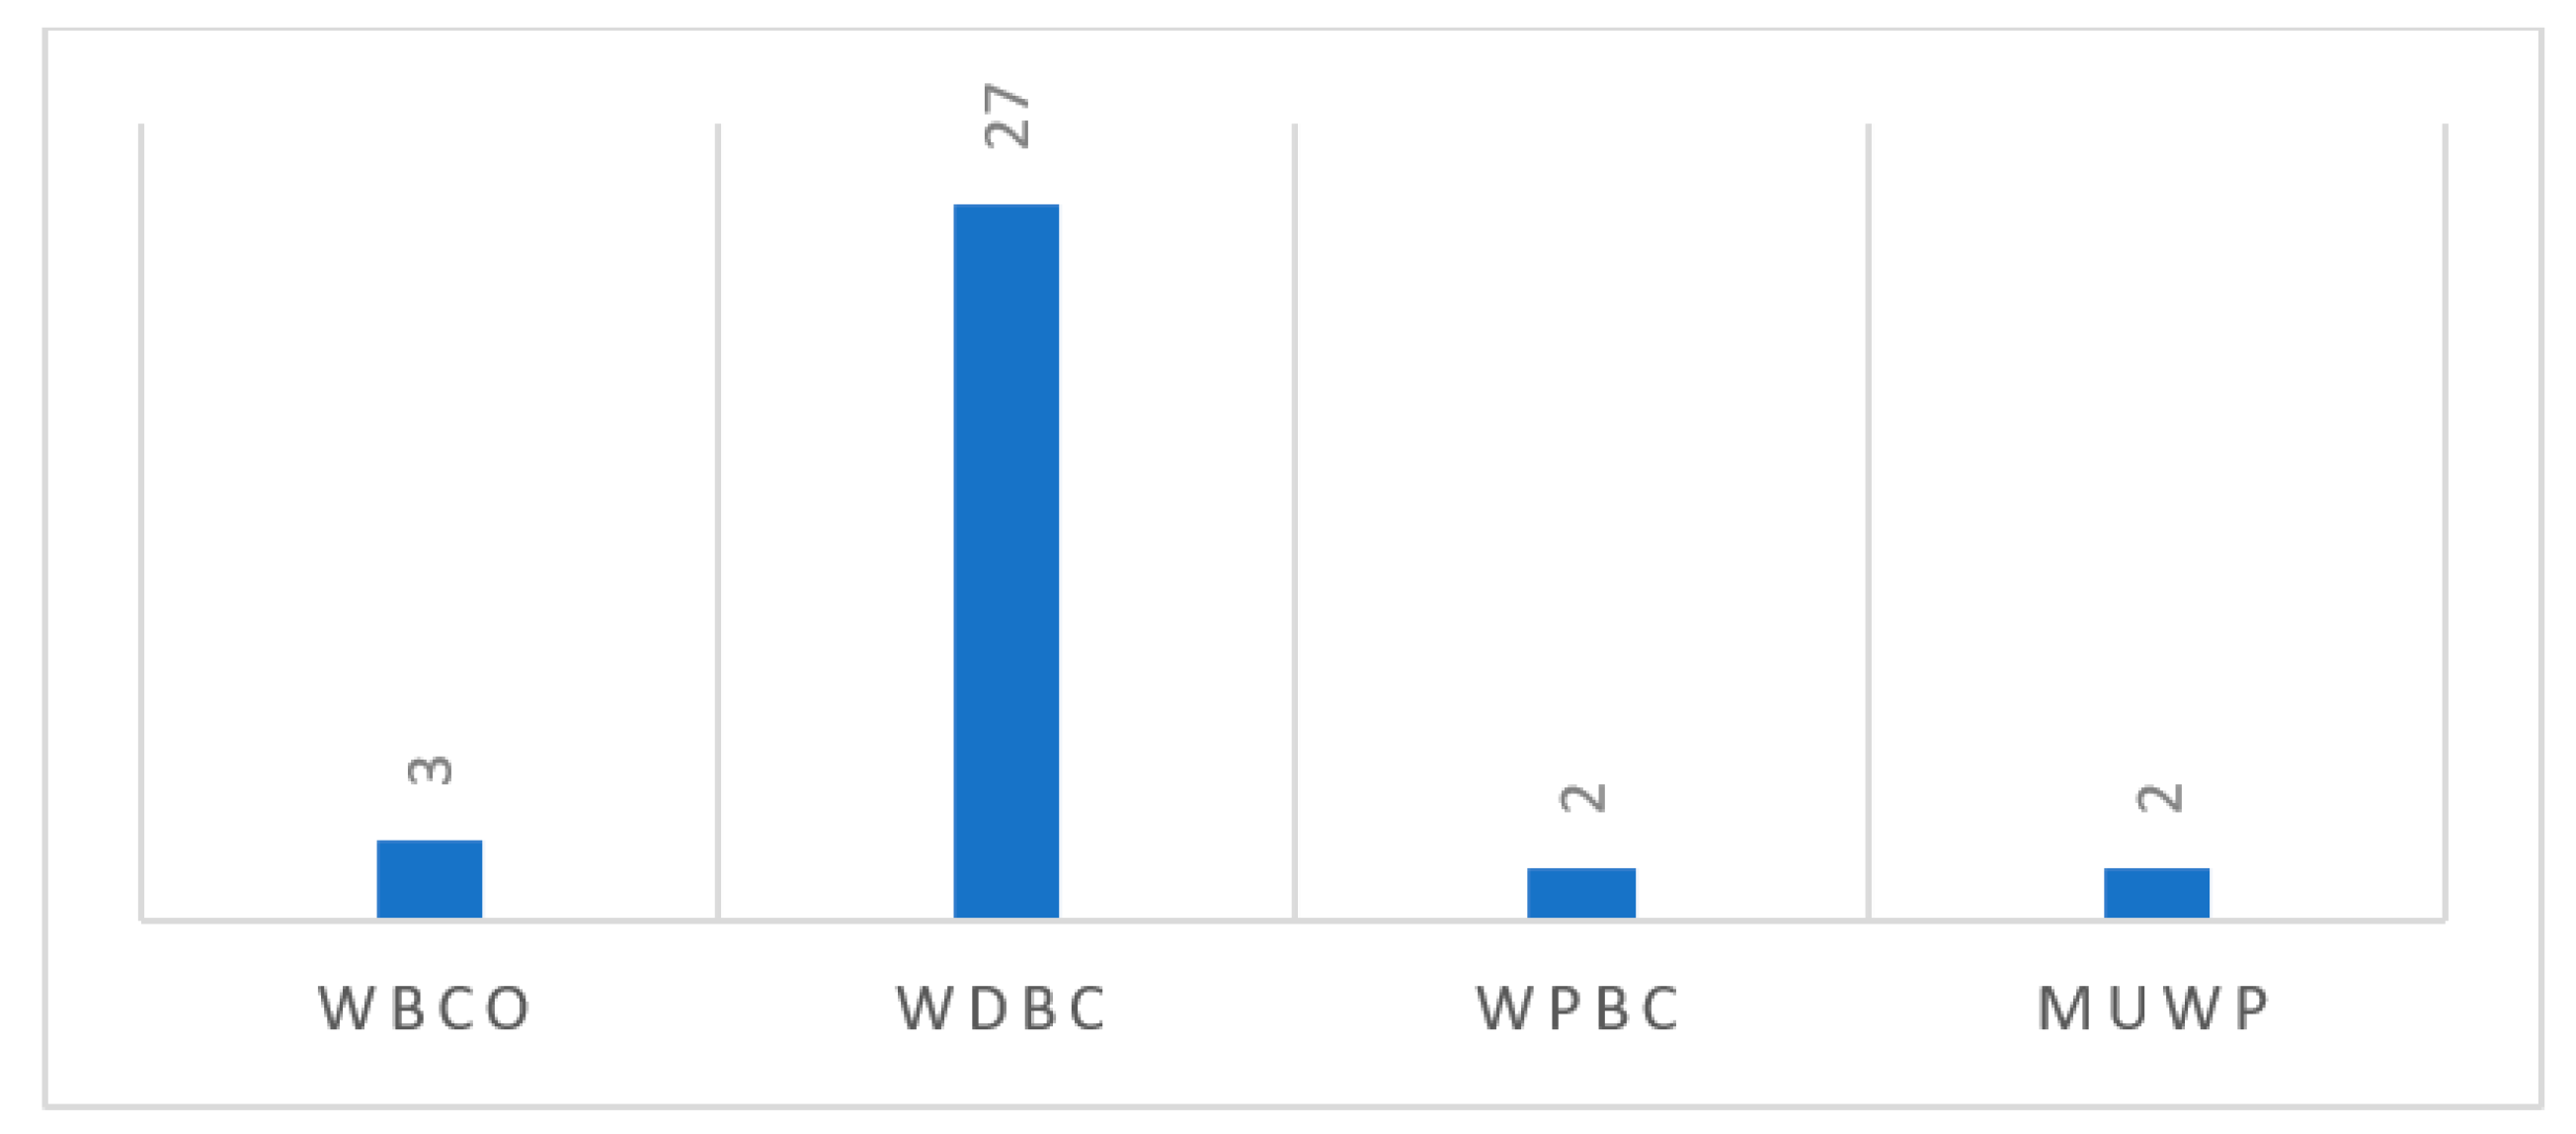
As depicted in Table 1 and Figure 2, from the comprehensive literature review, we identified four datasets that are frequently used: the Original Wisconsin Breast Cancer dataset (WBCO), the WDBC, the Wisconsin Prognosis Breast Cancer dataset (WPBC), and the dataset from the Medical University of Wroclaw Poland (MUWP). The WDBC dataset appeared most often (in 27 studies), likely because it has a lot of different features and is a well-known standard for comparison. This widespread adoption of the WDBC facilitates comparability across different modeling approaches.

Table 1.
Breast cancer dataset and model selection process analysis.
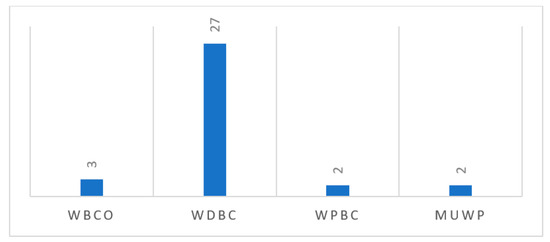
Figure 2.
This figure presents an overview of the four key FNA breast cancer datasets identified in the literature between 2000 and 2024.
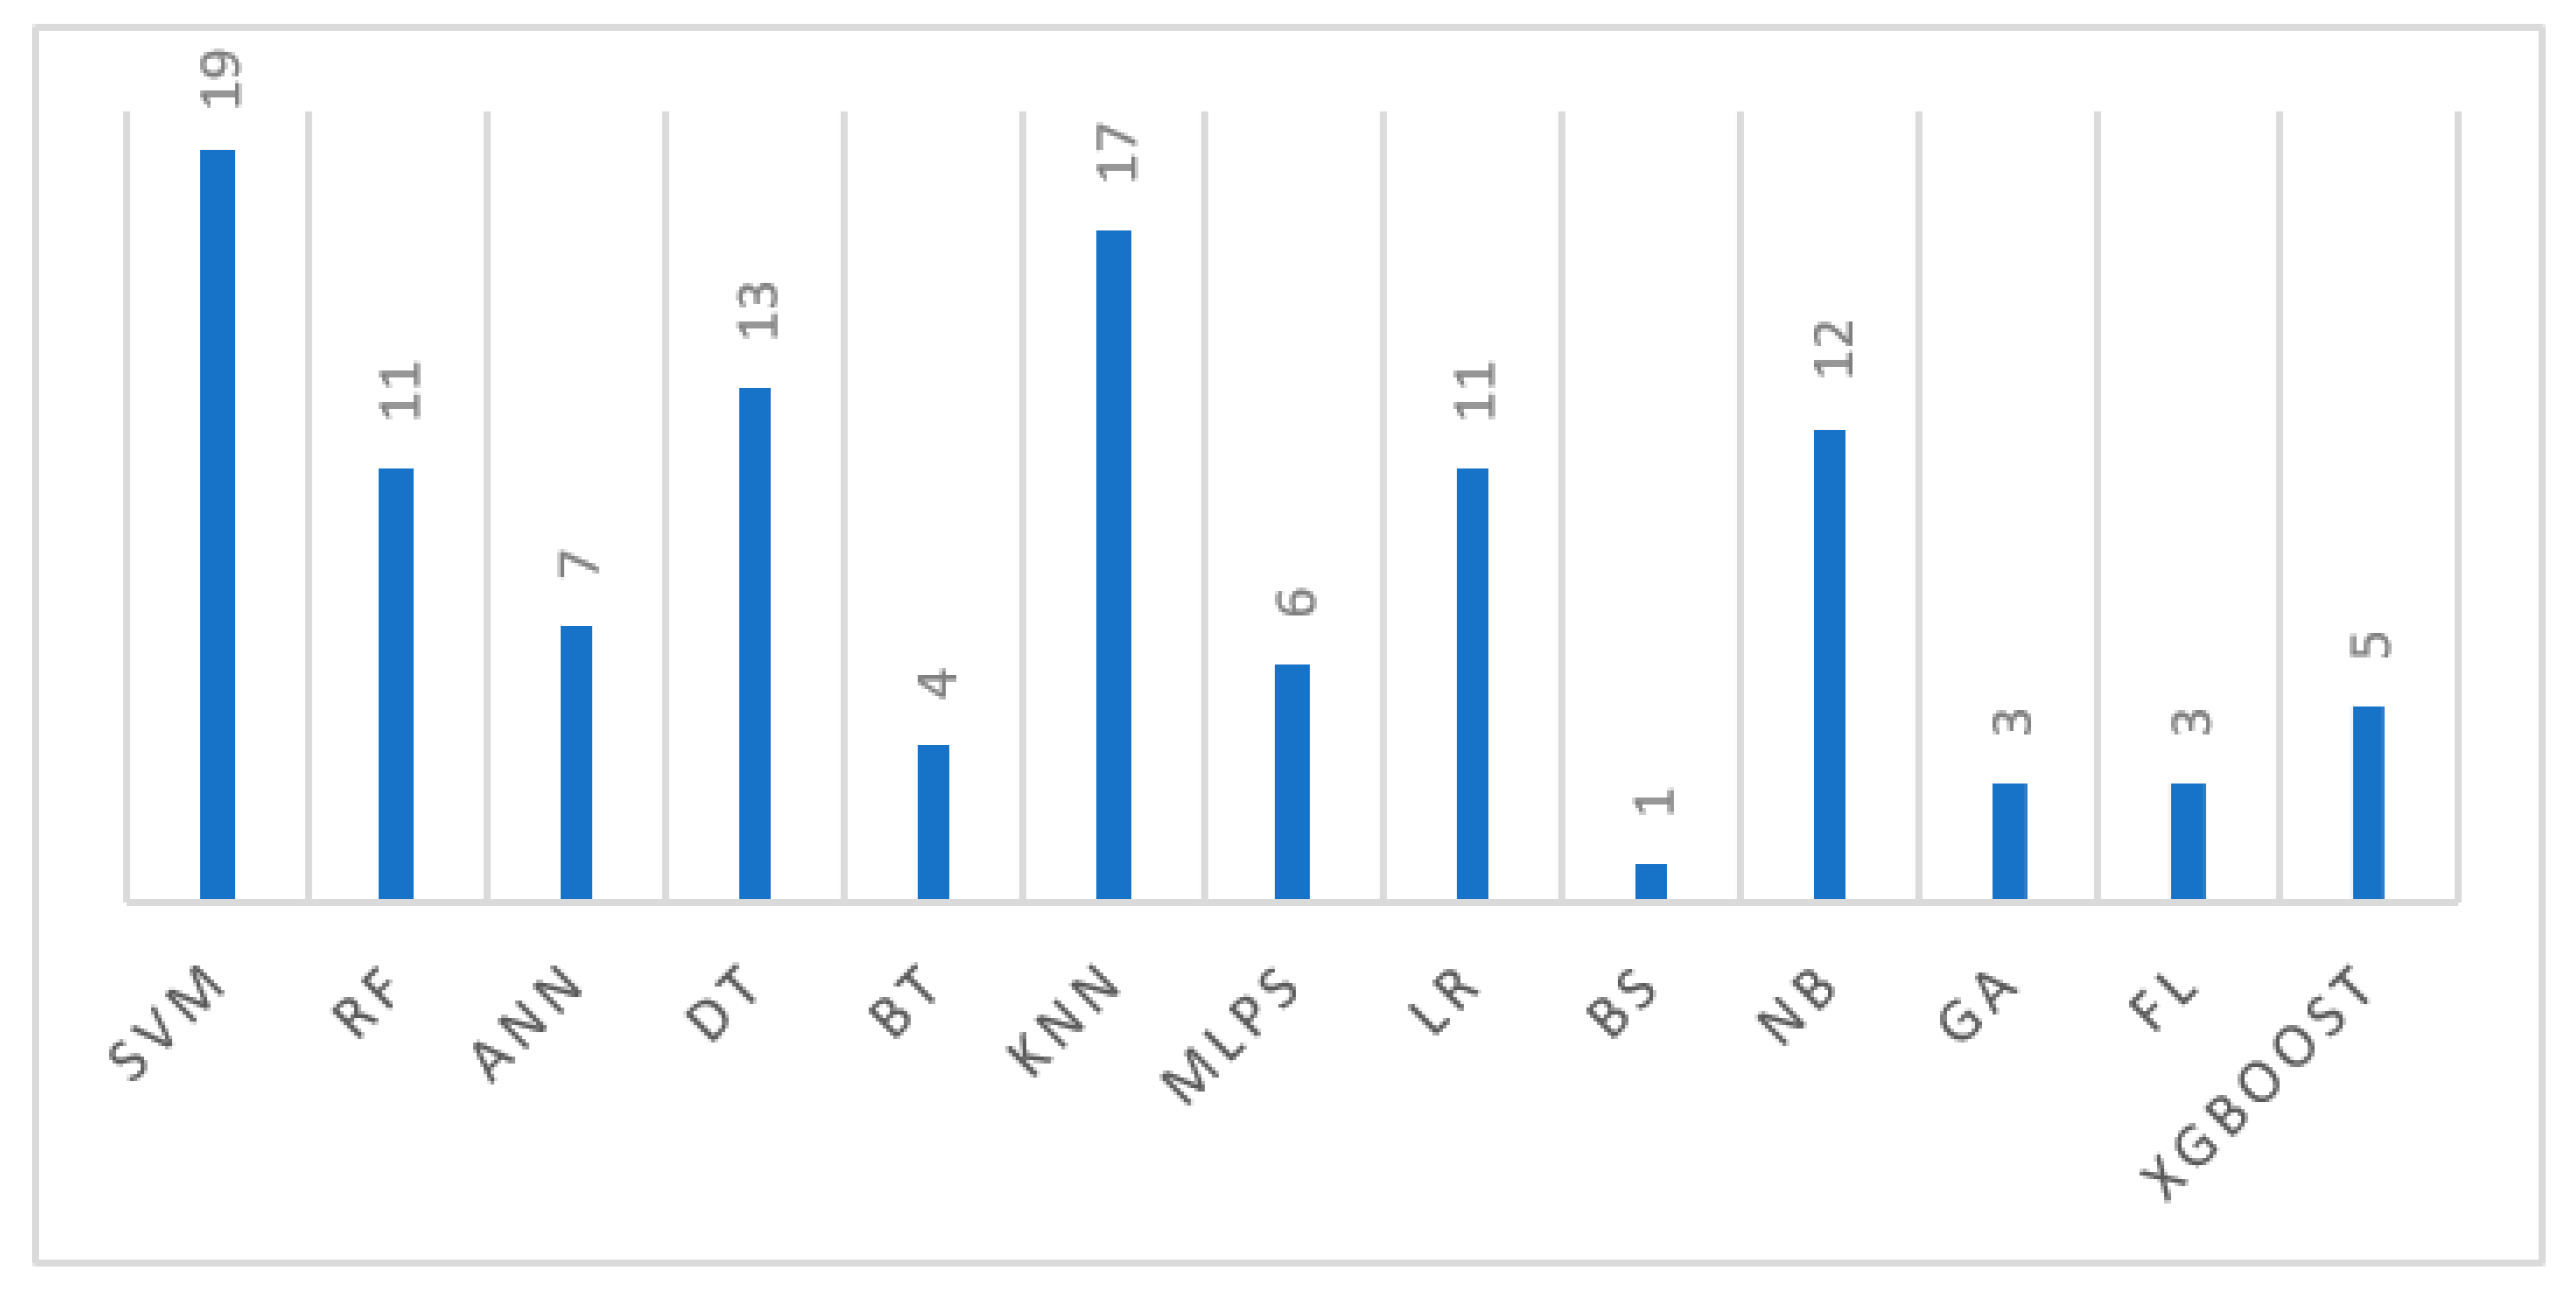
Our model selection process prioritized four key ML models, SVM, DT, KNN, and NB, based on their frequency of use in the literature, as described in Figure 3. While a broader range of models like Artificial Neural Networks (ANNs), Bayesian Statistics (BSs), Logistic Regression (LR), Feed Forward Neural Networks (FFNNs), Multilayer Perceptrons (MLPs), genetic algorithms (GAs), fuzzy logic (FL), and gradient boosting (XGboost) were identified, SVM (used in 19 studies), KNN (used in 17 studies), NB (used in 12 studies), and DT (used in 13 studies) significantly dominated in the literature, with Naive Bayes also showing notable prior usage and strong performance. These selected models offer distinct advantages: SVMs’ effect in high-dimensional spaces and in handling non-linear relationships; DT’s robustness and capacity to manage numerous predictive features; KNN’s potential to discern complex patterns; and Naive Bayes’ computational efficiency and effectiveness with independent features. Critically, these four models have consistently demonstrated strong performance metrics in previous WDBC-based breast cancer classification studies, justifying their selection for this research.
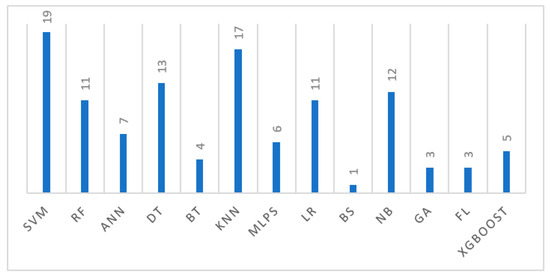
Figure 3.
This figure illustrates the various breast cancer classification techniques discussed in the scientific literature from 2000 to 2024.
4.2. Model Training and Evaluation Results, Phase 2
4.2.1. Data Collection and Preparation Results
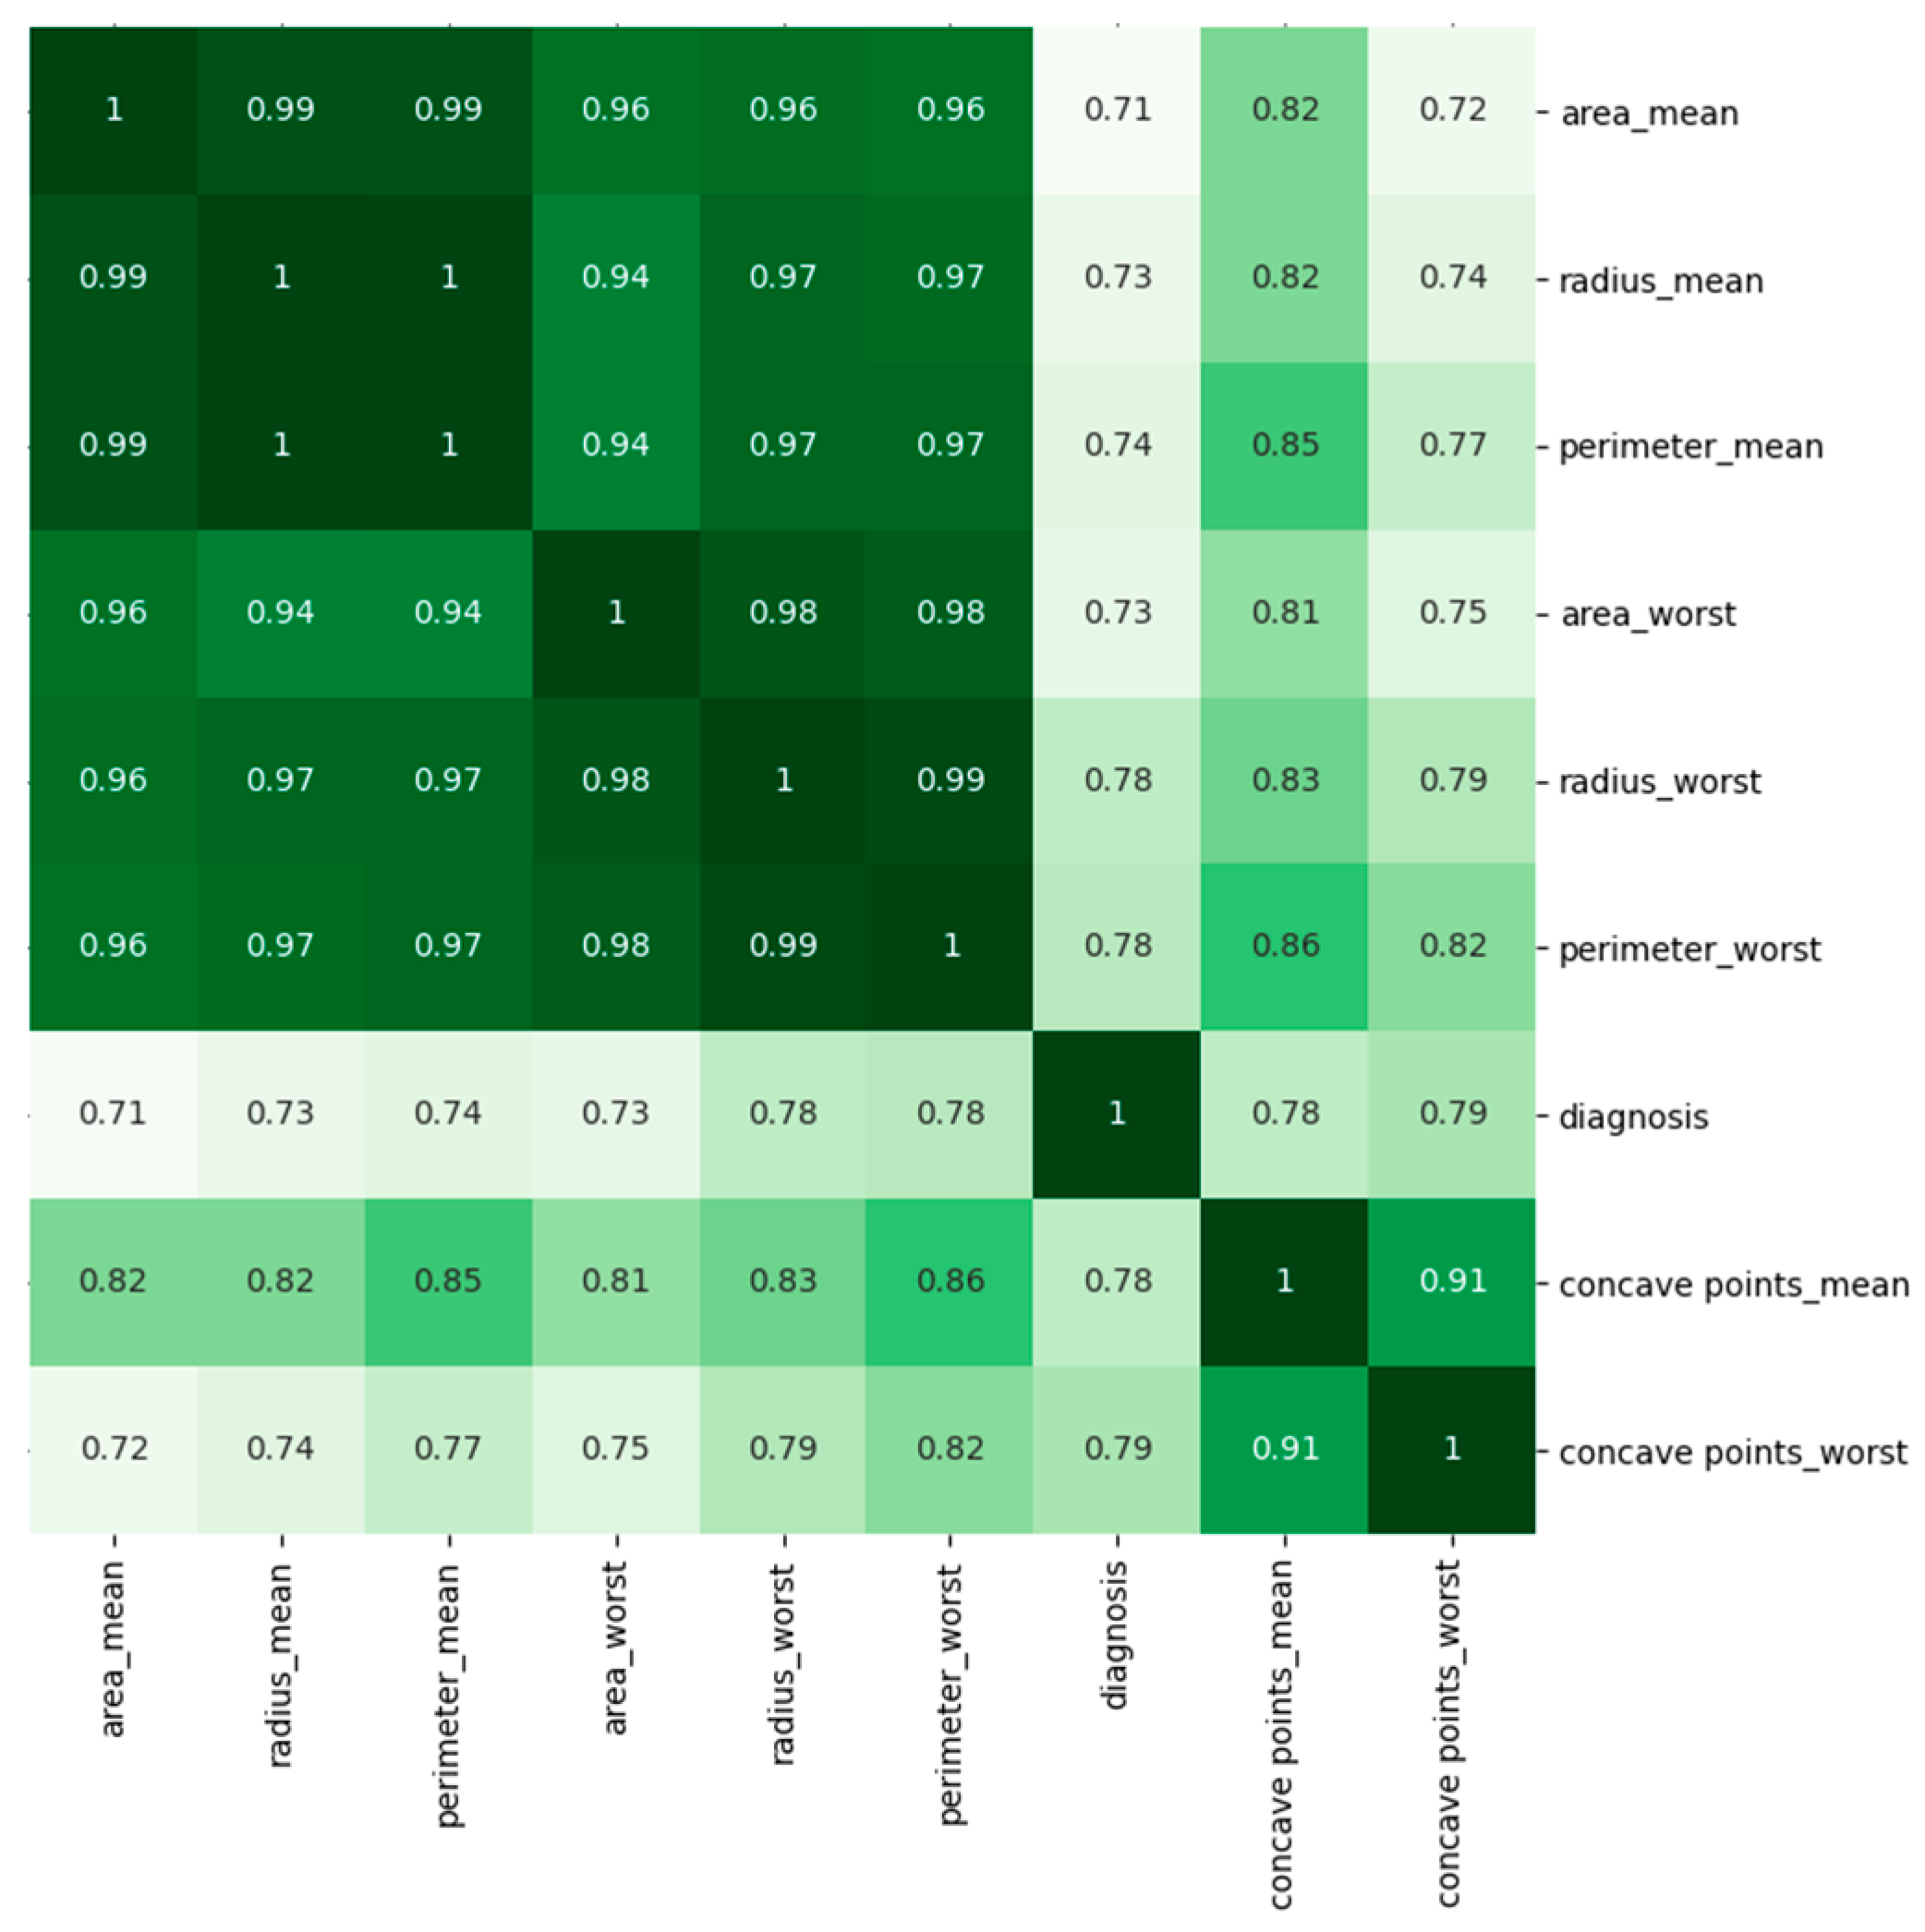
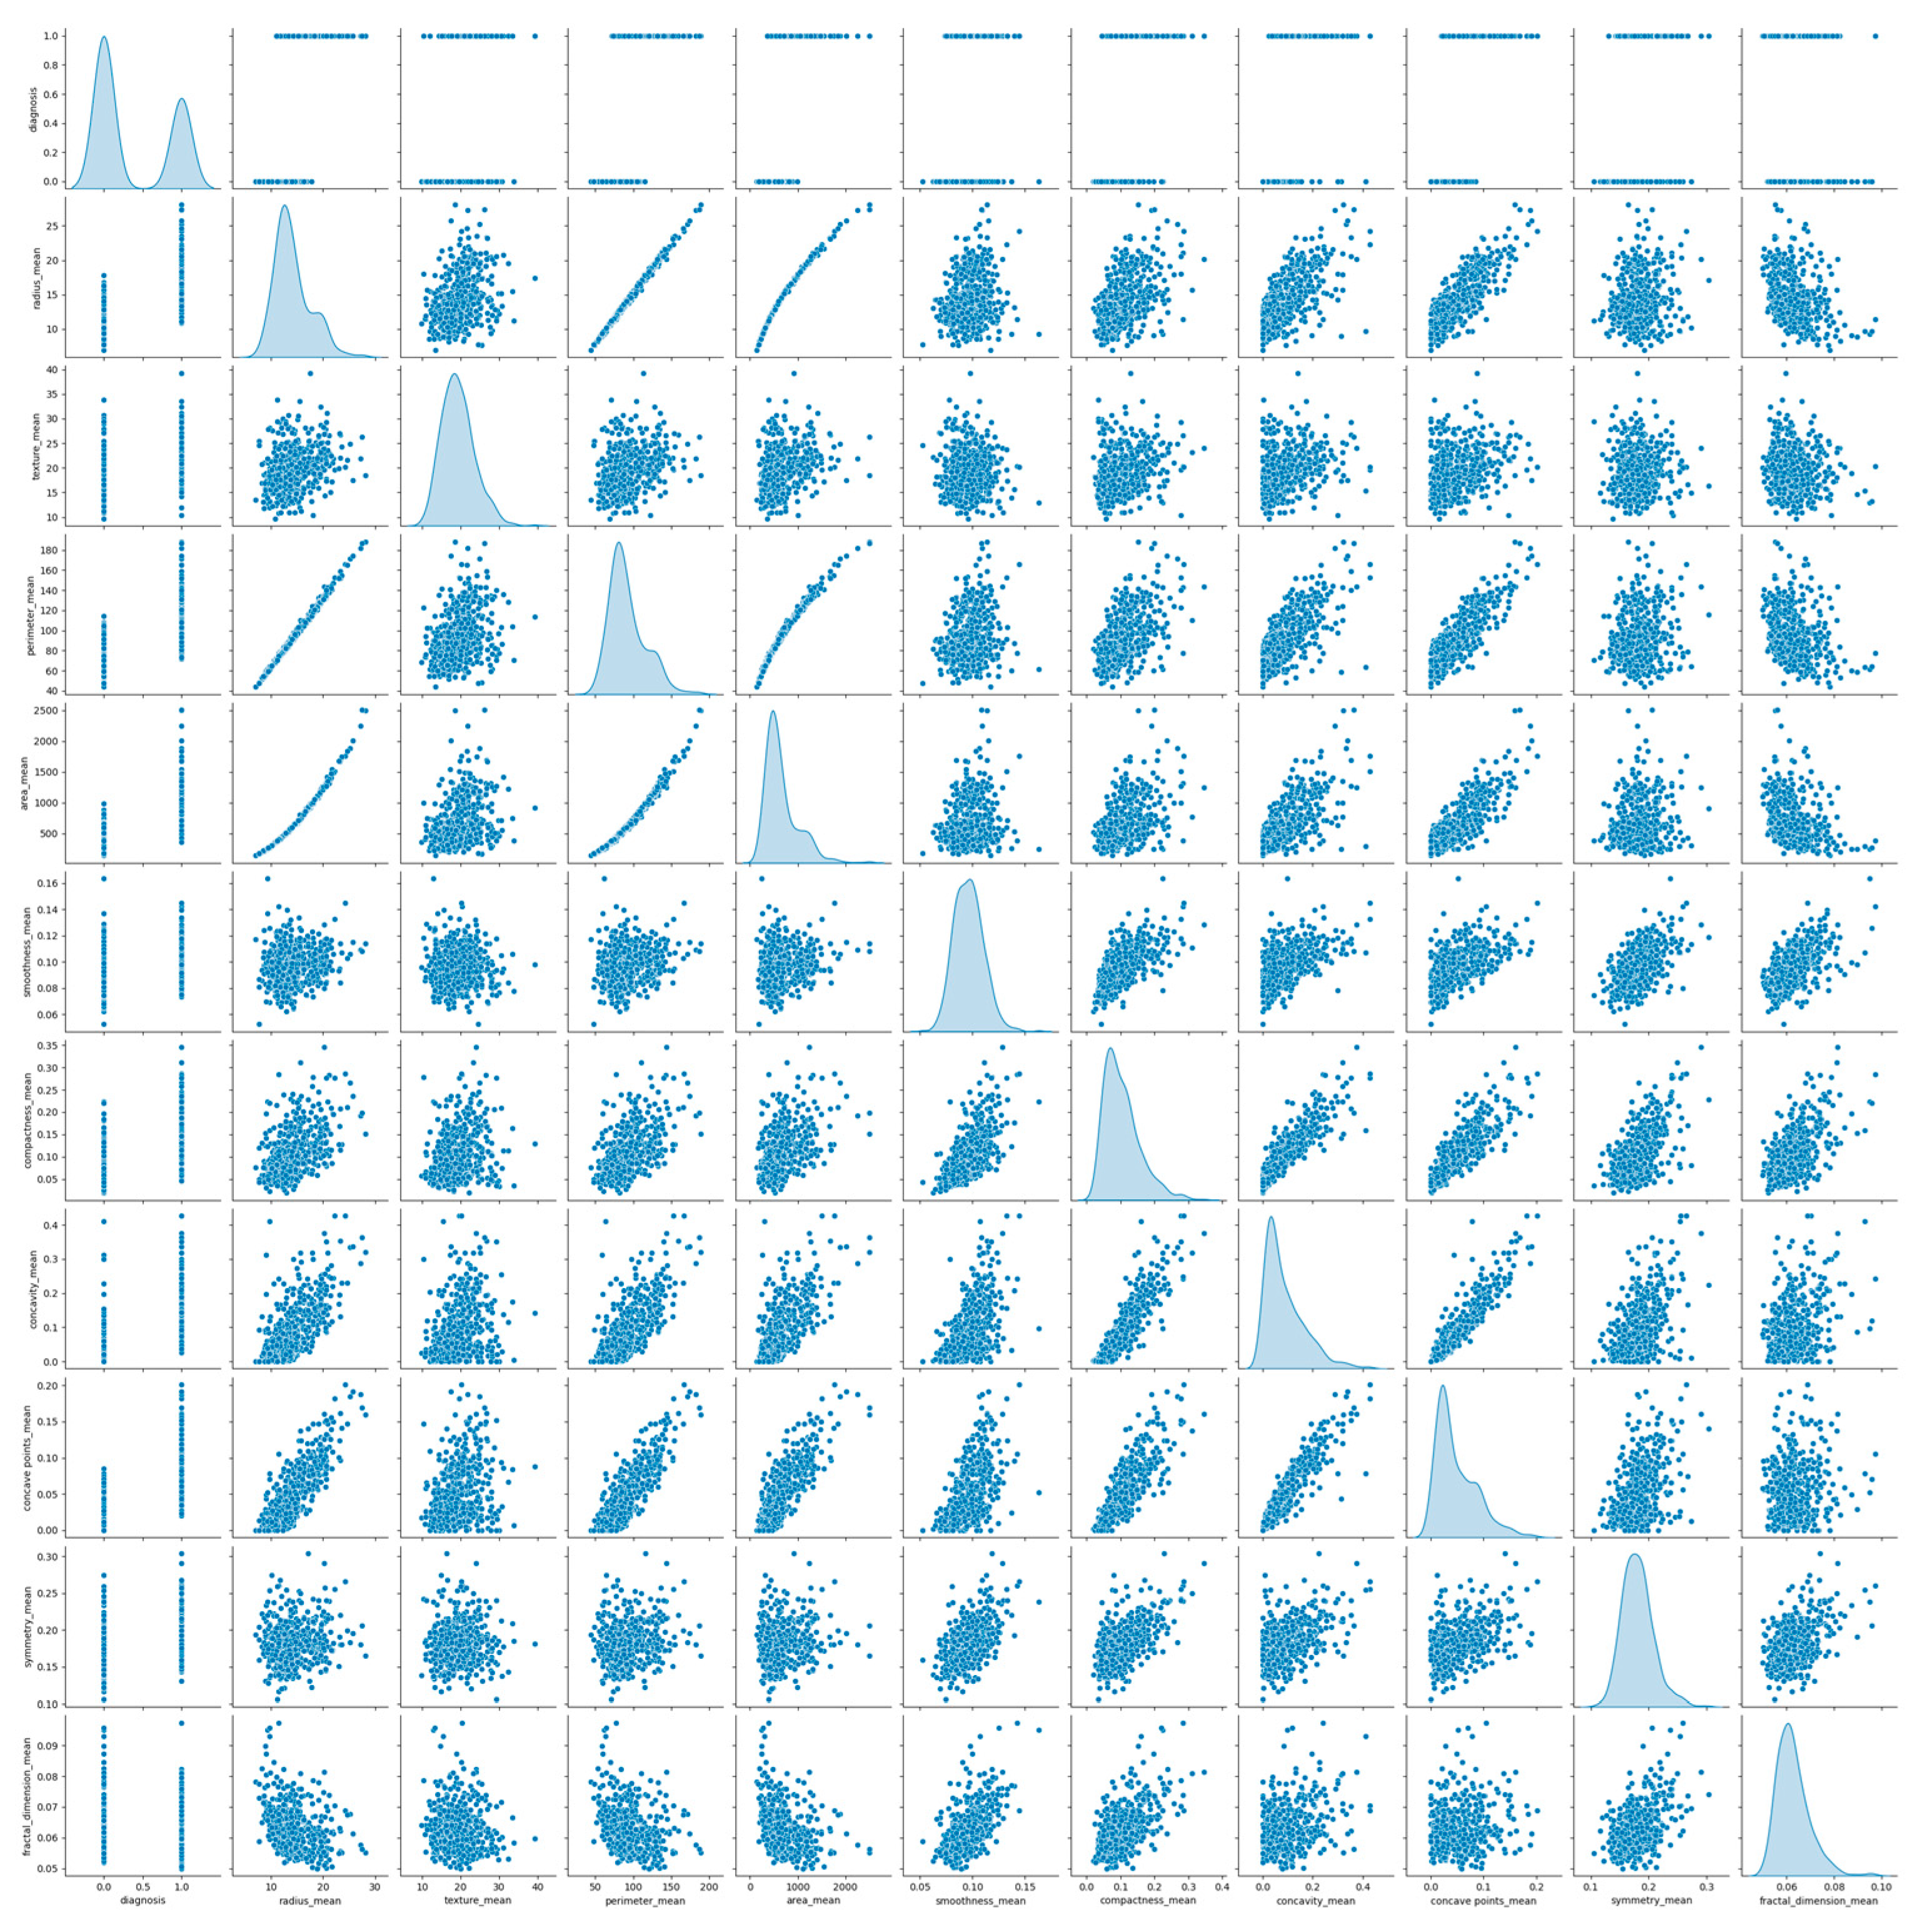
As in Table 2, the WDBC include a specific ID, a diagnosis (benign or malignant), and 30 numerical features. These 30 features come from ten different measurements taken from cell nuclei: “radius, texture, perimeter, area, smoothness, compactness, concavity, concave points, symmetry, and fractal dimension”. The dataset provides the “mean, standard error, and worst” values for each measurement. The dataset is relatively balanced, with 357 benign (62.6%) and 212 malignant (37.4%) samples. After removing the irrelevant “Unnamed” and “ID” columns, the categorical “diagnosis” column, indicating Benign (B) or Malignant (M), was numerically encoded, with Malignant assigned 1 and Benign assigned 0. The dataset contained no missing values, leaving 30 features for model training. To assess inter-variable relationships, we employed correlation matrices, visualizing pairwise correlation coefficients. We quantified these relationships using the Pearson correlation coefficient, ranging from −1 to +1. Feature selection was performed based on a 0.6 correlation threshold with the diagnostic column, resulting in 12 selected features. Critically, we then examined correlations among these 9 chosen features to detect any remaining multicollinearity. Figure 4 displays this correlation matrix, enabling us to identify and address any high inter-predictor correlations. The pair plot shown in Figure 5 was employed to explore the distributional characteristics and interrelationships among seven features, utilizing the mean values of previously identified strongly correlated feature subsets. The diagonal elements show the marginal distributions of each feature, visualized as kernel density estimations. The off-diagonal elements, representing pairwise relationships, are mirrored across the diagonal due to the commutative nature of correlation. Outliers were addressed using the Local Outlier Factor (LOF) algorithm. Applying LOF to the nine feature sets identified outliers in three features, which were subsequently removed.

Table 2.
The WDBC dataset feature description.
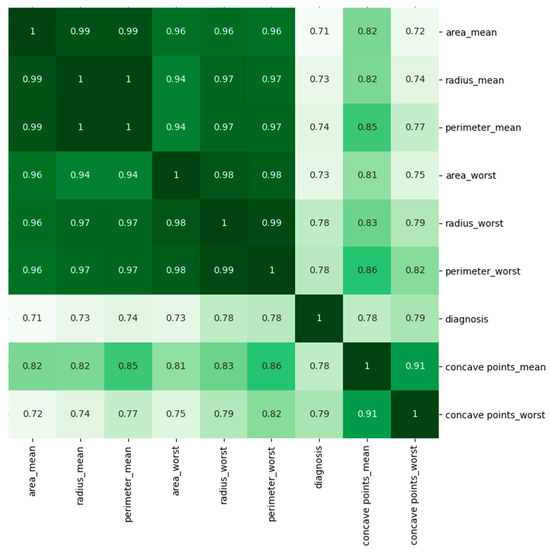
Figure 4.
Correlation heatmap between the 9 features.
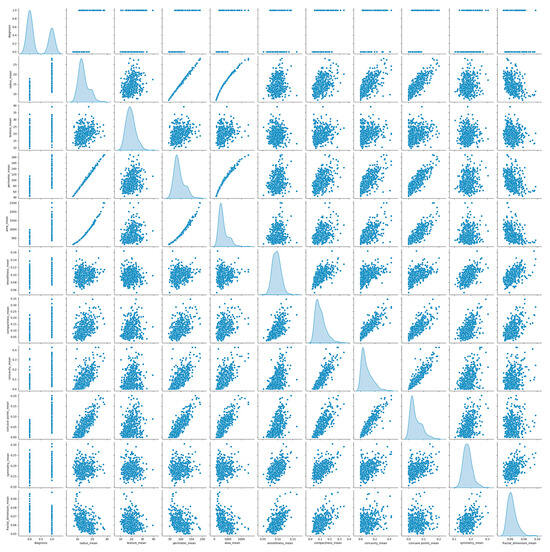
Figure 5.
The distributional characteristics and interrelationships among the twelve strongly correlated features.
4.2.2. Machine Learning Models Training Results
The WDBC was partitioned into training (70%), testing (20%), and evaluation (10%). This division allowed us to check how well k-NN, SVM, DT, and NB performed, as well as the BREAST-CAD system itself (as shown in Table 3). For k-NN, which does not have a traditional training step, we found the optimal ‘k’ value using cross-validation before testing its generalization on the separate testing set. For SVM, we scaled all features and used a Radial Basis Function (RBF) kernel, fine-tuning ‘C’ and ‘gamma’ parameters with Sequential Minimal Optimization (SMO) before training on the entire training set and evaluating on the test set. For the DT model, we used Gini impurity to recursively split data based on features, applying a maximum depth criterion to prevent overfitting. Finally, for the NB model, we employed a Gaussian NB classifier, leveraging its assumption of normally distributed features within each class, calculating means and standard deviations from the training set to determine class probabilities for new data points.

Table 3.
Dataset partitioning and usage for training, testing, and BREAST-CAD integration validation.
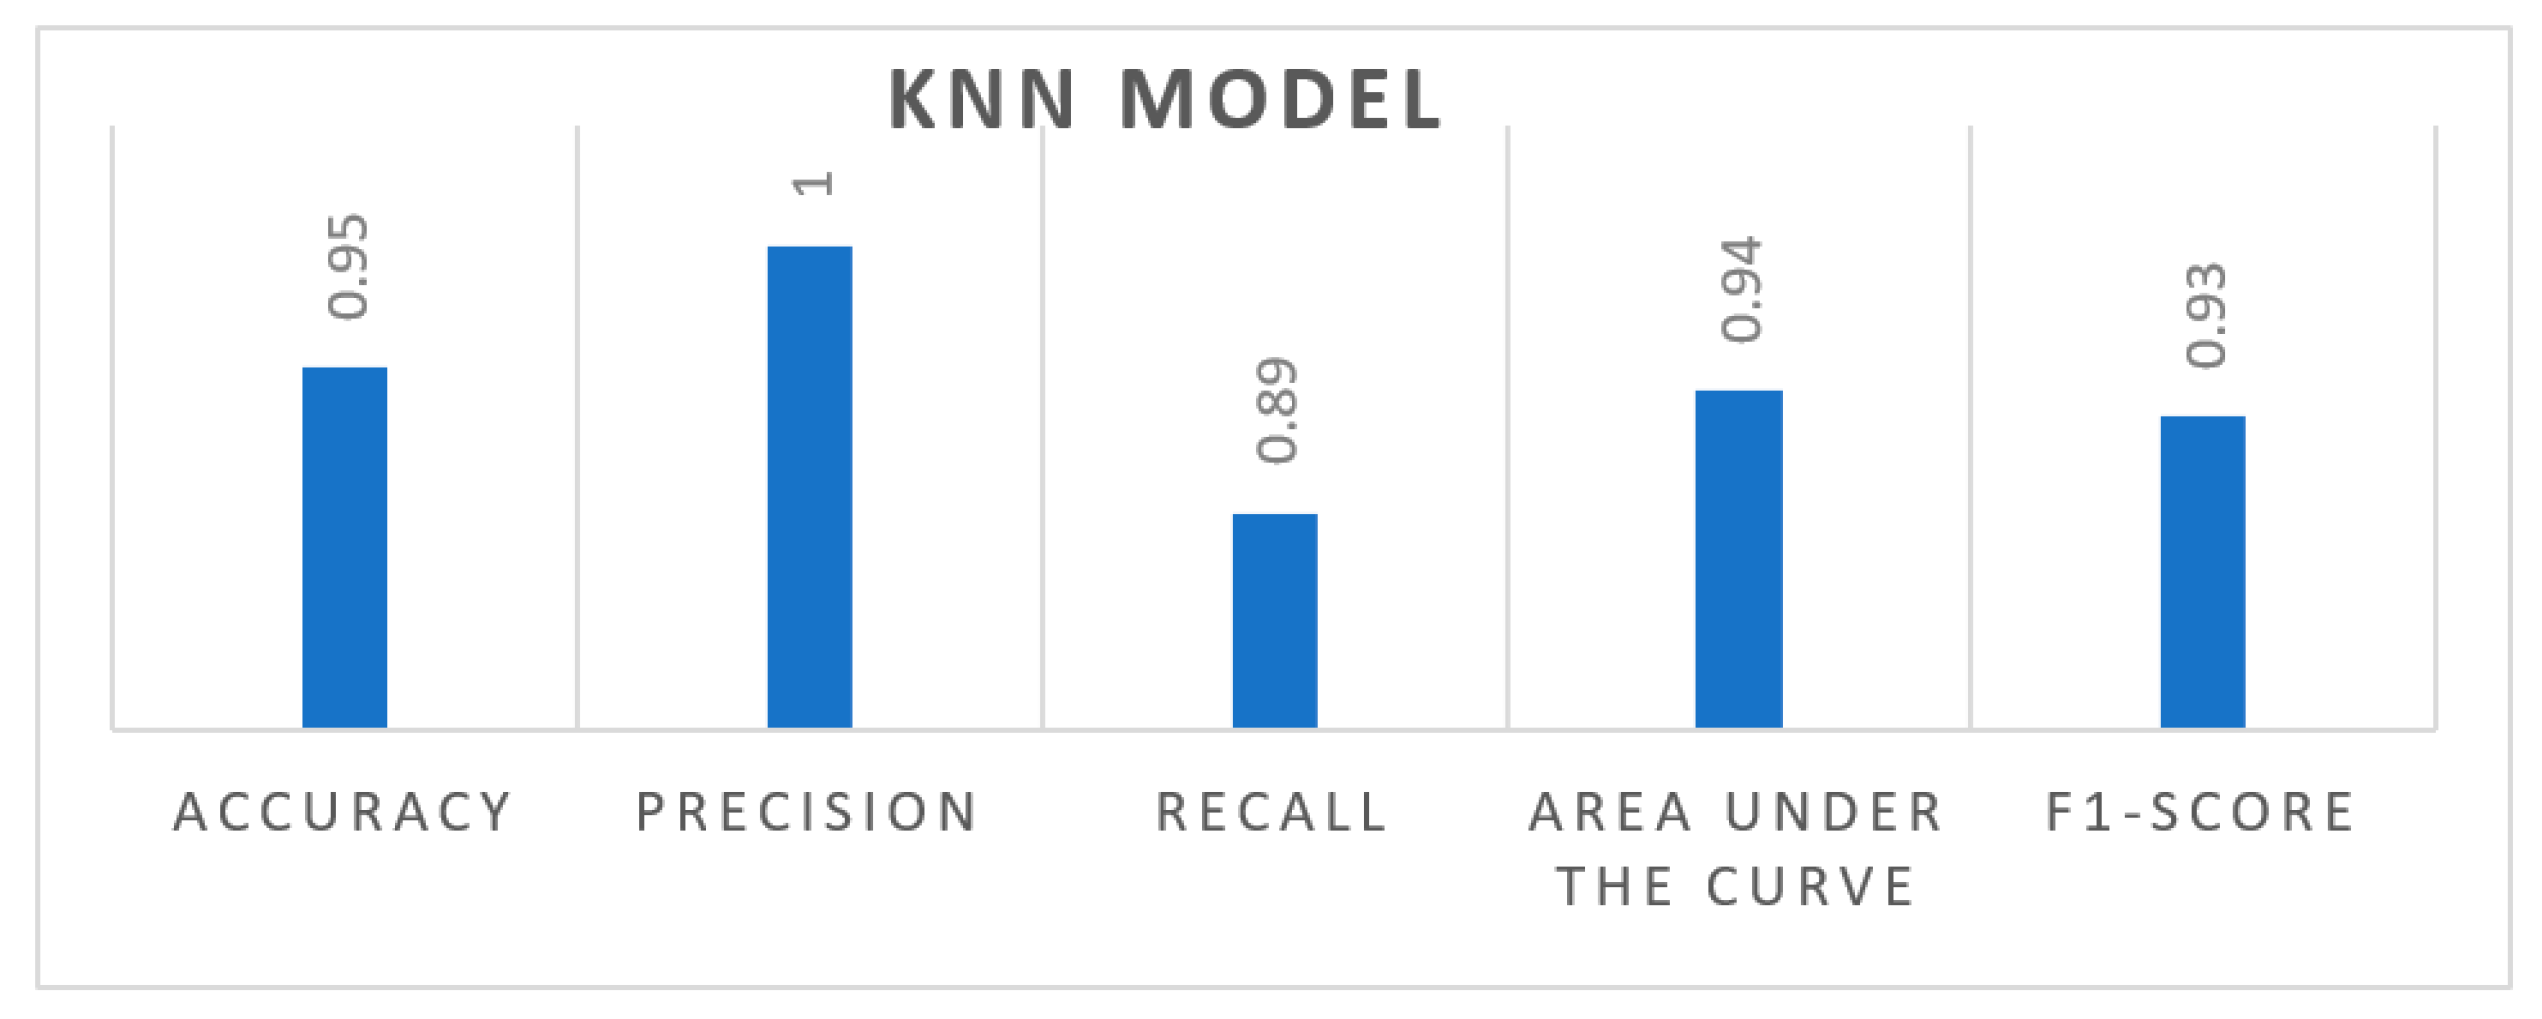
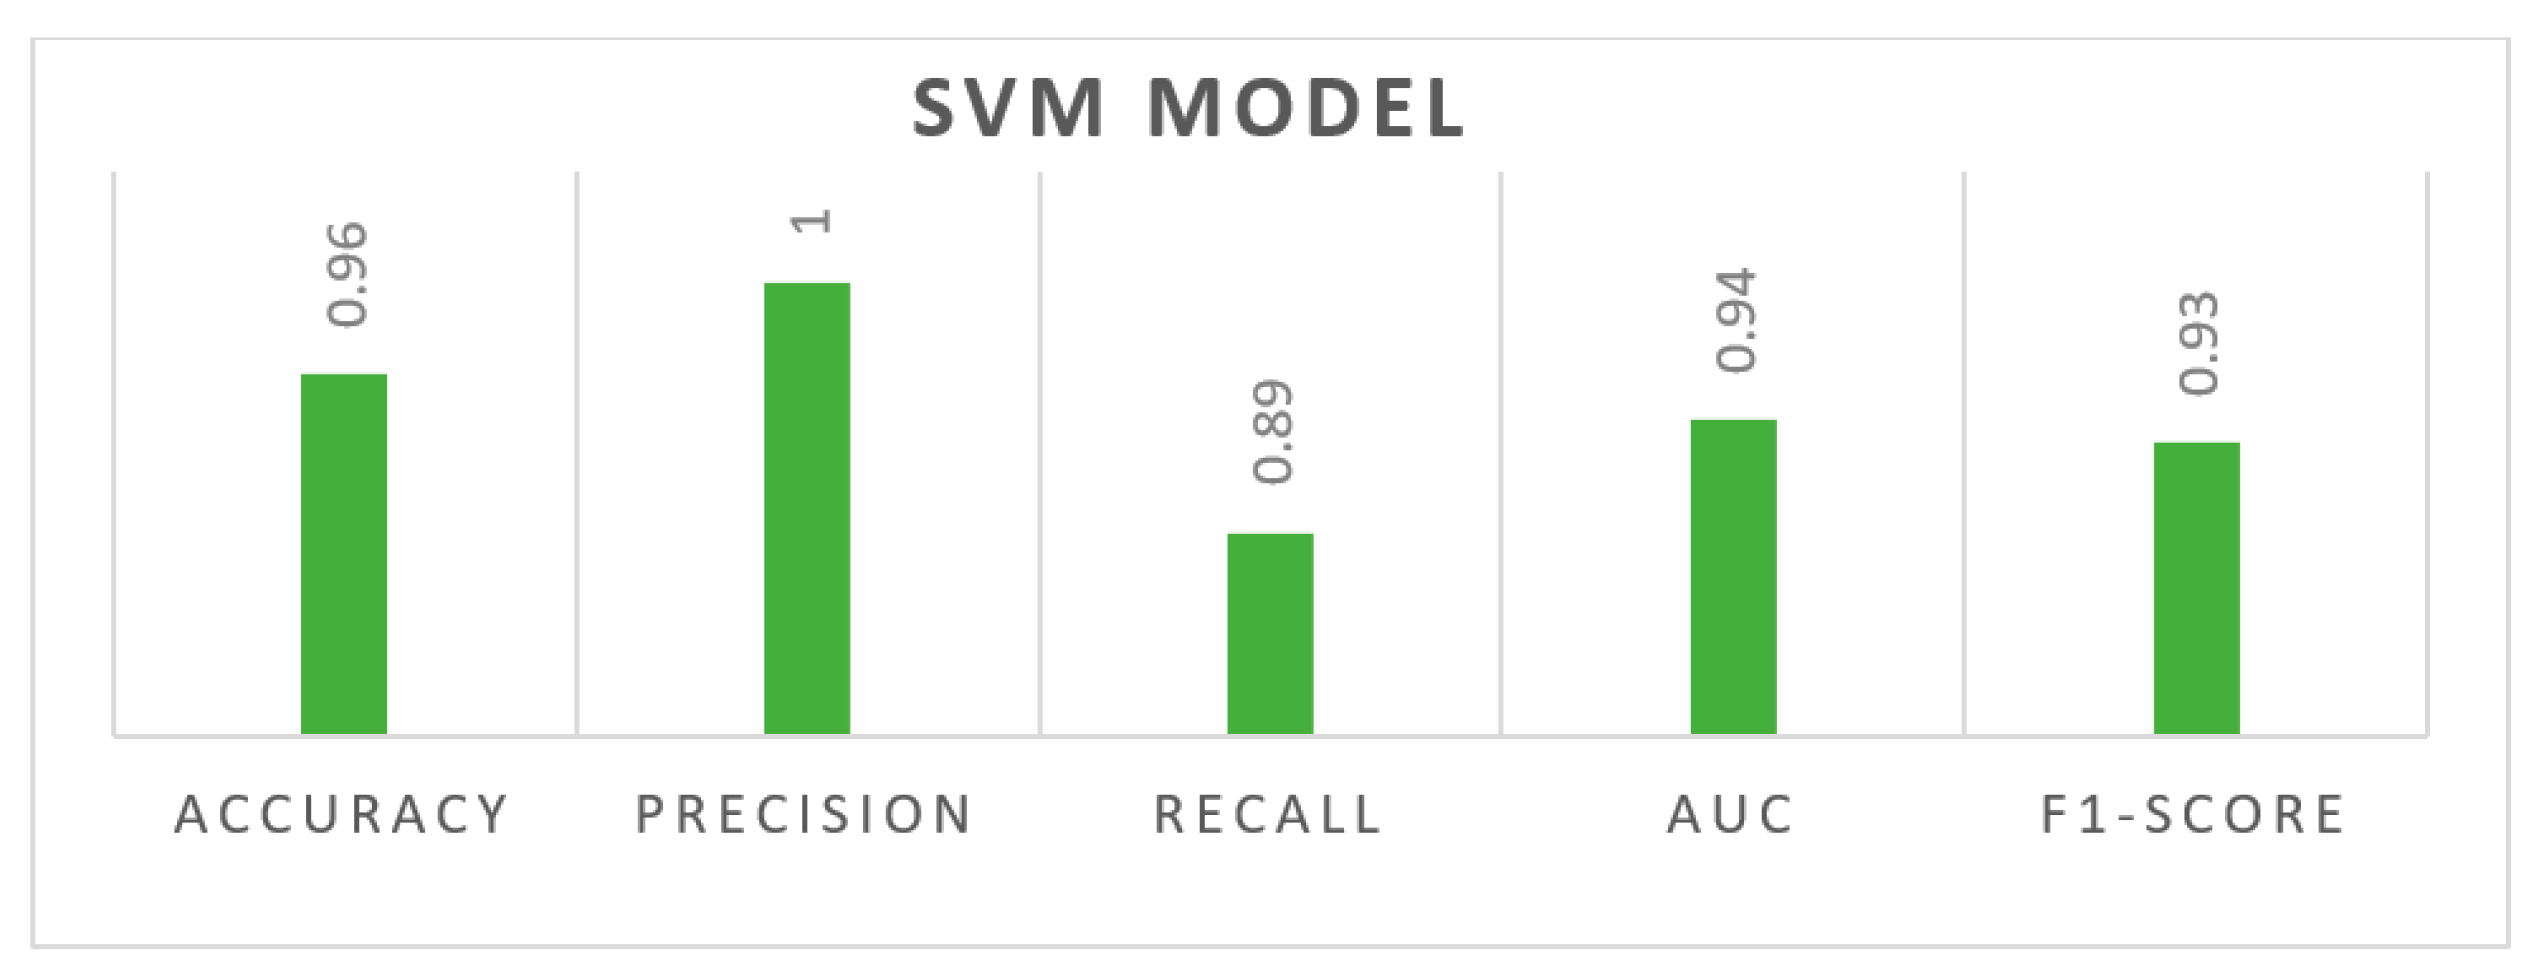
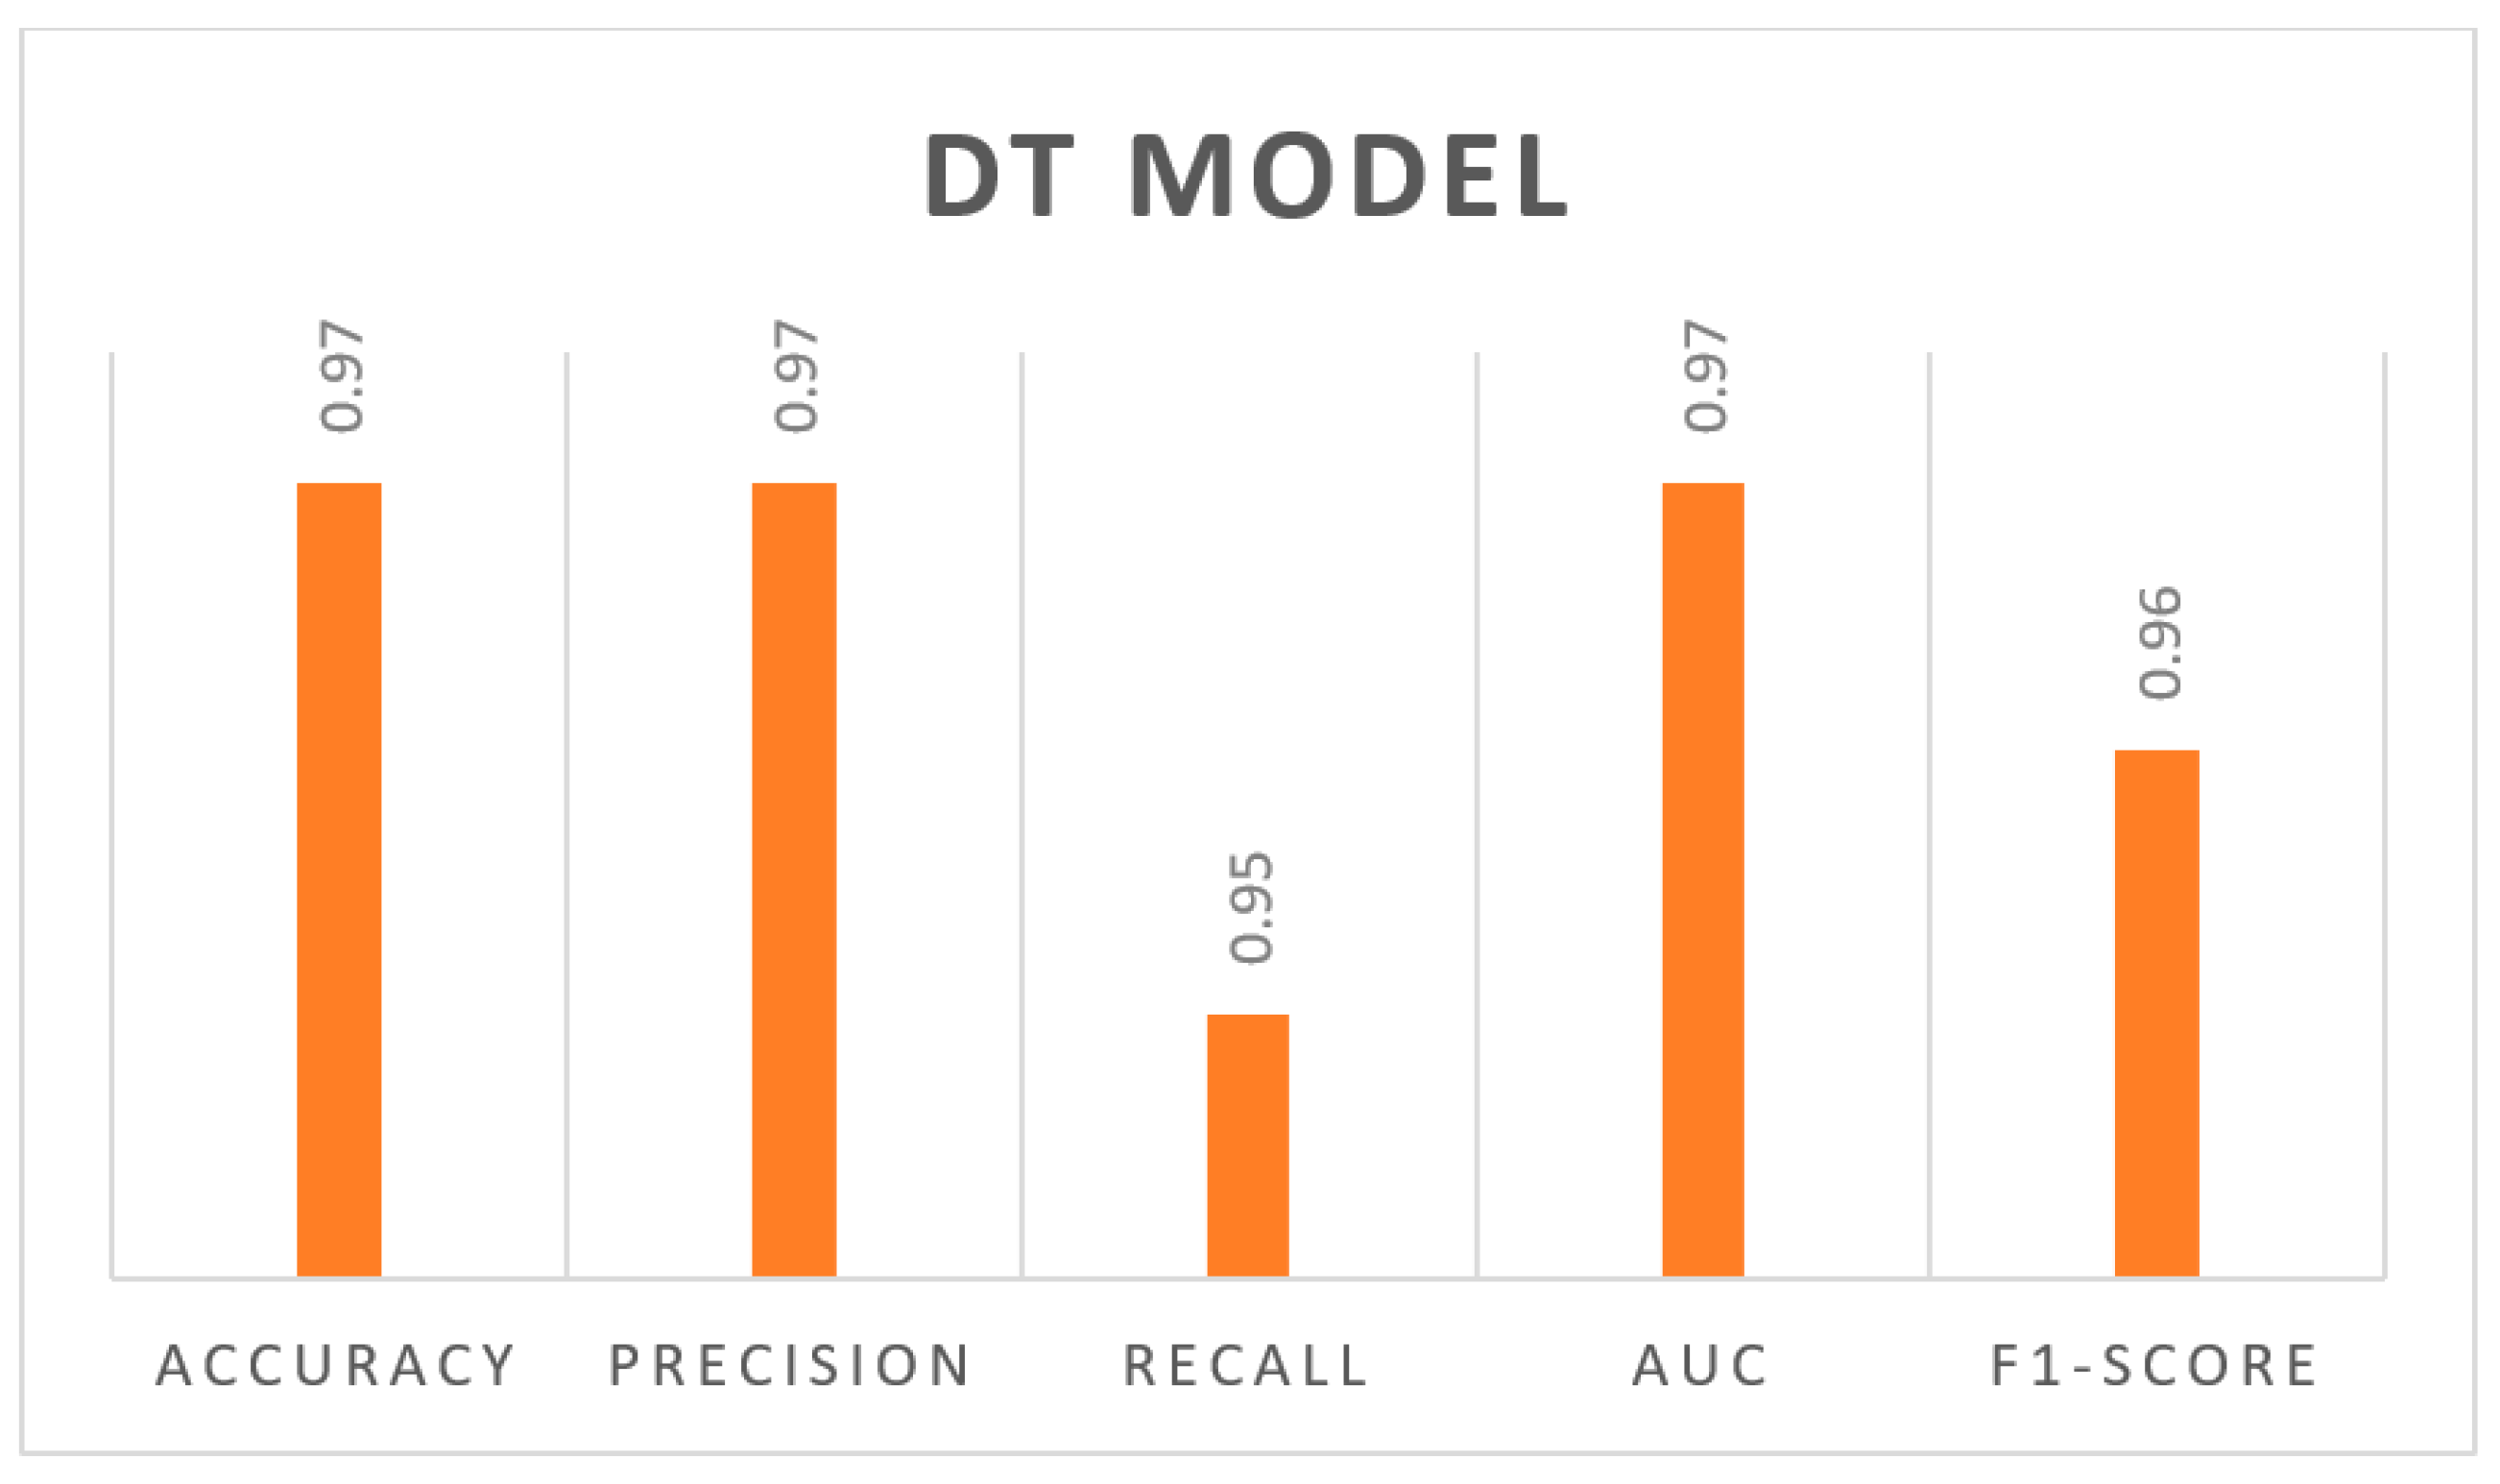
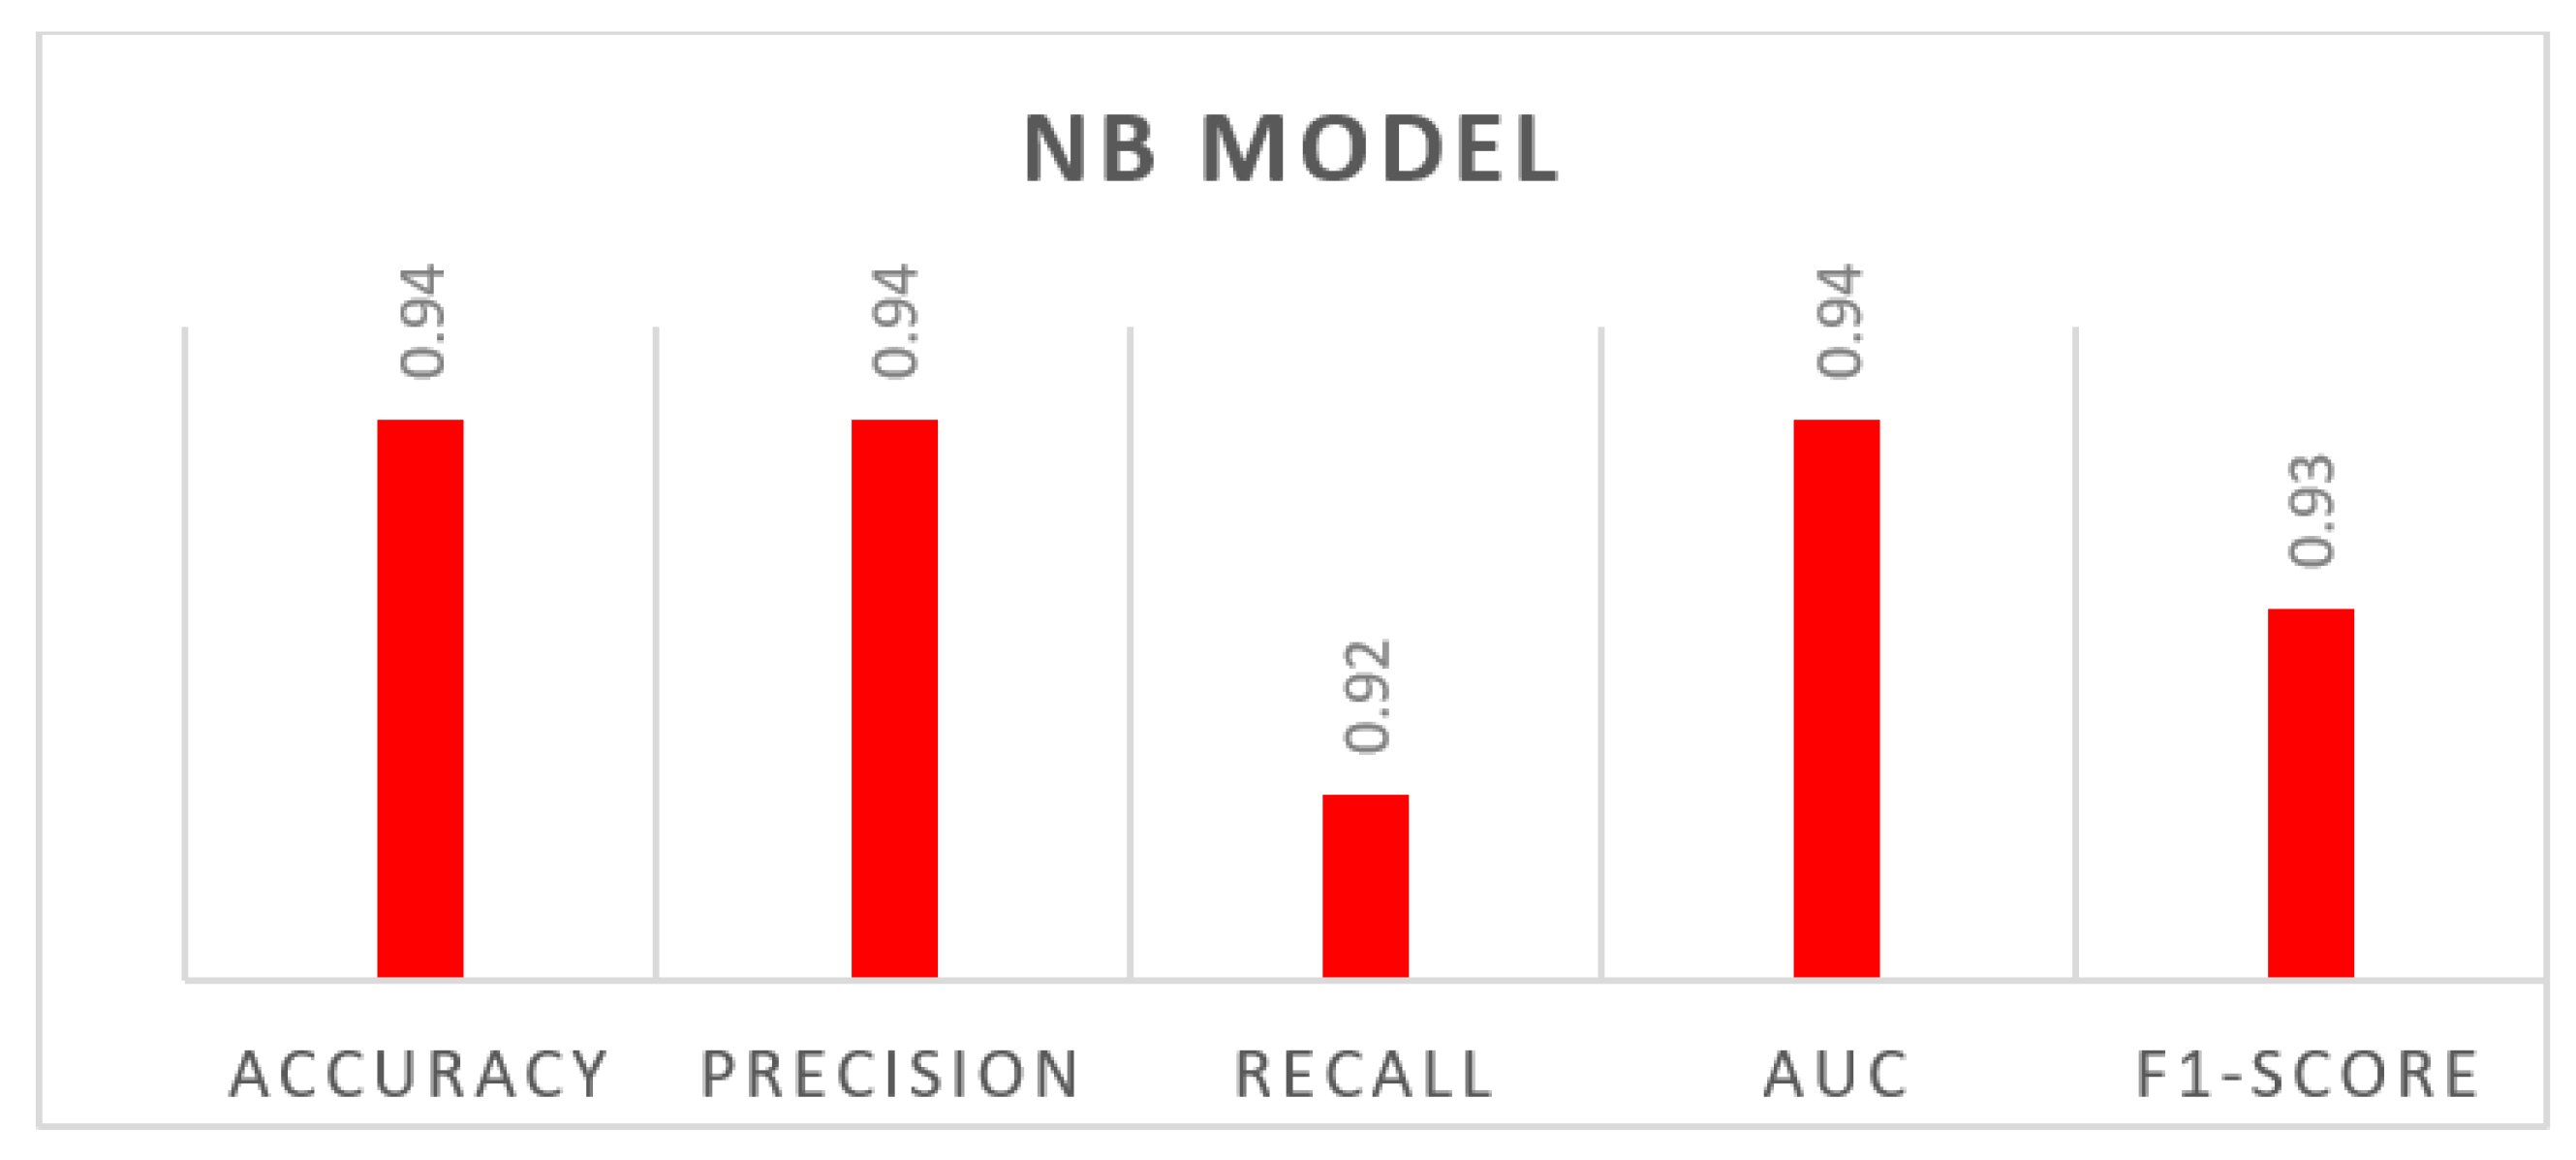
We assessed how well the k-NN, SVM, NB and DT classification models performed after being trained on the WDBC dataset by using a separate test set that the models had not seen before. To measure their performance, we looked at several metrics. The results for each of these metrics for the k-NN, SVM, NB and DT models can be seen in Figure 6, Figure 7, Figure 8, and Figure 9, respectively.
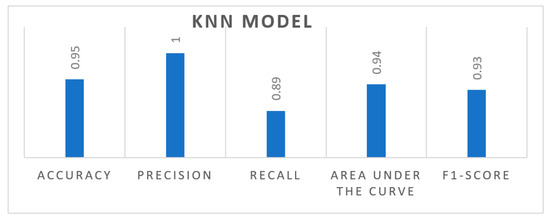
Figure 6.
The performance metric results for the KNN model.
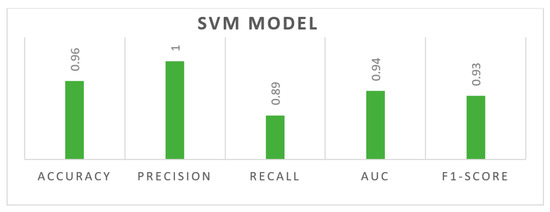
Figure 7.
The performance metric results for the SVM model.
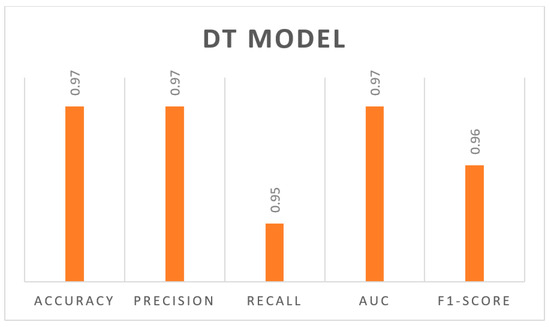
Figure 8.
The performance metric results for the DT model.
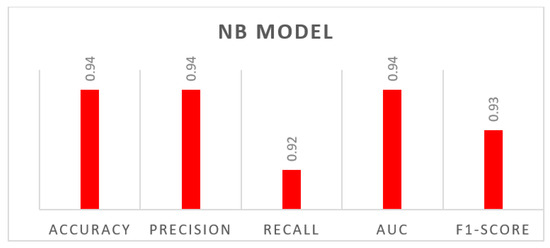
Figure 9.
The performance metric results for the MB model.
4.2.3. Comparative Analysis Results
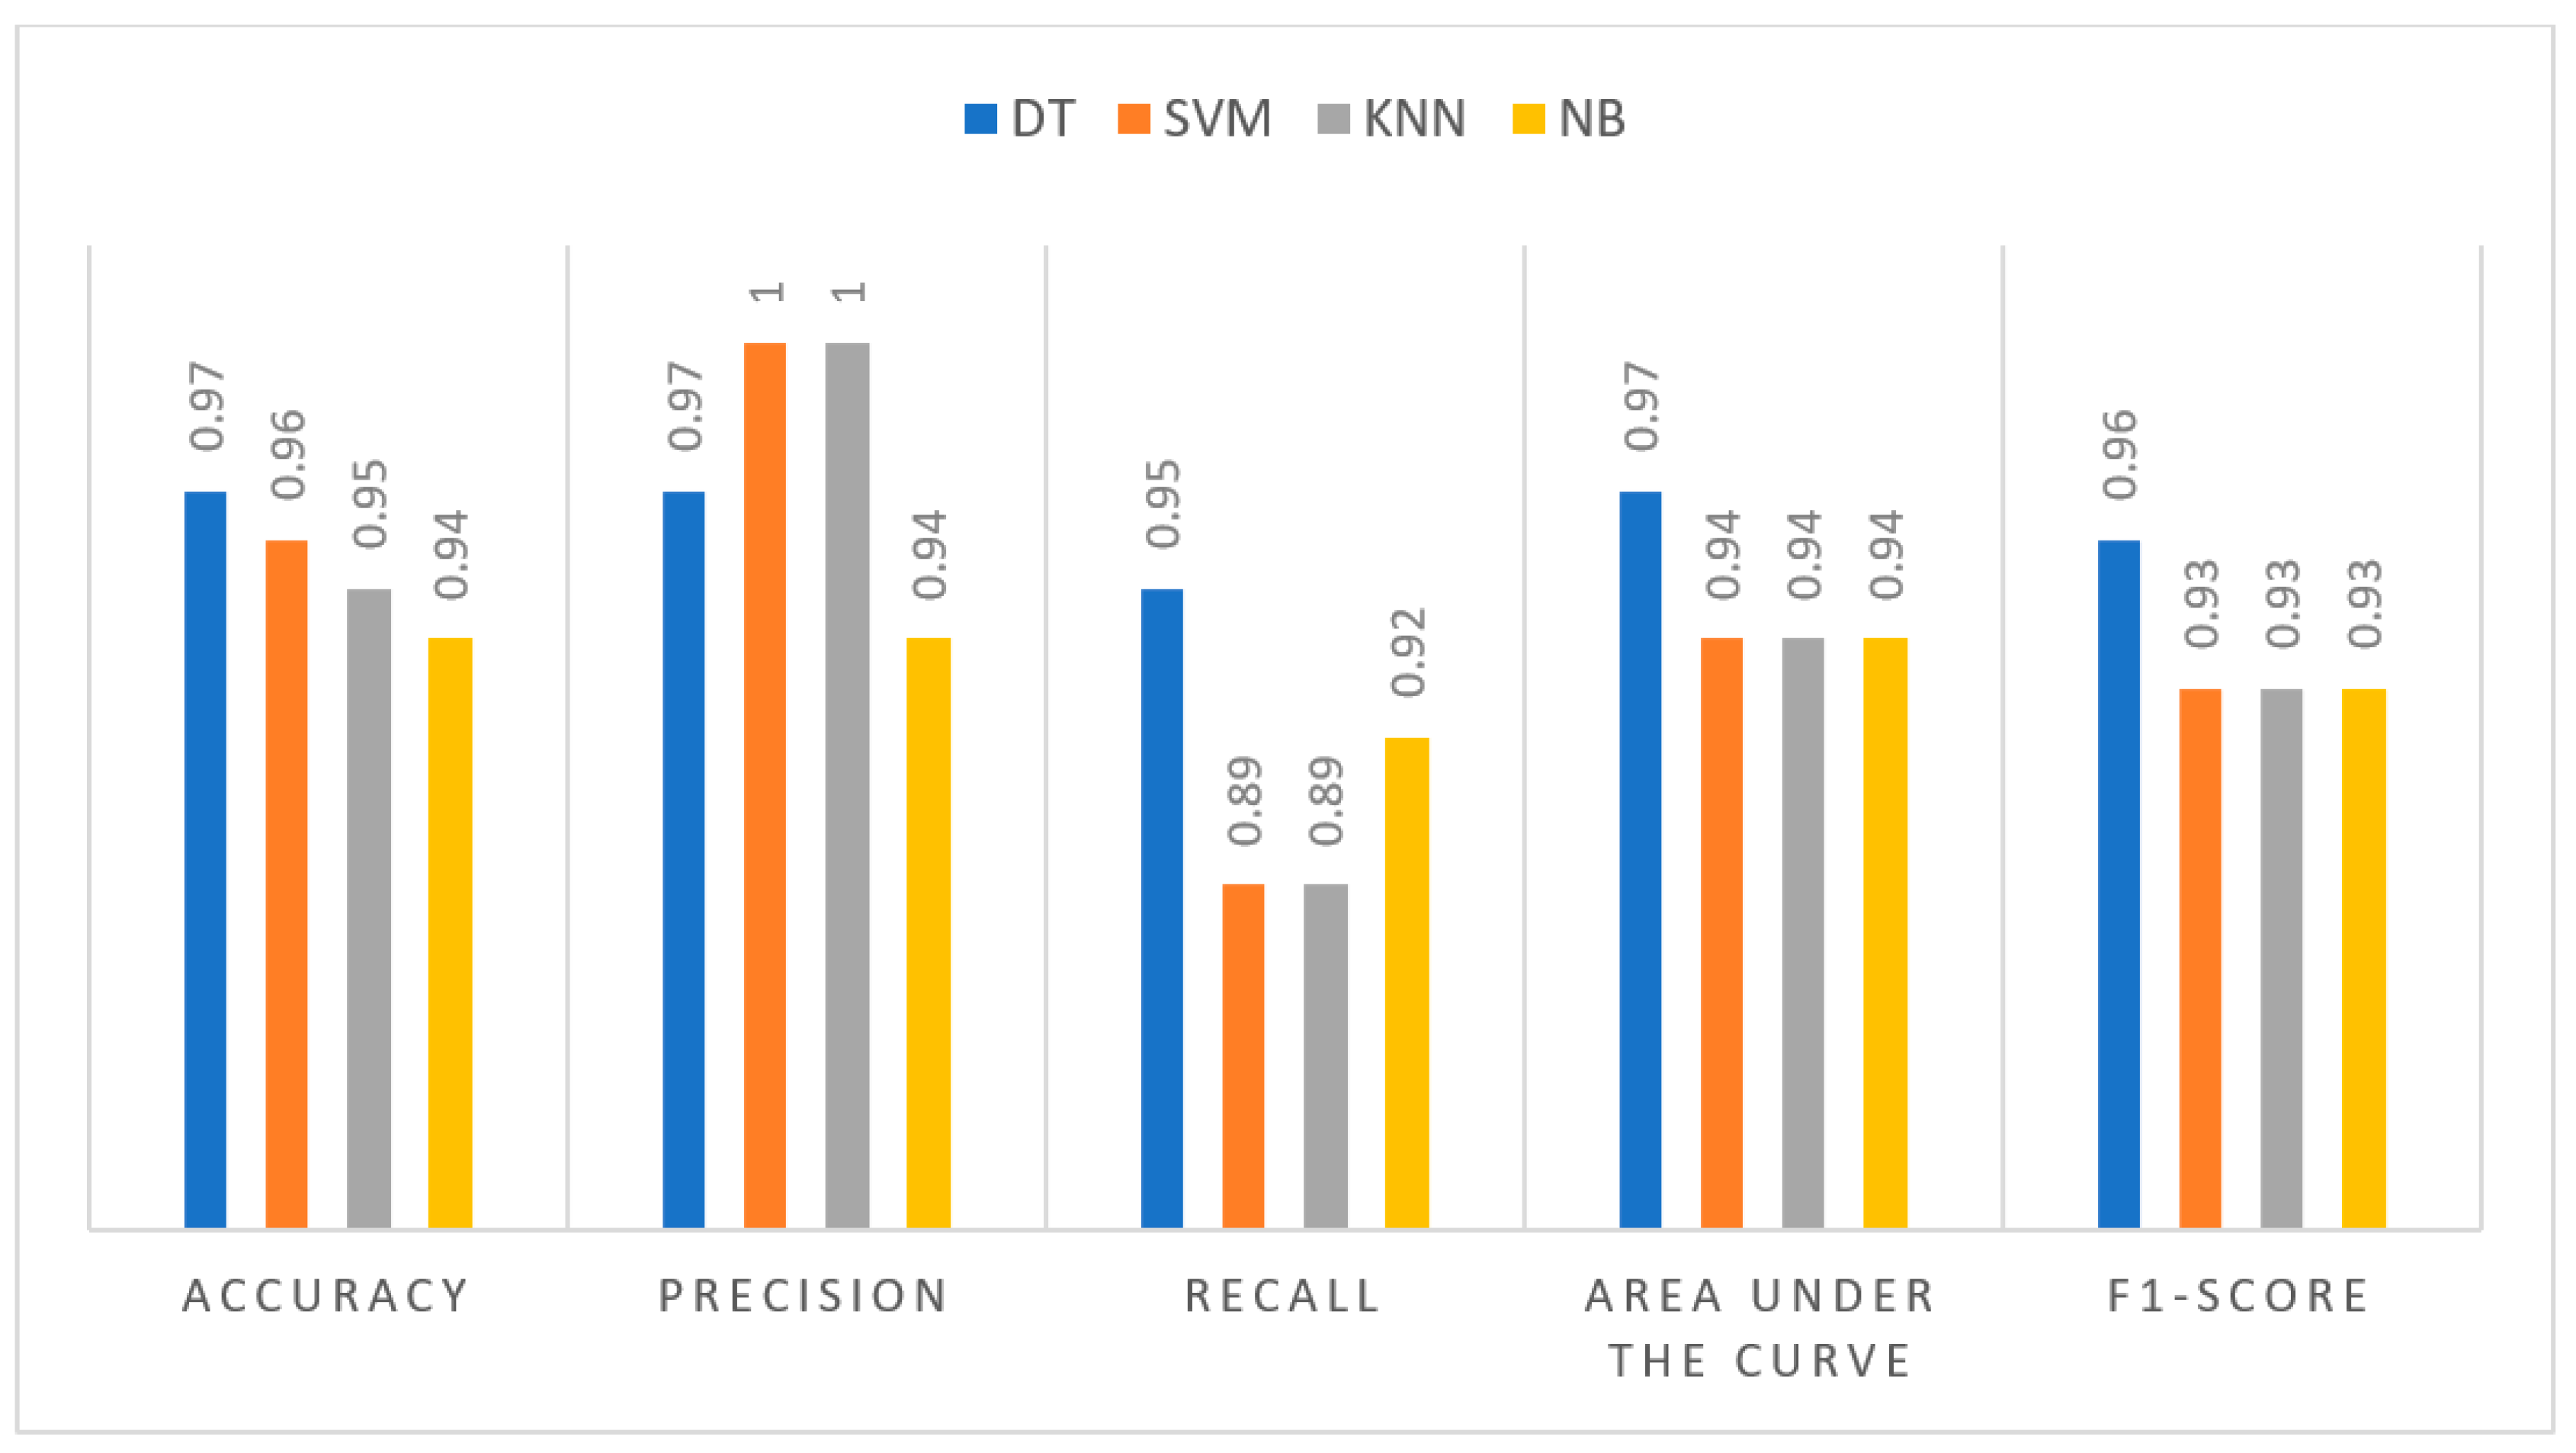
A comparative analysis of DT, SVM, and KNN classifiers for a BREAST-CAD system revealed nuanced performance differences (Figure 10 and Table 4). While all models demonstrated comparable accuracy (DT: 0.97, SVM: 0.96, KNN: 0.95, NB: 0.94), indicating general proficiency, notable variations emerged in precision and recall. SVM and KNN exhibited perfect precision (1.0). The DT classifier achieved an F1-score of 0.96, which is the highest. This suggests that the DT classifier likely identified a greater proportion of true positives, even with a slight increase in false positives. Consequently, while SVM and KNN may be preferable in contexts prioritizing the minimization of false positives, the DT classifier appears to offer a superior compromise between precision and recall, potentially making it a more robust choice for the BREAST-CAD system design, particularly given the importance of maximizing true identifications in medical diagnostic applications.
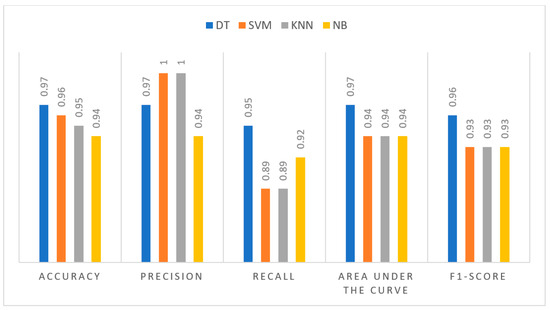
Figure 10.
Performance results of the ML model comparison.

Table 4.
Performance results of DT, KNN, NB and SVM models.
4.3. The BREAST-CAD Design Results
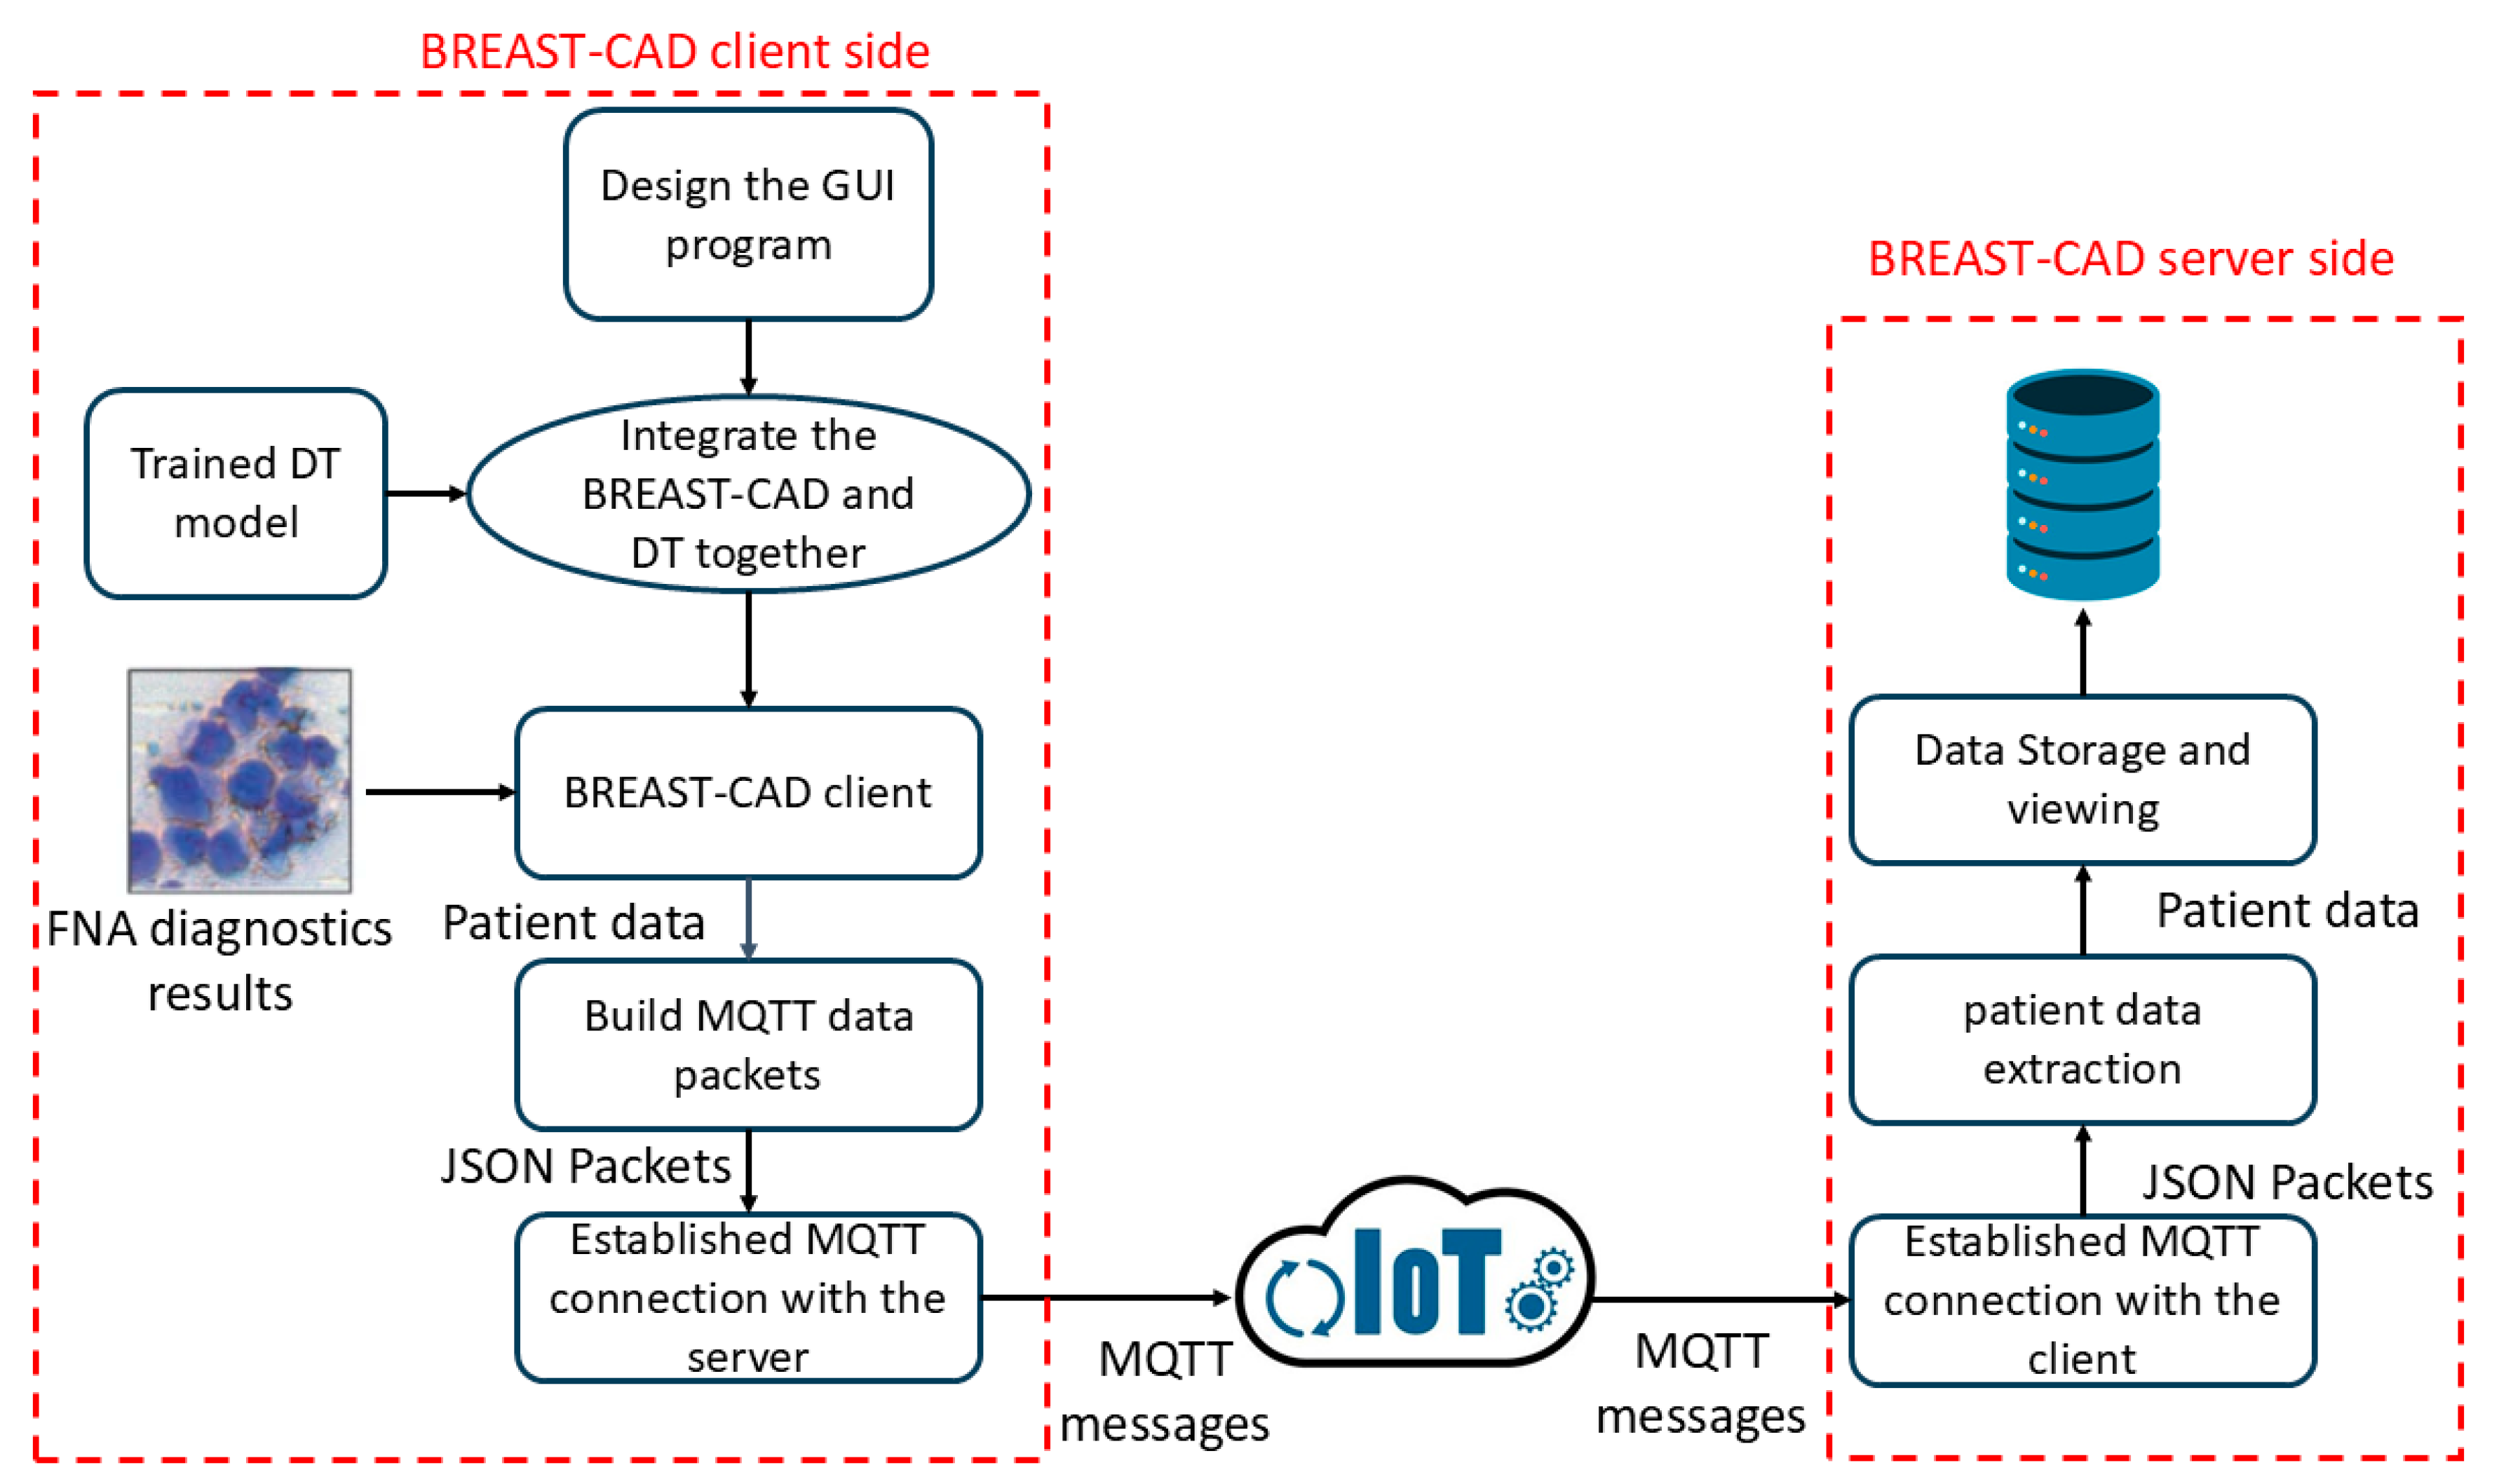
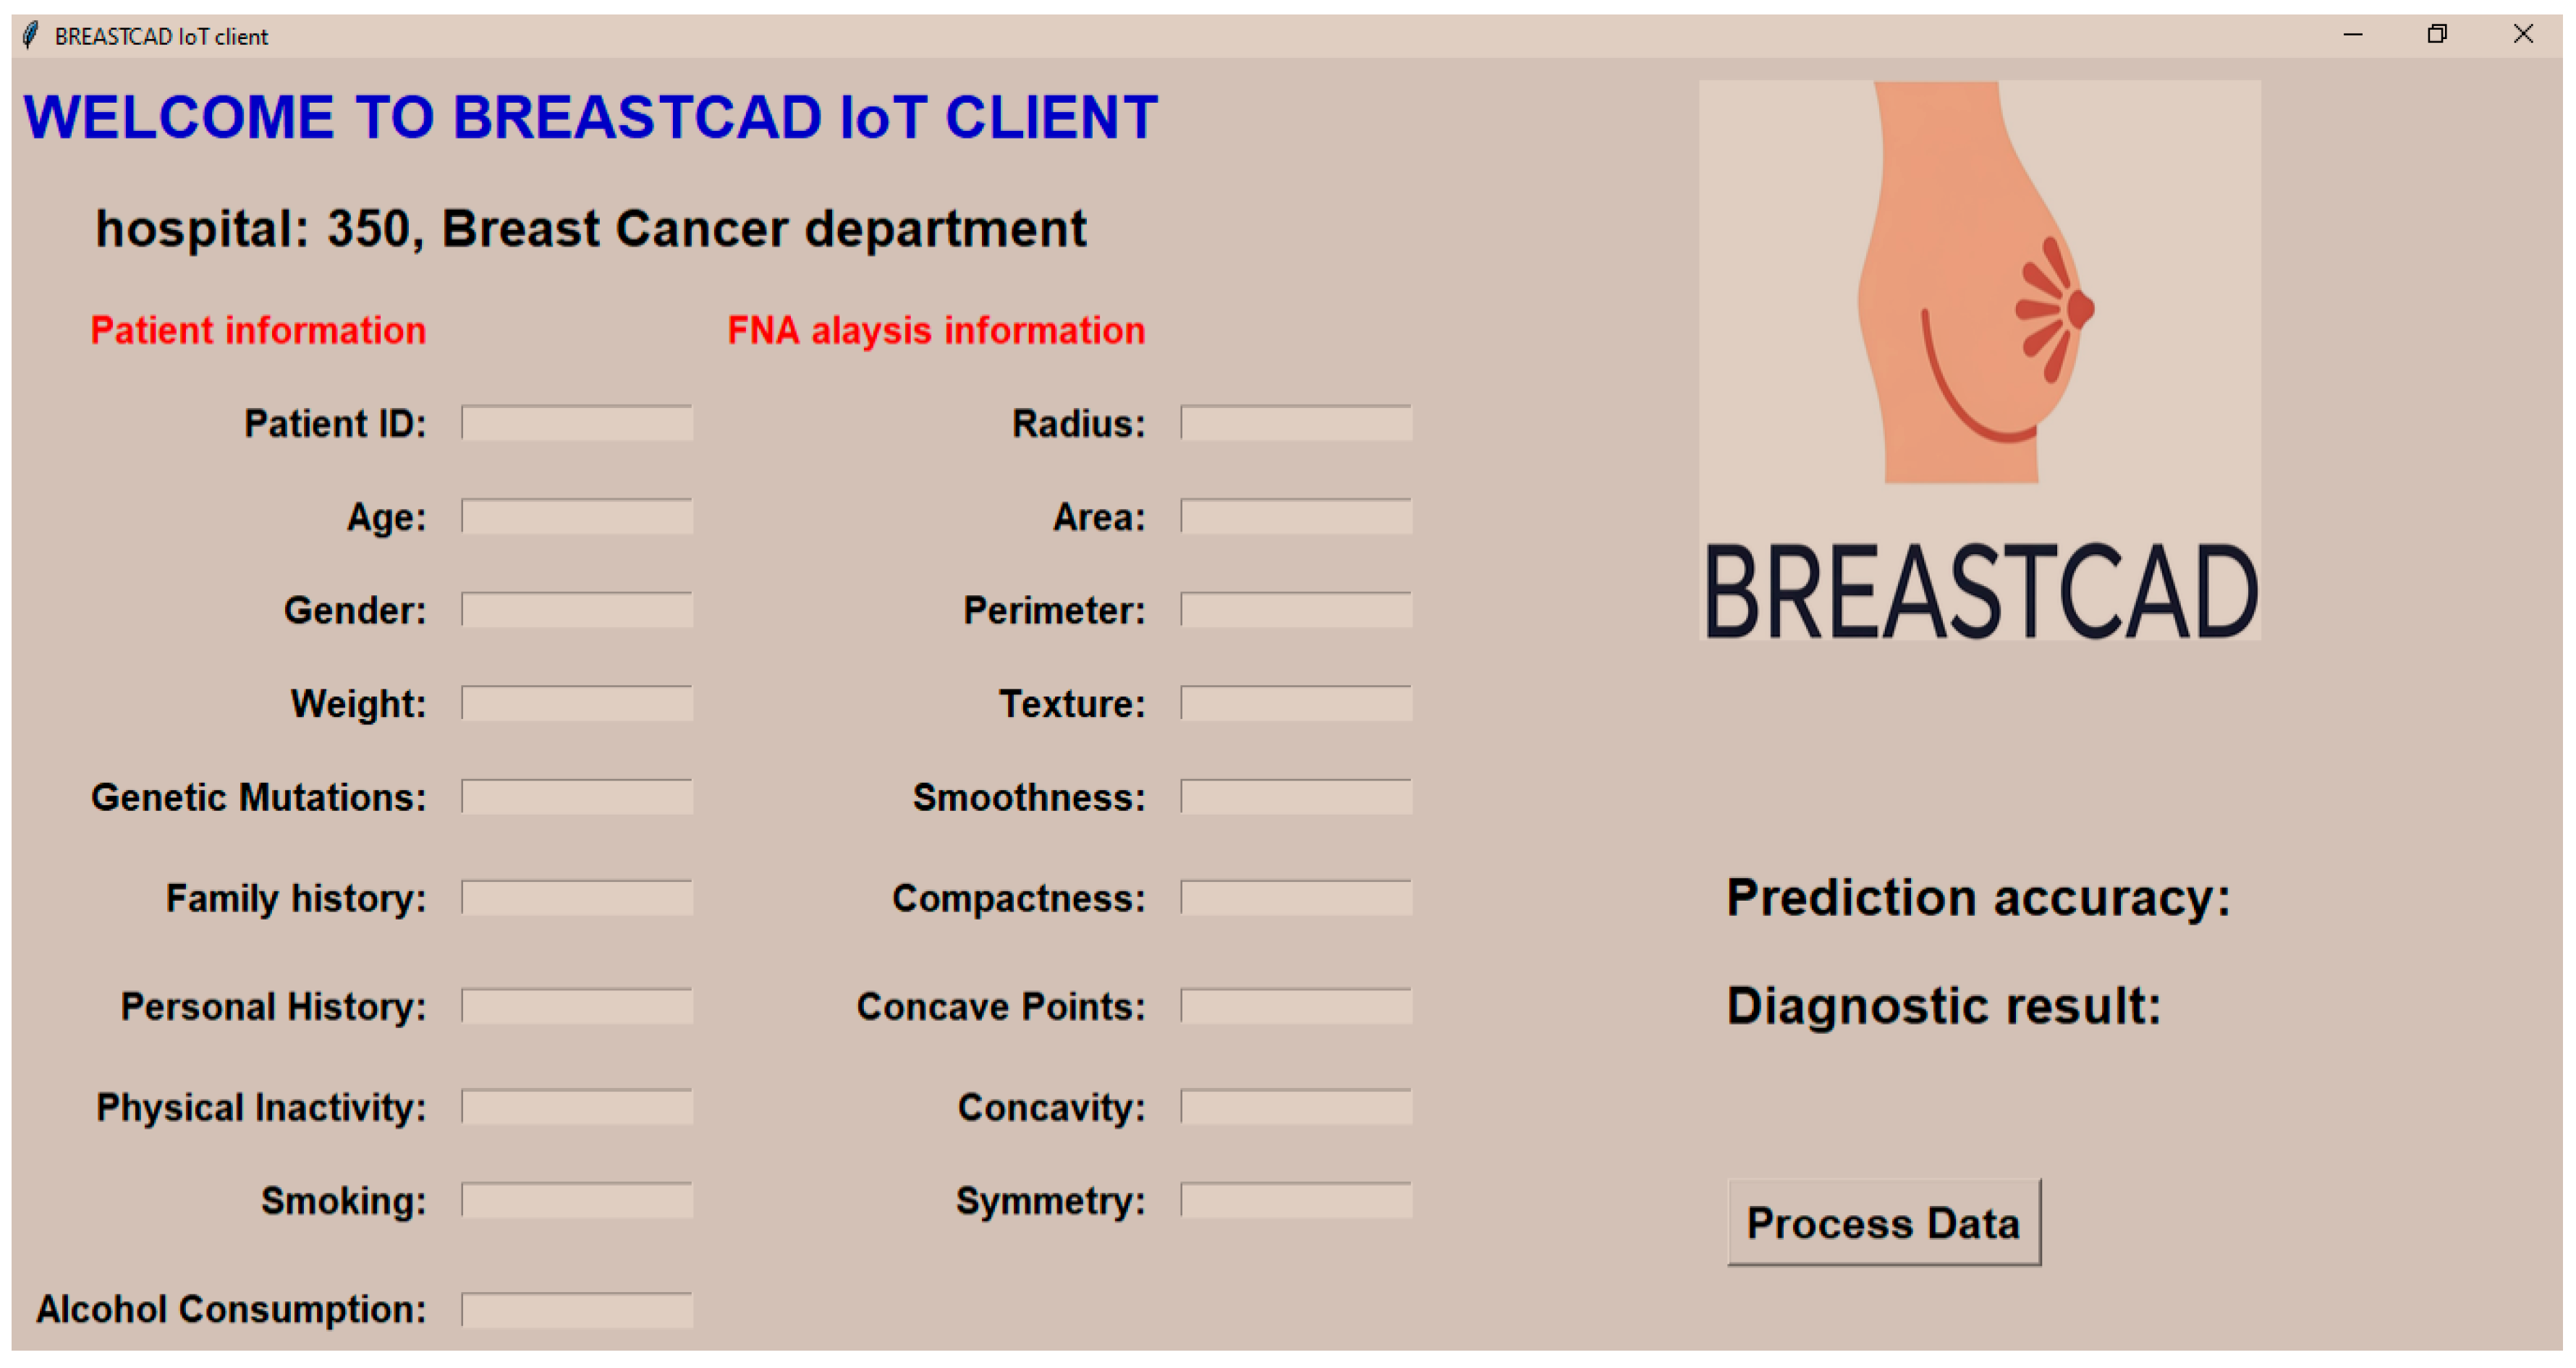
This phase of the research integrates a comprehensive three-stage methodology, as depicted in Figure 11. Initially, a GUI-based program was developed to function as the BREAST-CAD client, as illustrated in Figure 12. This client consolidates a pre-trained DT model, forming a unified breast cancer diagnostic framework.
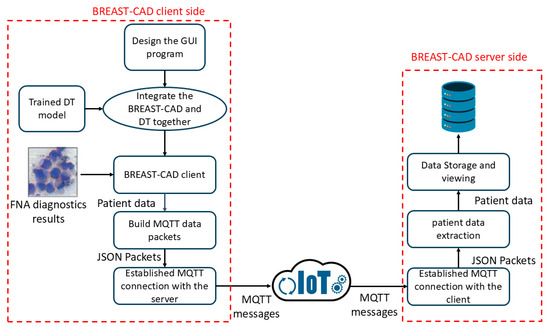
Figure 11.
The BREAST-CAD diagram.
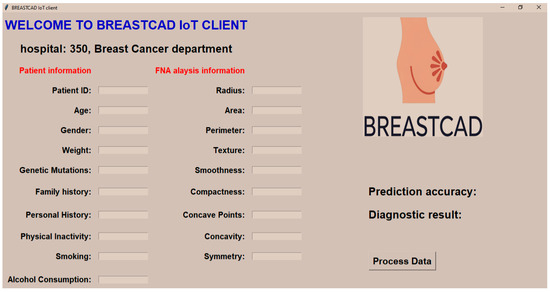
Figure 12.
BREAST-CAD client software interface.
The WDBC dataset, though integral to this phase, contains only FNA diagnostic results. To enhance the system’s utility beyond the dataset’s scope, the design incorporates additional variables that influence the risk of breast cancer. These factors include both modifiable (e.g., “alcohol consumption, smoking, physical inactivity, obesity, dietary habits”) and non-modifiable (e.g., “genetic mutations like BRCA1/BRCA2, family history, personal history of benign breast conditions”) determinants. In this context, clinicians are prompted to input both the FNA diagnostic results and these relevant modifiable and non-modifiable risk factors into the BREAST-CAD client.
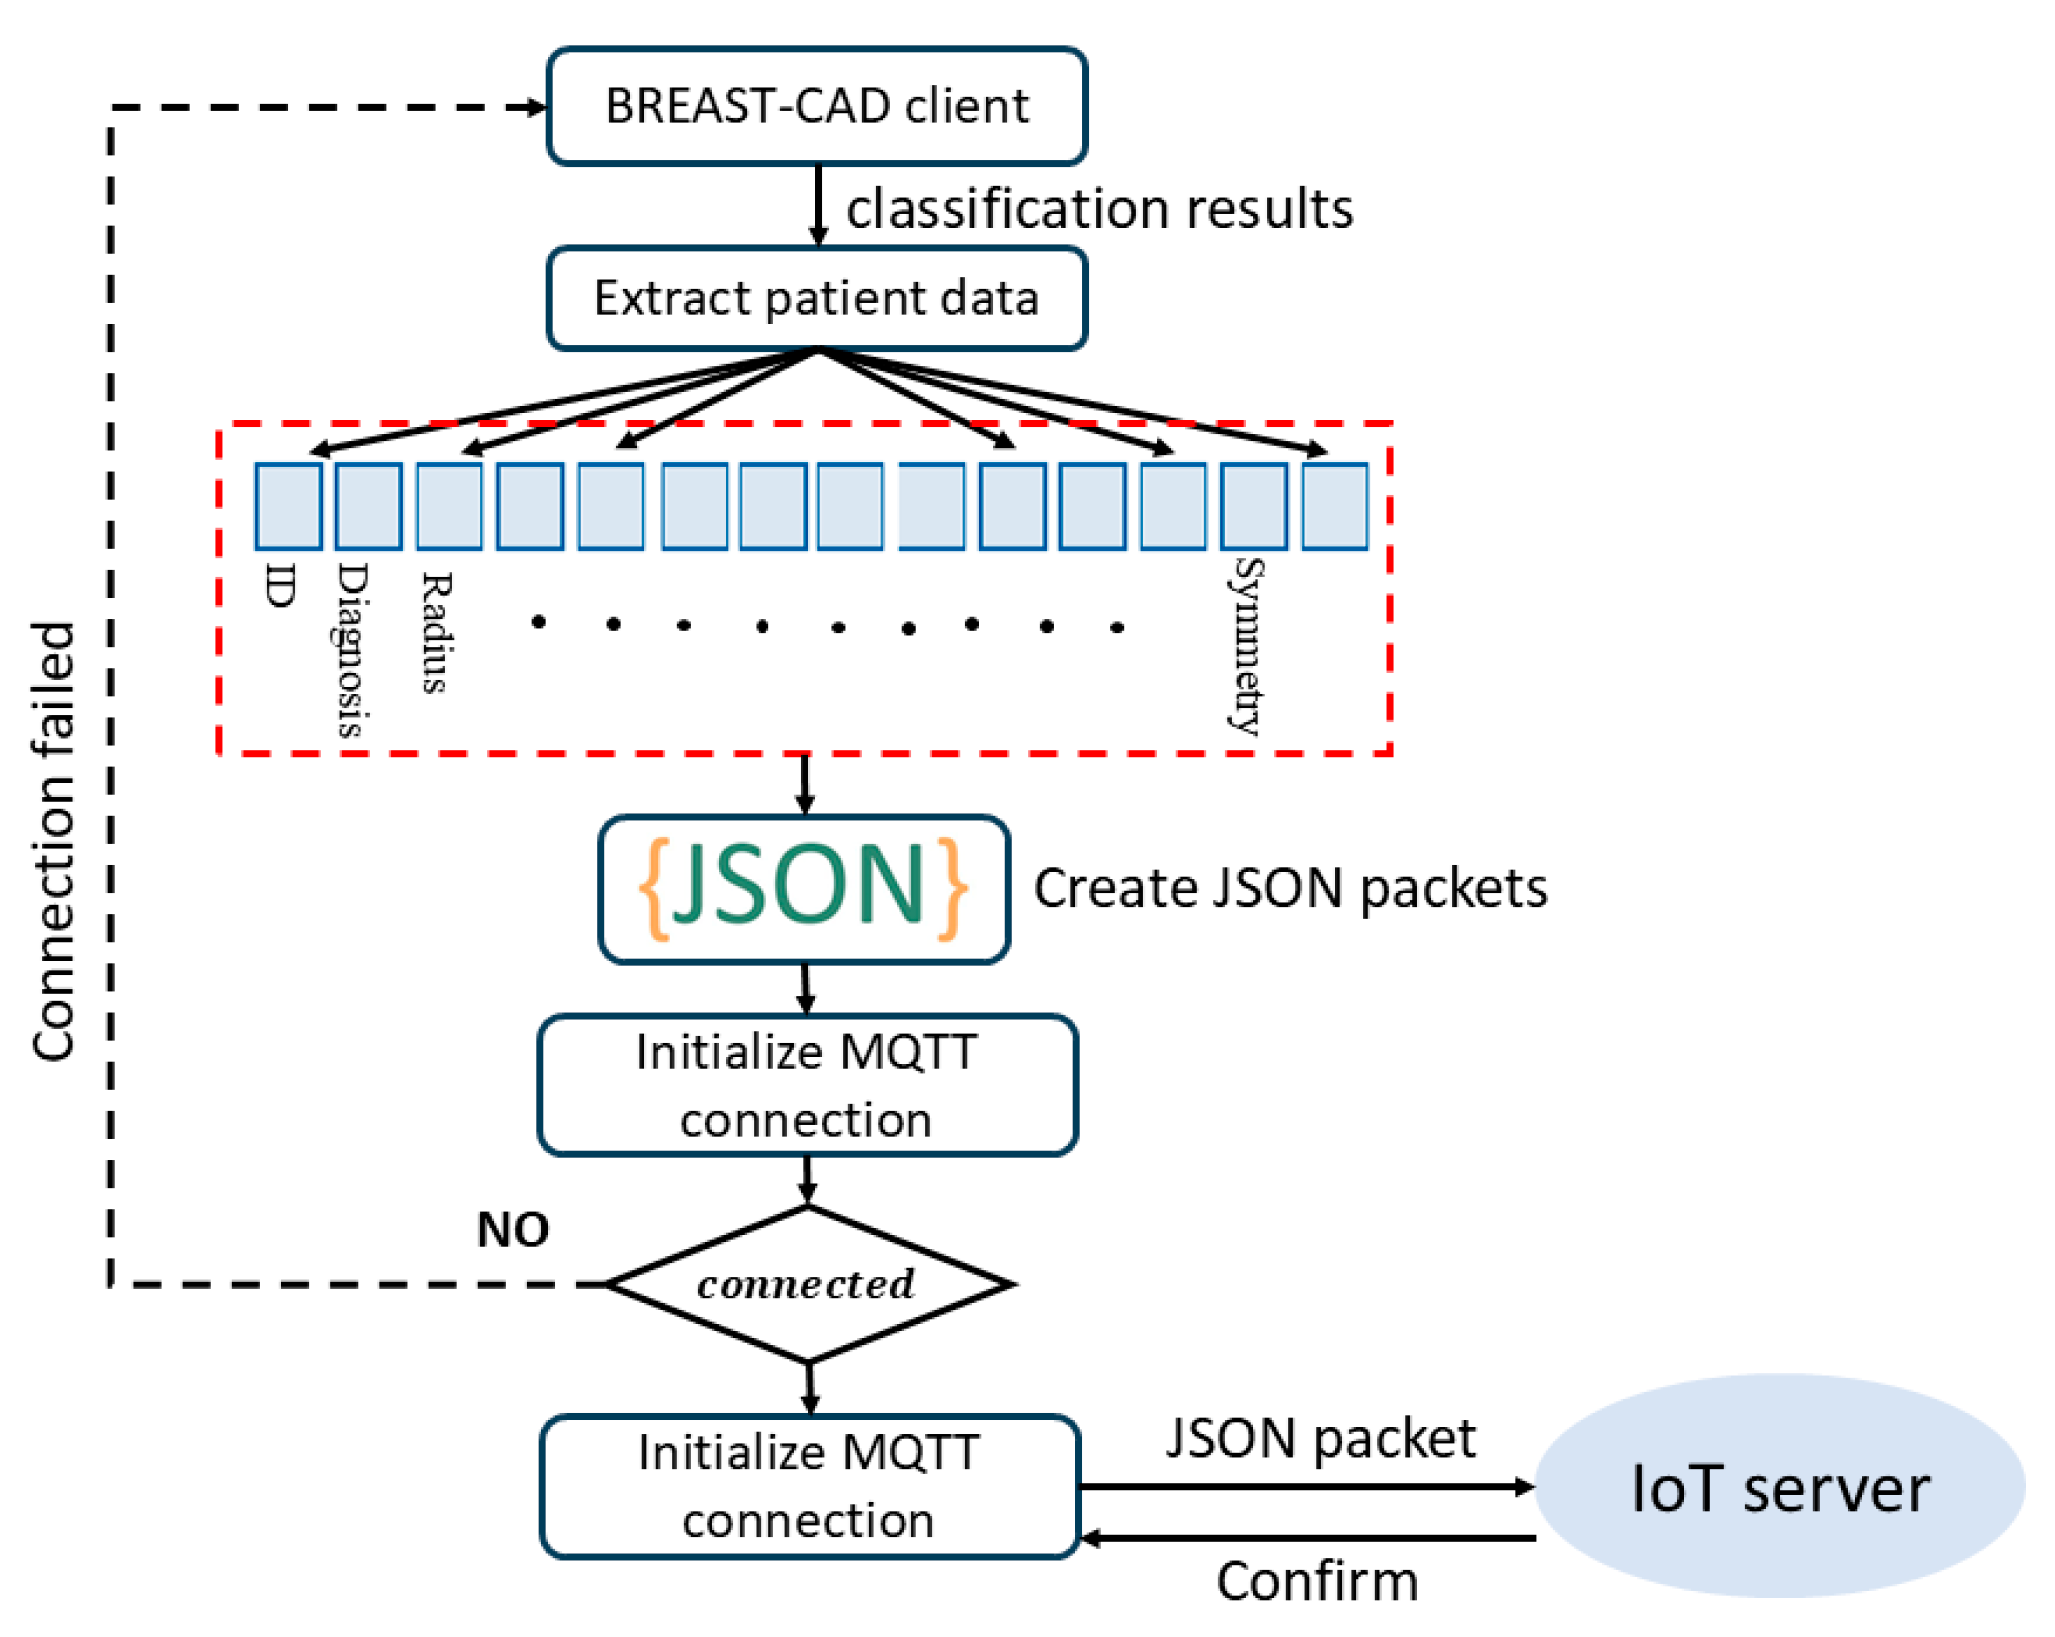
In the subsequent stage, the second phase of the system architecture entails the establishment of a secure client connection, facilitating the transmission of patient data to the BREAST-CAD server. As depicted in Figure 13, this connection is established by the BREAST-CAD client, initiating a connection request to the designated BREAST-CAD server, commonly referred to as the MQTT broker [39]. The client transmits a CONNECT message containing essential credentials and connection parameters, such as client ID and keep-alive intervals, to the broker. Upon receipt of this request, the broker authenticates the client’s credentials and connection settings, responding with a CONNACK message that indicates the success or failure of the connection. Once the connection is established, the client maintains a persistent session, subscribing to relevant topics, and the broker facilitates message publishing and reception as per the subscription protocols. The connection remains alive through periodic keep-alive signals, ensuring continuous communication between the client and server.
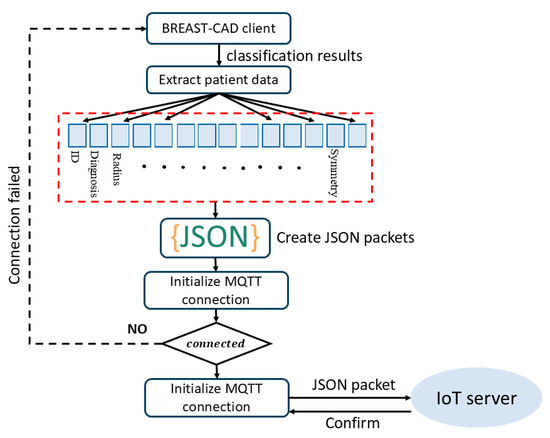
Figure 13.
MQTT connection operation diagram.
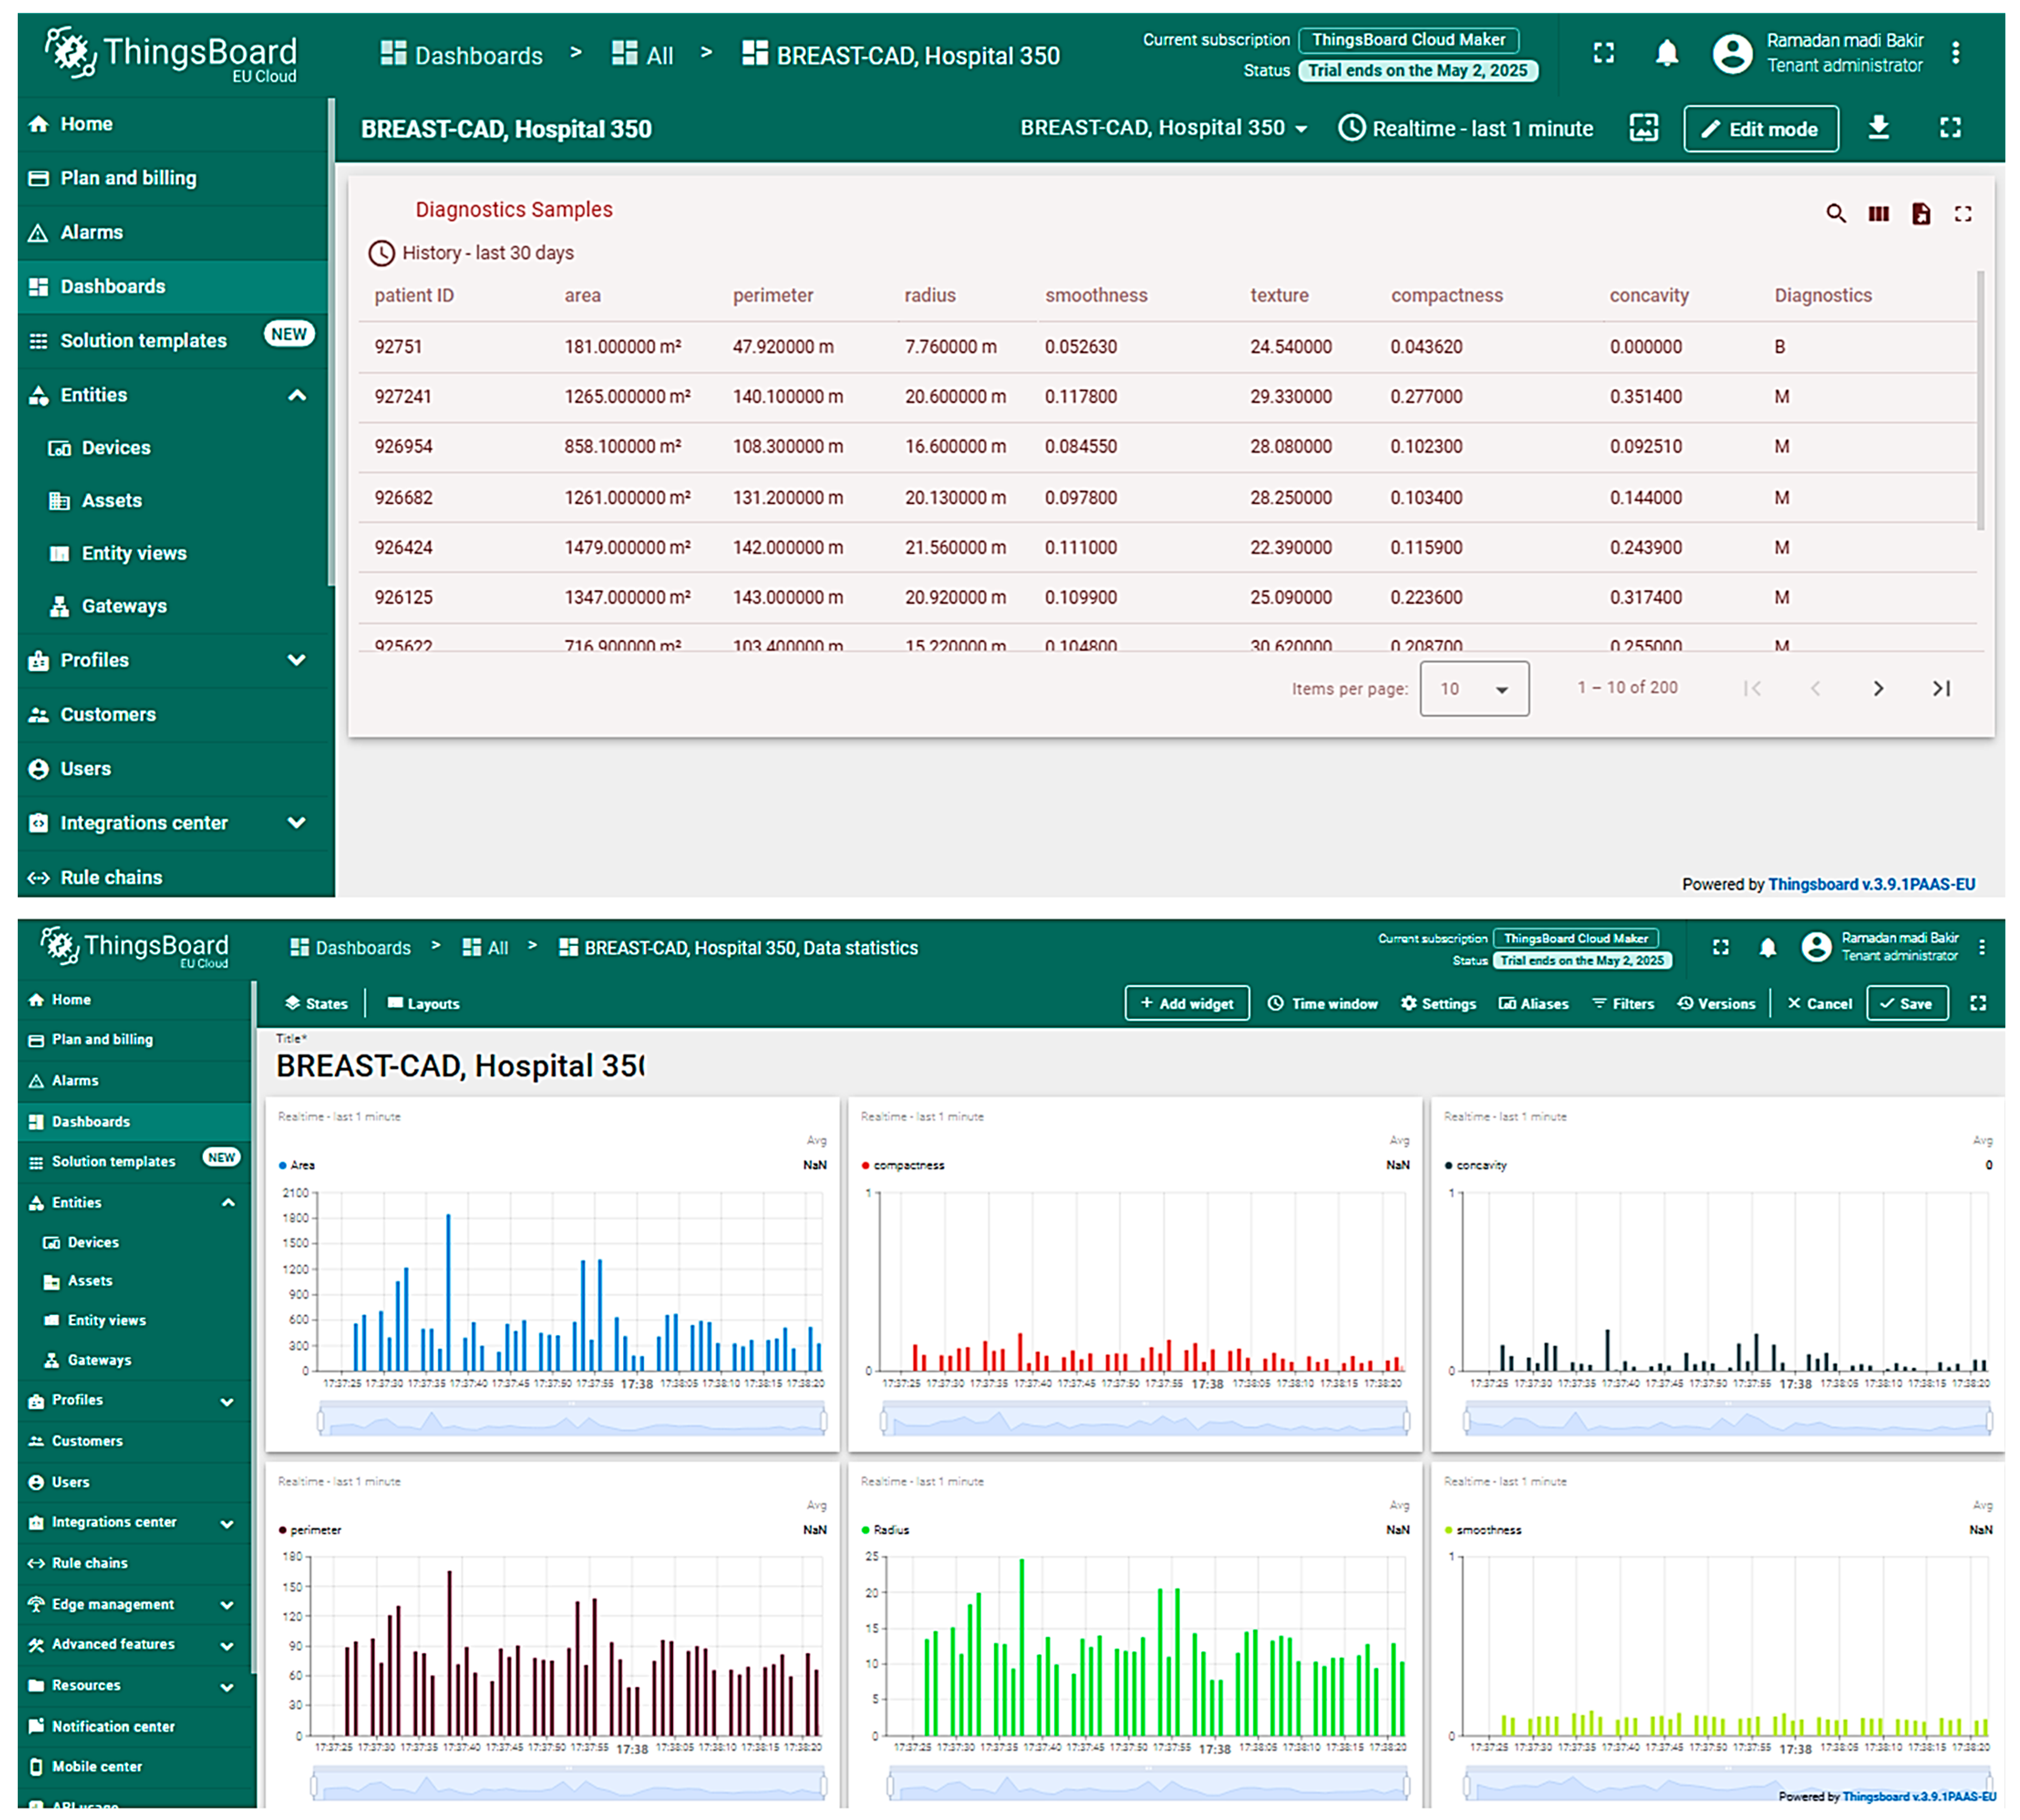
Upon the establishment of the connection, the BREAST-CAD client program formulates a JSON (JavaScript Object Notation) data packet, encapsulating the patient’s information and FNA analysis results, as shown in Figure 14. This packet is subsequently transmitted to the BREAST-CAD server. Upon receipt at the server, the JSON packet is unpacked, with patient data extracted and stored in the corresponding hospital’s dataset. Figure 15 illustrates the successful publication of data for 10% of the WDBC dataset, showcasing the integration of the BREAST-CAD client with the server and providing statistical analysis of FNA features about breast cancer malignancy. This multi-stage process facilitates real-time data transmission and processing, demonstrating the potential of networked diagnostic systems in breast cancer detection.

Figure 14.
The patient diagnostic information transmitted in JSON data packets through the BREAST-CAD system.
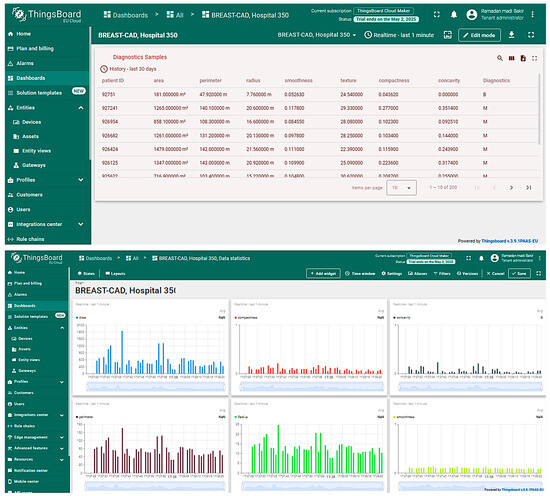
Figure 15.
The BREAST-CAD IoT server.
5. Conclusions and Future Work
This research introduces BREAST-CAD, a novel CAD system designed to aid in breast cancer detection through ML and real-time remote support. The study followed a clear three-step process. First, we conducted a comprehensive literature review between 2000 and 2024 to select the WDBC dataset and ML models: DT, SVM, KNN, and NB. After carefully preparing and testing these models, the DT model performed the best, achieving an accuracy of 97% and an F1-score of 0.96. This top-performing model was then built into a user-friendly client application.
This client application allows clinicians to input cell characteristics and relevant risk factors, with the diagnoses securely transmitted to a central server using MQTT, enabling real-time diagnostic support from anywhere. While BREAST-CAD presents an innovative approach to enhancing diagnostic capabilities, it does have some limitations. It currently relies on a single dataset, has not yet undergone validation in a real clinical setting, and requires manual input of risk factors; furthermore, the transmission of sensitive data necessitates the further enhancement of security measures. Future work will focus on extensive clinical validation in hospital environments, incorporating more diverse datasets (including imaging data), automating feature extraction, bolstering system security, and integrating adaptive learning techniques to improve scalability and diagnostic accuracy over time.
Author Contributions
Conceptualization, methodology, software, data analysis, discussion, writing—original draft preparation: R.M.M., R.M.A.B., M.S.S. and S.M.A.; literature review: R.M.M.; data downloading: R.M.A.B.; writing—review and editing: R.M.M., R.M.A.B., M.S.S. and S.M.A.; visualization: R.M.M. and R.M.A.B.; supervision: M.S.S. and S.M.A. All authors have read and agreed to the published version of the manuscript.
Funding
This research received no external funding.
Institutional Review Board Statement
Not available.
Informed Consent Statement
The authors declare that they have no known competing financial interests or personal relationships that could have appeared to influence the work reported in this paper.
Data Availability Statement
Data will be made available on request.
Conflicts of Interest
The authors declare that they have no conflicts of interest.
References
- Shahid, M.S.; Imran, A. Breast cancer detection using deep learning techniques: Challenges and future directions. Multimed. Tools Appl. 2025, 84, 3257–3304. [Google Scholar] [CrossRef]
- Ahuja, A.; Al-Zogbi, L.; Krieger, A. Application of noise-reduction techniques to machine learning algorithms for breast cancer tumor identification. Comput. Biol. Med. 2021, 135, 104576. [Google Scholar] [CrossRef] [PubMed]
- Ayyad, S.M.; Badawy, M.A.; Shehata, M.; Alksas, A.; Mahmoud, A.; El-Ghar, M.A.; Ghazal, M.; El-Melegy, M.; Abdel-Hamid, N.B.; Labib, L.M.; et al. A New Framework for Precise Identification of Prostatic Adenocarcinoma. Sensors 2022, 22, 1848. [Google Scholar] [CrossRef]
- Ayyad, S.M.; Shehata, M.; Alksas, A.; Badawy, M.A.; Mahmoud, A.H.; El-Ghar, M.A.; Ghazal, M.; El-Melegy, M.; Abdel-Hamid, N.B.; Labib, L.M.; et al. A Multimodal MR-Based CAD System for Precise Assessment of Prostatic Adenocarcinoma; Handbook of Texture Analysis; CRC Press: Boca Raton, FL, USA, 2024; pp. 209–224. [Google Scholar]
- Mendes, J.; Domingues, J.; Aidos, H.; Garcia, N.; Matela, N. AI in Bsreast Cancer Imaging: A Survey of Different Applications. J. Imaging 2022, 8, 228. [Google Scholar] [CrossRef] [PubMed]
- Balaha, H.M.; Ayyad, S.M.; Alksas, A.; Shehata, M.; Elsorougy, A.; Badawy, M.A.; El-Ghar, M.A.; Mahmoud, A.; Alghamdi, N.S.; Ghazal, M.; et al. Precise Prostate Cancer Assessment Using IVIM-Based Parametric Estimation of Blood Diffusion from DW-MRI. Bioengineering 2024, 11, 629. [Google Scholar] [CrossRef]
- Jeleń, Ł.; Krzyżak, A.; Fevens, T.; Jeleń, M. Influence of feature set reduction on breast cancer malignancy classification of fine needle aspiration biopsies. Comput. Biol. Med. 2016, 79, 80–91. [Google Scholar] [CrossRef]
- Chakravarthy, S.R.S.; Bharanidharan, N.; Rajaguru, H. Deep Learning-Based Metaheuristic Weighted K-Nearest Neighbor Algorithm for the Severity Classification of Breast Cancer. IRBM 2023, 44, 100749. [Google Scholar] [CrossRef]
- Halid, A.; Arsa, I.G.N.W.; Azdy, R.A.; Permana, A.A.J. Development of a Decision Tree Classifier for Breast Cancer Diagnosis Using Fine Needle Aspirate Data. Indones. J. Data Sci. 2024, 5, 229–236. [Google Scholar] [CrossRef]
- Asri, H.; Mousannif, H.; Al Moatassim, H. A Hybrid Data Mining Classifier for Breast Cancer Prediction. In Advanced Intelligent Systems for Sustainable Development (AI2SD’2019) Volume 2-Advanced Intelligent Systems for Sustainable Development Applied to Agriculture and Health; Springer International Publishing: Cham, Switzerland, 2019; pp. 9–16. [Google Scholar] [CrossRef]
- Benbrahim, H.; Hachimi, H.; Amine, A. Comparative Study of Machine Learning Algorithms Using the Breast Cancer Dataset. Adv. Intell. Syst. Comput. 2020, 2, 83–91. [Google Scholar] [CrossRef]
- Khrouch, S.; Ezziyyani, M.; Ezziyyani, M. Decision System for the Selection of the Best Therapeutic Protocol for Breast Cancer Based on Genetic Algorithm. Adv. Intell. Syst. Comput. 2020, 2, 115–120. [Google Scholar] [CrossRef]
- Houfani, D.; Slatnia, S.; Kazar, O.; Zerhouni, N.; Merizig, A.; Saouli, H. Machine Learning Techniques for Breast Cancer Diagnosis: Literature Review. Adv. Intell. Syst. Comput. 2020, 2, 247–254. [Google Scholar] [CrossRef]
- Abdel-Ilah, L.; Šahinbegović, H. Using machine learning tool in classification of breast cancer. IFMBE Proc. 2017, 62, 3–8. [Google Scholar] [CrossRef]
- Osmanović, A.; Halilović, S.; Ilah, L.A.; Fojnica, A.; Gromilić, Z. Machine Learning Techniques for Classification of Breast Cancer. In Proceedings of the World Congress on Medical Physics and Biomedical Engineering 2018, Prague, Czech Republic, 3–8 June 2018; pp. 197–200. [Google Scholar] [CrossRef]
- Sadhukhan, S.; Upadhyay, N.; Chakraborty, P. Breast Cancer Diagnosis Using Image Processing and Machine Learning. Adv. Intell. Syst. Comput. 2019, 937, 113–127. [Google Scholar] [CrossRef]
- Sizilio, G.R.; Leite, C.R.; Guerreiro, A.M.; Neto, A.D.D. Fuzzy method for pre-diagnosis of breast cancer from the Fine Needle Aspirate analysis. Biomed. Eng. OnLine 2012, 11, 83. [Google Scholar] [CrossRef] [PubMed]
- Hoang, Q.H.; Duong, L.M.; Le, P.; Tran, A.V.; Nguyen, T.A.; Nguyen, V.D. A Comparative Study of Machine Learning Algorithms for Breast Cancer Classification. In Proceedings of the 2023 International Conference on Advanced Technologies for Communications (ATC), Da Nang, Vietnam, 19–21 October 2023. [Google Scholar] [CrossRef]
- Alsaedi, M.; Fevens, T.; Krzyzak, A.; Jelen, L. Cytological malignancy grading systems for fine needle aspiration biopsies of breast cancer. In Proceedings of the 2021 IEEE International Conference on Bioinformatics and Biomedicine (BIBM) 2017, Kansas City, MO, USA, 13–16 November 2017; pp. 705–709. [Google Scholar] [CrossRef]
- Ara, S.; Das, A.; Dey, A. Malignant and Benign Breast Cancer Classification Using Machine Learning Algorithms. IEEE Xplore. Available online: https://ieeexplore.ieee.org/stamp/stamp.jsp?tp=&arnumber=9445249 (accessed on 1 April 2021).
- Asri, H.; Mousannif, H.; Moatassime, H.A.; Noel, T. Using Machine Learning Algorithms for Breast Cancer Risk Prediction and Diagnosis. Procedia Comput. Sci. 2016, 83, 1064–1069. [Google Scholar] [CrossRef]
- Liu, S.; Zeng, J.; Wang, Y.; Yang, H.; Li, Y.; Maguire, L.; Zhai, J.; Cao, Y.; Ding, X. Bayesian network modelling on data from fine needle aspiration cytology examination for breast cancer diagnosis. Surrey Open Res. Repos. (Univ. Surrey) 2017, 130, 409–412. [Google Scholar] [CrossRef][Green Version]
- Shafique, R.; Rustam, F.; Choi, G.S.; Díez, I.d.l.T.; Mahmood, A.; Lipari, V.; Velasco, C.L.R.; Ashraf, I. Breast Cancer Prediction Using Fine Needle Aspiration Features and Upsampling with Supervised Machine Learning. Cancers 2023, 15, 681. [Google Scholar] [CrossRef]
- Bhardwaj, A.; Bhardwaj, H.; Sakalle, A.; Uddin, Z.; Sakalle, M.; Ibrahim, W. Tree-Based and Machine Learning Algorithm Analysis for Breast Cancer Classification. Comput. Intell. Neurosci. 2022, 2022, 1–6. [Google Scholar] [CrossRef]
- Chen, H.; Wang, N.; Du, X.; Mei, K.; Zhou, Y.; Cai, G. Classification Prediction of Breast Cancer Based on Machine Learning. Comput. Intell. Neurosci. 2023, 2023, 1–9. [Google Scholar] [CrossRef]
- Degadwala, S.; Vyas, D.; Upadhyay, S.; Upadhyay, R.; Patel, H.S. Determine the Degree of Malignancy in Breast Cancer using Machine Learning. In Proceedings of the 2023 7th International Conference on I-SMAC (IoT in Social, Mobile, Analytics and Cloud) (I-SMAC), Kirtipur, Nepal, 11–13 October 2023; pp. 483–487. [Google Scholar] [CrossRef]
- Thakur, A.; Chauhan, S.; Gupta, A.; Choubey, A.K.; Krishnan, C. Enhancing Breast Cancer Detection via Optimized Machine Learning. In Proceedings of the 2024 4th International Conference on Innovative Practices in Technology and Management (ICIPTM), Noida, India, 21–23 February 2024; pp. 1–5. [Google Scholar] [CrossRef]
- Fiuzy, M.; Haddadnia, J.; Mollania, N.; Hashemian, M.; Hassanpour, K. Introduction of a New Diagnostic Method for Breast Cancer Based on Fine Needle Aspiration (FNA) Test Data and Combining Intelligent Systems. PubMed 2012, 5, 169–177. [Google Scholar]
- Islam, R.; Tarique, M. Artificial Intelligence (AI) and Nuclear Features from the Fine Needle Aspirated (FNA) Tissue Samples to Recognize Breast Cancer. J. Imaging 2024, 10, 201. [Google Scholar] [CrossRef]
- Wei, Y.; Zhang, D.; Gao, M.; Tian, Y.; He, Y.; Huang, B.; Zheng, C. Breast Cancer Prediction Based on Machine Learning. J. Softw. Eng. Appl. 2023, 16, 348–360. [Google Scholar] [CrossRef]
- Al Reshan, M.S.; Amin, S.; Zeb, M.A.; Sulaiman, A.; Alshahrani, H.; Azar, A.T.; Shaikh, A. Enhancing Breast Cancer Detection and Classification Using Advanced Multi-Model Features and Ensemble Machine Learning Techniques. Life 2023, 13, 2093. [Google Scholar] [CrossRef] [PubMed]
- Liu, B.; Li, X.; Li, J.; Li, Y.; Lang, J.; Gu, R.; Wang, F. Comparison of Machine Learning Classifiers for Breast Cancer Diagnosis Based on Feature Selection. In Proceedings of the 2018 IEEE International Conference on Systems, Man, and Cybernetics (SMC), Miyazaki, Japan, 7–10 October 2018; pp. 4399–4404. [Google Scholar] [CrossRef]
- Omondiagbe, D.A.; Veeramani, S.; Sidhu, A.S. Machine Learning Classification Techniques for Breast Cancer Diagnosis. IOP Conf. Ser. Mater. Sci. Eng. 2019, 495, 012033. [Google Scholar] [CrossRef]
- Swamy V, K.; Anusha, A.M. Performance Based Features for Classification of Cancer Using Images of Breast Mass Through Fine Needle Aspirate. In Proceedings of the 2023 4th IEEE Global Conference for Advancement in Technology (GCAT), Bangalore, India, 6–8 October 2023; pp. 1–5. [Google Scholar] [CrossRef]
- Salama, G.I.; Abdelhalim, M.B.; Zeid, M.A. Experimental Comparison of Classifiers for Breast Cancer Diagnosis. IEEE Xplore. Available online: https://ieeexplore.ieee.org/document/6408508 (accessed on 1 November 2012).
- Zaylaa, A.J.; Kourtian, S. Advancing Breast Cancer Diagnosis through Breast Mass Images, Machine Learning, and Regression Models. Sensors 2024, 24, 2312. [Google Scholar] [CrossRef]
- Sewak, M.; Vaidya, P.; Chan, C.-C.; Duan, Z.-H. SVM Approach to Breast Cancer Classification. IEEE Xplore. Available online: https://ieeexplore.ieee.org/stamp/stamp.jsp?tp=&arnumber=4392577 (accessed on 1 August 2007).
- Sakri, S.B.; Rashid, N.B.A.; Zain, Z.M. Particle Swarm Optimization Feature Selection for Breast Cancer Recurrence Prediction. IEEE Access 2018, 6, 29637–29647. [Google Scholar] [CrossRef]
- Bakir, R.M.A.; Soliman, M.S.; Elksasy, M.S.; Saraya, M.S.; Abdelsalam, M.M. PRO-MATE IOT-Based Cost-Effective Ground Motion Monitoring Acceleration Sensor Node: Hardware and Software Description. IEEE Sens. Lett. 2023, 7, 1–4. [Google Scholar] [CrossRef]
Disclaimer/Publisher’s Note: The statements, opinions and data contained in all publications are solely those of the individual author(s) and contributor(s) and not of MDPI and/or the editor(s). MDPI and/or the editor(s) disclaim responsibility for any injury to people or property resulting from any ideas, methods, instructions or products referred to in the content. |
© 2025 by the authors. Licensee MDPI, Basel, Switzerland. This article is an open access article distributed under the terms and conditions of the Creative Commons Attribution (CC BY) license (https://creativecommons.org/licenses/by/4.0/).

