Article

Development of a Low-Cost Multi-Physiological Signal Simulation System for Multimodal Wearable Device Calibration

1
Department of Biomedical Engineering, Graduate School of Medicine, Keimyung University, Daegu 42601, Republic of Korea
2
Department of Biomedical Engineering, College of Engineering, Keimyung University, Daegu 42601, Republic of Korea
3
Clairaudience Co., Ltd., Daegu 42601, Republic of Korea
4
Division of Cardiology, Department of Internal Medicine, Keimyung University Dongsan Hospital, Keimyung University School of Medicine, Daegu 42601, Republic of Korea
*
Author to whom correspondence should be addressed.
These authors contributed equally to this work.
Technologies 2025, 13(6), 239; https://doi.org/10.3390/technologies13060239
Submission received: 25 April 2025 / Revised: 5 June 2025 / Accepted: 6 June 2025 / Published: 10 June 2025

Abstract

:
Using multimodal wearable devices to diagnose cardiovascular diseases early is essential for providing timely medical assistance, particularly in remote areas. This approach helps prevent risks and reduce mortality rates. However, prolonged use of medical devices can lead to measurement inaccuracies, necessitating calibration to maintain precision. Unfortunately, wearable devices often lack affordable calibrators that are suitable for personal use. This study introduces a low-cost simulation system for phonocardiography (PCG) and photoplethysmography (PPG) signals designed for a multimodal smart stethoscope calibration. The proposed system was developed using a multicore microprocessor (MCU), two digital-to-analog converters (DACs), an LED light, and a speaker. It synchronizes dual signals by assigning tasks based on a multitasking function. A designed time adjustment algorithm controls the pulse transit time (PTT) to simulate various cardiovascular conditions. The simulation signals are generated from preprocessed PCG and PPG signals collected during in vivo experiments. A prototype device was manufactured to evaluate performance by measuring the generated signal using an oscilloscope and a multimodal smart stethoscope. The preprocessed signals, generated signals, and measurements by the smart stethoscope were compared and evaluated through correlation analysis. The experimental results confirm that the proposed system accurately generates the features of the physiological signals and remains in phase with the original signals.

1. Introduction

Early detection of cardiovascular disease is crucial because timely management through counseling and medication can significantly improve patient outcomes and reduce mortality rates [1,2]. However, in rural and remote areas, early diagnosis is often ineffective or unavailable, and treatment is frequently delayed due to limited medical infrastructure, lack of services, and economic constraints. These issues lead to adverse health consequences, highlighting the urgent need for remote health monitoring systems that allow individuals in these regions to communicate with healthcare professionals [3,4]. Consequently, the use of IoT-based wearable health devices for self-diagnosis has gained popularity and shows significant potential for enhancing health monitoring.
Various cardiovascular physiological signals, such as electrocardiography (ECG), photoplethysmography (PPG), phonocardiography (PCG), blood pressure (BP) monitors, seismocardiography (SCG), and ballistocardiography (BCG), are now utilized in the development of wearable devices for monitoring cardiovascular status. Furthermore, multifunctional wearable health devices that incorporate two or more technologies are becoming increasingly common, providing more comprehensive monitoring options. These devices have proven highly effective in reducing cardiovascular disease-related mortality in remote areas [5,6,7,8,9,10,11]. Recent advances in wearable health monitoring have demonstrated the integration of nanomaterials, flexible electronics, and innovative energy management strategies to improve signal quality, user comfort, and system autonomy [12,13].
However, in low-income countries, health facilities in rural and remote areas often rely on donated and second-hand medical equipment due to limited resources and inadequate funding. Frequently, these devices are used beyond their intended lifespan, which decreases their accuracy and reliability. Furthermore, due to wear and aging, regular maintenance, inspection, and calibration are becoming increasingly important. Additionally, a shortage of qualified maintenance personnel and limited financial resources often restrict the ability to properly diagnose and calibrate equipment when needed. Consequently, the reliability of these devices decreases, negatively affecting the overall quality of healthcare services.
Therefore, regular calibration is necessary to verify the performance of these medical devices in those areas. Calibration ensures accuracy and effectiveness in diagnosis and treatment, contributing to the longevity of the devices. It helps detect and correct deviations or drifts in device performance, thus preventing potential risks and liabilities in the healthcare industry. Failure to calibrate medical devices can lead to inaccurate readings, misdiagnoses, incorrect dosages, and potentially life-threatening errors [14,15,16,17,18,19].
Consequently, calibration devices for each type of signal are rapidly being developed with distinct features. For instance, pulse oximeter calibration devices are designed to be highly accurate, easy to use, and portable; however, they are intended for medical professionals only, making them expensive. Additionally, most are specifically designed to calibrate transmissive-type pulse oximeters, rendering them unsuitable for the latest reflective-type PPG sensors for personal use. Similarly, the calibrator for digital stethoscopes is typically a multifunctional simulator in the form of mannequins, specifically designed for medical and educational environments [20,21,22,23,24]. Furthermore, current calibration approaches are generally designed to calibrate a single signal at a time, meaning that multiple signals cannot be calibrated simultaneously and require separate calibrators for each.
Overall, traditional calibration equipment was designed for controlled clinical environments and does not sufficiently address the flexible, continuous calibration needs of personal wearable health devices. Given these factors, personal wearable devices measuring physiological signals often lack accessible and affordable calibration systems suitable for consumer use as shown in Table 1. This highlights the need for user-friendly, easily accessible calibration solutions that empower individuals to maintain device accuracy outside professional settings.
Therefore, this study aims to develop a low-cost physiological signal simulation system for calibrating wearable devices. To achieve this goal, a multimodal smart stethoscope (Synesper, Clairaudience, Daegu, Republic of Korea) as shown in Figure 1, has been chosen as the target for calibration system development. The proposed calibration device is designed as a simulation system featuring an adjustable PCG and PPG signal generation system, allowing for the simultaneous calibration of the multimodal smart stethoscope’s dual signal sensors within a single setup. This system comprises a high-performance microprocessor for signal generation, a speaker, and an LED light-emitting component for individually generating heart sounds and pulse signals. It can accurately produce dual signals using a programmable PCG and PPG generation algorithm along with advanced stored data. Additionally, it can simulate various cardiovascular diseases by adjusting the time difference between the two signals. This proposed system will enable residents of remote areas, who often lack access to regular professional maintenance and calibration due to geographic and financial constraints, to conduct self-calibration of their wearable health devices at home. This capability enhances the accuracy and reliability of remote cardiovascular condition monitoring and diagnostic outcomes.

2. Methods

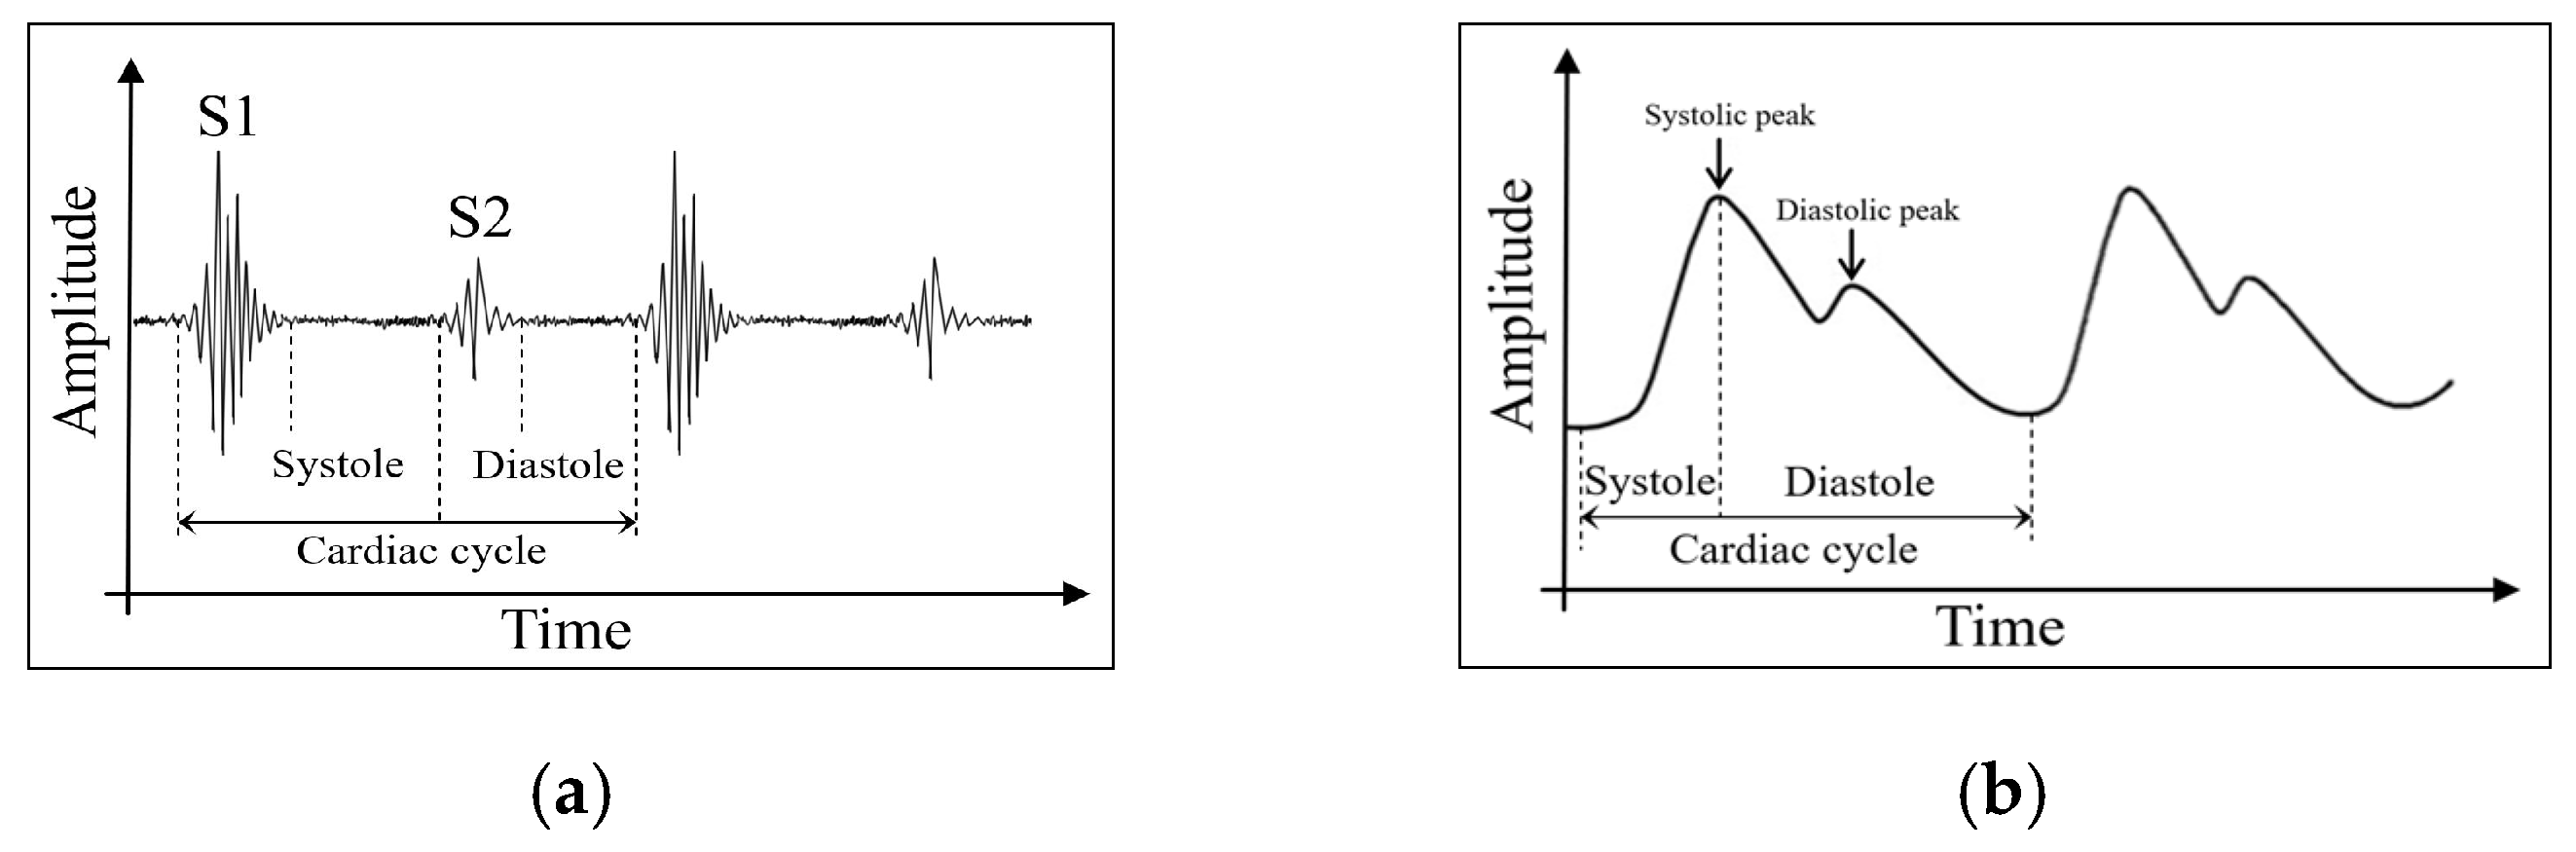
2.1. Cardiovascular Physiological Signals

The proposed system aims to generate heart sounds and blood pulse signals to calibrate pulse oximeters and digital stethoscopes. Heart sounds can be recorded using a microphone and converted into electrical signals, which are displayed as PCG. The cardiac cycle of a healthy heart includes two main sounds: the first heart sound (S1), produced by the closure of the atrioventricular valves at the beginning of systole, and the second heart sound (S2), created by the closure of the semilunar valves at the end of systole, as shown in Figure 2a. PPG provides a visual representation of the blood pulse wave. It is measured by emitting light onto the skin and detecting the intensity of reflected light, which varies with changes in blood volume. This information is then converted into an electrical signal and displayed as a waveform. The healthy cardiac cycle consists of a systolic peak, corresponding to the contraction of the heart muscle during systole, and a diastolic peak, indicating relaxation during diastole, as illustrated in Figure 2b [25].
Figure 3 shows the relationship between the features of PCG and PPG signals, which were measured simultaneously. In a healthy heart, the S1 heart sound occurs at the start of systole, aligning with the systolic peak in the PPG signal. The S2 sound occurs between the end of systole and the beginning of diastole, corresponding to the diastolic phase in the PPG signal [26]. Therefore, the PPG signal is often used as a reference for identifying heart sounds within the same cardiac cycle. It is crucial for these signals to be precisely synchronized in timing. Heart sounds and the pulse wave should not occur simultaneously; instead, the pulse wave must follow the heart sound. The arterial pulse wave takes a certain amount of time to travel from the heart to the finger, known as pulse transit time (PTT). PTT is defined as the time difference between the onset of cardiac ejection (the S1 sound in the PCG) and the arrival of the pulse at the finger (the systolic peak in the PPG) [27]. This relationship can be expressed as Equation (1),
TPTT = TSP + TS1,
where TPTT is pulse transit time, TSP is the moment of the systolic peak in the PPG, and TS1 is the occurrence time of the S1 sound in the PCG. Consequently, to accurately simulate a cardiac cycle, the timing of each signal must be adjusted based on the PTT.

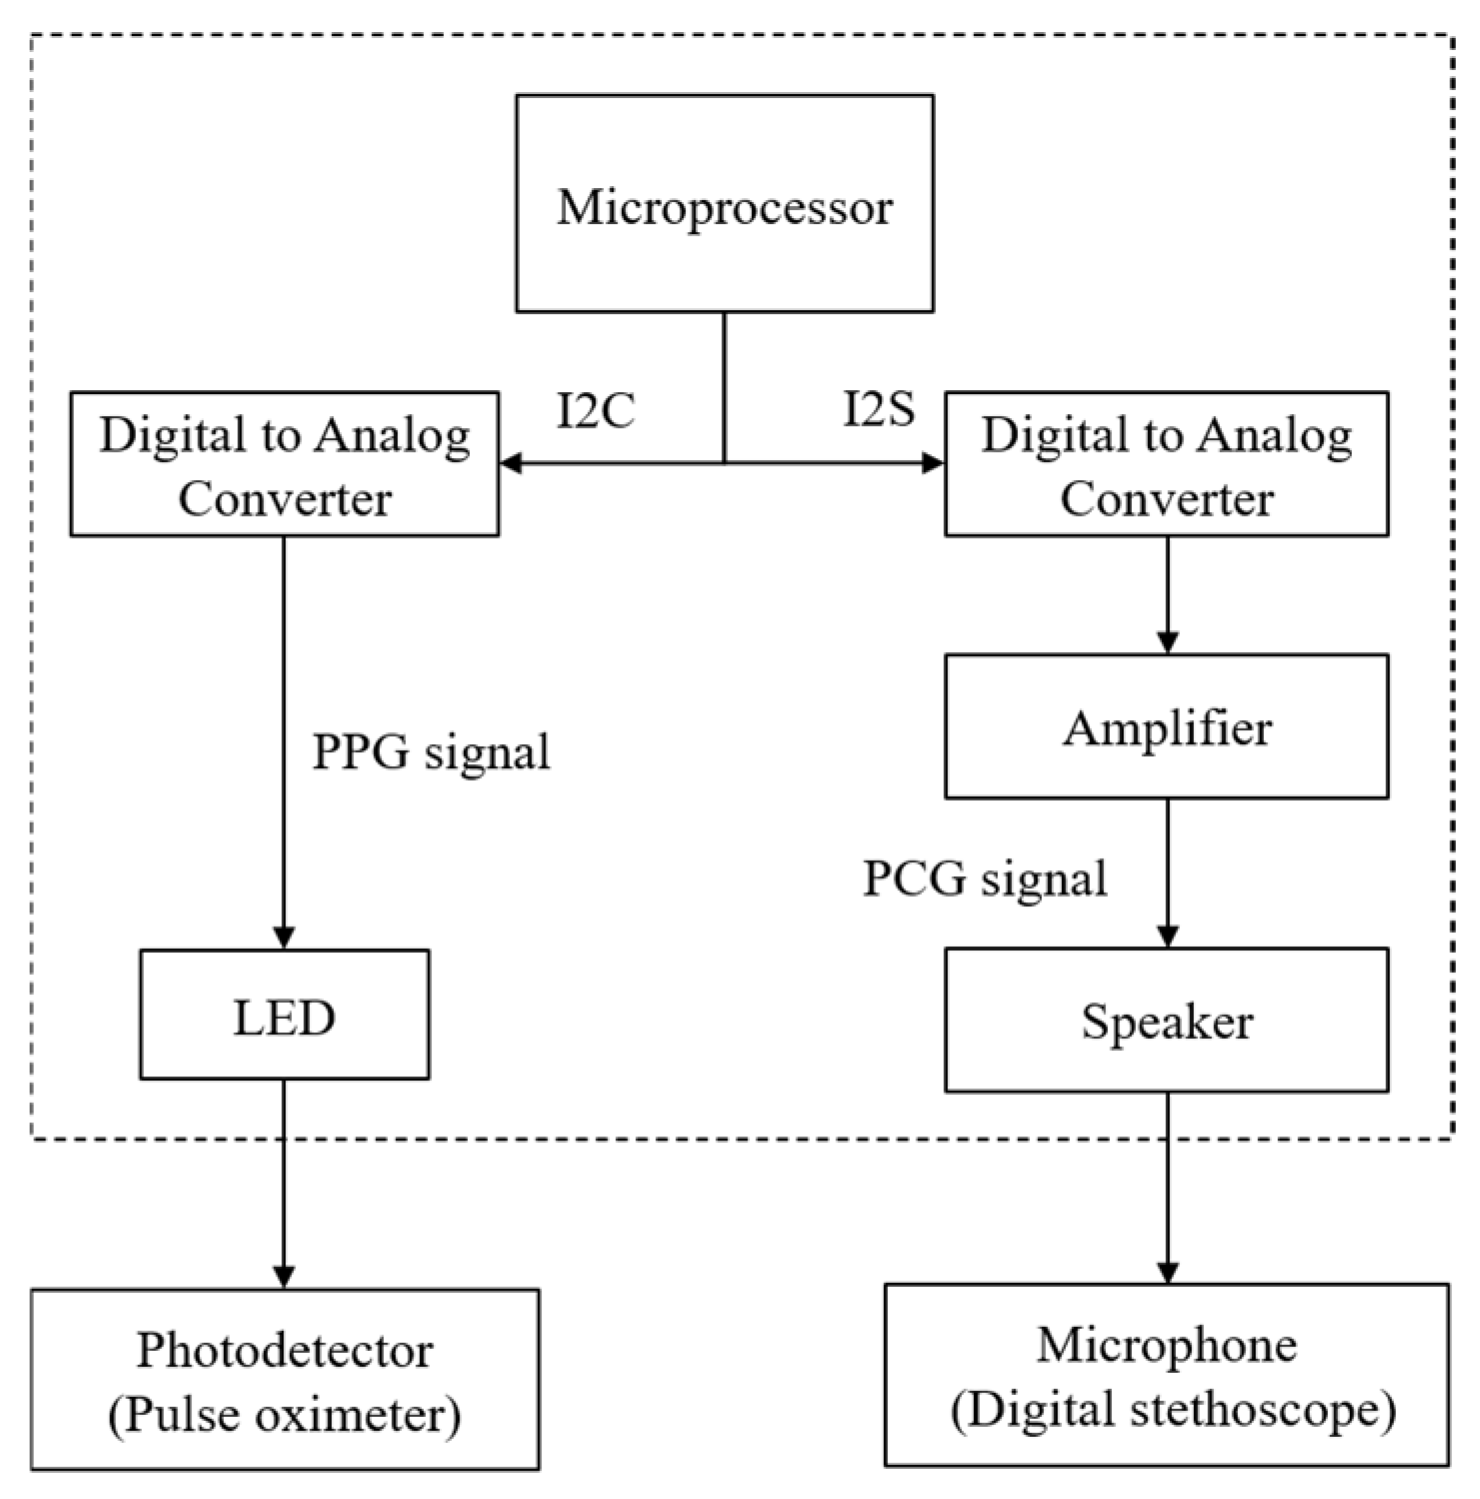
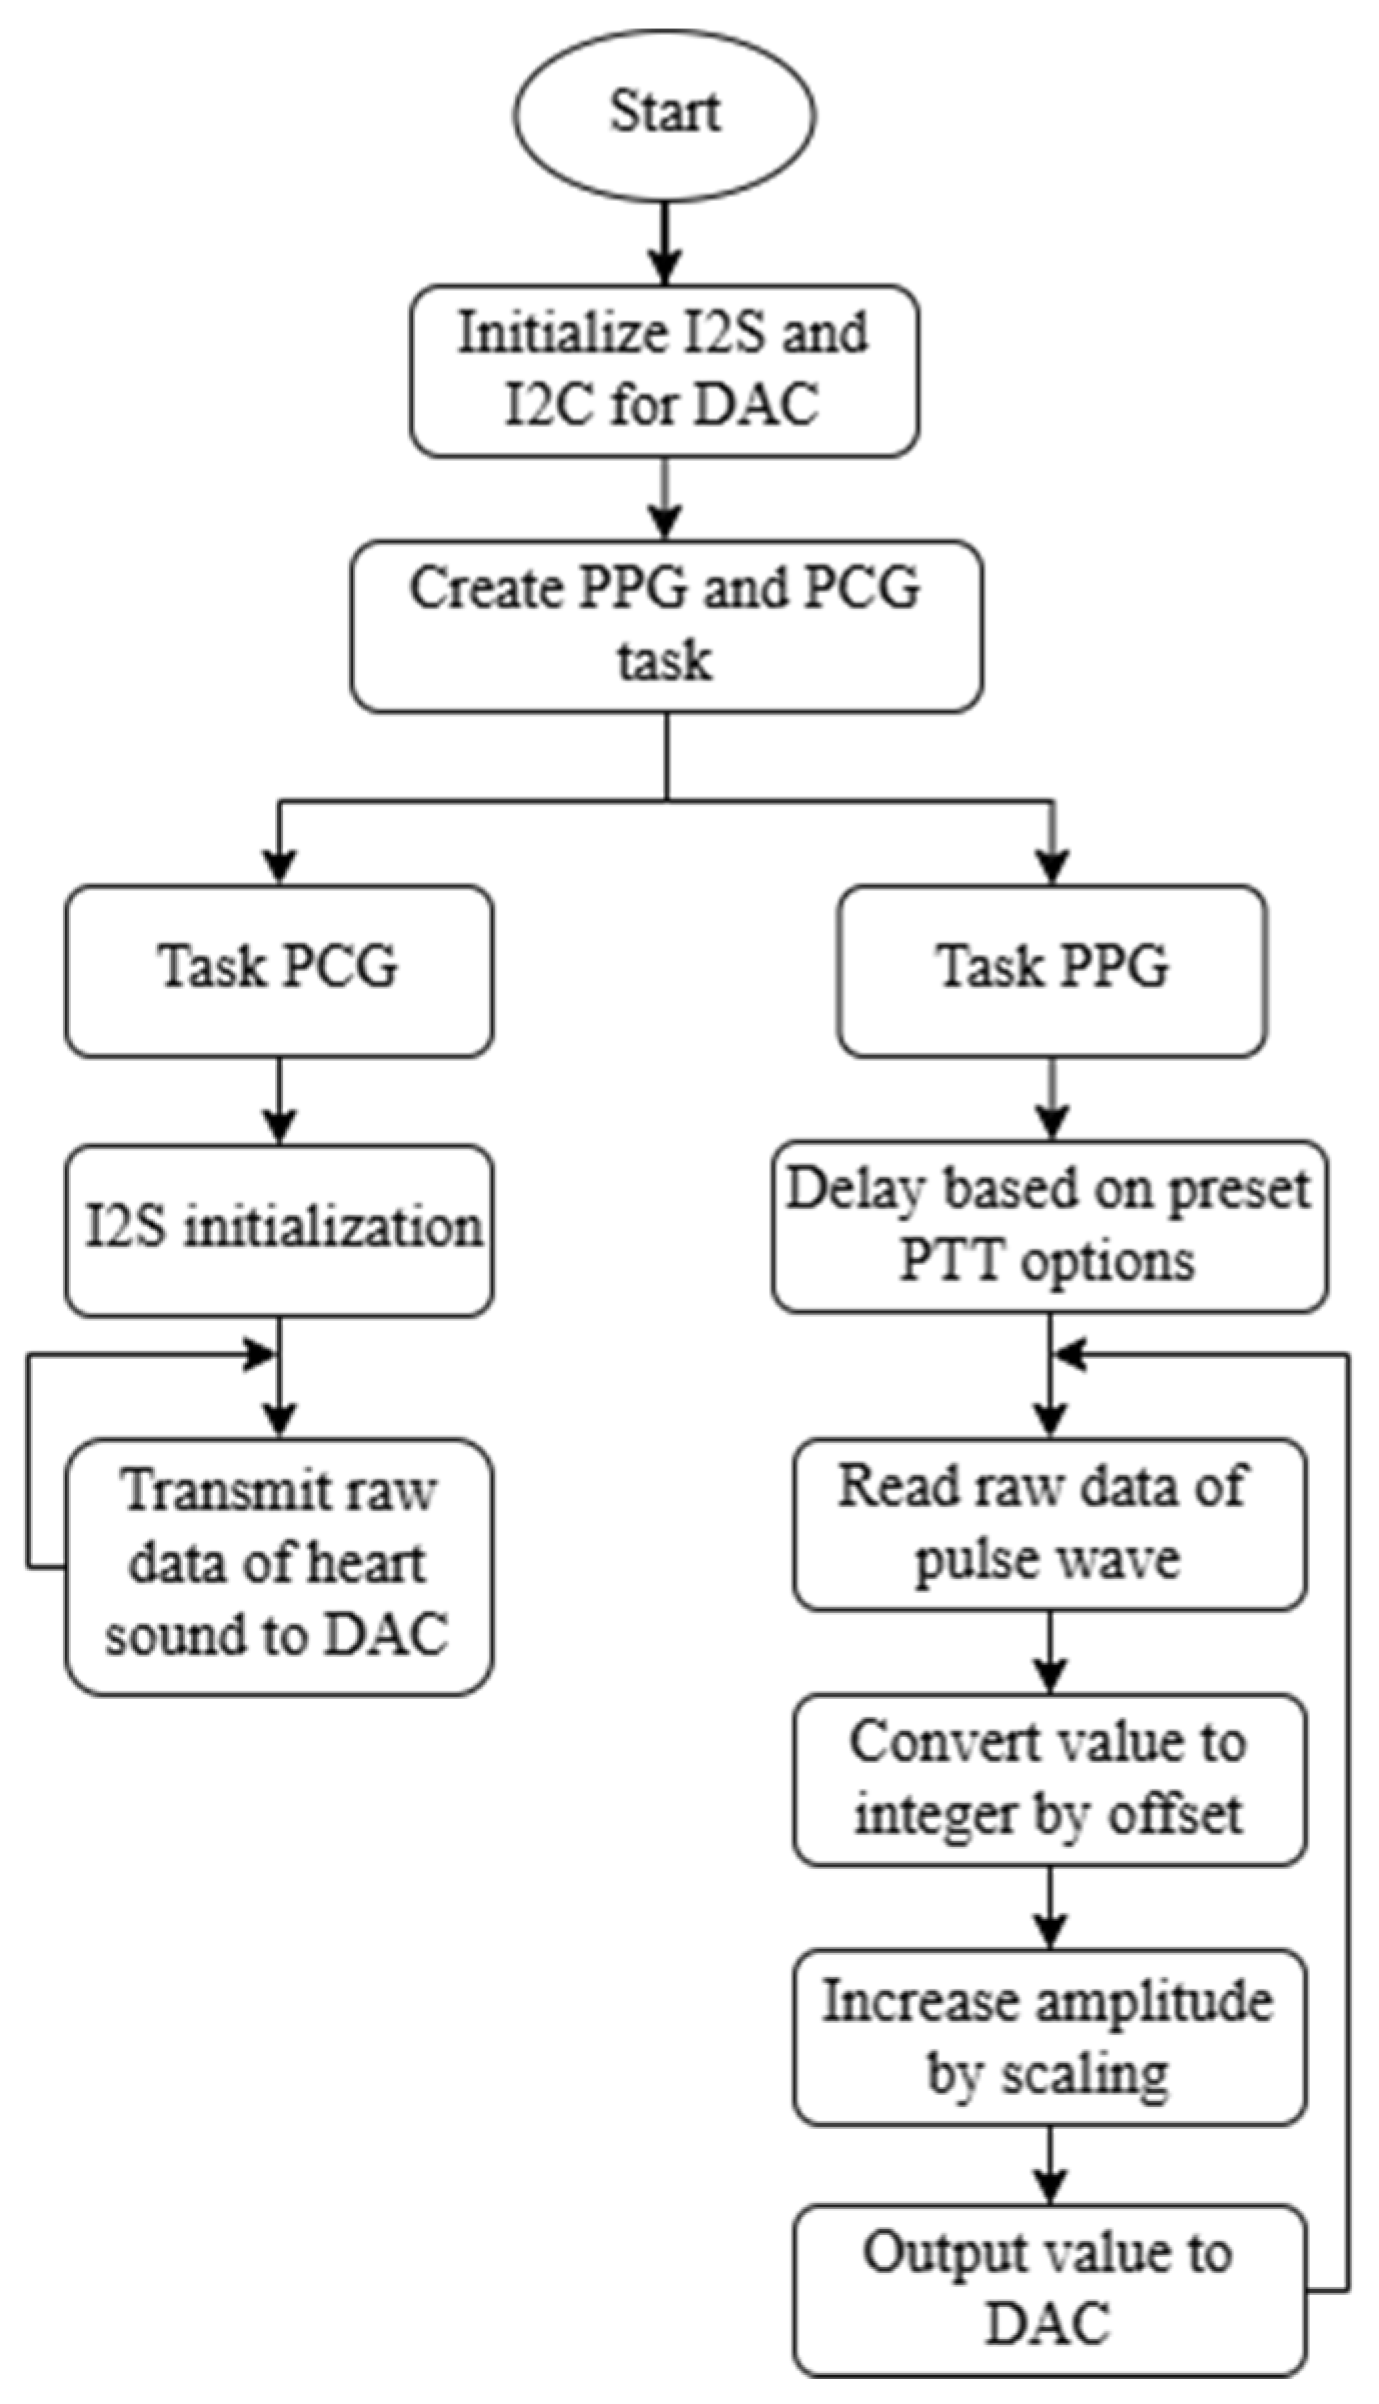
2.2. Proposed System Design and Principle

The proposed system is designed to include a microprocessor, peripheral digital-to-analog converters (DACs), an audio amplifier, and signal output units, which consist of an LED and a speaker. This setup allows for the simultaneous generation of heart sounds and blood pulse waves. As illustrated in Figure 4, the system operates as follows: the microcontroller (MCU) manages the system and processes the raw data of pre-stored heart sounds and blood pulse waves. The processed pulse wave data is transmitted to the DAC via the Inter-Integrated Circuit (I2C) interface, which converts the digital data into an analog signal. The LED then generates light for the PPG signal, visualizing the pulse waveform through gradually changing light. Simultaneously, the heart sound data is sent to the DAC through an Inter-Integrated Circuit Sound (I2S) interface, which also converts this data into an analog signal. Then, the converted heart sound is amplified by an audio amplifier and output through the speaker.
Figure 5 illustrates that the designed system executes two parallel tasks through the system firmware to generate heart sounds and pulse waveforms simultaneously. The TaskPCG function configures the raw heart sound data, which is stored in the MCU, and transmits it to DAC. This process runs continuously, allowing the audio data to be converted into an analog signal and amplified for playback through the speaker. Meanwhile, the TaskPPG function generates the pulse waveform using pre-stored raw data. Once initiated, it executes a PTT adjustment process with preset delay values to synchronize the heart sound and pulse wave, effectively simulating real cardiovascular circulation. The system allows for the simulation of cardiac abnormalities by selecting from preset PTT options, which are pre-measured and calculated delay values specifically designed to represent various cardiovascular diseases. This flexible adjustment of delay values enables the modeling of different pathological conditions and enhances the system’s applicability in clinical research and device testing. For instance, longer PTT values can simulate conditions such as heart failure or decreased vascular tone, where pulse wave velocity decreases.
After this synchronization, the task converts the raw data type to an integer by applying an offset because the DAC receives only a positive digital integer value. Then, it increases the amplitude of the data by scaling it to ensure that the waveform can be clearly distinguished based on the LED’s luminance and subsequently transmits this value to the DAC. By using a multicore MCU, each task is assigned to a separate core. This enables multitasking to run continuously and independently on different cores of a single MCU, leading to better utilization of CPU resources and enhancing system stability and performance, particularly in real-time simulation environments.
Additionally, it continuously converts the signal into an analog format to produce a pulse wave through the LED. Since this process involves two distinct tasks, each must be assigned to a different core to operate synchronously. Therefore, the system should be designed using a multi-core MCU to facilitate multitasking. This approach allows for the development of a simulation system capable of generating various physiological signals simultaneously.

3. Materials and Experiment

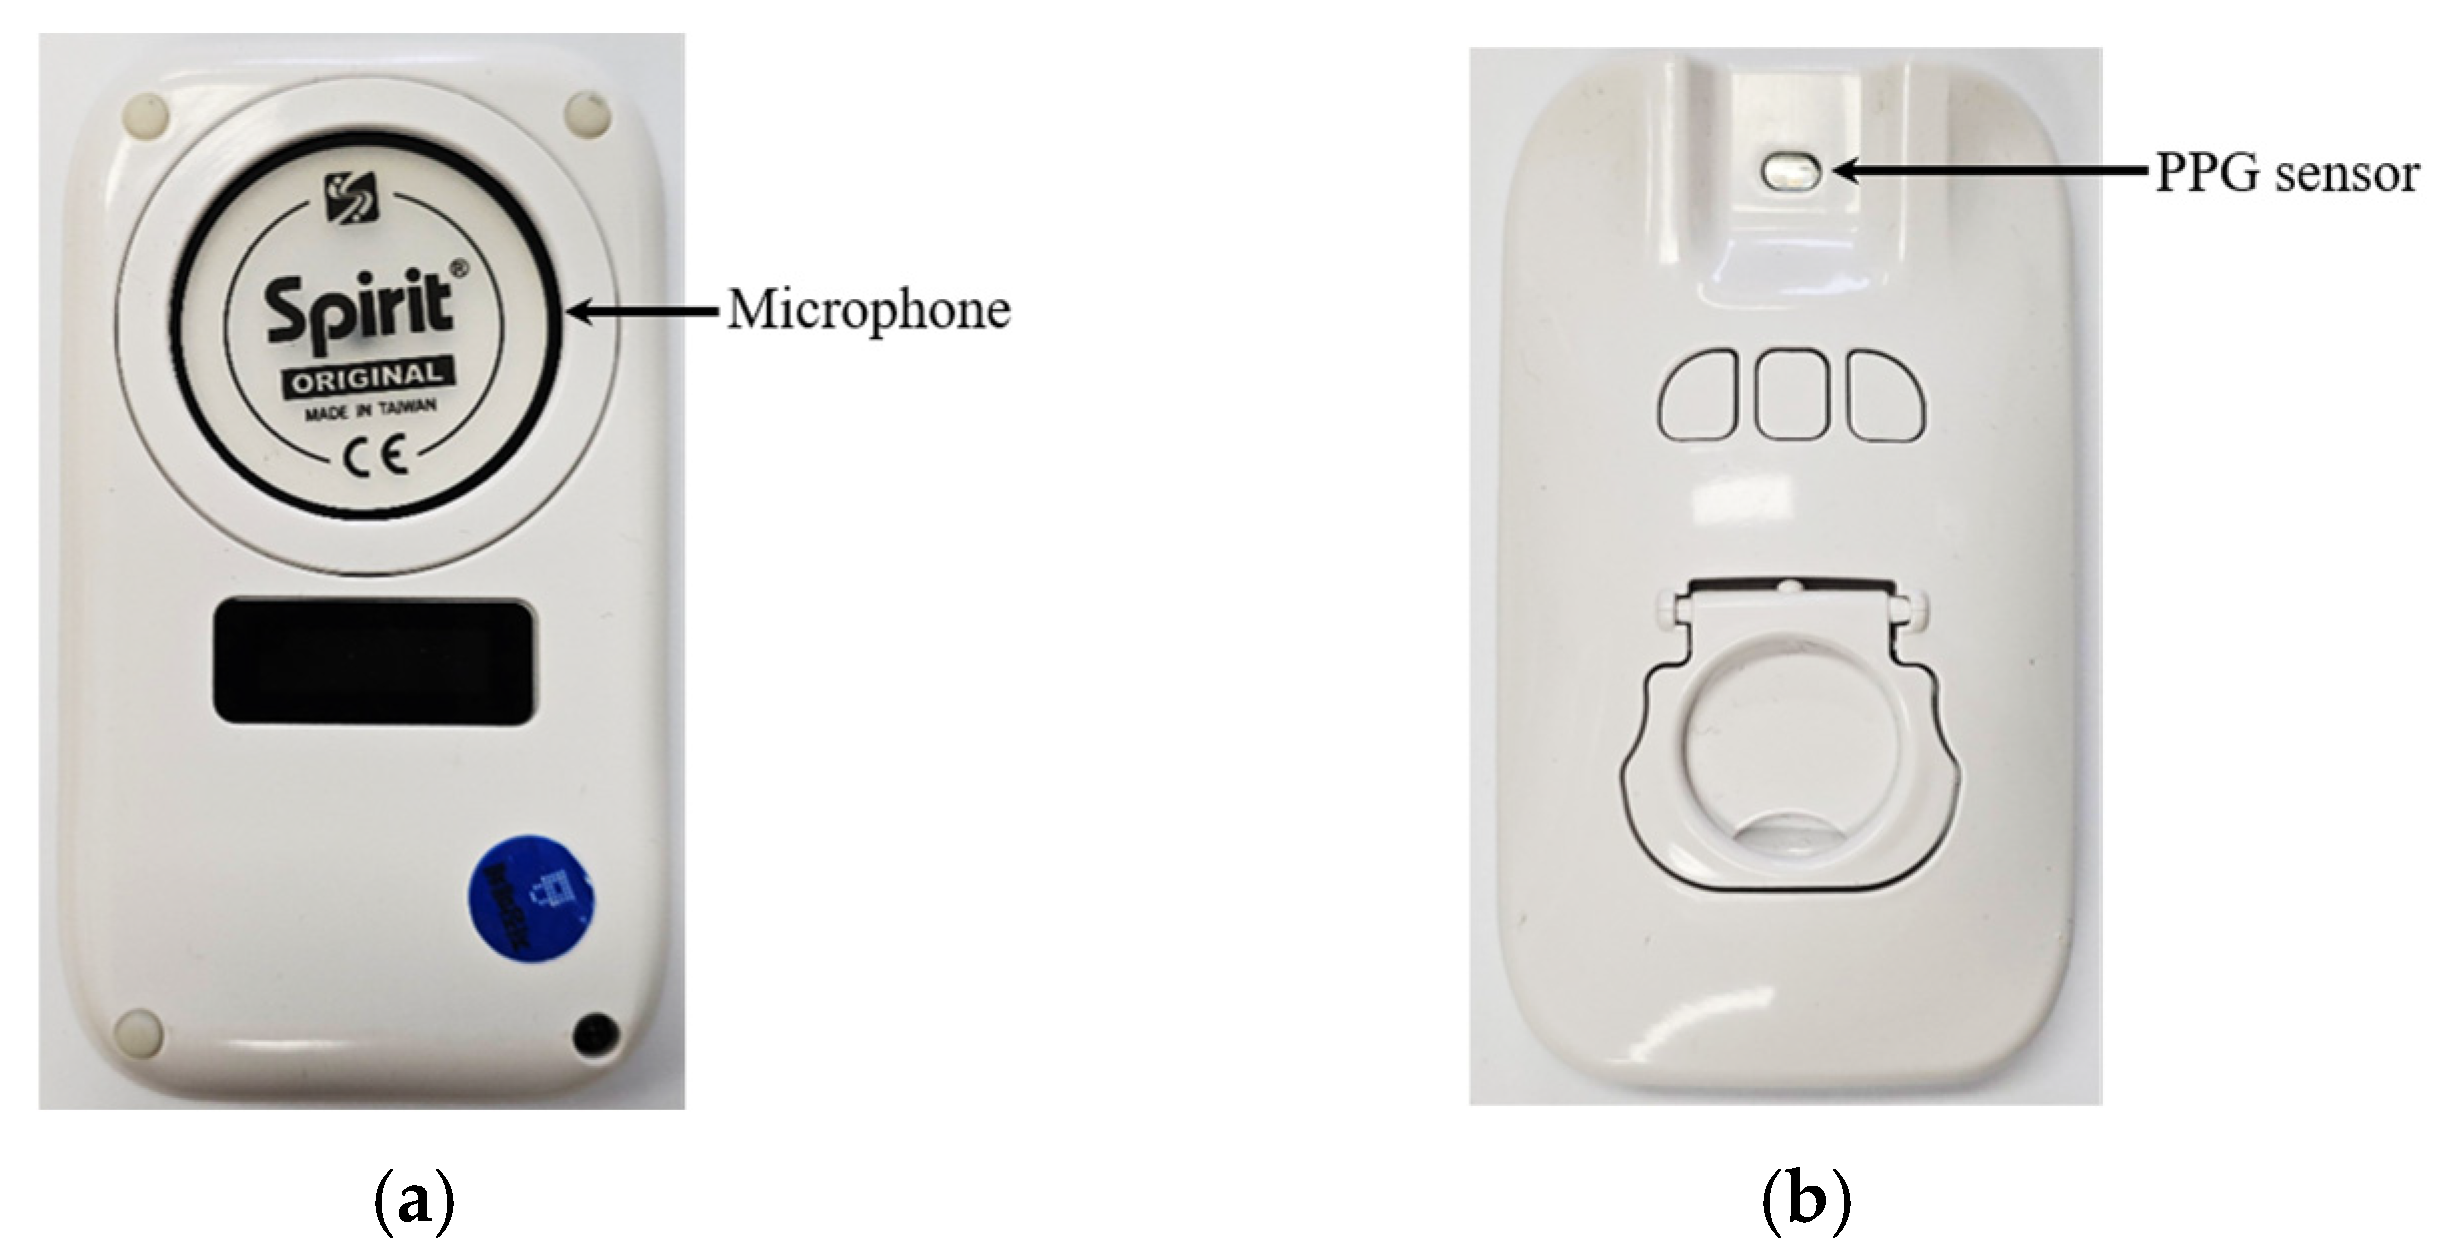
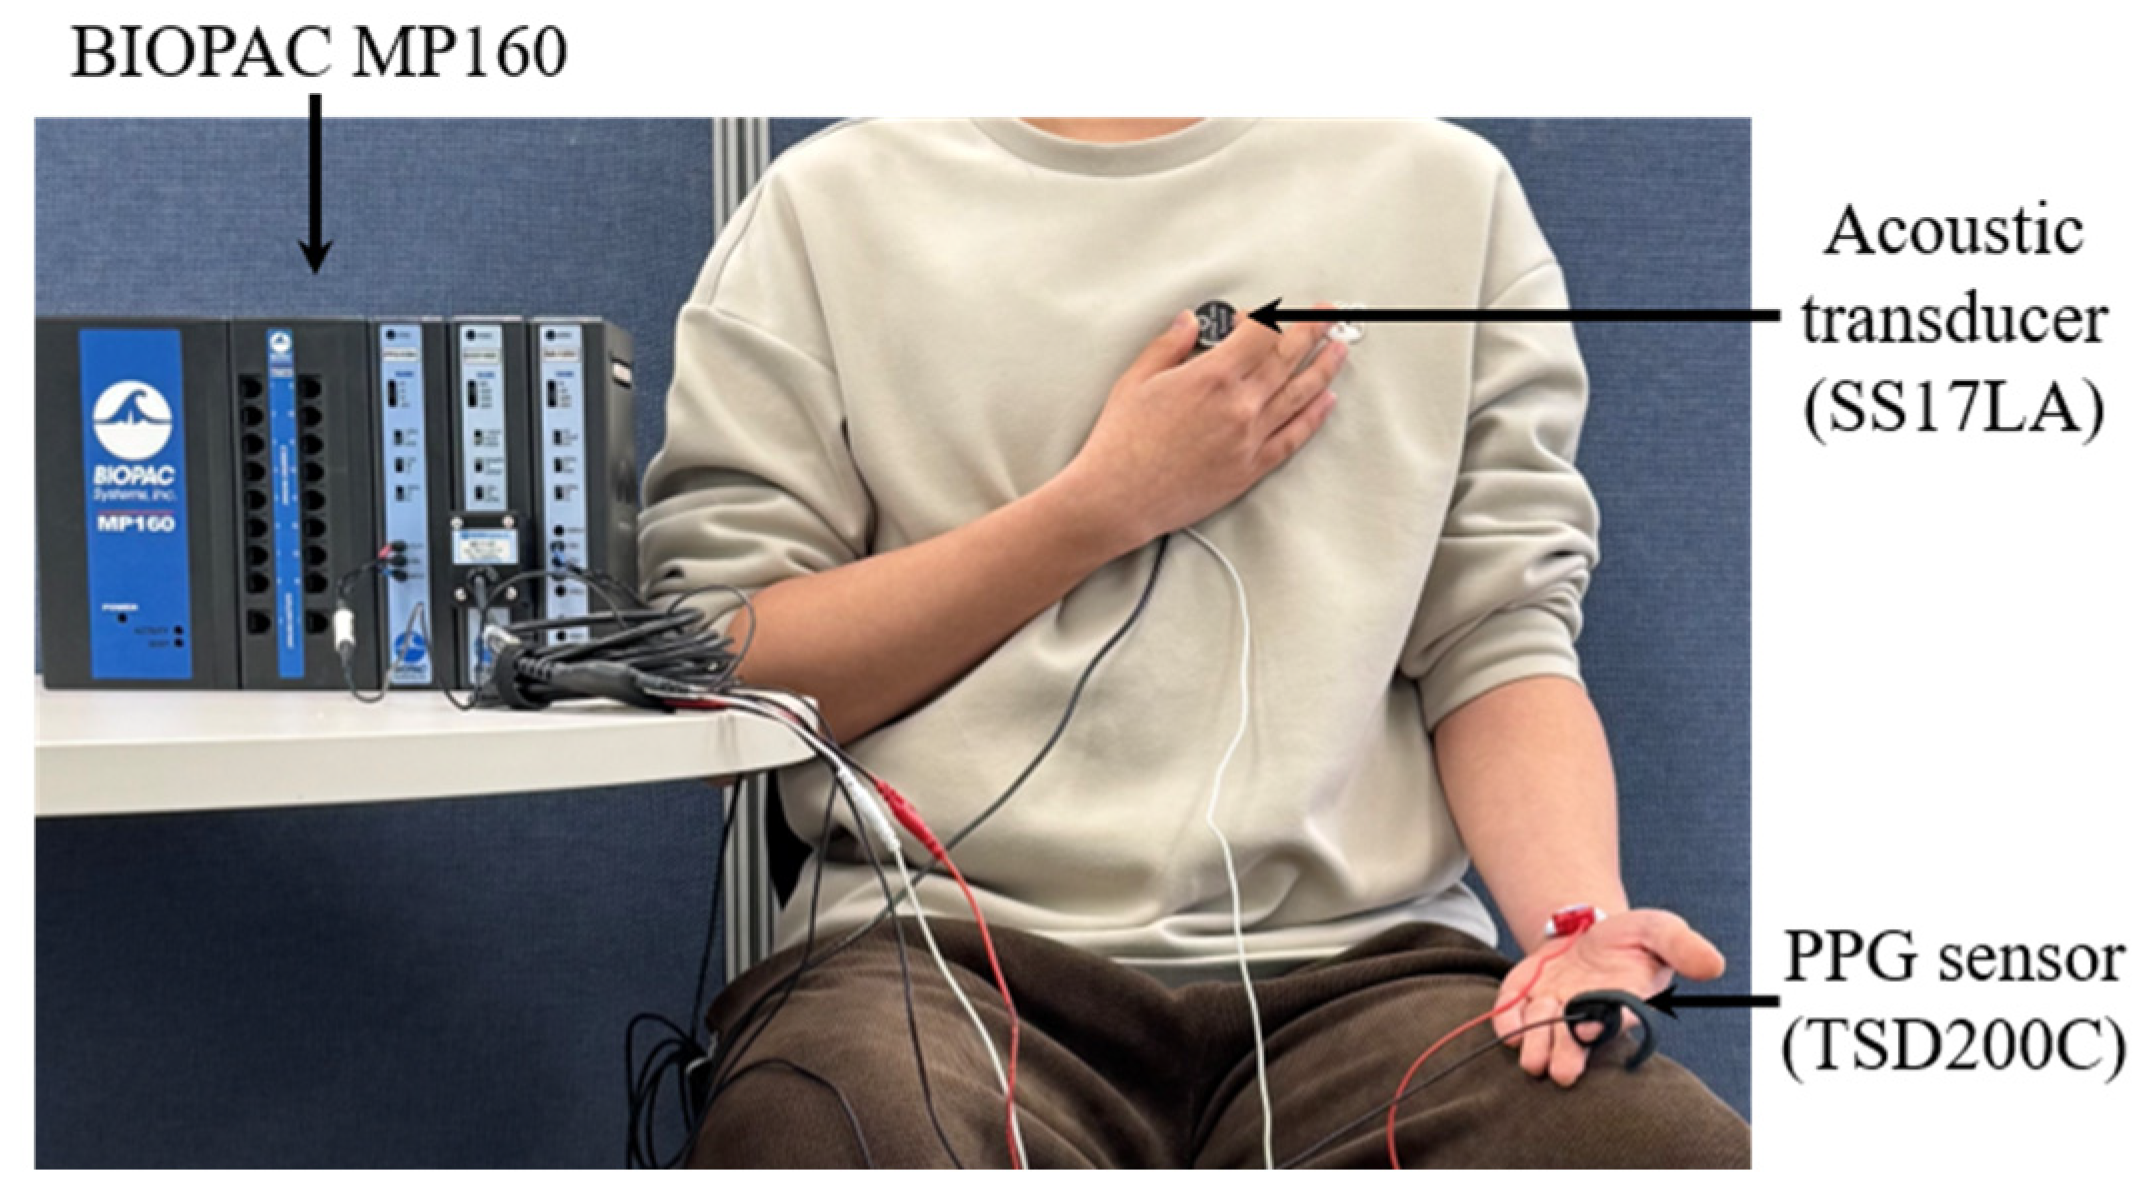
3.1. Prototype Manufacture

Figure 6 presents the schematic of the proposed multi-physiological signal simulation system. This study employed the Arduino Nano ESP32 (ESP32, Arduino, Monza, MB, Italy) as the MCU. The ESP32 features a dual-core 32-bit LX7 microprocessor, allowing it to manage multiple tasks simultaneously. It supports I2S and I2C communication protocols, enabling the MCU to connect two peripheral DACs for generating heart sounds and pulse waves. A high-performance DAC (PCM5102, Texas Instruments, Dallas, TX, USA) with an I2S interface was selected to ensure high-quality PCG signal audio output. This DAC features 32-bit resolution and supports sample rates up to 192 kHz, facilitating the conversion of raw data signals into high-fidelity analog heart sound signals, which are then transmitted to an amplifier (LM386, Texas Instruments, Dallas, TX, USA) to be played through an 8-ohm, 5 W speaker. For the PPG signal, a 12-bit DAC (MCP4725, Microchip Technology, Chandler, AZ, USA) was used, which offers 4096 output levels and is easily integrated with MCU via I2C. This capability makes it ideal for converting pulse wave raw data into an analog signal to drive the LED for PPG signal generation. An RGB red light was chosen to visualize the pulse waveform due to its flexibility compared to standard red LEDs, allowing for adjustable light luminance.
Figure 7a shows the 3D model of the proposed physiological signal simulation system device. The design consists of two main components: the top part, which features an LED light to emit pulse waves and houses the device’s hardware, and the bottom part, which contains a speaker to produce heart sounds and serves as a platform for holding the measurement device. This configuration allows the multimodal smart stethoscope to be positioned between the two sections, ensuring precise alignment of the sensors for accurate measurements. The prototype is manufactured using a 3D printer with ABS material, as illustrated in Figure 7b. For calibration purposes, the multimodal smart stethoscope was placed on the device. In this setup, the microphone of the smart stethoscope is positioned above the speaker of the prototype, while the PPG sensor is located below the LED light, as shown in Figure 7c. This design enables the smart stethoscope to simultaneously measure the generated heart sounds and pulse waves.

3.2. Signal Acquisition

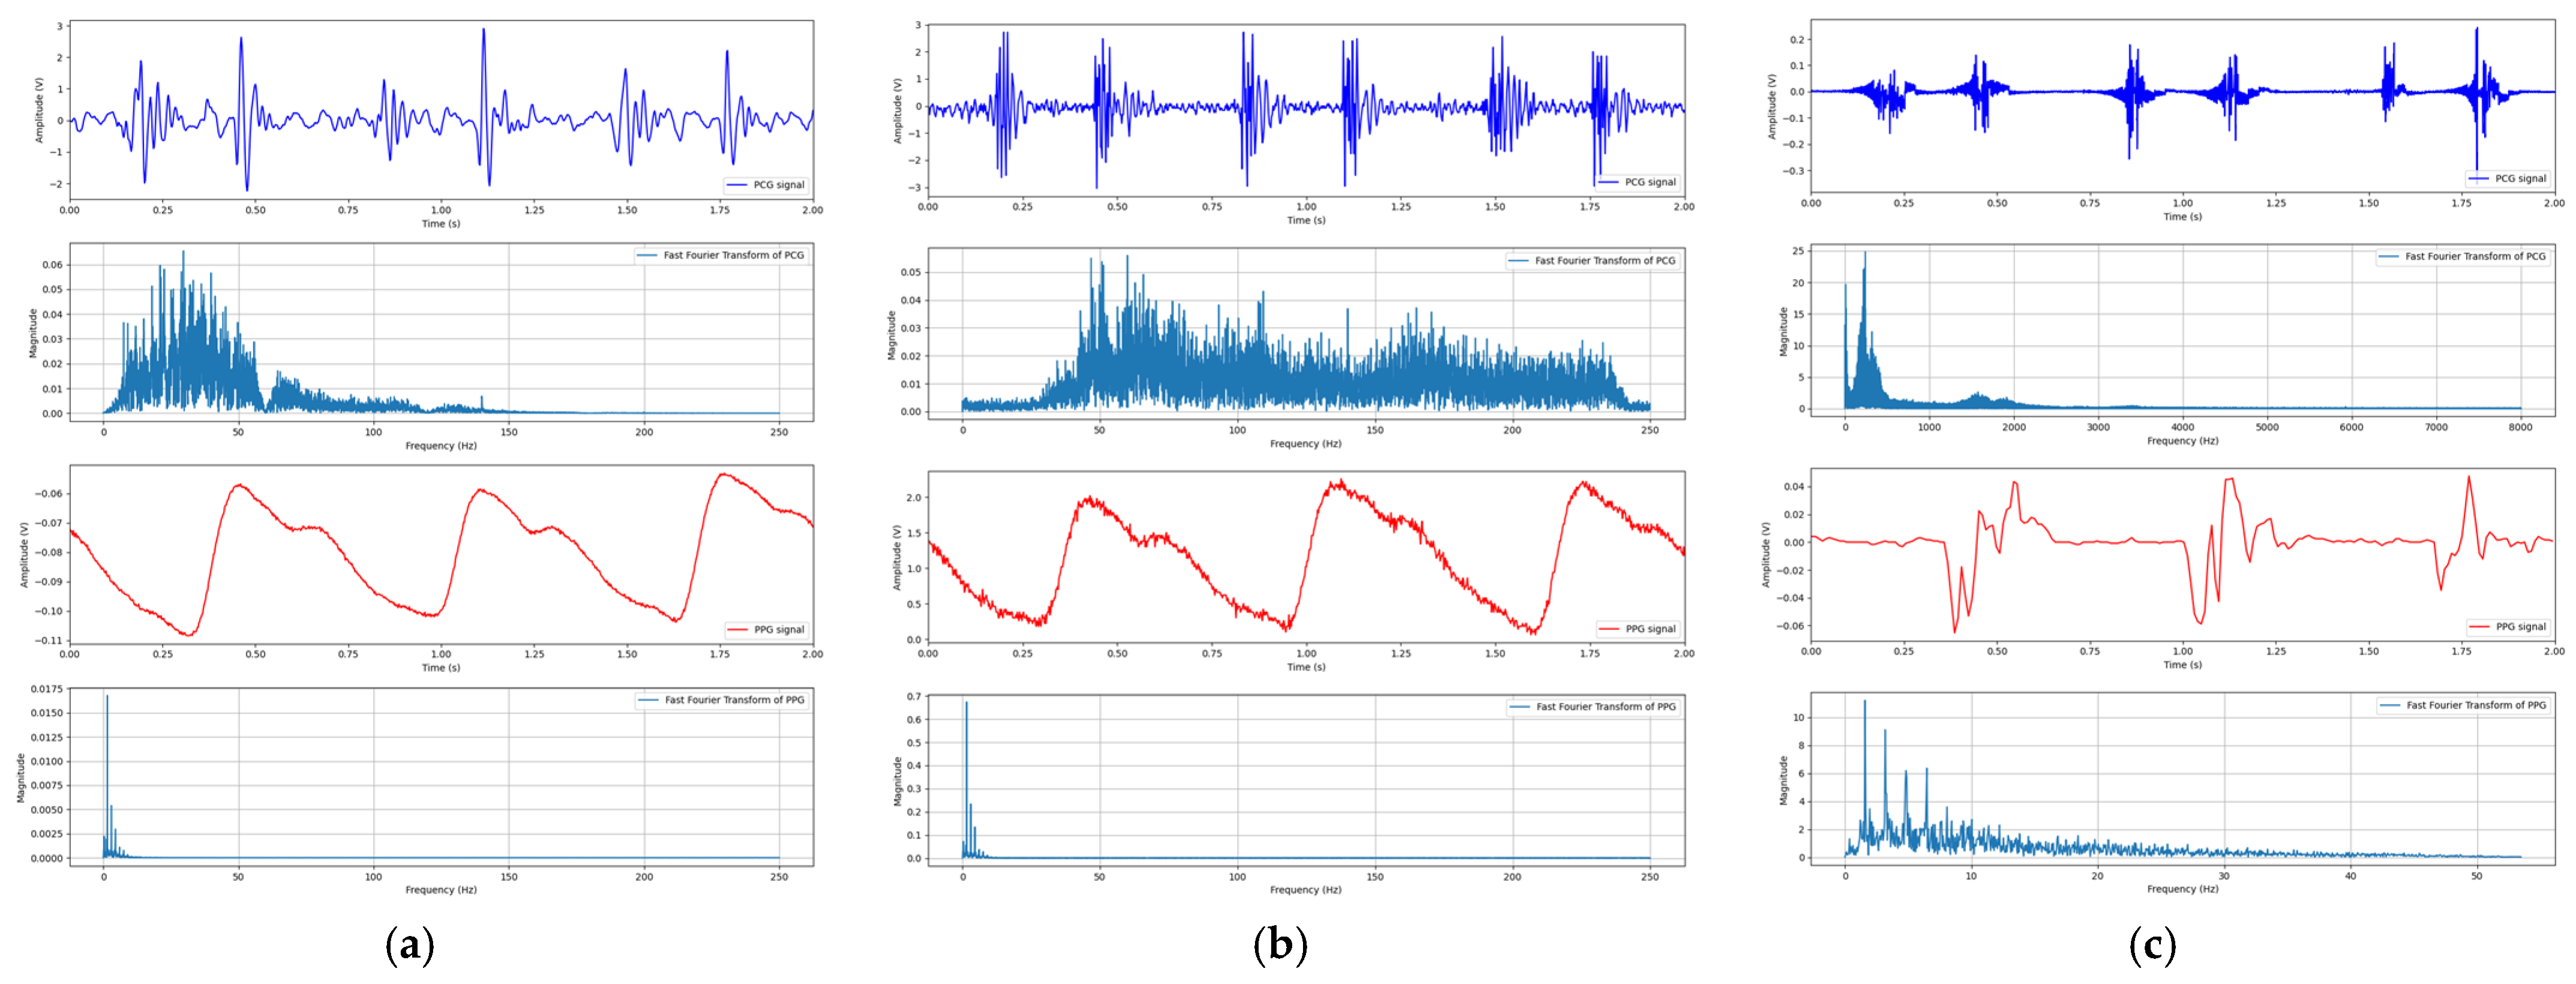
3.2.1. Signal Recording

To obtain raw physiological signals, 10 healthy male subjects (ages 24 to 27) were invited to participate in the experiment. Two measurements simultaneously over a 20 s period using a professional physiological measurement system MP160 (BIOPAC, Goleta, CA, USA) were conducted for recording cardiovascular physiological signals, specifically heart sounds and pulse waves. The heart sounds were measured from the pulmonic area of each subject’s chest, while the PPG signals were recorded from the fingertip, as illustrated in Figure 8. The recorded heart sounds and PPG signals generated a 21,676-millisecond dataset containing 31 to 33 heart cycles. The technical characteristics of the recorded PCG and PPG signals are detailed in Table 2.

3.2.2. Signal Preprocessing

The preprocessed recording data must capture a complete cardiac cycle to allow the proposed system to continuously generate synthetic physiological and pathological heart signals. Generating signals from incomplete cycles can cause distortion during continuous signal production. To prevent deviations from the normal heart rate cycle, the original data underwent preprocessing. After processing, the heart sound and pulse wave data have a duration of 20,684 milliseconds, containing 31 cycles. Both signals start from the onset of the cycle, and the pre-recorded heart sound data was converted into mono audio data at a sampling rate of 44.1 kHz to create the heart sound signal. To ensure adequate resolution for distinguishing the first and second heart sounds and to preserve subtle acoustic components, the sampling rate was set at 44.1 kHz.
Additionally, to synchronize the preprocessed PCG and PPG signals, the PTT was observed to be 200 milliseconds in the recorded data. Consequently, according to the algorithm of our system firmware, as shown in Figure 5, the PPG signal is initiated with a 200-millisecond delay after the occurrence of the S1 sound, ensuring synchronization between the normal heart sound and the pulse wave.

3.3. System Evaluation

Figure 9 shows that to evaluate the performance of the proposed system, a digital oscilloscope (MDO4104C, Tektronix, Beaverton, OR, USA) was connected to two DACs to measure the generated PCG and PPG signals. Additionally, a multimodal smart stethoscope was used in conjunction with the prototype to simultaneously measure the final output signal. The PCG and PPG signals were generated continuously, and a 20 s measurement period was recorded. After the measurement, the original raw data, as well as the data captured by the oscilloscope and the multimodal smart stethoscope, were collected and converted into PCG and PPG signals. This allowed for comparing the signal shape, frequency components, and phase variations.

4. Results and Discussion

The experimental results of the developed simulation system for generating PCG and PPG signals are presented in the time and frequency domains individually. Figure 10 illustrates an example of the PCG and PPG signals acquired from the preprocessed original signals recorded by MP160 and the generated signals measured by the oscilloscope and multimodal stethoscope individually.
The preprocessed recording signal demonstrates standard normal heart sounds and pulse characteristics, as shown in Figure 10a. The S1 and S2 heart sounds can be clearly identified in the PCG signals, while the PPG signal distinctly separates the systolic and diastolic peaks. The graph indicates that the systolic peaks correspond to the S2 sound, reflecting the relationship between heart sounds and blood pulses, as illustrated in Figure 3.
Figure 10b displays the generated PCG and PPG signals of the preprocessed recording signals acquired from the simulation system. While the generated signal retains the primary waveform characteristics of the preprocessed recording signals, some slight noise and amplitude variations were observed in both signals. The FFT spectrum indicates that the PPG signals maintain the same frequency as the preprocessed recording signal, whereas the PCG signals show a variation in frequency. The difference in the shape and frequency of the PCG signal between the generated and recorded data is likely due to the DAC resolution being lower than the precision of the raw data, resulting in distortion during signal reconstruction. Although the S1 and S2 sounds are identifiable, the lower DAC resolution prevents an accurate reproduction of the distinct features between them. As a result, the amplitudes of the S1 and S2 sounds become nearly identical, leading to a loss of their unique acoustic characteristics. This results in diminished acoustic distinctions, while increased noise and frequency artifacts further compromise the overall signal quality. Additionally, to reduce the system’s cost, the IC components were mounted on a mini breadboard, which led to loose connections and slight noise in both PCG and PPG signals.
Figure 10c shows the generated signals measured by the multimodal stethoscope and plotted for PCG and PPG. The measured signals clearly show the distinctive features of S1 and S2 heart sounds, as well as the systolic and diastolic peaks of the pulse wave. The peaks of the PPG signal are observed to correspond with the S2 sound, maintaining the same phase as the original signals. The peaks of the PCG and PPG signals from all three experiments show similar positions and durations. Additionally, the duration of one cardiac cycle remains consistent across both signals, with exactly three identical cycles recorded within a 2 s measurement window. These observations suggest that the PCG and PPG signals are phase-aligned. However, significant distortion of the signal shapes and frequency variations were noted in both signals. To assess the similarities between the recorded and generated signals for PCG and PPG, cross-correlation analysis was employed.
Figure 11 illustrates the cross-correlation results of the PCG signals. Part (a) compares the recorded signal with the generated signal, while part (b) compares the generated signal with the measured signal. A notable difference is observed between the generated and measured data; specifically, the measured signals exhibit significant shape distortion in the time domain. Pearson’s cross-correlation coefficient between the recorded and generated signals was calculated to be −0.005. Although this coefficient is close to zero, the peak at lag zero indicates that the signals are in the same phase.
Figure 12 displays the cross-correlation results of the PPG signals. Part (a) compares the recorded signal to the generated signal, while part (b) compares the generated signal to the measured signal. The results for the PCG signals reveal significant differences across both correlations. Notably, for the correlation between the recorded and generated signals, the lag is zero, indicating that the phases of the two signals are nearly consistent, with the differences centered around the midpoint. This discrepancy arises because the amplitude of the generated signal is approximately ten times larger than that of the recorded signal. Pearson’s cross-correlation coefficient for this comparison was calculated to be 0.94, and the highest peak in the correlation occurred at a lag of 0. This demonstrates a strong positive correlation with no time delay between the signals. In contrast, the PPG signal measured by the data exhibited considerable shape distortion, resulting in a significant difference in the correlation between the generated and measured data. Pearson’s cross-correlation coefficient in this case was only 0.025. However, the highest correlation peaks occurred near zero lag, indicating that the phases of the two signals are similar.
Based on the experimental results, the developed simulation system can accurately generate both the PCG and PPG in an analog signal simultaneously before they are output through the speaker and LED. However, the PCG and PPG signals measured by the multimodal stethoscope exhibited significant distortion in their shapes. The distortion in the PCG signal is likely due to a mismatch between the speaker and the amplifier, which prevents the signal from being fully reconstructed across all frequency bands for the heart sound. Additionally, the diaphragm of the multimodal stethoscope was placed directly on the speaker, rather than on a human chest, resulting in a sound amplitude that is several times larger than a normal signal value. For the PPG signal, the issue arises because the light emitted by the LED does not reflect off the skin; instead, it travels directly through the air to the PPG sensor. This leads to a signal that does not accurately correspond to a real human pulse.
To enhance the quality and calibration accuracy of the generated physiological signal, future work will focus on reducing signal distortion in both the PPG and PCG outputs. For the PPG signal, we plan to minimize light scattering and signal loss in the PPG sensor. A dedicated jig will be designed to ensure a fixed light path and reduce ambient interference. This approach is expected to improve the accuracy of PPG signal acquisition by increasing signal consistency and decreasing optical noise. For the PCG signal, a higher-resolution speaker will be integrated to better preserve the subtle acoustic features of the S1 and S2 heart sounds. This upgrade will help minimize PCG signal distortion, reduce noise from electronic components, and enhance the calibration relevance of the output. These improvements are anticipated to enhance overall system performance, particularly regarding signal generation quality.

5. Conclusions

This study presents a low-cost multi-physiological signal simulation system designed to generate heart sounds and pulse signals for calibrating multimodal wearable devices. The system utilizes an Arduino multicore structure and features pre-processed in vivo signal data stored alongside two DAC modules, which include an LED and a speaker to simultaneously produce PCG and PPG signals. Additionally, a time adjustment algorithm was implemented to mimic the changes in PTT associated with various cardiovascular diseases. A comprehensive in vivo experiment was conducted, beginning with the recording of physiological signals, followed by a comparison of the generated signals with the original ones to evaluate the system’s performance. The results indicated that the developed system can accurately generate PCG and PPG signals with essential characteristics, successfully preserving the PTT variations for each dataset. However, some distortion in the signal shape and minor electrical noise were present in the generated signals, likely resulting from limitations in the chosen electrical components. Despite these issues, this study demonstrates that the developed system effectively allows for the calibration of multimodal wearable devices, which can enhance the efficiency of remote monitoring for cardiovascular diseases in rural areas.

Author Contributions

Conceptualization, Q.W.; methodology, Q.W.; software, Q.W. and T.D.; case design, B.K. and G.N.; validation, Q.W. and H.P.; investigation, T.D. and Q.W.; resources, Q.W.; data curation, I.-C.K., J.J. and S.L.; writing—original draft preparation, T.D.; writing—review and editing, Q.W.; visualization, T.D. and S.L.; supervision, Q.W. and H.P.; project administration, Q.W.; funding acquisition, Q.W. All authors have read and agreed to the published version of the manuscript.

Funding

This work was supported by the Startup Growth Technology Development (RS-2024-00446087) funded by the Ministry of SMEs and Startups (MSS, Korea).

Institutional Review Board Statement

Institutional Review Board Statement: The study was conducted in accordance with the Declaration of Helsinki (1975, revised in 2013). Ethical approval was obtained from Keimyung University Institutional Review Board. Approval Code: 40525-202404-HR-013-03. Approval Date: 3 September 2024.

Informed Consent Statement

Informed consent was obtained from all subjects involved in the study.

Data Availability Statement

The data are not publicly available due to privacy or ethical restrictions.

Conflicts of Interest

Author Qun Wei, Jiwoo Jung and Sangwon Lee were employed by the company Clairaudience Co., Ltd. The remaining authors declare that the research was conducted in the absence of any commercial or financial relationships that could be construed as a potential conflict of interest.

Abbreviations

The following abbreviations are used in this manuscript:
PCGPhonocardiography
PPGPhotoplethysmography
PTTPulse transit time
DACDigital-to-analog converter
FFTFast Fourier Transform
MCUMicrocontroller unit
ECGElectrocardiography
SCGSeismocardiography
BCGBallistocardiography
BPBlood pressure
I2CInter-Integrated circuit
I2SInter-Integrated circuit sound
S1First heart sound
S2Second heart sound

References

  1. Temedie-Asogwa, T.; Atta, J.; Al Zoubi, M.; Amafah, J. Economic Impact of Early Detection Programs for Cardiovascular Disease. Int. J. Multidiscip. Res. Growth Eval. 2024, 5, 1272–1281. [Google Scholar] [CrossRef]
  2. Al-Kaysi, A.; Ali, S.; Mahmood, N.; Humaidi, A. Design of Ecg Monitoring System for Cardiovascular Patients Using Labview. J. Eng. Sci. Technol. 2024, 19, 1189–1205. [Google Scholar]
  3. Thompson, S.C.; Nedkoff, L.; Katzenellenbogen, J.; Hussain, M.A.; Sanfilippo, F. Challenges in Managing Acute Cardiovascular Diseases and Follow up Care in Rural Areas: A Narrative Review. Int. J. Environ. Res. Public Health 2019, 16, 5126. [Google Scholar] [CrossRef]
  4. Royo, M.F.C.; Mandi, A.J.C.; Maulana, A.E.; Sinsuat, S.E.B.; Usman, S.E.; Faller, E.M. Disparities in Rural Areas’ Availability of Health Care in South East Asia: A Review. Int. J. Res. Publ. Rev. 2023, 4, 133–139. [Google Scholar]
  5. Liao, Y.; Thompson, C.; Peterson, S.; Mandrola, J.; Beg, M.S. The Future of Wearable Technologies and Remote Monitoring in Health Care. Am. Soc. Clin. Oncol. Educ. Book 2019, 39, 115–121. [Google Scholar] [CrossRef]
  6. Yamano, T.; Kotani, K.; Kitano, N.; Morimoto, J.; Emori, H.; Takahata, M.; Fujita, S.; Wada, T.; Ota, S.; Satogami, K.; et al. Telecardiology in Rural Practice: Global Trends. Int. J. Environ. Res. Public Health 2022, 19, 4335. [Google Scholar] [CrossRef]
  7. Kumar, S.; Victoria-Castro, A.M.; Melchinger, H.; O’Connor, K.D.; Psotka, M.; Desai, N.R.; Ahmad, T.; Wilson, F.P. Wearables in Cardiovascular Disease. J. Cardiovasc. Transl. Res. 2023, 16, 557–568. [Google Scholar] [CrossRef]
  8. Moshawrab, M.; Adda, M.; Bouzouane, A.; Ibrahim, H.; Raad, A. Smart Wearables for the Detection of Cardiovascular Diseases: A Systematic Literature Review. Sensors 2023, 23, 828. [Google Scholar] [CrossRef]
  9. Bayoumy, K.; Gaber, M.; Elshaafeey, A.; Mhaimeed, O.; Dineen, E.H.; Marvel, F.A.; Martin, S.S.; Muse, E.D.; Turakhia, M.P.; Tarakji, K.G.; et al. Smart wearable devices in cardiovascular care: Where we are and how to move forward. Nat. Rev. Cardiol. 2021, 18, 581–599. [Google Scholar] [CrossRef]
  10. Wang, B.; Wei, X.; Zhou, H.; Cao, X.; Zhang, E.; Wang, Z.L.; Wu, Z. Viscoelastic blood coagulation testing system enabled by a non-contact triboelectric angle sensor. Exploration 2024, 4, 20230073. [Google Scholar] [CrossRef]
  11. Qianming, L.; Wen, W.; Haotian, Y.; Kuangyi, Z.; Yiding, J.; Ye, Z. One-Dimensional Implantable Sensors for Accurately Monitoring Physiological and Biochemical Signals. Research 2024, 7, 0507. [Google Scholar] [CrossRef]
  12. Liu, S.-Z.; Guo, W.-T.; Chen, H.; Yin, Z.-X.; Tang, X.-G.; Sun, Q.-J. Recent Progress on Flexible Self-Powered Tactile Sensing Platforms for Health Monitoring and Robotics. Small 2024, 20, 2405520. [Google Scholar] [CrossRef] [PubMed]
  13. Guo, W.-T.; Lei, Y.; Zhao, X.-H.; Li, R.; Lai, Q.-T.; Liu, S.-Z.; Chen, H.; Fan, J.-C.; Xu, Y.; Tang, X.-G.; et al. Printed-scalable microstructure BaTiO3/ecoflex nanocomposite for high-performance triboelectric nanogenerators and self-powered human-machine interaction. Nano Energy 2024, 131, 110324. [Google Scholar] [CrossRef]
  14. Bauserman, M.; Hailey, C.; Gado, J.; Lokangaka, A.; Williams, J.; Richards-Kortum, R.; Tshefu, A.; Bose, C. Determining the utility and durability of medical equipment donated to a rural clinic in a low-income country. Int. Health 2015, 7, 262–265. [Google Scholar] [CrossRef]
  15. Alkire, B.C.; Peters, A.W.; Shrime, M.G.; Meara, J.G. The Economic Consequences of Mortality Amenable to High-Quality Health Care in Low- and Middle-Income Countries. Health Aff. 2018, 37, 988–996. [Google Scholar] [CrossRef]
  16. Canali, S.; Schiaffonati, V.; Aliverti, A. Challenges and recommendations for wearable devices in digital health: Data quality, interoperability, health equity, fairness. PLoS Digit. Health 2022, 1, e0000104. [Google Scholar] [CrossRef]
  17. Kumar, R.; Choudhary, R.; Archana; Yadav, N.; Jahangir, M. Calibration of Medical Devices: Method and Impact on Operation Quality. Int. Pharm. Sci. 2023, 16, 16. [Google Scholar] [CrossRef]
  18. Altayyar Saleh, S.; Mousa, M.; Alfaifi, A.M.; Negm, A.E.; Ali, M.O. The impact of calibration on medical devices performance and patient safety. Biomed. Res. 2018, 29, 2553–2560. [Google Scholar] [CrossRef]
  19. Bassett, D.R., Jr.; Rowlands, A.; Trost, S.G. Calibration and validation of wearable monitors. Med. Sci. Sports Exerc. 2012, 44, S32–S38. [Google Scholar] [CrossRef]
  20. Stabile, N.; Reynolds, K. Technological Review of Pulse Oximeter Simulators. J. Clin. Eng. 2002, 27, 287–297. [Google Scholar] [CrossRef]
  21. Zhang, P.; Hong, B.; Chen, J. Design of Pulse Oximeter Simulator Calibration Equipment. In Proceedings of the World Congress on Medical Physics and Biomedical Engineering, Beijing, China, 26–31 May 2012. [Google Scholar] [CrossRef]
  22. Hornberger, C.; Knoop, P.; Matz, H.; Dörries, F.; Konecny, E.; Gehring, H.; Otten, J.; Bonk, R.; Frankenberger, H.; Wouters, P.; et al. A Prototype Device for Standardized Calibration of Pulse Oximeters II. J. Clin. Monit. Comput. 2002, 17, 203–209. [Google Scholar] [CrossRef] [PubMed]
  23. Machado-Gamboa, K.; Gonzalez-Vargas, A. Development of a Low-Cost Pulse Oximeter Simulator for Educational Purposes. In Proceedings of the 2018 IEEE ANDESCON, Santiago de Cali, Colombia, 22–24 August 2018. [Google Scholar] [CrossRef]
  24. Karar, M.E. Practical microcontroller-based simulator of graphical heart sounds with disorders. In Proceedings of the 2017 International Conference on Advanced Control Circuits Systems (ACCS) Systems & 2017 International Conference on New Paradigms in Electronics & Information Technology (PEIT), Alexandria, Egypt, 5–8 November 2017. [Google Scholar] [CrossRef]
  25. Giri, A.; Chaskar, U. Phonocardiography and Photoplethysmography Circuit for Integrated Physiological Signal Acquisition. In Proceedings of the 2023 World Conference on Communication & Computing (WCONF), Raipur, India, 14–16 July 2023. [Google Scholar] [CrossRef]
  26. Babu, K.A.; Ramkumar, B.; Manikandan, M.S. Automatic Identification of S1 and S2 Heart Sounds Using Simultaneous PCG and PPG Recordings. IEEE Sens. J. 2018, 18, 9430–9440. [Google Scholar] [CrossRef]
  27. Esmaili, A.; Kachuee, M.; Shabany, M. Nonlinear Cuffless Blood Pressure Estimation of Healthy Subjects Using Pulse Transit Time and Arrival Time. IEEE Trans. Instrum. Meas. 2017, 99, 1–10. [Google Scholar] [CrossRef]
Figure 1. Multimodal smart stethoscope used in the study: (a) bottom view, (b) top view.
Technologies 13 00239 g001
Figure 2. Graphs of cardiovascular physiological signals: (a) heart sound represented as a PCG signal; (b) blood pulse wave represented as a PPG signal.
Technologies 13 00239 g002
Figure 3. Relationship between features of PCG and PPG signals.
Technologies 13 00239 g003
Figure 4. Block diagram of the proposed simulation system.
Technologies 13 00239 g004
Figure 5. Flow chart of the proposed system firmware.
Technologies 13 00239 g005
Figure 6. Picture of the electronic circuit diagram of the proposed system.
Technologies 13 00239 g006
Figure 7. Proposed system: (a) 3D model of the device design; (b) manufactured prototype; (c) prototype with multimodal smart stethoscope.
Technologies 13 00239 g007
Figure 8. Picture an example of one subject in heart sound and blood pulse wave measurement using MP160.
Technologies 13 00239 g008
Figure 9. Diagram of the experiment process.
Technologies 13 00239 g009
Figure 10. An example of one subject’s measurement data of PCG and PPG signals presented in time and frequency domain: (a) preprocessed recording data from BIOPAC MP160; (b) the signals generated by the developed simulation system measured by an oscilloscope; (c) the generated signal acquired by the multimodal smart stethoscope.
Technologies 13 00239 g010
Figure 11. Cross-correlation of PCG signals: (a) PCG signals of developed simulation system vs. pre-recorded data from MP160; (b) PCG signals of developed simulation system vs. measurement results of the multimodal smart stethoscope.
Technologies 13 00239 g011
Figure 12. Cross-correlation of PPG signals: (a) PPG signals of developed simulation system vs. pre-recorded data from MP160, (b) PPG signals of developed simulation system vs. measurement results of the multimodal smart stethoscope.
Technologies 13 00239 g012
Table 1. Comparison of key features of related works and this study.
ResearchAuthorsAdvantagesDisadvantages
Design of Pulse Oximeter Simulator Calibration EquipmentZhang, P. et al. [21]
-
High accuracy
-
Applicable for the simulation of oxygen saturation levels
-
Lack of integration with modern systems
-
Compatible only with transmissive-type PPG sensors
-
For clinical and professional use
A Prototype Device for Standardized Calibration of Pulse Oximeters IIHornberger, C. et al. [22]
-
Provides accurate simulation of oxygen saturation levels
-
Enables standardized calibration of pulse oximeters
-
Only for transmissive-type PPG sensors
-
Not compatible with newer pulse oximeter models
Development of a Low-Cost Pulse Oximeter Simulator for Educational PurposesMachado-Gamboa, K. et al. [23]
-
Educational focus
-
Low-cost and accessible for training
-
Applicable only to transmissive-type PPG sensors
-
Limited accuracy
-
Not intended for clinical calibration
Practical microcontroller-based simulator of graphical heart sounds with disordersKarar, M. E. [24]
-
Can simulate various cardiac conditions
-
Low-cost and accessible for training
-
Require an advanced technical setup
-
Not intended for clinical calibration
This work: Development of a Low-Cost Multi-Physiological Signal Simulation System for Multimodal Wearable Device CalibrationDelgerkhaan, T. et al.
-
Both PPG and PCG signal simultaneous simulation
-
Applicable reflective-type PPG sensors
-
Low-cost
-
Lack of sufficient clinical validation and need for further testing
-
Pulse simulation only; no oxygen saturation included
Table 2. Technical characteristics of PCG and PPG data from MP160.
PCGPPG
Sampling rate500 Hz500 Hz
Resolution16 bit16 bit
Sensor technologyElectret condenser microphoneLight source and photodetector
Measurement pointPulmonic area of chestFingertip
Duration21,676 milliseconds21,676 milliseconds
Disclaimer/Publisher’s Note: The statements, opinions and data contained in all publications are solely those of the individual author(s) and contributor(s) and not of MDPI and/or the editor(s). MDPI and/or the editor(s) disclaim responsibility for any injury to people or property resulting from any ideas, methods, instructions or products referred to in the content.

