Abstract
The linear economy model in the sugar agroindustry has generated multiple impacts due to the underutilization of by-products and reliance on fossil fuels. Through predictive modeling and anaerobic digestion, the circular bioeconomy of sugarcane biomass enables the generation of biogas and electricity in an environmentally sustainable manner. This theoretical-applied research proposes a predictive model to estimate the energy potential of by-products such as bagasse, vinasse, molasses, and filter cake, based on historical production data and validated technical coefficients. The model uses milled sugarcane as a baseline and projects its energy conversion under three scenarios through 2030. In its most favorable configuration, the model estimates energy production of up to 15.5 billion Nm3 of biogas in Cuba and 9.9 billion in Peru. The model’s architecture includes four residual biomass flows and bioenergy conversion factors applicable to electricity generation. It is validated using national statistical series from 2000 to 2018 and presents relative errors below 5%. Cuba, with a peak of over 13,000 GWh of electricity from bagasse, and Peru, with a stable output between 6500 and 7500 GWh, reflect the highest and lowest projected energy utilization, respectively. Bagasse accounts for over 60% of the total estimated energy contribution. This modeling tool is fundamental for advancing a transition toward a circular economy, as it helps mitigate environmental impacts, improve agroindustrial waste management, and guide sustainable policies in sugarcane-based contexts.
1. Introduction
The sugar industry plays a crucial role in global economic and social development, providing food, energy, and renewable materials [1,2]. Sugarcane production is one of the largest agricultural industries worldwide, supporting millions of jobs and contributing significantly to the economies of many tropical and subtropical countries. However, large-scale sugarcane processing generates substantial quantities of by-products such as vinasse, bagasse, filter cake, molasses, and leaves, whose improper disposal poses severe environmental challenges due to their high organic load [3,4]. These residues, traditionally considered waste, have significant untapped energy potential that can be harnessed through anaerobic digestion for biogas production, representing a key alternative to mitigate environmental impacts while meeting industrial energy demands [5,6]. The valorization of these residues not only reduces environmental risks but also aligns with global efforts toward sustainable development and the circular economy.
Various studies have demonstrated the high energy potential of sugarcane by-products. Vinasse, a liquid residue from ethanol distillation, presents notable biogas yields (5–21 Nm3/t), which can be further enhanced through advanced techniques such as phase separation, co-digestion, and effluent recirculation for pH stabilization and inhibitor control [7,8]. Bagasse and sugarcane leaves, composed primarily of lignocellulosic biomass, require specific pre-treatments to optimize their anaerobic digestion, achieving yields of 120–280 Nm3 biogas/t [9]. Similarly, filter cake, a solid residue rich in nutrients, has been shown to favor co-digestion processes, resulting in significant biogas production (50–90 Nm3 biogas/t) [7,10]. Despite these advances, the full potential of these residues remains underexplored, particularly when considering their simultaneous generation and transformation into bioenergy within the context of integrated sugarcane milling operations. In recent decades, multiple studies have demonstrated the energy potential of sugar agroindustry by-products through Anaerobic Digestion (AD). Bagasse, due to its high lignocellulosic content, has been subjected to pre-treatments such as alkaline or thermal to improve its biodegradability; for example, Mustafa et al. [11] and Janke et al. [12] reported 22–25% increases in methane yield, reaching up to 320 mL /gSV under mesophilic conditions. Paulsen et al. [13] validated stable production in semi-continuous reactors with bagasse alone. On the other hand, stillage, despite its dilution, presents a high organic load (COD > 80 g/L) and has been successfully processed with yields of 12–25 m3 /t, although with pH buffering requirements [14].
Studies such as those of Alfonso-Cardero et al. [15] in Cuba and Parsaee et al. [16] evidence its economic and energetic feasibility. As for filter cake, its nutritional richness has allowed it to be used as a stabilizing co-substrate, increasing biogas production by up to 30% [17,18]. In addition, emerging technologies such as two-phase digesters, structured bed systems or use of biochar have shown substantial improvements in efficiency; for example, Widyastuti et al. [19] increased production by 42% with Electro-Fenton pre-treatment, while Ma et al. [20] used Fe3O4 Nanoparticles and biochar as a direct electron transfer (DIET) conductor. Finally, several authors have addressed techno-economic simulations and predictive models integrating waste co-utilization: Masala et al. [21] and Srinivas et al. [22] estimated energy self-sufficiency of 73% combining vinasse biogas and bagasse cogeneration, while Tian et al. [23] calculated net emissions of 0.21 kg -eq/kWh under centralized biogas schemes. Despite these advances, a major gap persists: the lack of validated predictive models that estimate multiresidue energy potential from actual milling data and generated by-products. This study addresses this gap through an empirically validated model that allows for estimating the biogas potential per ton of sugarcane processed, comparing two contrasting national scenarios such as Peru and Cuba, and offering a practical tool for energy planning in the framework of the circular bioeconomy.
Biogas production from agro-industrial wastes has been widely explored as an energy and environmental solution in the context of the circular economy. In the case of the sugar industry, several studies have reported specific methanogenic yield values depending on the type of by-product. Arelli et al. [24] achieved 302 mL /gSV in solid digestion of bagasse with addition of cellulolytic bacteria, while Agarwal et al. [25] recorded 278 mL /gSV with conventional mesophilic digestion of the same residue. As for stillage, Wolpi et al. [26] achieved 230 mL /gSV in co-digestion with filter cake and delignification liquor, also obtaining an organic matter removal efficiency of 83%. Romaniuk et al. [27] reported values between 18 and 22 m3 /t of stillage depending on its origin (molasses vs. juice), while Cheong et al. [28] achieved a yield of 0.29 L /g COD removed by optimizing mixing ratios and retention time.
In co-digestion with filter cake, Wongarmat et al. [29] reported a 27% increase in methane production compared to vinasse mono-digestion. On the other hand, ref. [30] used subcritical hydrothermal pre-treatment on lignocellulosic waste and increased biogas production by 45%. At the simulation level, Tiong et al. [31] optimized systems with COD removals of 81.5% and estimated payback time of 6 years, validating the economic viability of the technology. From an integrated approach, Mazuchi et al. [32] and Kapanji et al. [33] conducted a technoeconomic and life cycle analysis (LCA) in a sugarcane biorefinery, identifying methanol synthesis as the most profitable option with a return of 16.7%, and ethanol-lactic co-production as the one with the lowest sensitivity to market prices. Karp et al. [34] analyzed the role of bagasse as a renewable carbon vector, highlighting its contribution to emission reduction schemes in the sector.
Despite these advances, the studies reviewed present common limitations: (i) they focus on specific experimental conditions, (ii) they do not integrate multi-residue estimates based on processed sugarcane volumes, and (iii) they lack empirical validation with real industrial data on a national scale.
In parallel, numerous studies have applied mathematical models to optimize anaerobic digestion processes, improving energy yields across various sectors, including agricultural [35,36], livestock [37,38], industrial [39,40], and municipal [41,42] waste management. These models have contributed to precise yield prediction, operational optimization, and process control, enhancing the efficiency of biogas production systems. However, existing models rarely consider the simultaneous generation and treatment of multiple by-products derived specifically from the sugarcane milling process. This limitation significantly restricts their applicability in the sugar industry, where the integration of diverse residues is essential for maximizing resource recovery and minimizing environmental impacts.
The absence of comprehensive mathematical models capable of predicting the simultaneous generation of all by-products derived exclusively from historical sugarcane milling production data represents a critical gap in the current research. This gap is particularly concerning given the environmental, economic, and social implications of sugarcane residue management. For instance, improper disposal of vinasse and bagasse contributes to soil and water contamination, while open burning of residues releases harmful pollutants into the atmosphere, exacerbating climate change and public health risks [43,44]. Furthermore, the lack of predictive tools limits the ability of mills to optimize resource utilization, hindering their transition toward sustainable and circular practices.
Addressing this gap is especially urgent in regions with high climatic and operational variability, such as Peru and Cuba, where sugarcane production is a cornerstone of the agricultural sector. In these regions, variations in rainfall, soil fertility, and harvesting practices can significantly influence the quantity and composition of generated residues, making it challenging to predict their bioenergy potential accurately [45]. Additionally, the unique socio-economic and regulatory contexts of these countries necessitate tailored solutions that account for local conditions. For example, in Peru, small-scale mills often face financial and technical constraints that limit their ability to adopt advanced technologies, while in Cuba, centralized state-controlled mills require region-specific strategies to maximize resource recovery and energy generation [46].
This study addresses this critical research gap by developing and validating innovative predictive mathematical models based on historical sugarcane milling data. These models aim to provide a comprehensive evaluation of the simultaneous generation of by-products, their efficient transformation into biogas, and the associated electricity generation. By comparing scenarios in Peru with those in Cuba, this research offers valuable insights into the adaptability and scalability of the proposed models across different geographical and operational contexts. Ultimately, this work contributes to scientific and technological development, strengthening global sustainability and facilitating the effective transition toward a circular economy in the sugar industry. The findings hold the potential to inform policy decisions, optimize resource utilization, and promote environmentally sustainable practices in sugarcane-producing regions worldwide.
The main purposes of this article are as follows:
- The development of a data-driven predictive mathematical model capable of estimating the bioenergy potential of sugarcane by-products (bagasse, vinasse, filter cake and molasses) based solely on historical milling data, without requiring extensive laboratory or kinetic testing.
- Validation of the model with real historical production series (2011–2018), achieving a relative error of less than , which reinforces its robustness and operational applicability.
- The provision of an accessible and scalable tool for estimating bioenergy potential that can support national bioeconomy strategies and industrial decarbonization efforts, particularly in emerging economies.
The research is structured as follows: Section 1, Introduction, presents the relevance of energy recovery from agro-industrial by-products in the framework of the circular bioeconomy and the need for predictive tools in energy planning in the sugar sector. Section 2, Materials and Methods, describes the development of the mathematical models and statistical analyses that allow for the validation of the estimation coefficients used and their ratification under a real approach to historical production data. Section 3, Results and Discussion, presents the model projections for biogas and electricity generation, including a comparative analysis of the Cuban and Peruvian sugar industries. Section 4, Conclusions, highlights the implications of the model for sustainable energy planning and industrial optimization in the sugar sector.
2. Materials and Methods
In order to take advantage of the use of organic residues generated in sugar mills, it is necessary to apply equations to accurately calculate their production from the tons of cane processed. These equations can only be used if the data on tons of residue produced is provided by the mills themselves. Later, the equations will be given to calculate the generation of residues and to obtain an idea of the percentage of each one.
2.1. Equations for the Percentage of Substrate in Milled Cane, Bagasse, Vinasse, Molasses
The total percentage of filter cake in cane is determined using Equation (1)
The total percentage of bagasse in cane is determined using Equation (2)
The total percentage of vinasse (3) in cane is determined using the following equation:
The total percentage of molasses (4) in cane is determined using the following equation:
2.2. By-Products Derived from Sugarcane
A wide range of by-products derived from sugarcane processing have been reported in the literature, with bagasse being the most prominently studied. Bagasse typically represents 17–30% of sugarcane mass, depending on the moisture content and production conditions. Global and national estimates report values such as 17–18% [47], 26% in Brazil for the 2013–2014 harvest [48], and up to 28–30% for fresh mass in Thailand and India [49,50]. Dry mass estimates range between 10% and 28%, with 13.5% to 16.2% frequently cited for dry bagasse [34,51,52]. Technical assessments and modeling studies confirm similar values, supporting the reliability of bagasse as a consistent by-product [53].
Vinasse, another major by-product particularly from ethanol production, is generally reported at 10–17% of cane or ethanol volume, although figures can vary depending on process type. Estimates range from 10 to 15% by volume of ethanol produced [16,49,54], with one study reporting 1.7 t per 1000 t of cane, or 17% [55]. Broader ranges (e.g., 156–910 L/tonne of cane) have been noted based on plant type [53], while others confirm 15 L/L of ethanol or 438–1038 L/t cane, equivalent to 44–104% depending on plant integration [7,56].
The by-product known as filter cake typically ranges between 2% and 5% of cane mass, with an average of 3% commonly reported [57,58]. Studies in Cuba and other countries confirm these values, citing 3–5% depending on the mill configuration and extraction method [10,18,59]. Morphological or technical evaluations corroborate this range, showing filter cake as a consistent output from juice clarification [7,60].
Finally, molasses, which is a by-product of the sugar crystallization phase, is usually found in the range of 3–5% of processed cane. ISO norms and industrial studies in various countries support values between 3% and 4.45% [59,60,61,62]. Some reports extend up to 5%, particularly when final centrifugation stages are considered [63]. These reports serve as the basis for validating the model statistically in terms of estimating the bio-products for this research.
The production of biogas from sugarcane by-products represents a sustainable opportunity to valorize waste streams generated during sugar production. The main by-products considered for biogas generation include bagasse, vinasse, filter cake, and molasses. Each of these materials has distinct biochemical characteristics that influence their specific biogas yields.
The following Equations (5) and (8) describe the calculation of the total biogas production from each by-product, based on the mass of the substrate and its specific biogas yield. The total biogas production is then obtained as the sum of the contributions from each individual by-product (9). These equations are useful for estimating the energy potential of sugar mills that implement anaerobic digestion processes as part of their waste management strategy. Additionally, they provide insights into the optimization of biogas production by identifying the most significant contributing substrates.
2.3. Equations for Biogas Production from Substrates in Sugar Mills
Accurate estimation of bioenergy potential in agro-industrial systems depends on mathematical models that directly relate the quantities of residual biomass to its specific yield in terms of biogas production. In this context, the study by Castillo Alvarez et al. [10] establishes a rigorous methodological framework to quantify the volume of biogas generated from the main by-products of the sugar industry, using empirically validated equations.
These formulas consider the total mass of the generated by-product and the specific biogas yield per ton of material , expressed in normal cubic meters .
2.4. Biogas Production from Bagasse
Bagasse, the fibrous residue left after sugarcane juice extraction, is a major by-product in sugar mills. Due to its lignocellulosic composition, it has a moderate biogas yield when subjected to anaerobic digestion. Equation (5) presented here calculates the biogas production based on the mass of bagasse and its specific biogas yield.
where
- : Total volume of biogas generated from bagasse (in ).
- : Total mass of bagasse generated (t).
- : Specific biogas yield per ton of bagasse (/t).
2.5. Biogas Production from Vinasse
Vinasse is a liquid by-product generated during ethanol production from sugarcane molasses. It is characterized by a high organic load, making it a valuable substrate for biogas production. Equation (6) provides a straightforward calculation using the mass of vinasse produced and its specific biogas yield.
where
- : Total volume of biogas generated from vinasse ().
- : Total mass of vinasse generated (t).
- : Specific biogas yield per ton of vinasse (/t).
2.6. Biogas Production from Filter Cake
Filter cake, also known as press mud, is a solid by-product obtained during the sugarcane juice clarification process. Rich in organic matter (7), it serves as an efficient feedstock for biogas generation. This section uses the mass of filter cake and its specific yield to estimate the biogas production.
where
- : Total volume of biogas generated from filter cake ().
- : Total mass of filter cake generated (kg).
- : Specific biogas yield per kilogram of filter cake (/kg).
2.7. Biogas Production from Molasses
Molasses is the thick, viscous syrup remaining after sugar crystallization. While commonly used in ethanol production, its residual organic content also makes it suitable for anaerobic digestion. Equation (8) here estimates biogas generation by multiplying the mass of molasses by its specific yield.
where
- : Total volume of biogas generated from molasses ().
- : Total mass of molasses generated (kg).
- : Specific biogas yield per kilogram of molasses (/kg).
2.8. Total Biogas Production
The total biogas production from sugar mills is obtained by summing the contributions from bagasse, vinasse, filter cake, and molasses. This comprehensive Equation (9) provides a holistic view of the biogas generation potential, supporting sustainable waste management and energy recovery in the sugar industry.
Table 1 and Table 2 provide an overview of biogas production estimates from various sugarcane by-products, based on findings from different studies. The data includes values for bagasse, vinasse, filter cake, and molasses under different experimental and industrial conditions.

Table 1.
Biogas generation from pure sugar industry by-products.
Table 2.
Biogas production from pure by-products of the sugar industry.
The tables highlight the variability in biogas yields, influenced by factors such as substrate composition, pre-treatment methods, reactor configurations, and operational parameters. For example, studies report a wide range of methane production from bagasse, depending on the use of physical or chemical pre-treatments. Similarly, vinasse biogas yields can vary significantly depending on the organic load and reactor type.
These values serve as a reference for assessing the biogas potential of sugar mills and can support decision-making for the implementation of anaerobic digestion systems. Additionally, the comparison between different studies provides insights into the factors that optimize biogas generation and energy recovery from sugarcane waste streams.
2.9. Determining the Electricity Generation Potential from Biogas
The conversion of biogas into electricity represents one of the most strategic applications in the energy recovery of organic waste, especially in agro-industrial, rural, and decentralized urban contexts. Since the energy content of biogas varies depending on its composition (mainly the methane proportion) and the type of technology used (internal combustion engines, microturbines, cogeneration systems, etc.), it is essential to have technically validated conversion coefficients that allow for accurate estimation of its electrical performance.
The conversion of biogas to electrical energy is expressed by Equation (10):
where
- : Electrical energy generated (kWh).
- : Total biogas ().
- k: Conversion coefficient (kWh/).
Table 3 and Table 4 systematically compile the results from the literature review of studies published between 2020 and 2024, covering a variety of technological and geographical contexts. Each entry presents the average electrical efficiency of the applied technology, the energy conversion range in kilowatt–hours per normal cubic meter of biogas (kWh/Nm3), and specific remarks that justify the reported values, such as operating conditions, assumed Lower Heating Value (LHV), or the methane (CH4) proportion used in the models.
Table 3.
Reported biogas-to-electricity conversion factors and electrical efficiencies in diverse technological contexts.
Table 4.
Biogas-to-electricity conversion factors according to reviewed scientific literature.
2.10. Univariate Descriptive Analysis of Central Tendency, Dispersion, and Range
To evaluate the distribution of the data obtained in biogas production studies, descriptive statistical measures are applied. These include indicators of central tendency, dispersion, and extreme values, providing an effective characterization of data behavior.
2.10.1. Arithmetic Mean ()
The arithmetic mean Equation (11) is a measure of central tendency that reflects the average value of the sample, offering an overview of biogas yield.
where
- −
- : Mean or average of the values.
- −
- : Each individual value of the variable (biogas yield).
- −
- n: Total number of observations (considered studies).
2.10.2. Sample Standard Deviation (s)
The standard deviation Equation (12) measures the dispersion of data relative to the mean, providing insight into biogas yield variability.
where
- −
- s: Standard deviation.
- −
- : Each individual value of the variable.
- −
- : Arithmetic mean of the values.
- −
- n: Total number of observations.
2.10.3. Range (R)
The range is a simple measure Equation (13) of dispersion that shows the difference between the maximum and minimum values, reflecting the data’s amplitude.
where
- −
- R: Range or data amplitude.
- −
- : Maximum observed value.
- −
- : Minimum observed value.
2.10.4. Scenario-Based Parameterization for Modeling Outcomes
To account for the inherent variability in the data and ensure a robust assessment of energy potential, three scenarios were defined: pessimistic, realistic, and optimistic. Each scenario is based on statistical criteria derived from observed values or percentiles, allowing the model to represent a range of possible outcomes. The following sections describe the criteria and equations used to determine the parameters for each scenario.
Low Value (Pessimistic Scenario)
The low value represents a pessimistic scenario in Equation (14), corresponding to the minimum observed value or the 10th percentile if a large amount of data is available.
where
- −
- : Minimum observed value or 10th percentile in the case of large datasets.
Middle Value (Realistic Scenario)
The middle value, represented by the arithmetic mean Equation (15), reflects a realistic or expected scenario.
where
- −
- : Arithmetic mean, assumed as the expected value.
High Value (Optimistic Scenario)
The high value Equation (17) describes an optimistic scenario, determined by the maximum observed value or the 90th percentile if a large volume of data is available.
where
- −
- : Maximum observed value or 90th percentile in the case of large datasets.
2.11. Principal Component Analysis (PCA)
To reduce the dimensionality of the waste system and explore redundancies among variables, a Principal Component Analysis (PCA) was applied using the correlation matrix of four standardized variables: bagasse, vinasse, filter cake, and molasses (in t/tn).
The variables were normalized to zero mean and unit variance prior to the analysis. The calculation of the principal components is based on the eigenvalue system:
Statistical Foundation
Given a standardized dataset Z of order (n observations and p variables), PCA is constructed from the covariance matrix (17), or alternatively from the correlation matrix when the variables are on different scales, as is the case here:
The analysis consists of solving the following matrix system (18):
where
- : eigenvalues (variance explained by each component).
- v: eigenvectors (principal directions).
- : k-th principal component.
The eigenvalues indicate the proportion of total variance explained by each component, and the eigenvectors define the linear combinations of variables that generate these components.
2.12. Time Trend Analysis and Outlier Detection
A univariate time series analysis was performed on the percentage of filter cake produced per ton of cane processed, using data from the years 2013 to 2017. The objective was to determine whether there is an increasing or decreasing trend in this percentage over time.
Linear Trend Regression
The fitted model Equation (19) was
where
- : Percentage of filter cake in year t.
- : Intercept.
- : Slope of the trend (annual change).
- : Error term.
2.13. Evaluation of the Consistency of Technical Coefficients vs. Real Data (2011–2018, Peru)
Compare the estimated amounts of by-products calculated using fixed technical coefficients with the actual recorded data for Peru between 2011 and 2018. Then, compute the Percentage Relative Error (ERP) to assess how accurately the statistical model reflects real-world outcomes. The technical coefficients used are shown in Equation (20):
2.14. Future Projection of Biogas Production Potential (2024–2030)
To estimate the potential biogas volume (in Nm3) that Peru and Cuba could generate from 2024 to 2030, three scenarios for the evolution of sugarcane production were assumed, based on historical trends and industrial growth assumptions. Table 5 summarizes the assumptions applied in the prospective simulation, including projected growth scenarios, historical average sugarcane production for each country, and the technical coefficients used to estimate the biogas volume generated by each type of by-product.
Table 5.
Parameters and scenarios applied for the biogas projection for Peru and Cuba (2024–2030).
2.14.1. Projected Processed Cane per Year
For scenarios E2 and E3, the projected cane for each year is calculated as follows in Equation (21):
where
- : Projected cane in year n (tons).
- : Historical average (tons).
- g: Annual growth rate (0.025 or 0.05).
- n: Number of years since 2023 ( for 2024, …, for 2030).
2.14.2. Estimated By-Product Calculation
- : Tons of by-product i in year n.
- : Projected cane in year n (in tons).
- : Percentage of by-product i over the cane.
2.14.3. Biogas Production per By-Product
The biogas production of by-product i in year n is calculated using the following Equation (23):
where
- : Biogas generated from by-product i in year n (in ).
- : Tons of by-product i in year n.
- : Biogas production per ton (/t).
2.14.4. Estimated Total Annual Biogas
The total biogas production in year n is obtained by summing the biogas production from each by-product Equation (24):
where
- is the total estimated biogas in year n.
- is the biogas production from by-product i in year n.
3. Results and Discussion
In order to validate the mathematical models and technical coefficients used in the research on the estimation of by-products and biogas potential, official sources from the Peruvian agro-industrial sector were consulted. In particular, data from the Statistical Bulletin of the Sugar Industry of Peru, published by the Ministry of Agriculture and Irrigation (MINAGRI) [90], were used. This bulletin provides consolidated national production records for the period 2011–2018.
The bulletin includes actual values of milled sugarcane, as well as the annual reported tonnages of bagasse and molasses produced by the country’s sugar agro-industry. These data enabled the precise calculation using Equations (2) and (4) of the actual percentages these by-products represent with respect to the total processed sugarcane for each year, as shown in Table 6.
Table 6.
Actual production of milled sugarcane, bagasse (), and molasses () in Peru (2011–2018).
The detailed analysis revealed that bagasse represented between and of the total milled sugarcane, while molasses ranged from to during the same period. These values, in addition to being supported by official data, are consistent with the coefficients assumed in this study ( for bagasse and for molasses), thus providing robustness and external validity to the equations used in the bioenergy potential estimation model.
The data presented in Table 7 allow for an accurate calculation using (1) of the percentage of filter cake obtained with respect to the total milled sugarcane, thus serving as a valid reference to contrast with values estimated through mathematical models. This information, systematized from operational records of the sugar mill, provides insight not only into the total volume of processed sugarcane, but also into the actual amount of filter cake generated per harvest. In particular, the records published by [10] were used, which provide annual data on milled sugarcane and filter cake production from a representative mill in Cuba for the period 2013–2017.
Table 7.
Milled sugarcane and filter cake () production at the mill during the last 5 harvest seasons.
The analysis of the data reveals that filter cake production ranged between and of the total milled sugarcane, with an average around . These results, in addition to being supported by actual operational records, fall within the technical range referenced by the specialized literature (2.5–5.5%), which confirms the validity of using an estimated coefficient of in the applied mathematical model. The convergence between the observed real values and the estimated proportions strengthens the reliability of the bioenergy potential estimation based on the fraction of filter cake generated in the industrial process.
Unlike by-products such as bagasse, molasses, and filter cake, in the case of vinasse there are no official statistical data or direct production records available in the annual reports of the sugar industry. This situation arises because vinasse, being a liquid residue derived from the fermentation and distillation process for ethanol production, is not always quantified as a by-product in milled cane statistics, especially when the distillery is not annexed to the main plant.
However, the relevance of this residue in bioenergy studies is unquestionable, as it represents a significant source of organic matter susceptible to anaerobic digestion. Therefore, the estimation of vinasse generation is based on values published in peer-reviewed international scientific literature, derived from empirical and industrial studies conducted in Brazil, India, Thailand, and Latin America, under technological contexts comparable to the present study.
For this reason, Table 8 presents an analysis of the scientific literature.
Table 8.
Reported percentages of vinasse () in scientific literature.
The percentages of vinasse reported in various research studies each published in high impact, indexed scientific journals in the fields of bioenergy, process engineering, and waste treatment have been used as key references. These values, mostly expressed as a percentage relative to milled sugarcane, served as the basis for estimating the fraction of vinasse generated per ton of cane in this work. A representative coefficient of was adopted, as it is validated and consistently cited in the scientific literature.
3.1. Statistical Analysis Results by By-Product from Sugar Mills
In order to select representative and reliable coefficients for estimating biogas production by substrate type, a systematic review of scientific articles published in high-impact international journals was conducted. This review focused on experimental and technical-industrial studies that reported specific biogas production values, expressed in normal cubic meters per ton of processed by-product (Nm3/t).
Based on this compilation, classical statistical dispersion analysis methods were applied. For each by-product, the arithmetic mean, standard deviation, and reported minimum (low) and maximum (high) values were obtained. These results are presented in Table 9, which summarizes the quantitative basis used to estimate the theoretical biogas production potential in the proposed model.
Table 9.
Theoretical potential analysis of biogas production by by-product.
The results of this analysis confirm that the coefficients commonly used in bioenergy modeling 30% for bagasse, 3–4% for molasses and filter cake, and 12–15% for vinasse—are strongly supported by empirical and theoretical evidence Table 10. This methodological strategy increases the reliability of the values applied in the by-product simulation model and justifies their use both in national scenarios and international extrapolations.
Table 10.
By-product percentage relative to milled sugarcane: Combined analysis (real data + literature).
In order to establish a representative technical value for the conversion of biogas into electrical energy, a review of the recent scientific literature was conducted, covering studies developed between 2020 and 2025. The reviewed works span a wide range of technologies, including adapted diesel engines, Combined Heat and Power (CHP) systems, Solid Oxide Fuel Cells (SOFC), and industrial-scale plants powered by LandFill Gas (LFG), in contexts ranging from rural biodigesters to large-scale urban facilities. Based on 16 collected values, a statistical database was constructed to evaluate the variability and consistency of electrical conversion coefficients for biogas, expressed in kilowatt–hours per normal cubic meter (kWh/Nm3) (Table 11).
Table 11.
Analysis of the biogas-to-electricity conversion factor.
The descriptive statistical analysis of the conversion coefficients allows the identification of typical, extreme, and central tendency values. This analysis provides a solid basis for selecting reliable factors in energy modeling scenarios applied to agro-industrial bioenergy projects, such as the utilization of biogas generated from sugarcane residues in Peru and Cuba.
3.2. Determination of By-Product Content and Its Energy Recovery Based on Actual Milling Data
In order to establish a solid empirical basis for estimating the technical content of agro-industrial by-products and their subsequent energy recovery, historical series of official data on the annual production of milled sugarcane were collected for the two main countries under study: Cuba and Peru (Table 12). This information constitutes the primary input for applying the previously validated statistical coefficients for the generation of bagasse, filter cake, molasses, and vinasse per ton of processed sugarcane, enabling a quantitative modeling of the bioenergy potential derived from the sugar industry.
Table 12.
Annual production of milled sugarcane in Cuba and Peru (2000–2018).
The values for Cuba were extracted from the 2022 Statistical Yearbook of Cuba, published by the National Office of Statistics and Information (ONEI) [91], specifically from the column corresponding to “Total Production (MMt)” intended for industrial use, and subsequently converted into metric tons.
In turn, the data for Peru were taken from the Statistical Bulletin of the Sugar Industry published by the Ministry of Agriculture and Irrigation (MINAGRI), which reports consolidated annual milling figures by harvest season at the national level.
This information will be used as the basis to calculate, through validated percentage coefficients, the total estimated mass of each by-product, biogas production, and electricity generation for both countries. This approach ensures methodological consistency and rigor in the technical–productive and energy potential comparison between different national contexts.
Figure 1 shows the temporal evolution of the main by-products derived from sugarcane milling for Cuba (left) and Peru (right) during the 2000–2009 period, expressed in metric tons (t). The by-products considered—bagasse, filter cake, molasses, and vinasse—were estimated from the volume of processed sugarcane using previously validated technical coefficients: for bagasse, for filter cake, for molasses, and for vinasse, respectively.
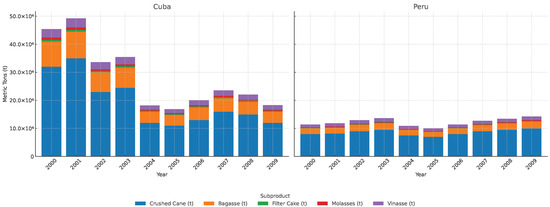
Figure 1.
Comparative annual yields of sugarcane by-products in Cuba and Peru from 2000 to 2009.
During the early years (2000–2001), Cuba recorded peak milling levels with over 32 and 34 million tons of sugarcane, respectively, resulting in exceptional by-product volumes, notably bagasse exceeding 10 million tons annually, and vinasse approaching 5 million tons. This behavior reflects the country’s installed capacity and its historical centrality in the Caribbean sugar industry. However, from 2002 onward, a sustained declining trend is observed, attributed to industrial restructuring, mill closures, and broader economic reforms. The volume of milled cane drops sharply from 2003, leading to a proportional decline in by-products. By 2009, bagasse falls below 5 million tons, while vinasse drops to under 2.5 million tons. This reduction implies not only a loss in bioenergy potential but also a decrease in waste generation for potential composting or organic fertilization.
In contrast, Peru presents a more stable trajectory with progressive growth. Although the initial volume of milled cane in 2000 was significantly lower (7 million tons), it maintains a pattern of moderate but steady increase throughout the decade. By 2009, milling exceeds 9.9 million tons, leading to a corresponding rise in by-products: bagasse reaches approximately 3 million tons, and vinasse surpasses 1.3 million. The consistency of Peru’s trend indicates institutional strengthening and progressive technological development in the sector, providing a stable foundation for energy recovery projects and integrated waste utilization.
Figure 2 presents the annual evolution of the main by-products generated from sugarcane milling in Cuba and Peru, from 2010 to 2018. The values are derived from the total officially reported milled cane volumes, multiplied by the previously established technical coefficients for this case study.
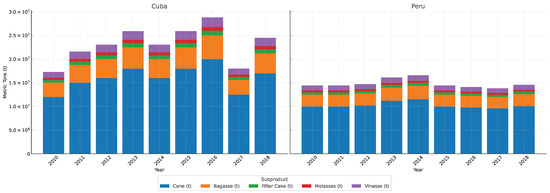
Figure 2.
Trends in annual sugarcane by-product generation in Cuba and Peru between 2010 and 2018.
During the analyzed period, Cuba experienced a progressive recovery in sugarcane milling from 2010 to 2016, reaching a peak of nearly 20 million tons in 2016. This improvement is proportionally reflected in all by-products. Bagasse remained the main lignocellulosic residue, exceeding 5.9 million tons at its peak, while vinasse, a liquid by-product with high organic load, showed a notable increase, surpassing 2.7 million tons in 2016. However, a sharp contraction occurred in 2017, with a decline in milled cane directly impacting the reduction of by-products. This drop may be related to structural, climatic, or logistical factors, highlighting the vulnerability of Cuba’s agro-industrial system to exogenous disruptions.
The Peruvian case shows a more stable and controlled trend, characterized by relatively constant cane milling around 10 million tons annually, with slight year-to-year variations. This stability translates into a consistent by-product generation, with bagasse consistently ranging between 2.9 and 3.1 million tons, and vinasse between 1.3 and 1.4 million. Peru’s regularity reflects institutional consolidation in the sector, efficient agricultural and industrial planning, and lower exposure to disruptive events. Furthermore, the coherent behavior of by-products makes it an ideal scenario for implementing sustained energy recovery strategies (biogas, biofertilizers, composting) with lower operational uncertainty.
During the 2000–2008 period (Figure 3), the estimated biogas production in Cuba showed a marked downward trend across all by-products, clearly correlated with the progressive decline in sugarcane milling reported during those years. In the case of bagasse—the main source of biogas—a drop of more than is observed, decreasing from values above 1.7 × 10⁹ Nm3 in 2001 to less than 7 × 10⁸ Nm3 in 2009. Similar trends were identified for liquid and solid by-products (molasses, vinasse, and filter cake), with sustained but less pronounced declines. In contrast, biogas production in Peru remained relatively stable or showed a slight upward trend, reflecting an agro-industrial sector with greater productive stability. The most notable case is Peruvian bagasse, which shows a slightly increasing trend, ranging from 3.5 × 10⁸ to 5.3 × 10⁸ Nm3 over the same period. This divergence between the two countries highlights structural differences in the efficiency of the sugar sector, technological modernization policies, and energy recovery capacity from waste. Cuba, with a historically larger sugarcane volume, experienced a sharp decline in its energy potential due to industrial contraction, whereas Peru maintained a growing and more sustained utilization of its by-products for biogas production.
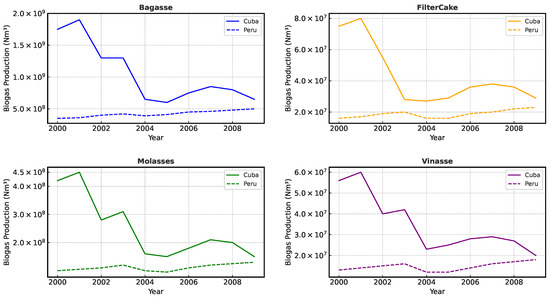
Figure 3.
Annual Yearly biogas yield by residue type in Peru and Cuba.
During the 2010–2018 period (Figure 4), the estimated biogas production in Cuba experienced a sustained recovery, with notable increases across most by-products, especially bagasse, which peaked in 2016 at nearly 6 × 10⁹ Nm3. This growth reflects a period of industrial revitalization, possibly linked to technological improvements and greater efficiency in sugarcane milling. The behavior of by-products such as molasses, vinasse, and filter cake also showed a general upward trend, although with fluctuations characteristic of agro-industrial cycles. In contrast, Peru maintained a more stable biogas production, with slight increases in bagasse until 2014, followed by stabilization around 2.8–3 × 10⁹ Nm3. Biogas production from molasses and vinasse in Peru also remained within consistent ranges, demonstrating a mature industry with lower interannual variability. Overall, the data show that Cuba achieved a significant recovery following the contraction of the previous period, while Peru continued along a more stable and predictable trajectory. This highlights two distinct approaches to management and technological evolution in the energy recovery of agro-industrial residues.
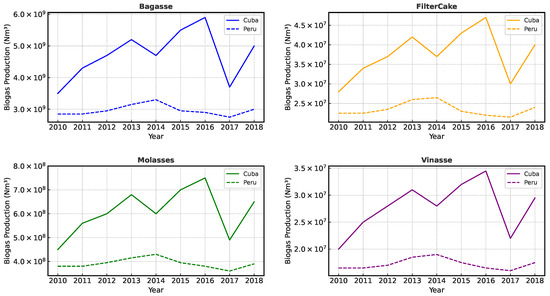
Figure 4.
Annual biogas production in Peru and Cuba.
Figure 5 shows the 2000–2009 period, where a clear disparity is observed in electricity generation from sugarcane by-products between Cuba and Peru. Cuba stands out with higher levels of electricity production, thanks to a greater availability of biomass, consolidated energy infrastructure, and policies aimed at the valorization of agro-industrial residues.
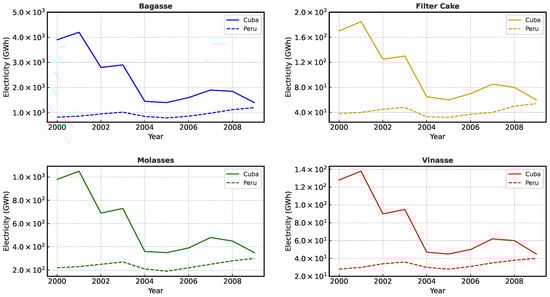
Figure 5.
Electricity generation through biogas in Cuba and Peru (2000–2009).
Bagasse stands out as the main energy vector, reaching over 4000 GWh in Cuba in 2001 before stabilizing between 1400 and 1900 GWh towards the end of the period, while Peru shows continuous growth from 850 GWh to over 1200 GWh. Regarding filter cake, Cuba shows a steady decline from 185 GWh to around 60 GWh, in contrast with Peru, which advances steadily between 39 and 53 GWh. Electricity generation from molasses also decreased significantly in Cuba (from 1050 to 350 GWh), possibly due to variations in industrial use of the by-product, while Peru shows a gradual increase (from 220 to 310 GWh). Finally, vinasse follows a downward trend in Cuba, from 135 to 47 GWh, while Peru shows a slight but steady rise from 28 to 41 GWh, reflecting greater interest in the use of liquid waste through anaerobic digestion.
During the 2010–2018 period, Cuba maintained a significant advantage over Peru in electricity generation from sugarcane by-products, with bagasse standing out as the main energy source, peaking at over 13,000 GWh in 2016. Peru showed more stable production, between 6500 and 7500 GWh. Filter cake had less impact, although Cuba exceeded 90 GWh, while Peru remained between 50 and 60 GWh. Regarding molasses, Cuba reached more than 1700 GWh at its peak, compared to Peru at 820–1000 GWh. Although vinasse has low energy potential, it showed steady growth, with Cuba reaching 79 GWh and Peru between 38 and 45 GWh (Figure 6). These differences reflect not only the availability of biomass, but also the effects of policies, technologies, and operational efficiency in each country.
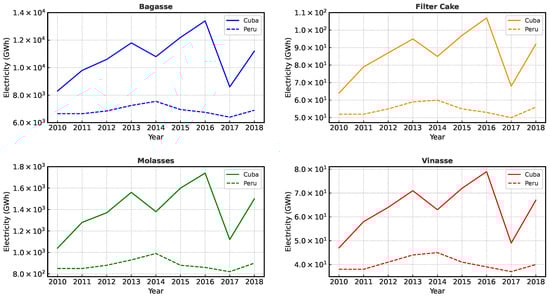
Figure 6.
Electric power output from biogas by residue category in Cuba and Peru (2010–2018).
This analysis demonstrates that both Cuba and Peru possess significant and complementary by-product matrices, whose technical management can contribute substantially to the energy transition and circular economy in agro-industrial contexts. From a public policy and energy planning perspective, this chart supports the need to adopt differentiated strategies for each country: in Cuba, it is recommended to prioritize industrial revitalization plans with energy integration; in Peru, to leverage structural growth to consolidate a sustainable circular bioeconomy model based on the systematic use of sugar industry by-products.
3.3. Evaluation of the Consistency of Technical Coefficients vs. Actual Data
The empirical robustness of the statistical model for estimating by-products from milled sugarcane is validated by comparing its results with actual data reported by Peruvian sugar mills (Table 13), using the calculation of the Relative Percent Error (RPE).
Table 13.
Actual vs. estimated comparison (Peru 2011–2018).
The RPE for bagasse ranged from (2013) to (2017), with an average of and a standard deviation of 2.10. Years like 2012 and 2014, with RPE < , show very high consistency between the statistical estimate and actual industrial production. The peak observed in 2017 () could be linked to changes in industrial efficiency, bagasse moisture content, or variations in cane harvesting, suggesting that the model could benefit from dynamic adjustments if more variables are available. Technically, an RPE < is considered acceptable in agro-industrial process modeling studies, and in this case, 6 out of the 8 years analyzed meet that condition.
The RPE for molasses is also shown in Table 14. It ranged from (2018) to (2017), with an average of and a standard deviation of 2.51. The estimate was nearly perfect in 2018, demonstrating the high accuracy of the molasses coefficient () in the proposed technical model. The values above in 2014 and 2017 suggest potential variability in residual sucrose content, milling type, or juice destination in those harvests, which could be explained with complementary information on technological processes or climatic conditions. Nevertheless, the errors remained within the standard acceptable range for technical studies in energy planning.
Table 14.
Statistical analysis of error.
This statistical performance shown in Table 14 reflects a very high consistency of the model, supporting the use of fixed coefficients as a robust first approximation for bioenergy estimates in the sugar industry. The validity of the estimation model using average technical coefficients is confirmed by its ability to predict the actual production of bagasse and molasses with an accuracy greater than in most years. This consistency is critical for modeling biogas production, as the estimation of the substrate base volume determines the rest of the energy analysis. In practice, this type of error () does not significantly affect the planning of anaerobic digesters or the sizing of energy systems.
3.4. Future Projection of By-Product and Biogas Production Potential (2024–2030)
In order to assess the potential energy impact of the sugarcane agroindustry in Latin America, a prospective simulation was conducted to estimate the volume of biogas that could be generated by Peru and Cuba during the 2024–2030 period. The estimation was performed under three growth scenarios based on historical averages and assumptions regarding agricultural and industrial development: (i) a conservative scenario (E1), assuming no change in sugarcane production; (ii) a moderate scenario (E2), with linear growth of per year; and (iii) an optimistic scenario (E3), which considers technological modernization and productive expansion at a annual rate.
3.4.1. Cumulative Projection of By-Products in Countries Like Peru and Cuba (2024–2030)
The analysis starts from the historical average of milled sugarcane for Peru (10,256,777 t/year) and applies previously validated technical coefficients to estimate the corresponding mass of each by-product: bagasse , filter cake , molasses , and vinasse . This visualization allows for the identification of the relative and absolute behavior of key industrial residues, which is essential for the planning of energy and environmental valorization systems.
Figure 7 clearly illustrates how agro-industrial growth in Peru not only increases sugarcane availability, but also the critical mass of valorized by-products. Bagasse is the dominant component, accounting for between and of the total by-products generated, confirming its role as the main lignocellulosic residue of the process. Its cumulative volume rises from 21 million tons in E1 to nearly 30 million in E3, representing a increase. This behavior has direct implications for the design of combustion systems, anaerobic digestion, and pelletization for bioenergy.
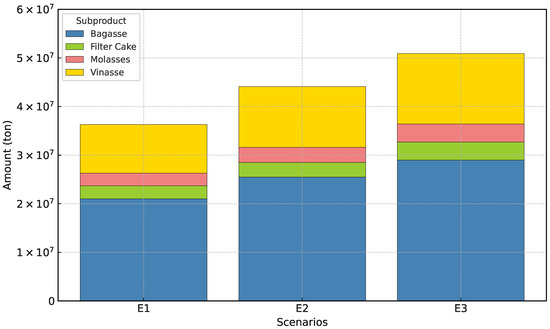
Figure 7.
Cumulative projection of by-products for Peru (2024–2030).
Vinasse, for its part, is the largest liquid residue by mass in all scenarios and ranks as the second most abundant by-product, with a relative share of approximately 28–30%. Its cumulative volume increases from 10.1 Mt (E1) to 14.6 Mt (E3). This increase highlights the need to design treatment and reuse policies (e.g., fertigation, biofertilizers) in response to the risk of high organic load in soils or water bodies.
Another by-product of the sugar industry with significant energy value is filter cake, which has potential for organic fertilization. Although it represents a small share ( of milled cane), its volume reaches 3.7 million tons in E3. This phosphorus- and organic matter-rich solid fraction represents a key opportunity to close the agroecological cycle through composting or co-digestion.
In another context, molasses is a sugary residue with high energy value, with cumulative growth ranging from 2.7 to 3.8 million tons. Due to its high content of fermentable carbohydrates, it has enormous potential for bioethanol or biogas production in specialized digesters. Its contribution is critical to improving the overall energy efficiency of the system.
This analysis reinforces the need to integrate a comprehensive waste utilization approach into the country’s bioeconomy, renewable energy, and agro-industrial sustainability policies.
For the Cuban case seen in Figure 8, the model is based on a historical average of sugarcane production of 15,400,000 t/year (2011–2018 average) and applies validated technical coefficients from this study to estimate the mass of each generated by-product: bagasse , filter cake , molasses , and vinasse . The graph allows for a comparison of the expected behavior of residues by scenario, providing fundamental inputs for the sizing of treatment, valorization, and bioenergy plants.
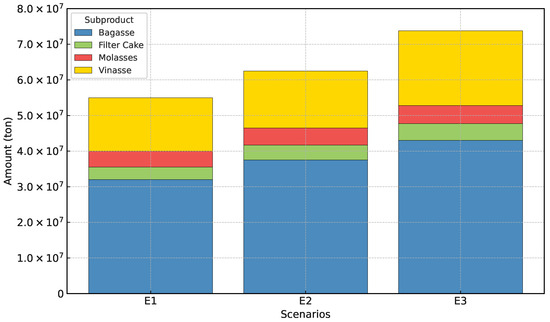
Figure 8.
Expected cumulative output of sugar industry by-products in Cuba (2024–2030).
The analysis confirms that, as in the Peruvian case, the growth in sugarcane milling directly impacts the critical mass of valorized residues, with significant differences in absolute volumes due to the country’s higher milling capacity.
Bagasse is consolidated as the dominant by-product, representing between and of the total residues generated. Its cumulative volume increases from approximately 31.7 million tons in the conservative scenario (E1) to more than 44.4 million tons in the optimistic scenario (E3), representing a increase. This lignocellulosic fraction forms the potential base for cogeneration systems, briquette production, anaerobic digestion, or thermochemical conversion, reinforcing its strategic role in the country’s energy transition.
Vinasse, the main liquid residue, remains the second most abundant by-product, with a relative share close to 27–28% of the total by-products. Its projected volume increases from 15 million tons in E1 to more than 21 million in E3, reflecting growth proportional to the increase in milling. Its high organic load requires integrated environmental management strategies, such as anaerobic treatment systems, use in fertigation, or soil application with impact control.
Filter cake, although smaller in proportion (around of the milled cane), reaches significant mass values, with projections of 3.99 million tons in E1 and up to 5.59 million in E3. Its high nutrient content makes it an excellent input for the production of compost, biofertilizers, or co-digestion with vinasse, allowing nutrient cycles to be closed and contributing to the restoration of agricultural soils.
Molasses, a sugary residue with high energy concentration, shows a cumulative projection between 4.1 million tons (E1) and 5.76 million tons (E3). Its potential for the production of bioethanol, biogas, or value-added metabolites positions it as an essential vector in energy valorization strategies and residue industrialization.
Altogether, this projection for Cuba highlights the urgency of implementing an integrated utilization model for agro-industrial residues, with a focus on sustainability, energy efficiency, and circular bioeconomy. The strategic transformation of these by-products could not only reduce the environmental burden but also position the sugar sector as a key generator of renewable energy and added value in the Latin American context.
3.4.2. Projected Potential of By-Products in the Total Biogas Production for Cuba and Peru (2024–2030)
For the estimation of bioenergy potential, specific technical coefficients were applied for each by-product, derived from a rigorous statistical review of scientific studies and validated real-world data. In the case of bagasse, an average yield of 180 Nm3 of biogas per ton of fresh residue was considered, consistent with studies conducted in Brazil, Cuba, and Thailand. For vinasse, a liquid by-product with a high organic load, an average coefficient of 12.6 Nm3/t was assumed, based on experimental data from anaerobic digestion plants and systematic reviews. As for molasses, its high concentration of fermentable sugars allows it to reach an estimated potential of 344.4 Nm3/t, making it one of the by-products with the highest energy capacity per unit of mass. Finally, for filter cake, an average yield of 63.25 Nm3/t was applied, a value derived from studies conducted at sugar mills in Cuba and Brazil. These coefficients were used uniformly for both countries throughout the projected period (2024–2030), ensuring the comparability and consistency of the results obtained across the different scenarios.
Figure 9 represents the estimated distribution of the cumulative volume of biogas (Nm3) generated by the main by-products of the sugar agro-industry in Peru, projected under three growth scenarios for the period 2024–2030. In scenario (E1), the biogas volume remains around 7 billion Nm3, with a dominant contribution from bagasse, which accounts for more than of the total generated. Molasses ranks as the second-largest contributor , while filter cake and vinasse show smaller but still significant shares. In scenario (E2), a sustained linear growth in processed cane is incorporated, reflecting an increase in biogas volume to approximately 8.6 billion Nm3—representing a rise compared to scenario E1. Scenario (E3) is the most ambitious, considering technological improvements and agricultural expansion. It projects a production exceeding 9.9 billion Nm3 of biogas. Bagasse alone could generate over 7.5 billion Nm3, reinforcing its role as the energy backbone of the system. Molasses continues increasing its contribution, surpassing 1.7 billion Nm3, due to its high energy density (high fermentable sugar content).

Figure 9.
Biogas production projection scenario for Peru (2024–2030).
Figure 10 shows the projection of the cumulative biogas volume for Cuba during the period 2024–2030, under three agro-industrial growth scenarios. In the baseline scenario (E1), production remains stable at around 10.8 billion Nm3, reflecting current conditions of the production system. In the moderate scenario (E2), which considers a annual linear growth, the volume rises to approximately 12.9 billion Nm3, implying a increase compared to E1. Finally, the optimistic scenario (E3), which includes technological advances and agricultural expansion, projects a production close to 15.5 billion Nm3, representing a cumulative growth of over . These results highlight the energy potential of the Cuban sugar agroindustry and its capacity to significantly contribute to the transition toward a cleaner and more sustainable energy matrix.
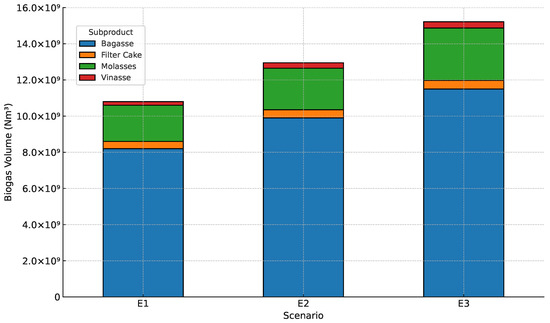
Figure 10.
Biogas production projection scenario for Cuba (2024–2030).
Figure 11 provides a comparative view of the cumulative biogas production projection (expressed in Nm3) for both countries, by scenario. This analysis is key to identifying the available bioenergy expansion margin if technology-oriented policies are implemented and to evaluating the energy resilience of the agro-industrial sector.
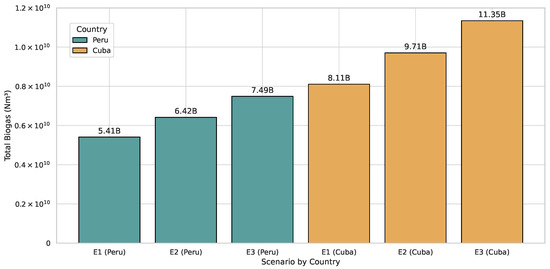
Figure 11.
Biogas production projection scenario for Cuba and Peru (2024–2030).
In the baseline scenario (E1), Peru would reach a total volume of 5.41 × 10⁹ Nm3 between 2024 and 2030, with an annual average of 772 million Nm3/year, corresponding to an agroindustry stagnated at current production levels. Under scenario E2 annually), cumulative biogas production would increase to 6.43 × 10⁹ Nm3, representing an improvement over the conservative case. The optimistic scenario (E3) reaches 7.498 × 10⁹ Nm3, reflecting cumulative growth of over compared to E1, demonstrating the multiplier effect of technological innovation in waste valorization.
In the same period, Cuba shows higher absolute values, with 8.11 × 10⁹ Nm3 in scenario E1, corresponding to an average of 1.16 billion Nm3/year. With linear growth (E2), a total of 9.718 × 10⁹ Nm3 is projected, exceeding the baseline scenario by . Finally, in scenario E3, Cuba could reach 11.358 × 10⁹ Nm3, consolidating an increase of , reaffirming the enormous biogas potential still untapped in sugarcane residues if advanced industrial strategies were adopted.
3.4.3. Projection of Electricity Generation Potential for Cuba and Peru (2024–2030)
The estimation of electricity generation potential from biogas in agro-industrial contexts requires the integration of technically validated parameters, both in terms of biogas production and energy conversion. This section presents a detailed projection of the volume of electricity that could be generated in Cuba and Peru between 2024 and 2030, based on previously calculated biogas projections by agro-industrial by-product (bagasse, filter cake, molasses, and vinasse) and using conversion factors obtained through statistical analysis. The results are shown in Table 15.
Table 15.
Recommendation for predictive models.
To convert the volume of biogas (Nm3) to electricity (kWh), three energy efficiency scenarios were applied: conservative (1.85 kWh/Nm3), baseline (2.28 kWh/Nm3), and optimistic (3.1–3.2 kWh/Nm3). These values represent technological conditions ranging from low-efficiency rural engines to advanced cogeneration systems such as CHP and SOFC. The methodology ensures a robust assessment of the potential energy generation range, thus providing a solid tool for energy planning, public policy formulation, and identifying sustainable investment opportunities in the bioenergy sector of both countries.
Figure 12 illustrates the estimated cumulative electricity generation potential by sugarcane agro-industrial by-product in Peru over the 2024–2030 period, considering three prospective scenarios: conservative, baseline, and optimistic. The projection is disaggregated by residue type—bagasse, filter cake, molasses, and vinasse—allowing for the identification of the relative contributions of each fraction to the projected energy matrix.
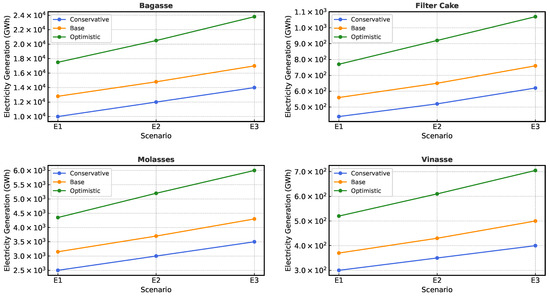
Figure 12.
Electricity generation projection scenario for Peru (2024–2030).
The analysis reveals a continuous growth pattern in electricity generation by each by-product. Bagasse emerges as the most relevant energy by-product, with a projected range from 10,000 GWh in E1 to over 23,500 GWh in E3, highlighting its role as the backbone of the national bioenergy system.
On the other hand, although filter cake shows a more modest contribution in absolute terms, its electricity generation increases progressively from 450 GWh to over 1000 GWh in the most ambitious scenario, reinforcing its potential valorization in rural cogeneration systems.
Molasses, due to its high energy density, shows steady growth from 3100 GWh to 6000 GWh, reflecting its viability as a priority substrate for biomethanization with energy purposes. Finally, vinasse, despite its organic dilution, exceeds 700 GWh in the optimistic scenario, underlining its complementary role in an integrated waste utilization approach (Figure 13).
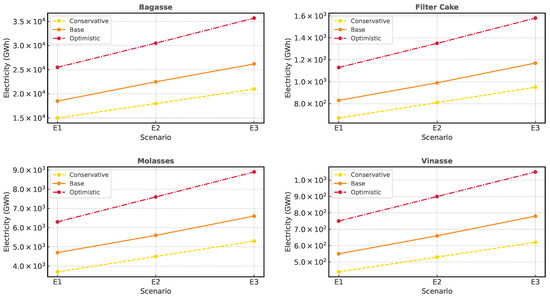
Figure 13.
Electricity generation projection scenario for Cuba (2024–2030).
The projections for Cuba show an absolute dominance of bagasse as the main renewable energy source, as in the case of Peru, with projections ranging from 15,000 GWh in E1 to over 35,000 GWh in E3 (optimistic scenario). This trend highlights its structural role in the national bioenergy matrix. Molasses also stands out as a relevant source, with steady growth from 6300 GWh to nearly 9000 GWh, due to its high energy density per unit mass. Filter cake and vinasse, although contributing smaller volumes, show significant proportional increases, jointly reaching over 2600 GWh in scenario E3.
Figure 14 illustrates the cumulative electricity generation projection (in GWh) from biogas derived from agro-industrial by-products for Peru and Cuba in the 2024–2030 period.
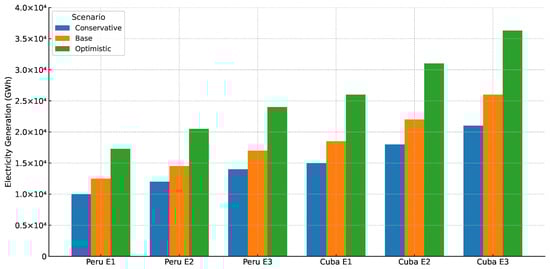
Figure 14.
Electricity generation projection scenario for Cuba and Peru (2024–2030).
Cuba presents a significant comparative advantage over Peru in all scenarios, attributable to the larger projected biogas volume and broader biomass availability. In both countries, an upward linear progression is observed from scenario E1 to E3, reflecting the combined effect of increased processed by-product volumes and the incorporation of more efficient technologies. In the conservative scenario, based on minimum yields from rural or hybrid engines (1.85 kWh/Nm3), Peru projects electricity generation between 10,000 and 14,000 GWh, while Cuba reaches between 15,000 and 21,000 GWh. In the baseline scenario, representing the statistical average from the scientific literature (2.28 kWh/Nm3), Peru reaches between 12,500 and 17,000 GWh and Cuba between 18,500 and 26,000 GWh. Finally, in the optimistic scenario, with advanced technologies such as SOFC or high-efficiency cogeneration systems, the projected generation exceeds 20,000 GWh in Peru and reaches up to 36,000 GWh in Cuba, demonstrating the transformative impact of technological innovation in the energy recovery from biogas.
This type of analysis highlights the strategic potential of Cuba and Peru to integrate biogas as a complementary source in their energy matrix, reduce fossil fuel dependence, and move toward a more self-sufficient and sustainable rural model.
The transition towards a circular bioeconomy requires reliable prediction tools that allow for the estimation of potential biogas production and its energy conversion at industrial and territorial scales (Table 16). In this context, the modeling proposed by this research stands out as, to the best of our knowledge, the only predictive multi-residue model that integrates the main sugarcane by-products (bagasse, vinasse, molasses, and filter cake) under a statistically validated mathematical structure and projected at both national and international levels.
Table 16.
Comparative analysis of studies on sugarcane by-products and bioenergy models.
Table 16 critically synthesizes the evolution of the literature on bioenergy modeling of sugarcane by-products, identifying both individual contributions and structural limitations compared to the multi-residue predictive model developed by the authors of this research. While many studies focus on specific by-products—especially vinasse and bagasse—most approaches are partial, experimental, or have low scalability. Only a few studies explore energy projections beyond the lab, but do so without statistical validation, multi-residue integration, or territorial application.
The values applied in our model −199.8 Nm3 /t for bagasse, 344.4 Nm3 /t for molasses, 63.25 Nm3 /t for cachaza, and 12.6 Nm3 /t for vinasse-are within the range reported by recent experimental studies such as [11,12], as well as [9,56]. These studies highlight improvements in methane production by physical and chemical pre-treatments, reinforcing the validity of our performances. The energy conversion coefficient adopted (2.28 kWh/Nm3 ) was supported by a meta-analysis of the specialized literature, coinciding with results from [53], who report efficiencies between 2.1 and 2.4 kWh/Nm3 in cogeneration systems adapted to the use of biogas.
With a multiresidue approach and empirical validation, while much of the previous literature focuses on the valorization of a single by-product—predominantly bagasse or vinasse—our model simultaneously incorporates the four main residues of the sugarcane agroindustry, aligning with recent recommendations by [34], who advocate multiresidue frameworks for a more complete valorization. Furthermore, we validate our coefficients with historical official data from Peru (2011–2018) and industrial records from Cuba, which reinforces their practical applicability in real contexts. In contrast to laboratory kinetic models or simulations without validation, our proposal presents a deterministic structure, based on official data and empirical validation. This allows its implementation without complex experimental requirements, facilitating its adoption in national bioenergy plans. The methodological robustness based on a model integrates multivariate statistical analysis (PCA), empirical validation through average relative errors <5%, and energy projections to 2030 in different scenarios (stagnation, technical growth, and expansion), placing our proposal as one of the most complete in the field.
The structural validation by comparison in Table 16 of the manuscript quantitatively reinforces this discussion, comparing our proposal with previous studies in key dimensions such as the type of waste assessed, the methodological approach (experimental, kinetic, projective), the inclusion of validation with real data, and the generation of energy scenarios. It is evident that, although multiple studies document individual biogas yields [7,24,35,76], few integrate multiple by-products [21,46] with empirical validation and an energy projection structure. Our proposal overcomes these limitations, standing out as a replicable and scalable tool, aligned with circular bioeconomy principles.
The analysis reveals a consistent gap: no previous model simultaneously combines multi-residue integration, multi-year projection, validation with historical data, and direct electricity estimation. This lack of methodological comprehensiveness limits the practical utility of existing models for bioenergy policymaking or for designing real-world energy valorization systems.
In contrast, the proposed predictive model emerges as a frontier contribution in the sugarcane bioenergy field, integrating bagasse, molasses, filter cake, and vinasse within a predictive mathematical framework, empirically validated and capable of estimating both biogas volumes and electricity generation in contexts such as Cuba and Peru. This systematic comparison supports not only the novelty of the proposed model, but also its high potential for scalability, replicability, and strategic use in the energy transition of agro-industrial regions.
Finally, the proposed model goes beyond its mathematical value to serve as a strategic tool for public policy. Its structural simplicity and low variable requirements make it scalable to other sugar-producing countries and even adaptable to other agricultural systems. Furthermore, its ability to integrate residues with diverse physicochemical properties and convert them into usable energy aligns with the principles of sustainability, decarbonization, and circular economy. Its effective implementation could transform the paradigm of agro-industrial waste from polluting liabilities into regenerative energy assets.
4. Conclusions
Technical coefficients validated with real production data and through the review of scientific literature were used, obtaining for bagasse , filter cake , molasses , and vinasse with respect to milled cane, confirming their representativeness through real historical data from sugar mills (2011–2018). Regarding specific biogas yields, 180 Nm3/t for bagasse, 63.25 Nm3/t for filter cake, 344.4 Nm3/t for molasses, and 12.6 Nm3/t for vinasse were used.
During the historical period 2000–2018, the predictive model demonstrated high accuracy, with a relative error of less than with respect to actual milling and by-product generation values. In terms of energy, Cuba reached its highest electricity generation from biogas in 2016, with more than 13,000 GWh, largely attributable to bagasse utilization. Peru, in contrast, showed a more stable production, ranging between 6500 and 7500 GWh annually between 2010 and 2018, with less volatility associated with more homogeneous policies and technologies.
The 2024–2030 projections, under three technological conversion scenarios (baseline, annual increase and optimal scenario), the model estimates that Cuba could reach between 10.8 and 15.5 billion Nm3 of biogas, which is equivalent to an electricity production of between 15,000 and more than 35,000 GWh. For Peru, the estimated volume varies between 7.0 and 9.9 billion Nm3, generating from 10,000 to more than 23,500 GWh in the same period. In all scenarios, bagasse represents more than of total energy, confirming its role as the main bioenergy vector, while molasses and cachaça increase their relative participation in the more technified scenarios, contributing up to 9000 additional GWh in the Cuban case.
The simplicity of this modeling with robust statistical validation makes it a high-value tool for strategic decision making, facilitating decentralized energy planning, preliminary biorefinery design, and prioritization of bioenergy investments from sugarcane by-products. Its application in contexts of low access to advanced technology or technical data makes this approach a viable and scalable solution for Latin America and other sugarcane producing regions.
Author Contributions
Conceptualization, Y.C.A., R.J.B., and C.D.P.V.; methodology, Y.C.A.; software, Y.C.A., R.J.B., B.R.P., C.D.P.V., L.A.I.C., G.A.-F., and J.R.-R.; validation, Y.C.A., R.J.B., L.A.I.C., J.R.-R., and G.A.-F.; formal analysis, Y.C.A. and R.J.B.; investigation, Y.C.A. and R.J.B.; resources, Y.C.A., B.R.P., L.A.I.C., G.A.-F., and J.R.-R.; data curation, Y.C.A., R.J.B., B.R.P., and J.R.-R.; writing—original draft preparation, Y.C.A., R.J.B., J.R.-R., and B.R.P. All authors have read and agreed to the published version of the manuscript.
Funding
This research received no external funding.
Institutional Review Board Statement
Not applicable.
Informed Consent Statement
Not applicable.
Data Availability Statement
The original contributions presented in this study are included in the article. Further inquiries can be directed to the corresponding authors.
Conflicts of Interest
The authors declare no conflicts of interest.
References
- Hernández-Beltrán, J.U.; Lira, I.O.H.D.; Cruz-Santos, M.M.; Saucedo-Luevanos, A.; Hernández-Terán, F.; Balagurusamy, N. Insight into Pretreatment Methods of Lignocellulosic Biomass to Increase Biogas Yield: Current State, Challenges, and Opportunities. Appl. Sci. 2019, 9, 3721. [Google Scholar] [CrossRef]
- Sarangi, P.K.; Subudhi, S.; Bhatia, L.; Saha, K.; Mudgil, D.; Shadangi, K.P.; Srivastava, R.K.; Pattnaik, B.; Arya, R.K. Utilization of agricultural waste biomass and recycling toward circular bioeconomy. Environ. Sci. Pollut. Res. 2023, 30, 8526–8539. [Google Scholar] [CrossRef] [PubMed]
- Leal, M.R.L.V.; Walter, A.S.; Seabra, J.E.A. Sugarcane as an energy source. Biomass Convers. Biorefin. 2013, 3, 17–26. [Google Scholar] [CrossRef]
- Balakrishnan, D. Exploring the potential of sugarcane vinasse for biogas and biofertilizer production: A catalyst for advancing the bioeconomy. Sustain. Energy Technol. Assess. 2024, 61, 103474. [Google Scholar] [CrossRef]
- Nwokolo, N.; Mukumba, P.; Obileke, K.; Enebe, M. Waste to Energy: A Focus on the Impact of Substrate Type in Biogas Production. Processes 2020, 8, 1224. [Google Scholar] [CrossRef]
- Mishra, A.; Kumar, M.; Bolan, N.S.; Kapley, A.; Kumar, R.; Singh, L. Multidimensional approaches of biogas production and up-gradation: Opportunities and challenges. Bioresour. Technol. 2021, 338, 125514. [Google Scholar] [CrossRef]
- Janke, L.; Leite, A.; Nikolausz, M.; Schmidt, T.; Liebetrau, J.; Nelles, M.; Stinner, W. Biogas production from sugarcane waste: Assessment on kinetic challenges for process designing. Int. J. Mol. Sci. 2015, 16, 20685–20703. [Google Scholar] [CrossRef]
- Lorenzo-Acosta, Y.; Doménech-López, F.; Eng-Sánchez, F.; Almazán-del Olmo, O.; Chanfón-Curbelo, J.M. Tratamiento industrial de vinazas de destilerías en reactores UASB. Tecnol. Quím. 2015, 35, 108–123. [Google Scholar]
- Bezerra, T.L.; Ragauskas, A.J. A review of sugarcane bagasse for second-generation bioethanol and biopower production. Biofuels, Bioprod. Biorefining 2016, 10, 634–647. [Google Scholar] [CrossRef]
- Castillo Álvarez, Y.; Monteagudo Yanes, J.P.; Jiménez Borges, R.; Patiño Vidal, C.D. Propuesta de diseño de un biodigestor industrial de cachaza para la generación de energía eléctrica. Rev. Univ. Y Soc. 2021, 13, 74–80. [Google Scholar]
- Mustafa, A.M.; Li, H.; Radwan, A.A.; Sheng, K.; Chen, X. Effect of hydrothermal and Ca(OH)2 pretreatments on anaerobic digestion of sugarcane bagasse for biogas production. Bioresour. Technol. 2018, 259, 54–60. [Google Scholar] [CrossRef] [PubMed]
- Janke, L.; Weinrich, S.; Leite, A.F.; Sträuber, H.; Nikolausz, M.; Nelles, M.; Stinner, W. Pre-treatment of filter cake for anaerobic digestion in sugarcane biorefineries: Assessment of batch versus semi-continuous experiments. Renew. Energy 2019, 143, 1416–1426. [Google Scholar] [CrossRef]
- Paulsen, S.; Hoffstadt, K.; Krafft, S.; Leite, A.; Zang, J.; Fonseca-Zang, W.; Kuperjans, I. Continuous biogas production from sugarcane as sole substrate. Energy Rep. 2020, 6, 153–158. [Google Scholar] [CrossRef]
- Barbosa-Nuñez, J.; Palacios, O.; Mondragón-Cortez, P.; Alvarez, H.O. Chemical and Physical Affinity of Microalga–Azospirillum Consortium Co-cultured in Suspension During CO2 Fixation from Biogas. BioEnergy Res. 2023, 16, 579–592. [Google Scholar] [CrossRef]
- Alfonso-Cardero, A.; Pagés-Díaz, J.; Contino, F.; Lorenzo-Llanes, J. Process simulation and techno-economic assessment of vinasse-to-biogas in Cuba. Chem. Eng. Res. Des. 2021, 169, 33–45. [Google Scholar] [CrossRef]
- Parsaee, M.; Kiani Deh Kiani, M.; Karimi, K. A review of biogas production from sugarcane vinasse. Biomass Bioenergy 2019, 122, 117–125. [Google Scholar] [CrossRef]
- Wongarmat, W.; Sittijunda, S.; Mamimin, C.; Reungsang, A. Acidogenic phase anaerobic digestion of pretreated sugarcane filter cake for co-digestion with biogas effluent to enhance the methane production. Fuel 2022, 310, 122466. [Google Scholar] [CrossRef]
- Pajampa, K.; Laloon, K.; Suksri, A.; Phadungton, S.; Ratpukdi, T.; Posom, J.; Wongwuttanasatian, T. A way towards zero-waste campaign and sustainability in sugar industries; filter cake valorisation as energy pellets. Ain Shams Eng. J. 2024, 15, 102459. [Google Scholar] [CrossRef]
- Widyastuti, N.; Hidayat, M.; Purnomo, C.W. Enhanced Biogas Production from Sugarcane Vinasse Using Electro-Fenton as Pre-Treatment Method. Proc. Iop Conf. Ser. Earth Environ. Sci. 2021, 830, 012079. [Google Scholar] [CrossRef]
- Ma, H.; Chen, L.; Guo, W.; Wang, L.; Zhang, J.; Zhang, D. Synergistic Promotion of Direct Interspecies Electron Transfer by Biochar and Fe3O4 Nanoparticles Enhance Methanogenesis in Anaerobic Digestion of Vegetable Waste. Fermentation 2024, 10, 656. [Google Scholar] [CrossRef]
- Masala, F.; Groppi, D.; Nastasi, B.; Piras, G.; Astiaso Garcia, D. Techno-economic analysis of biogas production and use scenarios in a small island energy system. Energy 2022, 258, 124831. [Google Scholar] [CrossRef]
- Srinivas, G.; Ramesh, P.; Radhika, G.; Srinivas, T. Chapter 28—Modeling and technoeconomic analysis of biogas production from waste food. In Biofuels and Bioenergy; Gurunathan, B., Sahadevan, R., Eds.; Elsevier: Amsterdam, The Netherlands, 2022; pp. 673–685. [Google Scholar] [CrossRef]
- Tian, H.; Wang, X.; Lim, E.Y.; Lee, J.T.; Ee, A.W.; Zhang, J.; Tong, Y.W. Life cycle assessment of food waste to energy and resources: Centralized and decentralized anaerobic digestion with different downstream biogas utilization. Renew. Sustain. Energy Rev. 2021, 150, 111489. [Google Scholar] [CrossRef]
- Arelli, V.; Mamindlapelli, N.K.; Juntupally, S.; Begum, S.; Anupoju, G.R. Solid-state anaerobic digestion of sugarcane bagasse at different solid concentrations: Impact of bio augmented cellulolytic bacteria on methane yield and insights on microbial diversity. Bioresour. Technol. 2021, 340, 125675. [Google Scholar] [CrossRef] [PubMed]
- Agarwal, N.K.; Kumar, M.; Ghosh, P.; Kumar, S.S.; Singh, L.; Vijay, V.K.; Kumar, V. Anaerobic digestion of sugarcane bagasse for biogas production and digestate valorization. Chemosphere 2022, 295, 133893. [Google Scholar] [CrossRef]
- Volpi, M.P.C.; Fuess, L.T.; Moraes, B.S. Anaerobic co-digestion of residues in 1G2G sugarcane biorefineries for enhanced electricity and biomethane production. Bioresour. Technol. 2021, 330, 124999. [Google Scholar] [CrossRef]
- Romaniuk, W.; Rogovskii, I.; Polishchuk, V.; Titova, L.; Borek, K.; Shvorov, S.; Roman, K.; Solomka, O.; Tarasenko, S.; Didur, V.; et al. Study of Technological Process of Fermentation of Molasses Vinasse in Biogas Plants. Processes 2022, 10, 2011. [Google Scholar] [CrossRef]
- Cheong, W.L.; Chan, Y.J.; Tiong, T.J.; Chong, W.C.; Kiatkittipong, W.; Kiatkittipong, K.; Mohamad, M.; Daud, H.; Suryawan, I.W.K.; Sari, M.M.; et al. Anaerobic Co-Digestion of Food Waste with Sewage Sludge: Simulation and Optimization for Maximum Biogas Production. Water 2022, 14, 1075. [Google Scholar] [CrossRef]
- Wongarmat, W.; Sittijunda, S.; Imai, T.; Reungsang, A. Co-digestion of filter cake, biogas effluent, and anaerobic sludge for hydrogen and methane production: Optimizing energy recovery through two-stage anaerobic digestion. Carbon Resour. Convers. 2025, 8, 100248. [Google Scholar] [CrossRef]
- Aili Hamzah, A.; Hamzah, M.; Mazlan, N.; Che Man, H.; Jamali, N.; Siajam, S.; Show, P. Optimization of subcritical water pre-treatment for biogas enhancement on co-digestion of pineapple waste and cow dung using the response surface methodology. Waste Manag. 2022, 150, 98–109. [Google Scholar] [CrossRef] [PubMed]
- Tiong, J.S.M.; Chan, Y.J.; Lim, J.W.; Mohamad, M.; Ho, C.D.; Rahmah, A.U.; Kiatkittipong, W.; Sriseubsai, W.; Kumakiri, I. Simulation and Optimization of Anaerobic Co-Digestion of Food Waste with Palm Oil Mill Effluent for Biogas Production. Sustainability 2021, 13, 13665. [Google Scholar] [CrossRef]
- Mazuchi, M. Chapter 11—Life Cycle Assessment of Sugarcane Biorefinery: Energy Use, Environmental Assessment, and Other Sustainability Indicators. In Advances in Sugarcane Biorefinery; Chandel, A.K., Luciano Silveira, M.H., Eds.; Elsevier: Amsterdam, The Netherlands, 2018; pp. 213–239. [Google Scholar] [CrossRef]
- Kapanji, K.K.; Farzad, S.; Görgens, J.F. Life cycle and sustainability assessments of biorefineries producing glucaric acid, sorbitol or levulinic acid annexed to a sugar mill. J. Clean. Prod. 2021, 295, 126339. [Google Scholar] [CrossRef]
- Karp, S.G.; Burgos, W.J.; Vandenberghe, L.P.; Diestra, K.V.; Torres, L.A.; Woiciechowski, A.L.; Letti, L.A.; Pereira, G.V.; Thomaz-Soccol, V.; Rodrigues, C.; et al. Sugarcane: A promising source of green carbon in the circular bioeconomy. Sugar Tech 2022, 24, 1230–1245. [Google Scholar] [CrossRef]
- Kim, D.; Kim, J. Predicting biogas production from organic waste through anaerobic co-digestion. J. Clean. Prod. 2025, 496, 145122. [Google Scholar] [CrossRef]
- Mihi, M.; Ouhammou, B.; Aggour, M.; Daouchi, B.; Naaim, S.; Mers, E.M.E.; Kousksou, T. Modeling and forecasting biogas production from anaerobic digestion process for sustainable resource energy recovery. Heliyon 2024, 10, e38472. [Google Scholar] [CrossRef]
- Alvarez, Y.C.; Borges, R.J.; Vidal, C.D.P.; Leon, F.M.C.; Buendia, J.S.P.; Nolasco, J.A.S. Design Improvements and Best Practices in Small-Scale Biodigesters for Sustainable Biogas Production: A Case Study in the Chillon Valley, Perú. Energies 2025, 18, 338. [Google Scholar] [CrossRef]
- Singh, S.; Hariteja, N.; Sharma, S.; Raju, N.J.; Prasad, T.R. Production of biogas from human faeces mixed with the co-substrate poultry litter & cow dung. Environ. Technol. Innov. 2021, 23, 101551. [Google Scholar] [CrossRef]
- Hernández, D.; Pinilla, F.; Rebolledo-Leiva, R.; Aburto-Hole, J.; Díaz, J.; Quijano, G.; González-García, S.; Tenreiro, C. Anaerobic Co-Digestion of Agro-Industrial Waste Mixtures for Biogas Production: An Energetically Sustainable Solution. Sustainability 2024, 16, 2565. [Google Scholar] [CrossRef]
- Abilmazhinov, Y.; Shakerkhan, K.; Meshechkin, V.; Shayakhmetov, Y.; Nurgaliyev, N.; Suychinov, A. Mathematical Modeling for Evaluating the Sustainability of Biogas Generation through Anaerobic Digestion of Livestock Waste. Sustainability 2023, 15, 5707. [Google Scholar] [CrossRef]
- Gómez Montoya, J.P.; Castillo Alvarez, Y.; Fernandes De Magalhães, R.; Henrique Lermen, F. A thermo-economic analysis of a circular economy model for biomass in South America producing biofertilizers and biogas from municipal solid waste. Renew. Energy 2024, 225, 120254. [Google Scholar] [CrossRef]
- Campello, L.D.; de Oliveira Botan, M.C.C.; Filho, G.L.T.; Barros, R.M.; dos Santos, I.F.S.; Botan, A.C.B. Technical and economic feasibility of hybrid power generation from urban solid waste associated with solar energy, considering the impact of the sale of carbon credits. Renew. Energy 2024, 235, 121388. [Google Scholar] [CrossRef]
- Sanchumpu, P.; Suaili, W.; Nonsawang, S.; Ansuree, P.; Laloon, K. Predictive modelling of HHV and LHV for sugar industry by-products: A study on sugarcane trash leaves, bagasse, and filter cake. Int. J. Sustain. Eng. 2024, 17, 613–631. [Google Scholar] [CrossRef]
- Abdur Rawoof, S.A.; Kumar, P.S.; Vo, D.V.N.; Devaraj, T.; Subramanian, S. Biohythane as a high potential fuel from anaerobic digestion of organic waste: A review. Renew. Sustain. Energy Rev. 2021, 152, 111700. [Google Scholar] [CrossRef]
- Gonzales, S.; Castillo, A.; Solís, J. Optimización de la capacidad de cogeneración mediante la adición de residuos de cosecha al bagazo en industria azucarera típica peruanas. Rev. TECNIA 2019, 28, 1–10. [Google Scholar] [CrossRef]
- Alonso-Estrada, D.; Díaz-de los Ríos, M.; Zhan, D.; Jian, J.; Zhang, Q.; Wang, S. Energetic and Environmental Integration in Factories of Sugar Cane Byproducts. Rev. Cienc. Técnicas Agropecu. 2020, 29, 32–41. [Google Scholar]
- Ajala, E.O.; Ighalo, J.O.; Ajala, M.A.; Adeniyi, A.G.; Ayanshola, A.M. Sugarcane bagasse: A biomass sufficiently applied for improving global energy, environment and economic sustainability. Bioresour. Bioprocess. 2021, 8, 87. [Google Scholar] [CrossRef]
- Janke, L.; Leite, A.; Nikolausz, M.; Schmidt, T.; Liebetrau, J. Biogas Production from Sugarcane Waste: Assessment of Kinetic Parameters for Process Design. Renew. Energy 2015, 83, 247–257. [Google Scholar]
- Hor, S.; Kongkeitkajorn, M.B.; Reungsang, A. Sugarcane bagasse-based ethanol production and utilization of its vinasse for xylitol production as an approach in integrated biorefinery. Fermentation 2022, 8, 340. [Google Scholar] [CrossRef]
- Manickavasagam, M.; Elango, T.; Selvarajan, L.; Elangovan, K. Maximizing sustainable power: Improving bagasse drying efficiency in Indian sugar mills. Biomass Convers. Biorefin. 2024, 14, 21579–21601. [Google Scholar] [CrossRef]
- Negrão, D.R.; Grandis, A.; Buckeridge, M.S.; Rocha, G.J.; Leal, M.R.L.; Driemeier, C. Inorganics in sugarcane bagasse and straw and their impacts for bioenergy and biorefining: A review. Renew. Sustain. Energy Rev. 2021, 148, 111268. [Google Scholar] [CrossRef]
- Pan, S.; Zabed, H.M.; Wei, Y.; Qi, X. Technoeconomic and environmental perspectives of biofuel production from sugarcane bagasse: Current status, challenges and future outlook. Ind. Crop. Prod. 2022, 188, 115684. [Google Scholar] [CrossRef]
- Furtado, L.A.; Ribeiro, S.G.; Pradelle, F.; Parise, J.A.R. Modeling and techno-economic analysis of a hybrid sugarcane plant fed by vinasse biogas and bagasse surplus for electricity generation. J. Clean. Prod. 2023, 413, 137511. [Google Scholar] [CrossRef]
- Santos, P.S.; Zaiat, M.; Oller do Nascimento, C.A.; Fuess, L.T. Does sugarcane vinasse composition variability affect the bioenergy yield in anaerobic systems? A dual kinetic-energetic assessment. J. Clean. Prod. 2019, 240, 118005. [Google Scholar] [CrossRef]
- Latiza, R.J.P.; Rubi, R.V. Circular Economy Integration in 1G+ 2G Sugarcane Bioethanol Production: Application of Carbon Capture, Utilization and Storage, Closed-Loop Systems, and Waste Valorization for Sustainability. Appl. Sci. Eng. Prog. 2025, 18, 7448. [Google Scholar]
- Fuess, L.T.; de Araújo Júnior, M.M.; Garcia, M.L.; Zaiat, M. Designing full-scale biodigestion plants for the treatment of vinasse in sugarcane biorefineries: How phase separation and alkalinization impact biogas and electricity production costs? Chem. Eng. Res. Des. 2017, 119, 209–220. [Google Scholar] [CrossRef]
- López, M.V.; Villarrubia, J. Producción de biogás en vertederos de Residuos Sólidos Urbanos (RSU). Montajes Instal. Rev. Técnica Sobre Construcción Ing. Instal. 2001, 31, 95–104. [Google Scholar]
- Sarker, T.C.; Azam, S.M.G.G.; Bonanomi, G. Recent Advances in Sugarcane Industry Solid By-Products Valorization. Waste Biomass Valorization 2017, 8, 241–266. [Google Scholar] [CrossRef]
- Sanchumpu, P.; Suaili, W.; Nonsawang, S.; Junsiri, C.; Ansuree, P.; Laloon, K. Biomass pellet processing from sugar industry byproducts: A study on pelletizing behavior and energy usage. Sustainability 2024, 16, 6035. [Google Scholar] [CrossRef]
- Lima, I.M.; Beacorn, J.A. Targeting a Sustainable Sugar Crops Processing Industry: A Review (Part I)—By-Product Applications. Sugar Tech 2022, 24, 970–991. [Google Scholar] [CrossRef]
- Cisneros de la Cueva, S.; Álvarez Guzman, C.L.; Salmerón, I.; Pérez Vega, S.B.; Santiago Adame, R. Producción de biocombustibles a partir de melaza de caña de azúcar usando Serratia marcescens. Rev. Int. Contam. Ambient. 2024. [Google Scholar] [CrossRef]
- Lagos-Burbano, E.; Castro-Rincón, E. Sugar cane and by-products of the sugar agro-industry in ruminant feeding: A review. Agron. Mesoam. 2019, 30, 917–934. [Google Scholar] [CrossRef]
- Formann, S.; Hahn, A.; Janke, L.; Stinner, W.; Sträuber, H.; Logroño, W.; Nikolausz, M. Beyond Sugar and Ethanol Production: Value Generation Opportunities Through Sugarcane Residues. Front. Energy Res. 2020, 8, 579577. [Google Scholar] [CrossRef]
- Barrera Cardoso, E.L.; Spanjers, H.; Dewulf, J.; Romero, O.; Rosa, E. The sulfur chain in biogas production from sulfate-rich liquid substrates: A review on dynamic modeling with vinasse as model substrate. J. Chem. Technol. Biotechnol. 2013, 88, 1405–1420. [Google Scholar] [CrossRef]
- Budiyono, I.S.; Sumardiono, S. Biogas production from vinasse waste: Kinetic models using modified Gompertz equation and first-order. Bioresour. Technol. 2013, 149, 276–283. [Google Scholar] [CrossRef]
- Budiyono, I.S.; Sumardiono, S. Kinetic model of biogas yield production from vinasse at various initial pH: Comparison between modified Gompertz model and first order kinetic model. Res. J. Appl. Sci. Eng. Technol. 2014, 7, 2798–2805. [Google Scholar] [CrossRef]
- Ariza Calvo, D.; Rincón Ravelo, M.; Paz Cadavid, C.A.; Gutiérrez-Montero, D.J. Evaluación de producción de biogás y reducción de carga orgánica de vinazas mediante digestión anaerobia. Rev. Colomb. Biotecnol. 2019, 21, 118–130. [Google Scholar] [CrossRef]
- Lesme Jaén, R.; Peña Pupo, L.; Silva Lora, E.E.; Cabello Eras, J.J.; Sagastume Gutiérrez, A. Assessing biomass production and electricity generation potential in current and future decarbonization scenarios in Cuba until 2050. Energy Convers. Manag. 2025, 332, 119698. [Google Scholar] [CrossRef]
- Fuess, L.T.; Zaiat, M.; do Nascimento, C.A.O. Novel insights on the versatility of biohydrogen production from sugarcane vinasse via thermophilic dark fermentation: Impacts of pH-driven operating strategies on acidogenesis metabolite profiles. Bioresour. Technol. 2019, 286, 121379. [Google Scholar] [CrossRef]
- Barbosa, M.Y.U.; Damianovic, M.H.R.Z.; Pires, E.C. Thermophilic two-phase anaerobic digestion using an innovative fixed-structured bed reactor treating sugarcane vinasse. J. Water Process Eng. 2022, 49, 103306. [Google Scholar] [CrossRef]
- Hashemi, S.S.; Karimi, K.; Taherzadeh, M.J. Valorization of vinasse and whey to protein and biogas through an environmental fungi-based biorefinery. J. Environ. Manag. 2022, 303, 114138. [Google Scholar] [CrossRef]
- Gbadeyan, T.; Olanrewaju, O.A.; Kabeyi, M.J.B. Waste-to-energy: The recycling and reuse of sugar industry waste for different sustainable applications. Biofuels Bioprod. Biorefining 2024, 18, 99–117. [Google Scholar] [CrossRef]
- Fuess, L.; Cruz, R.; Zaiat, M.; Nascimento, C. Diversifying the portfolio of sugarcane biorefineries: Anaerobic digestion as the core process for enhanced resource recovery. Renew. Sustain. Energy Rev. 2021, 147, 111246. [Google Scholar] [CrossRef]
- Vilela, M.A.F.; Fuess, L.T.; Moraes, B.S. Modelación y análisis tecnoeconómico de una planta híbrida de caña de azúcar alimentada con biogás de vinaza y excedentes de bagazo para generación de electricidad. Energy Convers. Manag. 2023, 276, 116673. [Google Scholar] [CrossRef]
- Mendieta, M.; de la Torre, M.F.; Pérez, S. Modelado matemático del proceso de producción de biogás a partir del lavado gastado de destilería en la primera etapa. Bioresour. Technol. 2020, 302, 122957. [Google Scholar] [CrossRef]
- Asante, E.; Asiedu, N.Y.; Sarpong, S.; Agyemang, E.O.; Ajani, I.; Ntiamoah, A.; Adjaottor, A.A.; Addo, A. Modeling and assessment of the techno-economic analysis of biogas and its potential for the generation of electricity from water hyacinth biomass. J. Eng. Appl. Sci. 2024, 71, 98. [Google Scholar] [CrossRef]
- Zucaro, A.; Ansanelli, G.; Cerbone, A.; Picarelli, A.; Rinaldi, C.; Beltrani, T.; Sbaffoni, S.; Fiorentino, G. Life Cycle Assessment of Electricity Production from Different Biomass Sources in Italy. Energies 2024, 17, 2771. [Google Scholar] [CrossRef]
- Samson-Bręk, I.; Owczuk, M.; Matuszewska, A.; Biernat, K. Environmental Assessment of the Life Cycle of Electricity Generation from Biogas in Polish Conditions. Energies 2022, 15, 5601. [Google Scholar] [CrossRef]
- Shonhiwa, C.; Mukumba, P.; Makaka, G. Análisis tecnoeconómico de una minicentral eléctrica de biogás (MBEP) para una explotación agrícola típica en zonas aisladas de la red eléctrica de Zimbabue. Biomass Convers. Biorefin. 2025, 15, 4579–4595. [Google Scholar] [CrossRef]
- Klintenberg, P.; Mabeacu, F.; Schwede, S. Is small-scale biogas production a viable source of electricity in rural Sub-Saharan Africa? Proc. Energy Proc. 2022. Available online: https://www.researchgate.net/publication/379514139_Is_small-scale_biogas_production_a_viable_source_of_electricity_in_rural_Sub-Saharan_Africa (accessed on 13 April 2025).
- Duarte Junior, R.; Rossa, Ü.B.; Chiarello, L.M.; Scharf, D.R.; Somensi, C.A.; Vischetti, C.; Gonçalves, L.F.S. Producción de biogás y generación de electricidad a partir de un sistema de tratamiento de aguas residuales de estiércol de codorniz por profundidad de agua. Rev. Bras. Ciências Ambient. 2023, 58, 293–303. [Google Scholar] [CrossRef]
- Rodríguez Romero, T.E.; Cabello Eras, J.J.; Sagastume Gutierrez, A.; Mendoza Fandiño, J.M.; Rueda Bayona, J.G. The Energy Potential of Agricultural Biomass Residues for Household Use in Rural Areas in the Department La Guajira (Colombia). Sustainability 2025, 17, 974. [Google Scholar] [CrossRef]
- Kabeyi, M.J.B.; Olanrewaju, O.A. Technologies for biogas to electricity conversion. Energy Rep. 2022, 8, 774–786. [Google Scholar] [CrossRef]
- Lobo, R.; Gutiérrez, S.; Villatoro, H. Technical Feasibility of an Electrical Generation Plant from Municipal Solid Waste in Honduras, Central America. In Proceedings of the 20th LACCEI International Multi-Conference for Engineering, Education, and Technology: Education, Research, and Leadership in Post-Pandemic Engineering: Resilient, Inclusive and Sustainable Approaches, Boca Raton, FL, USA, 18–22 July 2022. [Google Scholar] [CrossRef]
- Arshad, M.; Ansari, A.R.; Qadir, R.; Tahir, M.H.; Nadeem, A.; Mehmood, T.; Alhumade, H.; Khan, N. Green electricity generation from biogas of cattle manure: An assessment of potential and feasibility in Pakistan. Front. Energy Res. 2022. [Google Scholar] [CrossRef]
- Balcioglu, G.; Jeswani, H.K.; Azapagic, A. Evaluating the environmental and economic sustainability of energy from anaerobic digestion of different feedstocks in Turkey. Sustain. Prod. Consum. 2022, 32, 924–941. [Google Scholar] [CrossRef]
- Banaget, C.K.; Frick, B.; Saud, M.N.I.L. Analysis of Electricity Generation from Landfill Gas (Case Study: Manggar Landfill, Balikpapan). IOP Conf. Ser. Earth Environ. Sci. 2020, 448, 012003. [Google Scholar] [CrossRef]
- Isaka, I.; Mwakitalima, R.; Kumar, N.M. Integración de una fuente de energía solar fotovoltaica y un sistema de energía a base de biogás para aumentar el acceso a la electricidad en zonas rurales de Tanzania. Int. J. Photoenergy 2023. [Google Scholar] [CrossRef]
- Barragán-Escandón, A.; Olmedo Ruiz, J.M.; Curillo Tigre, J.D.; Zalamea-León, E.F. Assessment of Power Generation Using Biogas from Landfills in an Equatorial Tropical Context. Sustainability 2020, 12, 2669. [Google Scholar] [CrossRef]
- Oficina Nacional de Estadística e Información (ONEI). Anuario Estadístico de Cuba 2022; Oficina Nacional de Estadística e Información: La Habana, Cuba, 2023; Available online: http://www.onei.gob.cu (accessed on 2 June 2025).
- Dirección General de Seguimiento y Evaluación de Políticas, MINAGRI. Industria Azucarera Nacional y Mercado Internacional. Serie Histórica de las Principales Variables de la Industria Azucarera en el Perú (1914–2018). Available online: https://www.gob.pe/minagri (accessed on 2 June 2025).
- Pereira, I.Z.; dos Santos, I.F.S.; Barros, R.M.; de Castro e Silva, H.L.; Tiago Filho, G.L.; Moni e Silva, A.P. Vinasse biogas energy and economic analysis in the state of São Paulo, Brazil. J. Clean. Prod. 2020, 260, 121018. [Google Scholar] [CrossRef]
- Kiani Deh Kiani, M.; Parsaee, M.; Safieddin Ardebili, S.M.; Reyes, I.P.; Fuess, L.T.; Karimi, K. Different bioreactor configurations for biogas production from sugarcane vinasse: A comprehensive review. Biomass Bioenergy 2022, 161, 106446. [Google Scholar] [CrossRef]
- Matsueda, Y.; Antunes, E. A review of current technologies for the sustainable valorisation of sugarcane bagasse. J. Environ. Chem. Eng. 2024, 12, 114900. [Google Scholar] [CrossRef]
- Lorenzo-Llanes, J.; Pagés-Díaz, J.; Kalogirou, E.; Contino, F. Development and application in Aspen Plus of a process simulation model for the anaerobic digestion of vinasses in UASB reactors: Hydrodynamics and biochemical reactions. J. Environ. Chem. Eng. 2020, 8, 103540. [Google Scholar] [CrossRef]
- Dupont, G.K.; Oliveira, M.M.; Clerici, N.J.; Serafini, C.G.; Daroit, D.J.; Wenzel, B.M. Kinetic modelling and improvement of methane production from the anaerobic co-digestion of swine manure and cassava bagasse. Biomass Bioenergy 2023, 176, 106900. [Google Scholar] [CrossRef]
- Moraes, B.S.; Junqueira, T.L.; Pavanello, L.G.; Cavalett, O.; Mantelatto, P.E.; Bonomi, A.; Zaiat, M. Anaerobic digestion of vinasse from sugarcane biorefineries in Brazil from energy, environmental, and economic perspectives: Profit or expense? Appl. Energy 2014, 113, 825–835. [Google Scholar] [CrossRef]
- do Vale Borges, A.; Fuess, L.T.; Alves, I.; Takeda, P.Y.; Damianovic, M.H.R.Z. Co-digesting sugarcane vinasse and distilled glycerol to enhance bioenergy generation in biofuel-producing plants. Energy Convers. Manag. 2021, 250, 114897. [Google Scholar] [CrossRef]
- Junior, L.M.C.; Júnior, E.P.S.; da Silva, C.F.F.; de Oliveira, B.H.C.; Dantas, J.B.C.; dos Reis, J.V.; Schramm, V.B.; Schramm, F.; Carvalho, M. Supply of bioelectricity from sugarcane bagasse in Brazil: A space–time analysis. Sustain. Environ. Res. 2024, 34, 17. [Google Scholar] [CrossRef]
- Aburto, J.; Martinez-Hernandez, E.; Amezcua-Allieri, M.A. Techno-Economic Feasibility of Steam and Electric Power Generation from the Gasification of Several Biomass in a Sugarcane Mill. BioEnergy Res. 2022, 15, 1777–1786. [Google Scholar] [CrossRef]
- Soares, A.d.A.V.L.; Prado, R.d.M.; Bertani, R.M.d.A.; da Silva, A.P.R.; Deus, A.C.F.; Kano, C.; Furlaneto, F.d.P.B. Contribution of Using Filter Cake and Vinasse as a Source of Nutrients for Sustainable Agriculture—A Review. Sustainability 2024, 16, 5411. [Google Scholar] [CrossRef]
- Usmania, A.; Pangkumhang, B.; Wongaree, M.; Wantalad, K.; Khunphono, R. Kinetic study of biogas production from anaerobic digestion of vinasse waste. Water Pract. Technol. 2021, 16, 886. [Google Scholar] [CrossRef]
- Mauky, E.; Weinrich, S.; Nägele, H.J.; Jacobi, H.F.; Liebetrau, J.; Nelles, M. Model Predictive Control for Demand-Driven Biogas Production in Full Scale. Chem. Eng. Technol. 2016, 39, 652–664. [Google Scholar] [CrossRef]
- Dasí-Crespo, D.; Carcerller-Toselli, A.; Roldán-Blay, C.; Escrivá-Escrivá, G.; Roldán-Porta, C. Design and Implementation of a Biogas Pilot Plant for Bioaugmentation Strategies in a Rural Municipality. In Proceedings of the 22nd International Conference on Renewable Energies and Power Quality (ICREPQ’24), Bilbao, Spain, 26–28 June 2024; Volume 22. [Google Scholar] [CrossRef]
- Sica, P.; Marabesi, A.O.; Seleghim, A.R.; Das, K.; Baptista, A.S. Effects of vinasse concentration on biogas production: An experimental work and case study in the context of RenovaBio in Brazil. Bioresour. Technol. Rep. 2024, 25, 101698. [Google Scholar] [CrossRef]
- Estévez, S.; Rebolledo-Leiva, R.; Hernández, D.; González-García, S.; Feijoo, G.; Moreira, M.T. Benchmarking composting, anaerobic digestion and dark fermentation for apple vinasse management as a strategy for sustainable energy production. Energy 2023, 274, 127319. [Google Scholar] [CrossRef]
- Lindorfer, H.; Demmig, C. Foam Formation in Biogas Plants – A Survey on Causes and Control Strategies. Chem. Eng. Technol. 2016, 39, 620–626. [Google Scholar] [CrossRef]
- Garcia-Perez, T.; Ortiz-Ulloa, J.A.; Jara-Cobos, L.E.; Pelaez-Samaniego, M.R. Adding Value to Sugarcane Bagasse Ash: Potential Integration of Biogas Scrubbing with Vinasse Anaerobic Digestion. Sustainability 2023, 15, 15218. [Google Scholar] [CrossRef]
- Albuquerque, J.; Ratusznei, S.; Rodrigues, J. Biomethane production by thermophilic co-digestion of sugarcane vinasse and whey in an AnSBBR: Effects of composition, organic load, feed strategy and temperature. J. Environ. Manag. 2019, 251, 109606. [Google Scholar] [CrossRef] [PubMed]
- de Carvalho, J.C.; de Souza Vandenberghe, L.P.; Sydney, E.B.; Karp, S.G.; Magalhães, A.I.; Martinez-Burgos, W.J.; Medeiros, A.B.P.; Thomaz-Soccol, V.; Vieira, S.; Letti, L.A.J.; et al. Biomethane Production from Sugarcane Vinasse in a Circular Economy: Developments and Innovations. Fermentation 2023, 9, 349. [Google Scholar] [CrossRef]


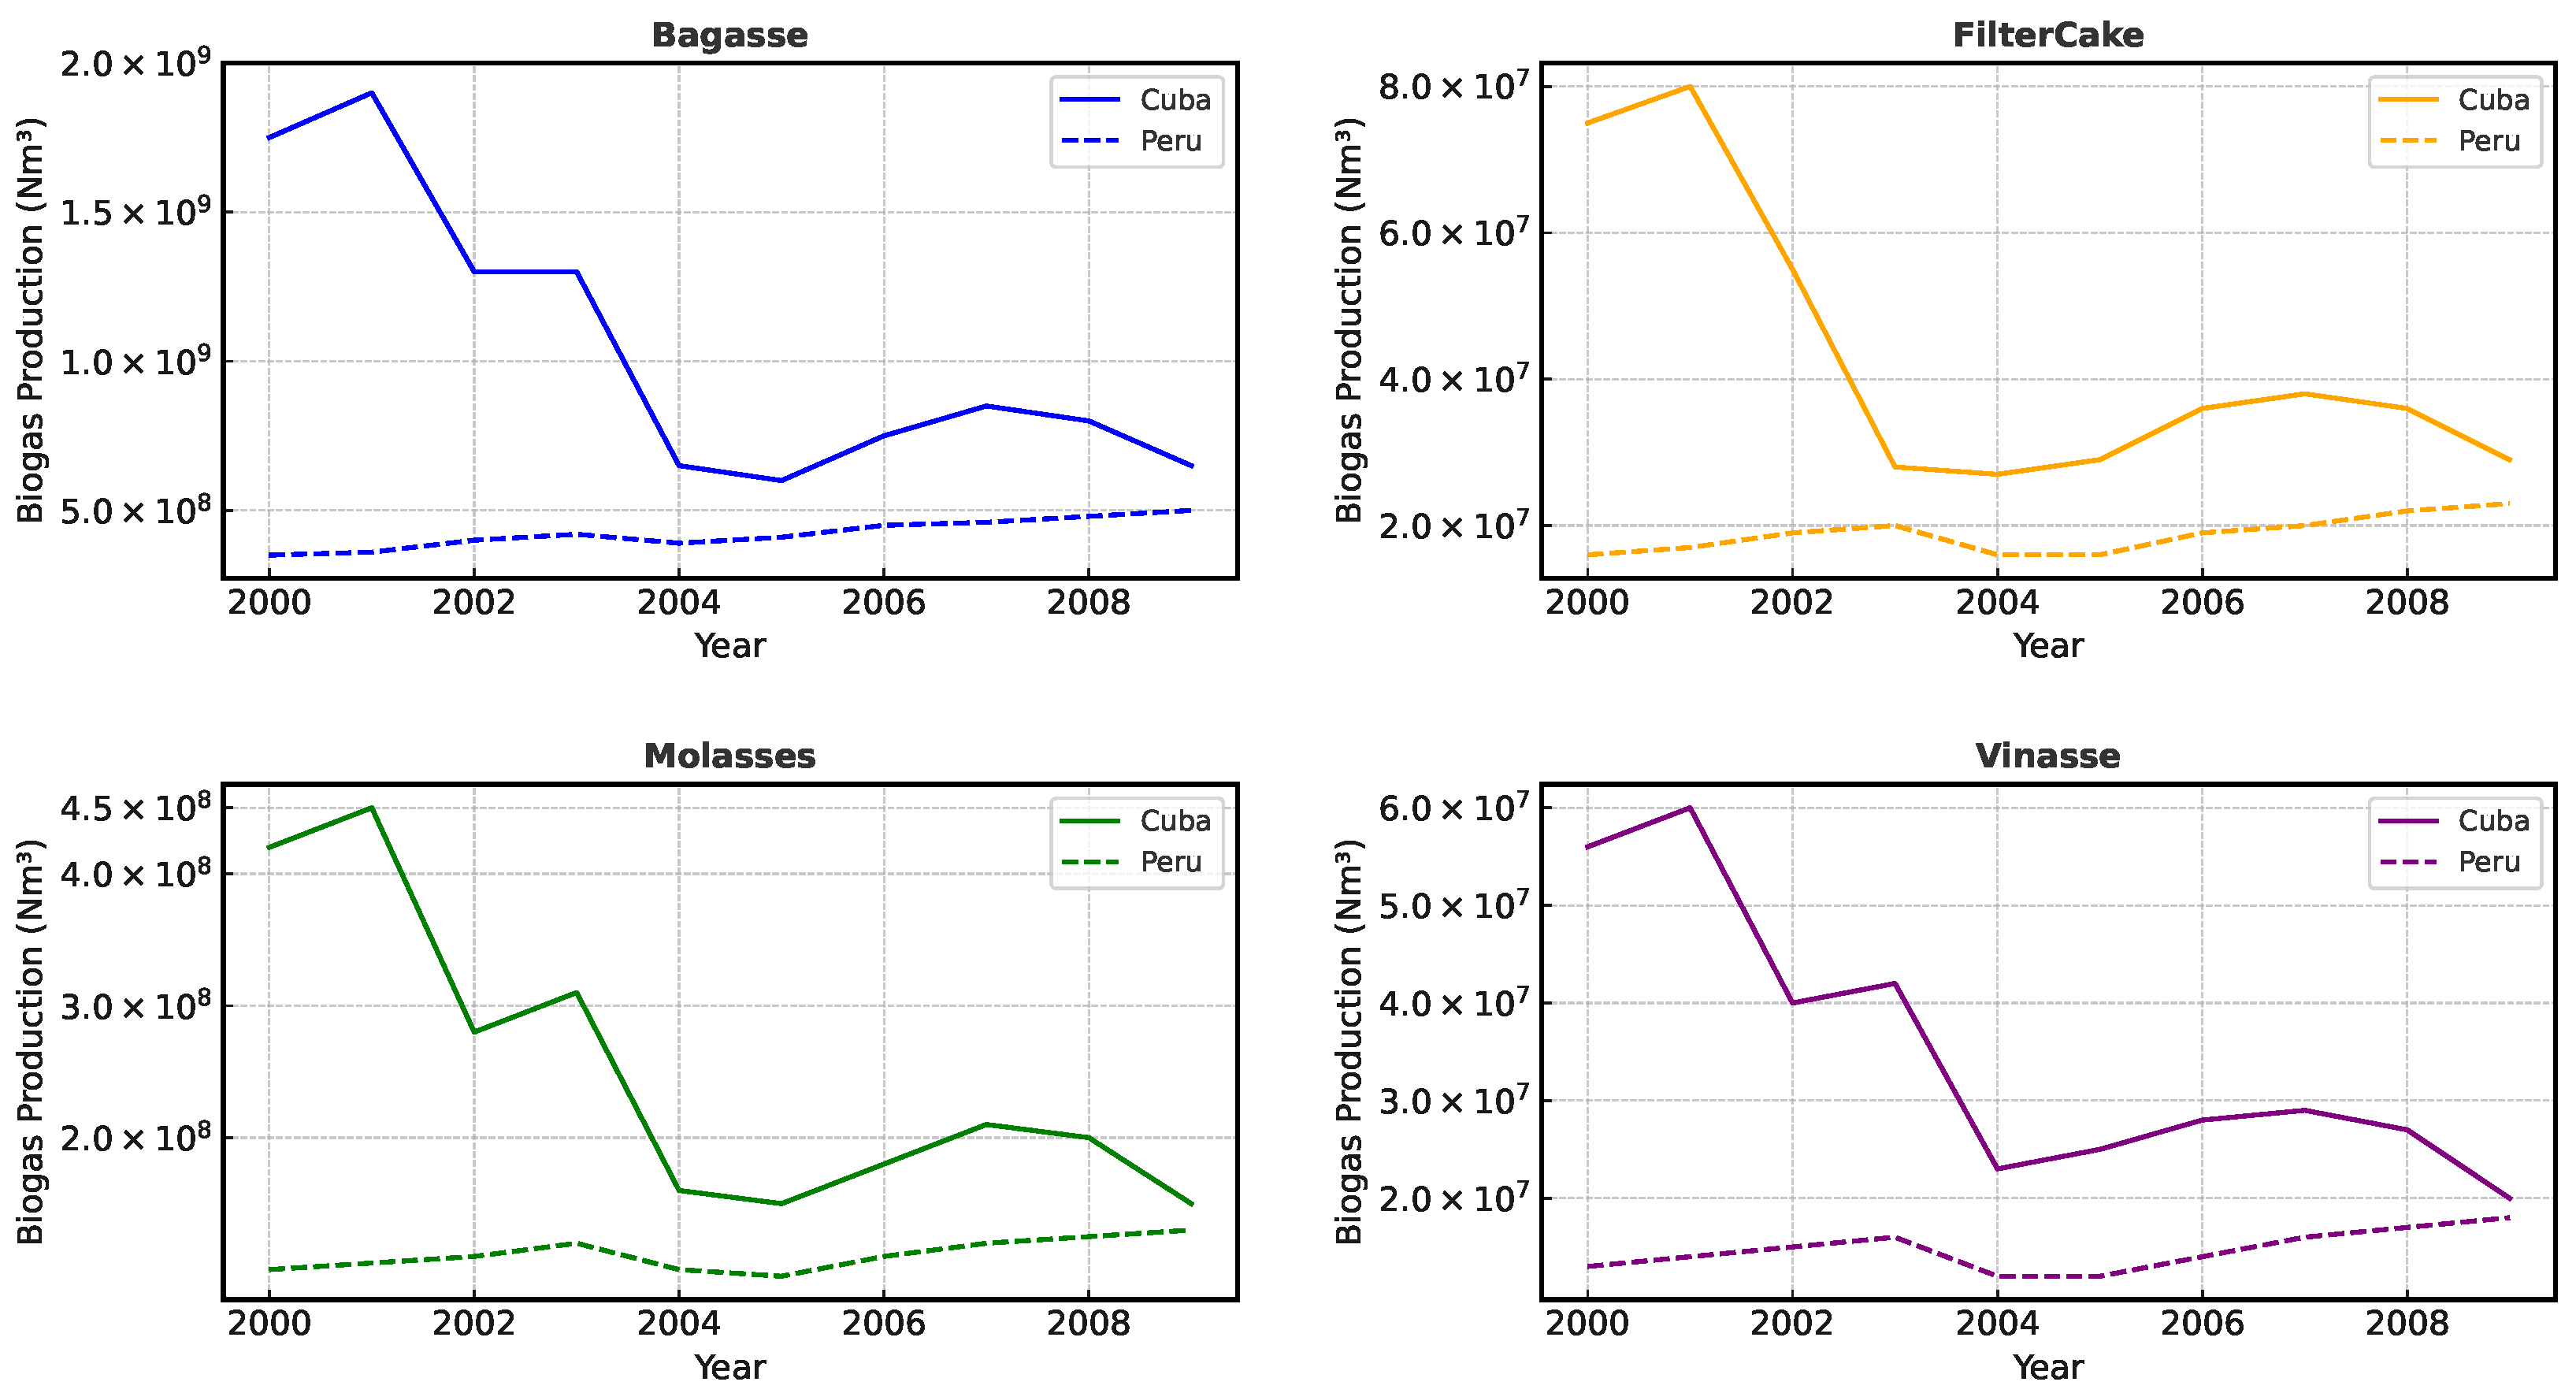
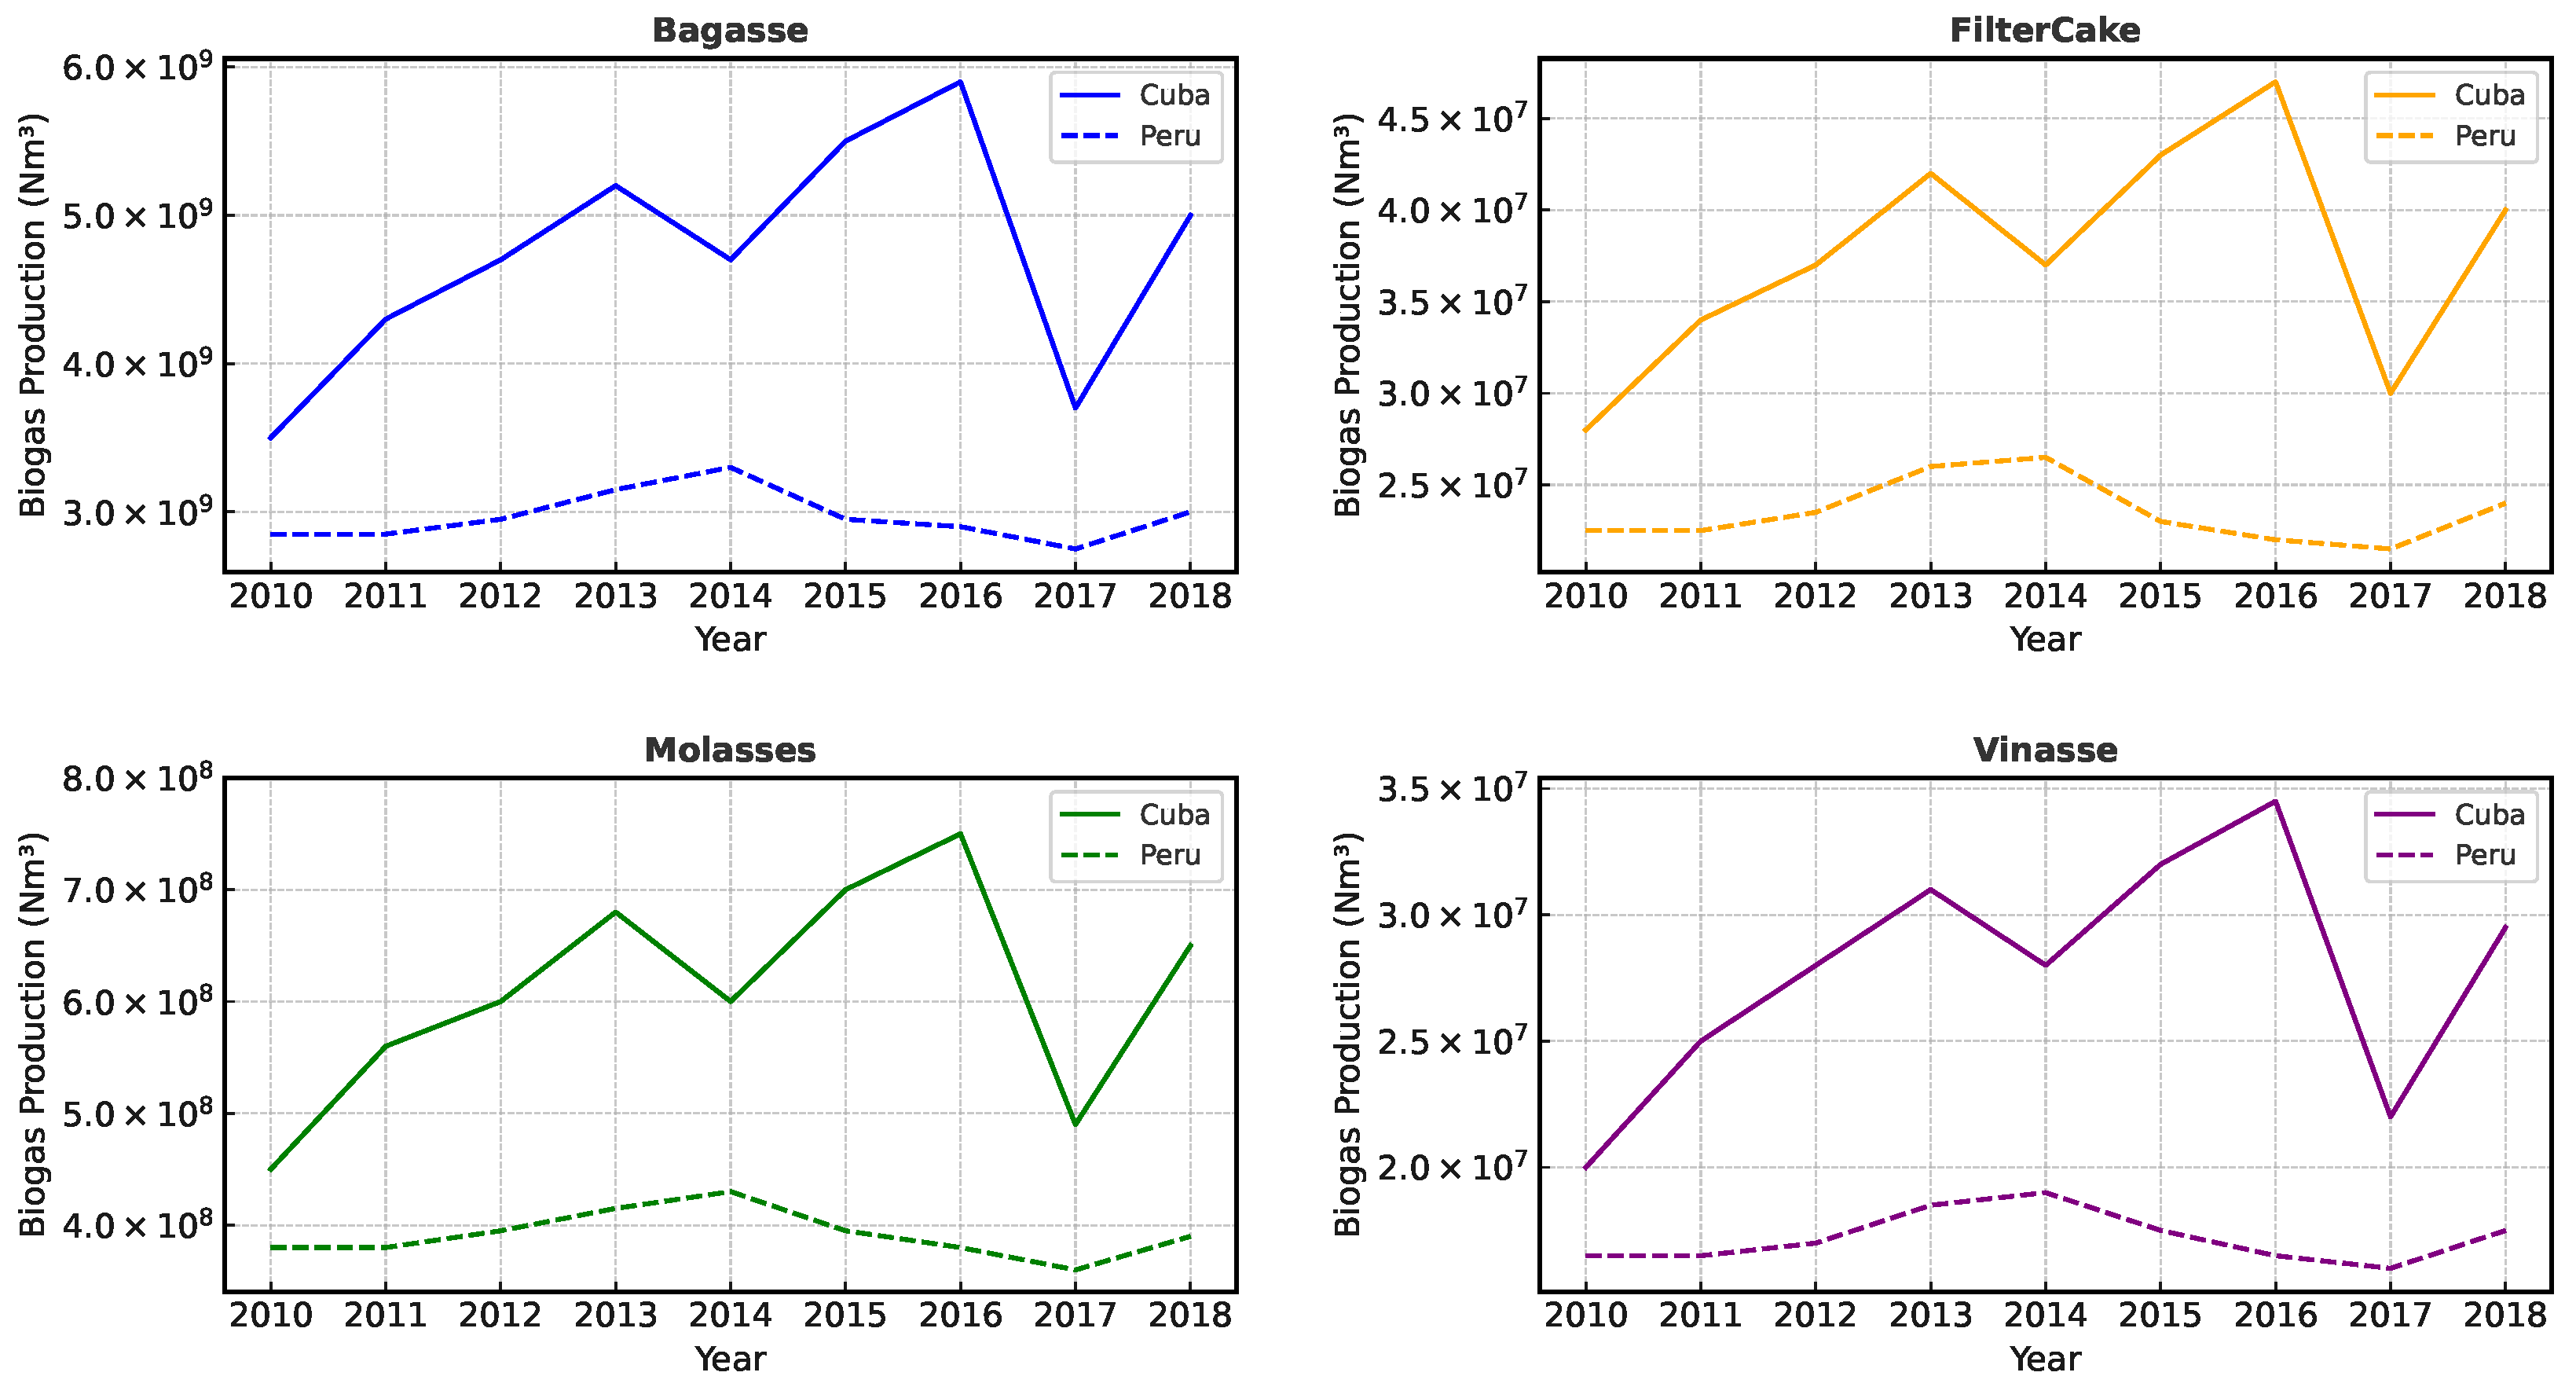
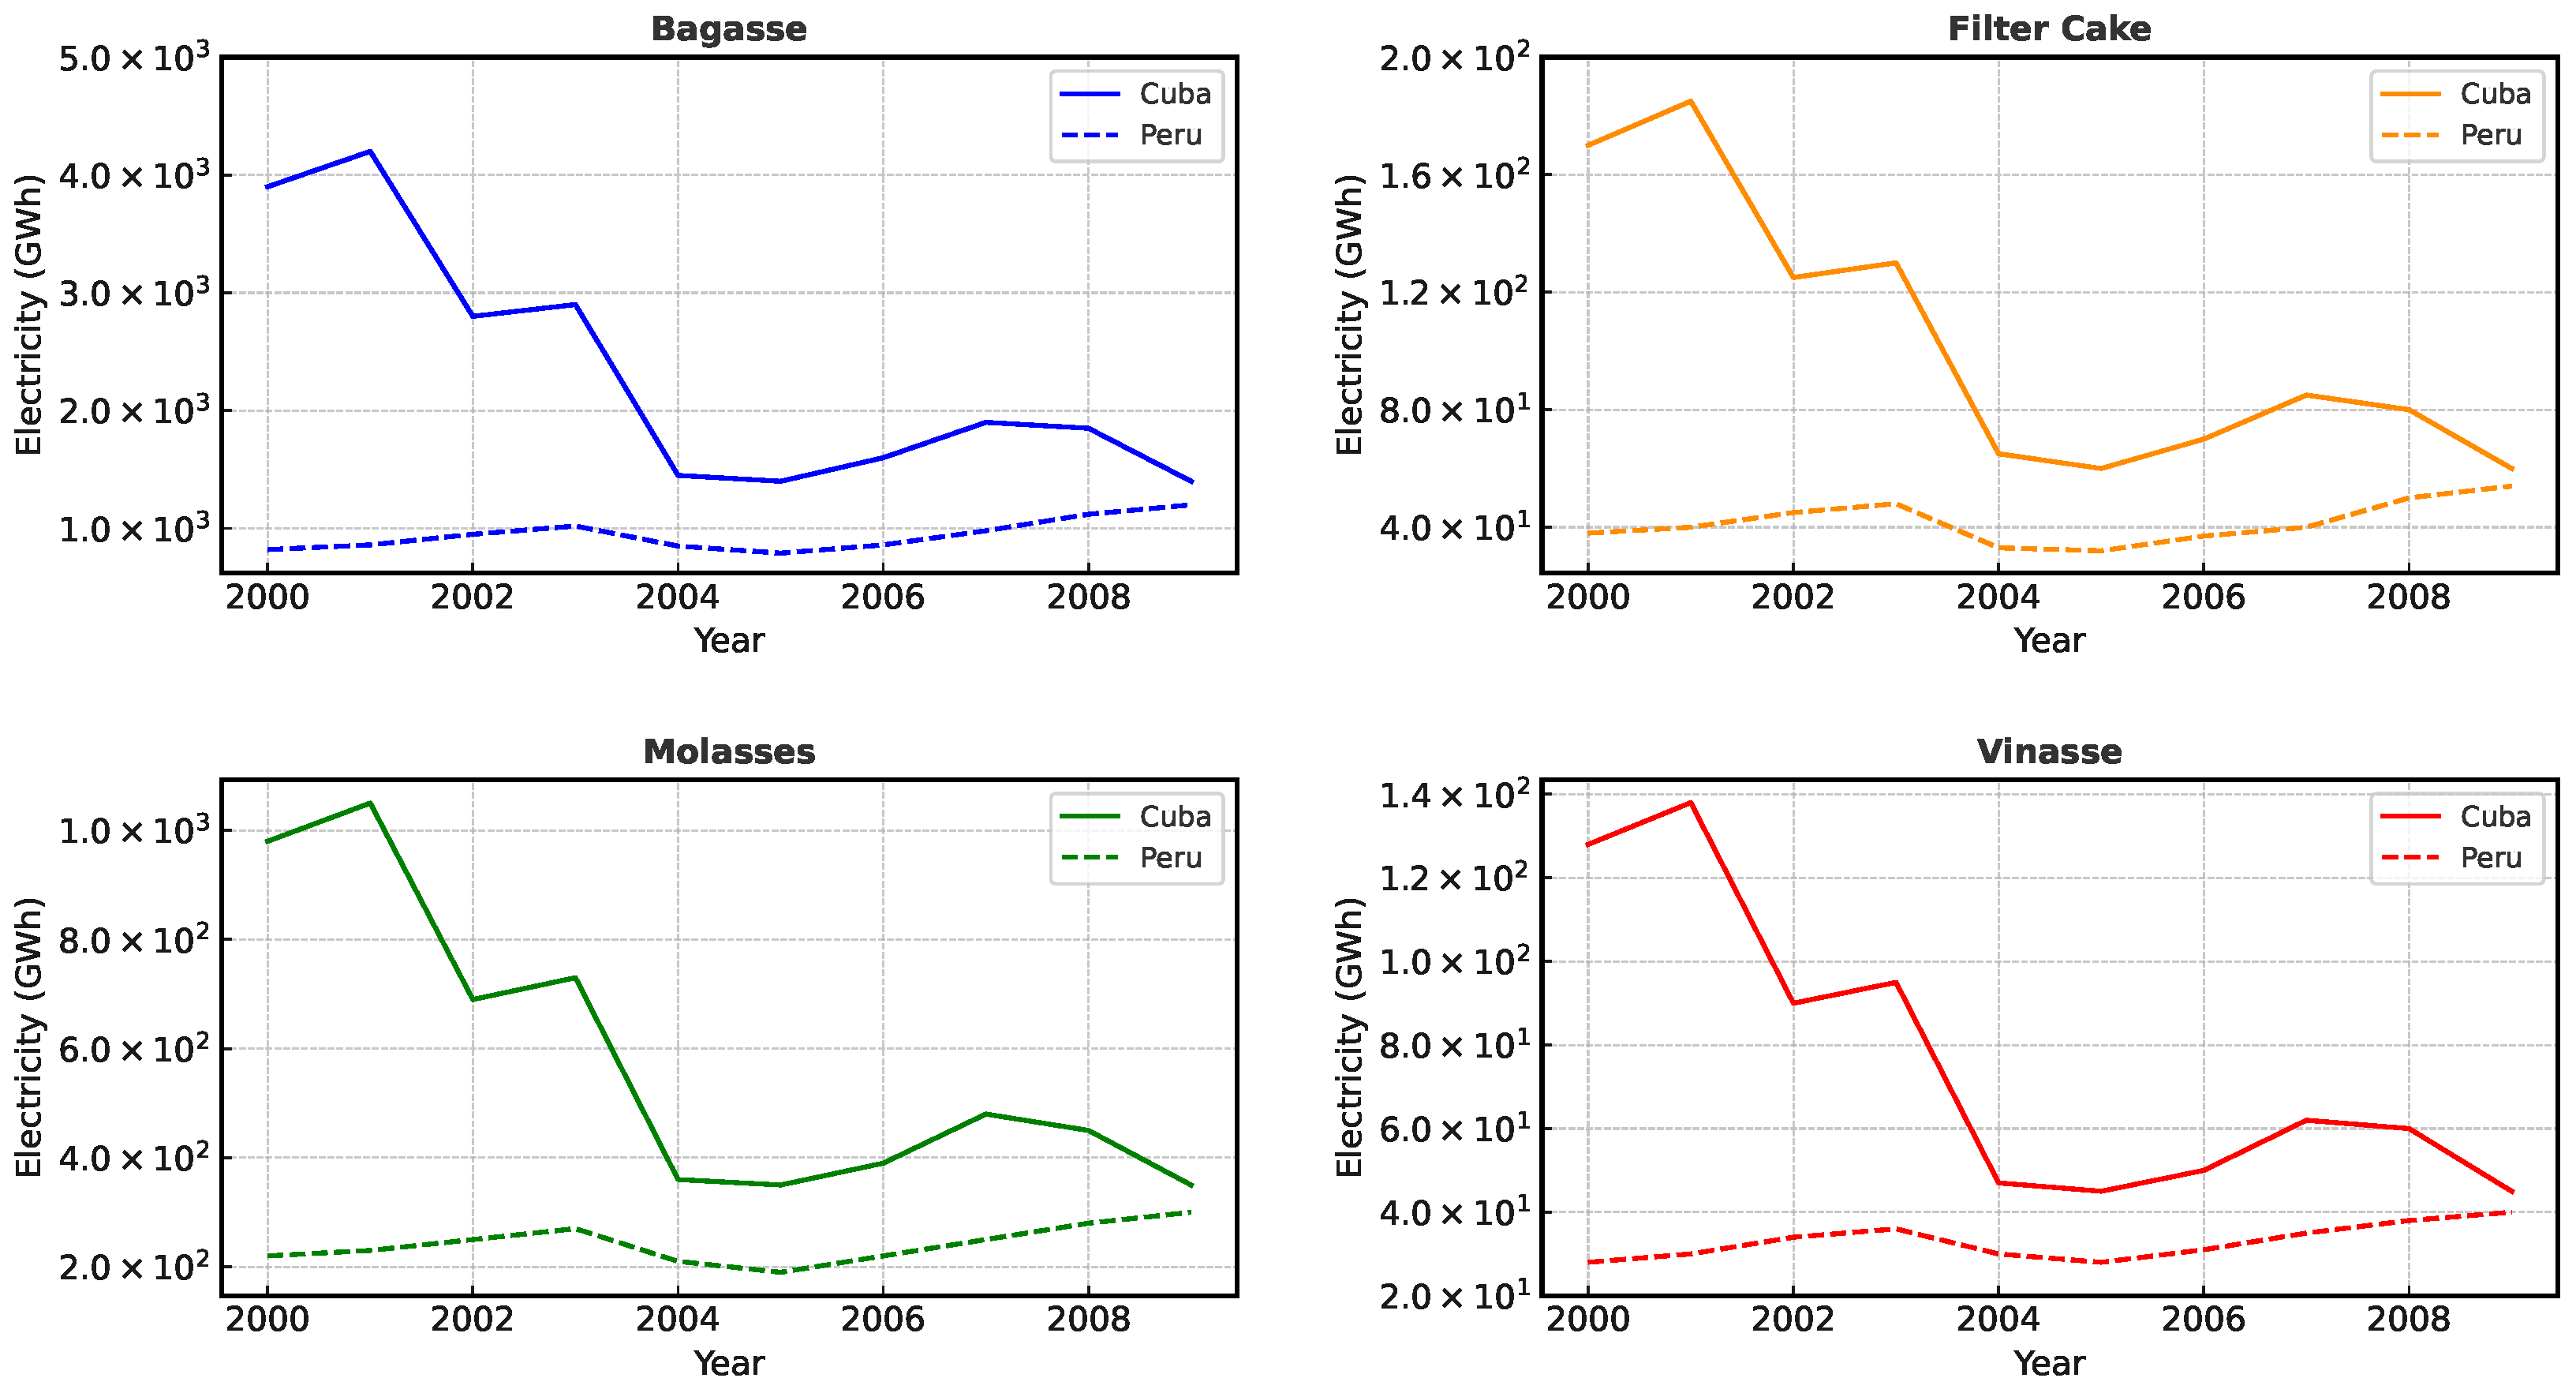
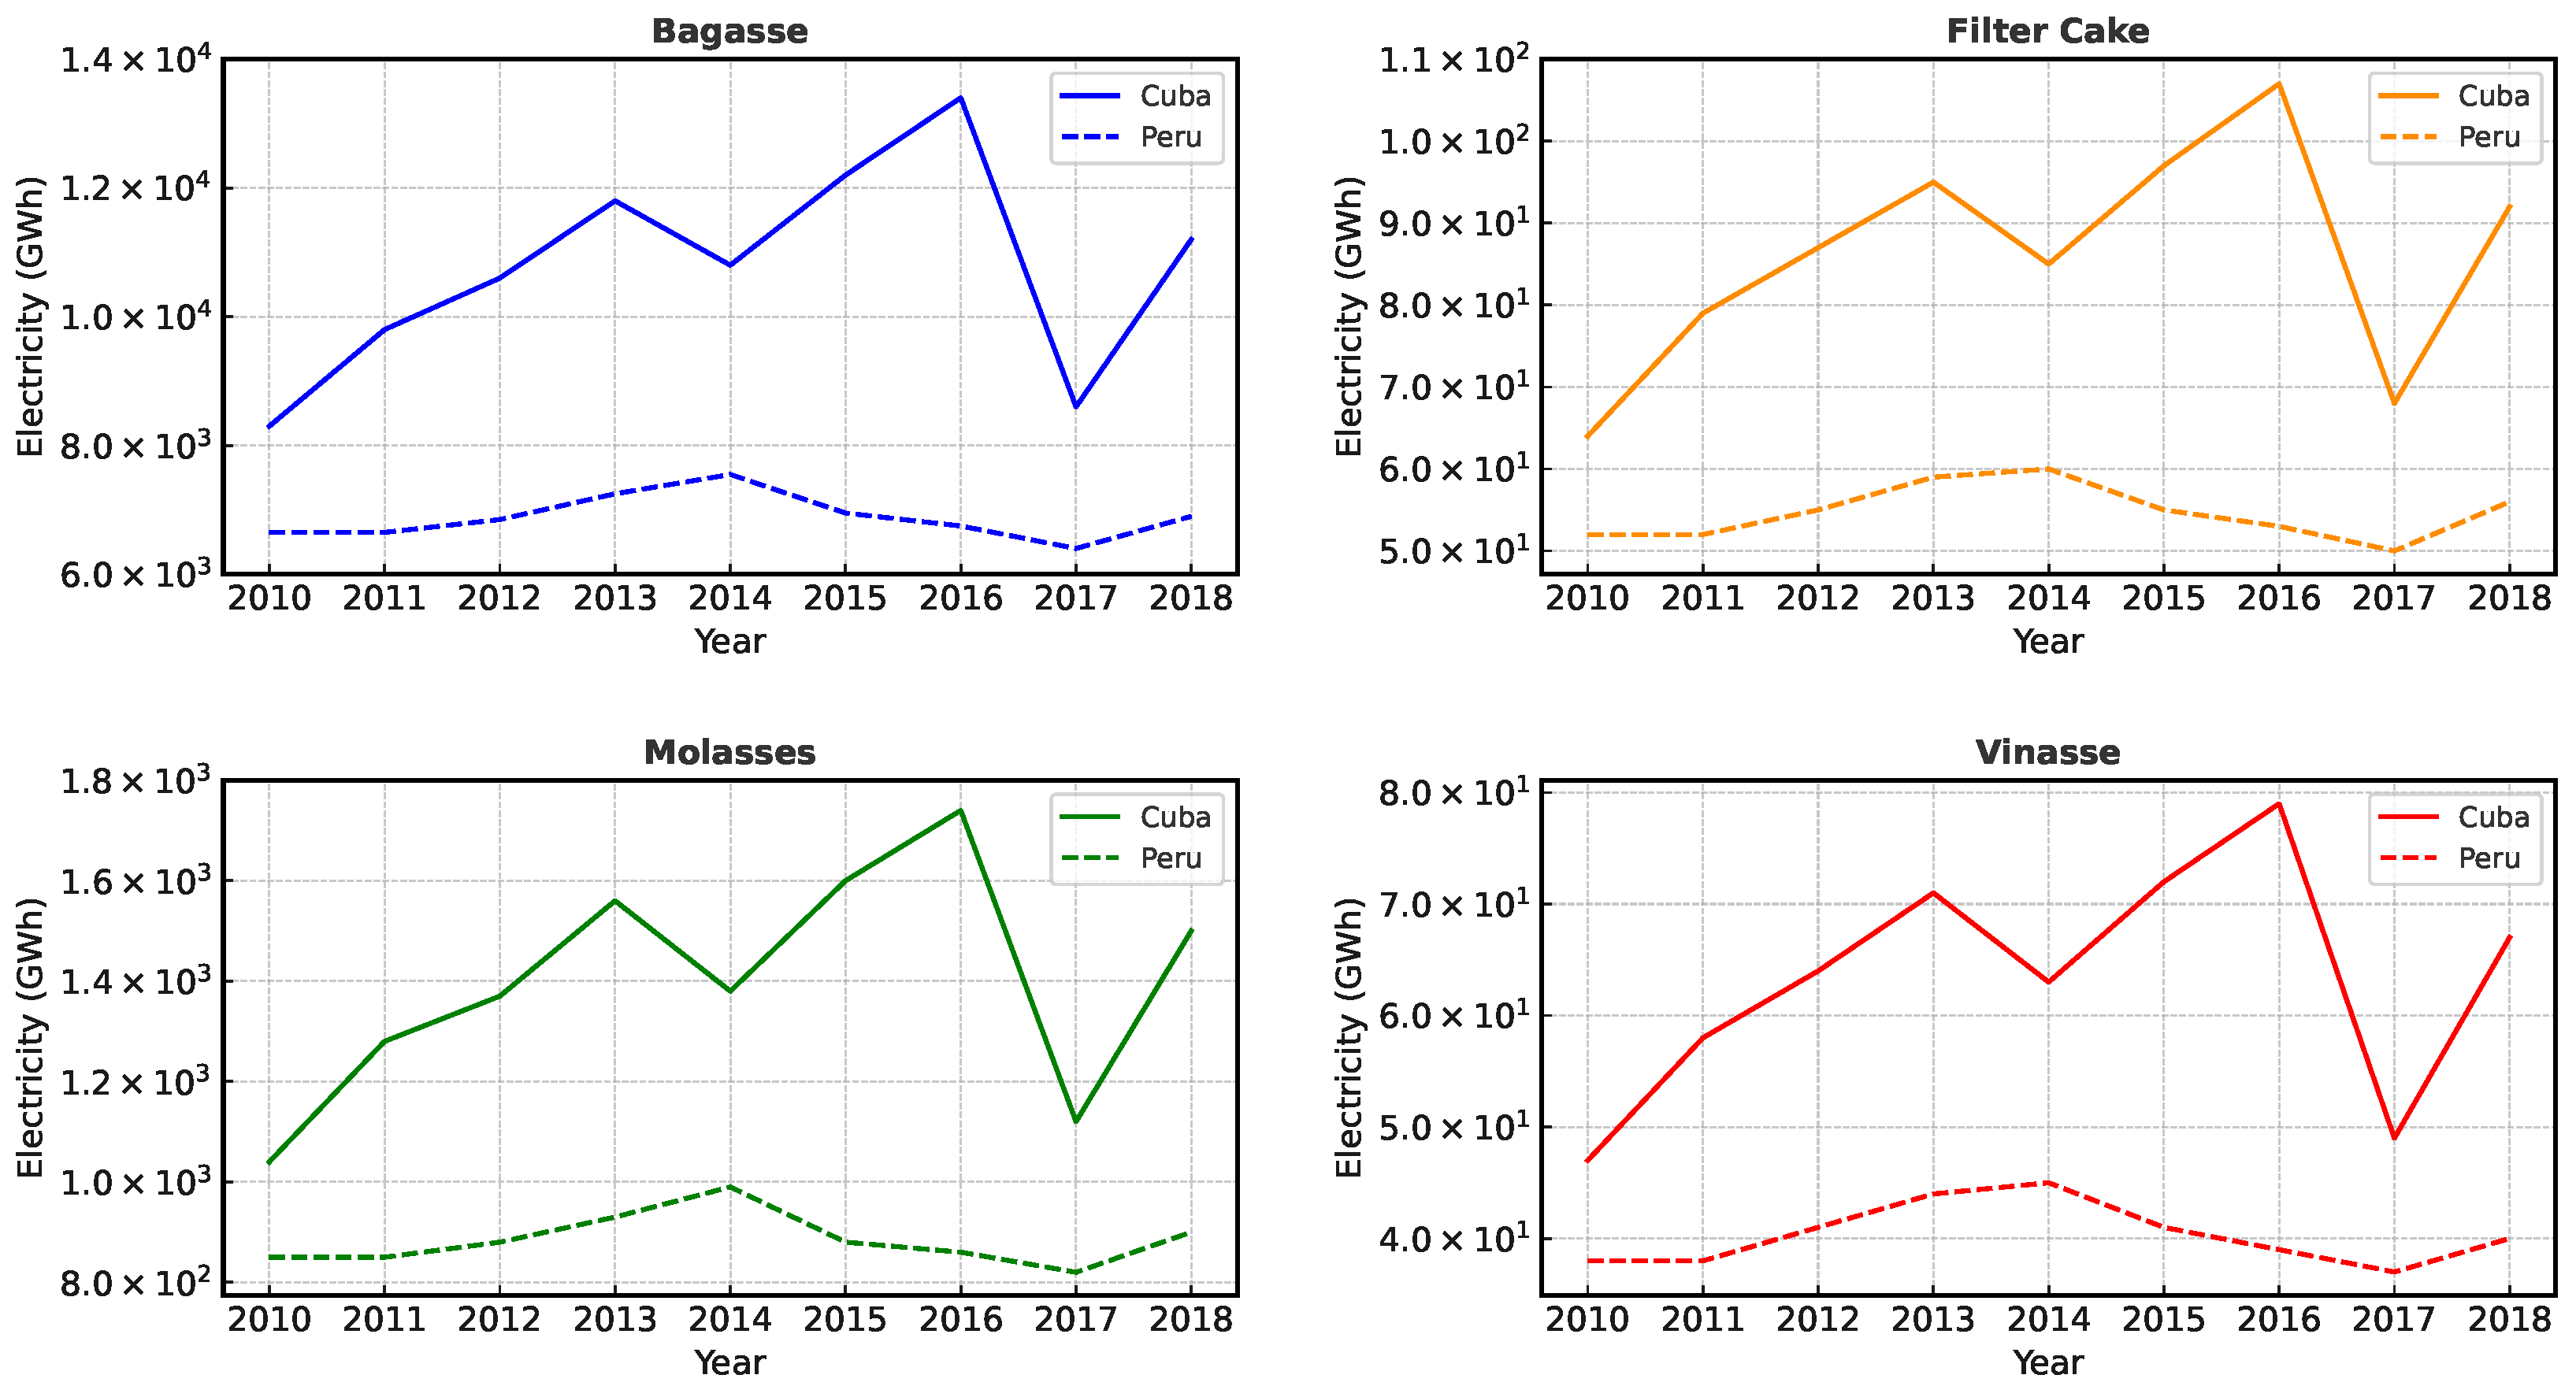


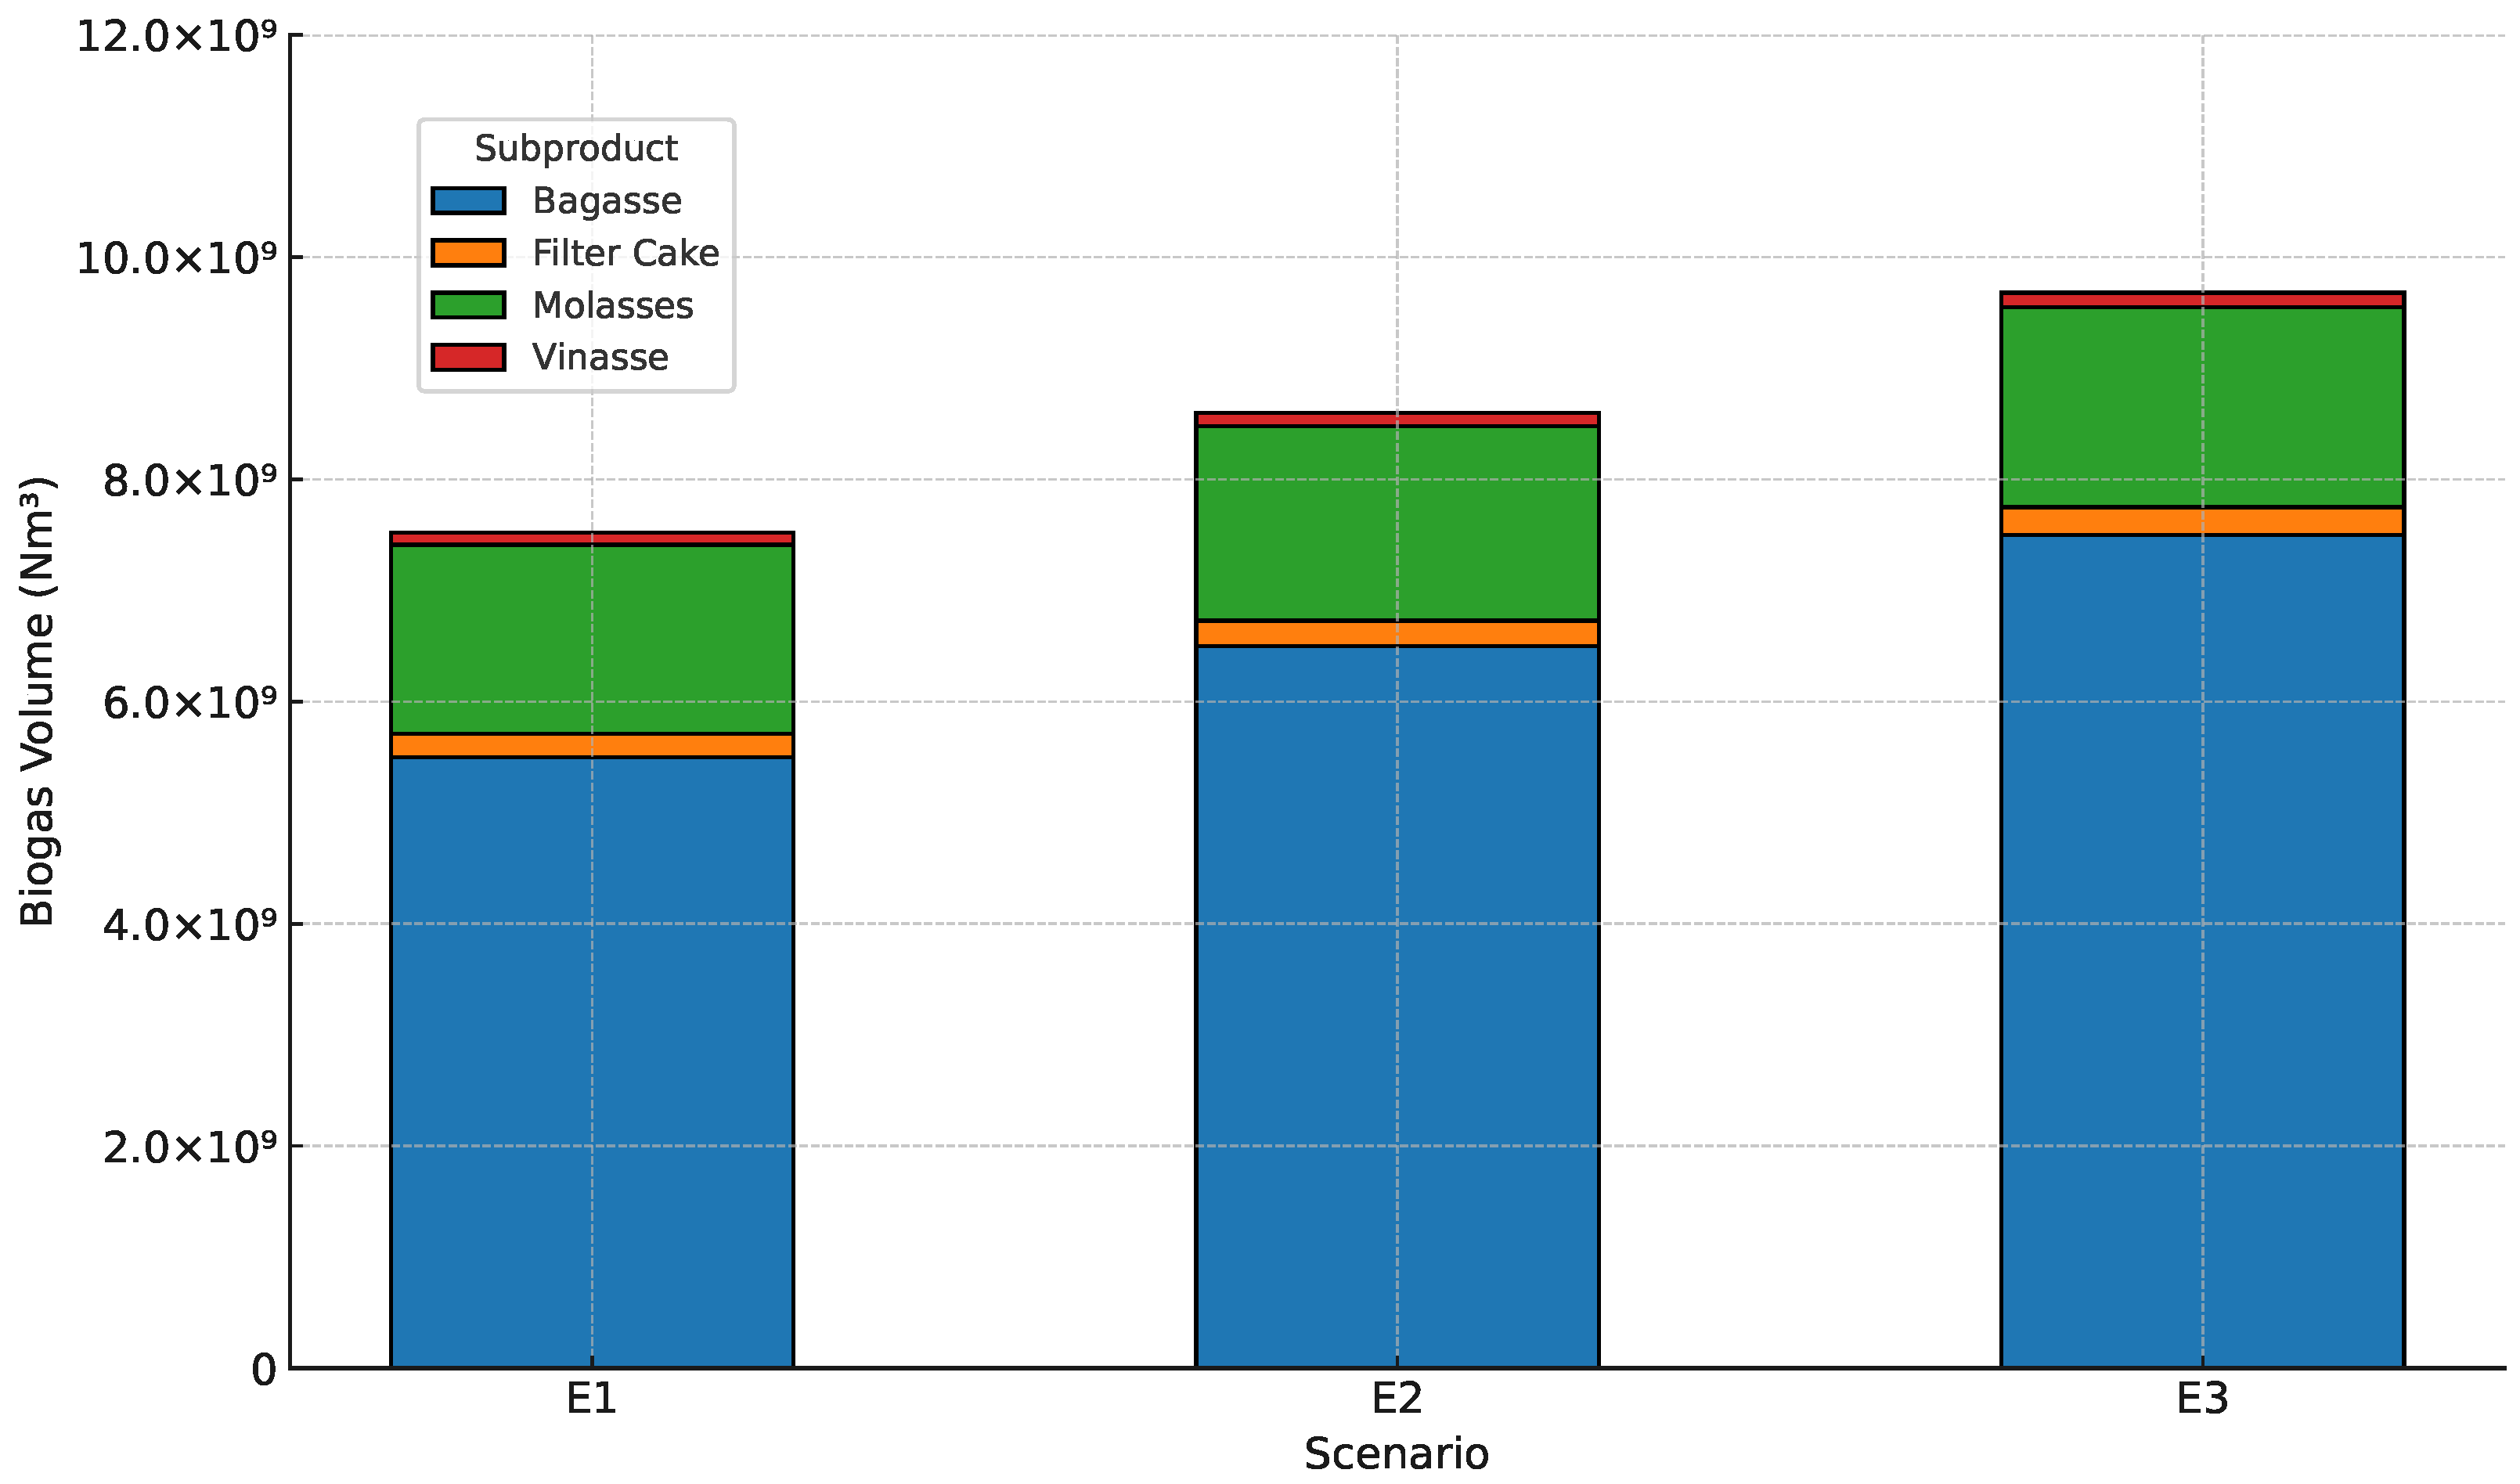


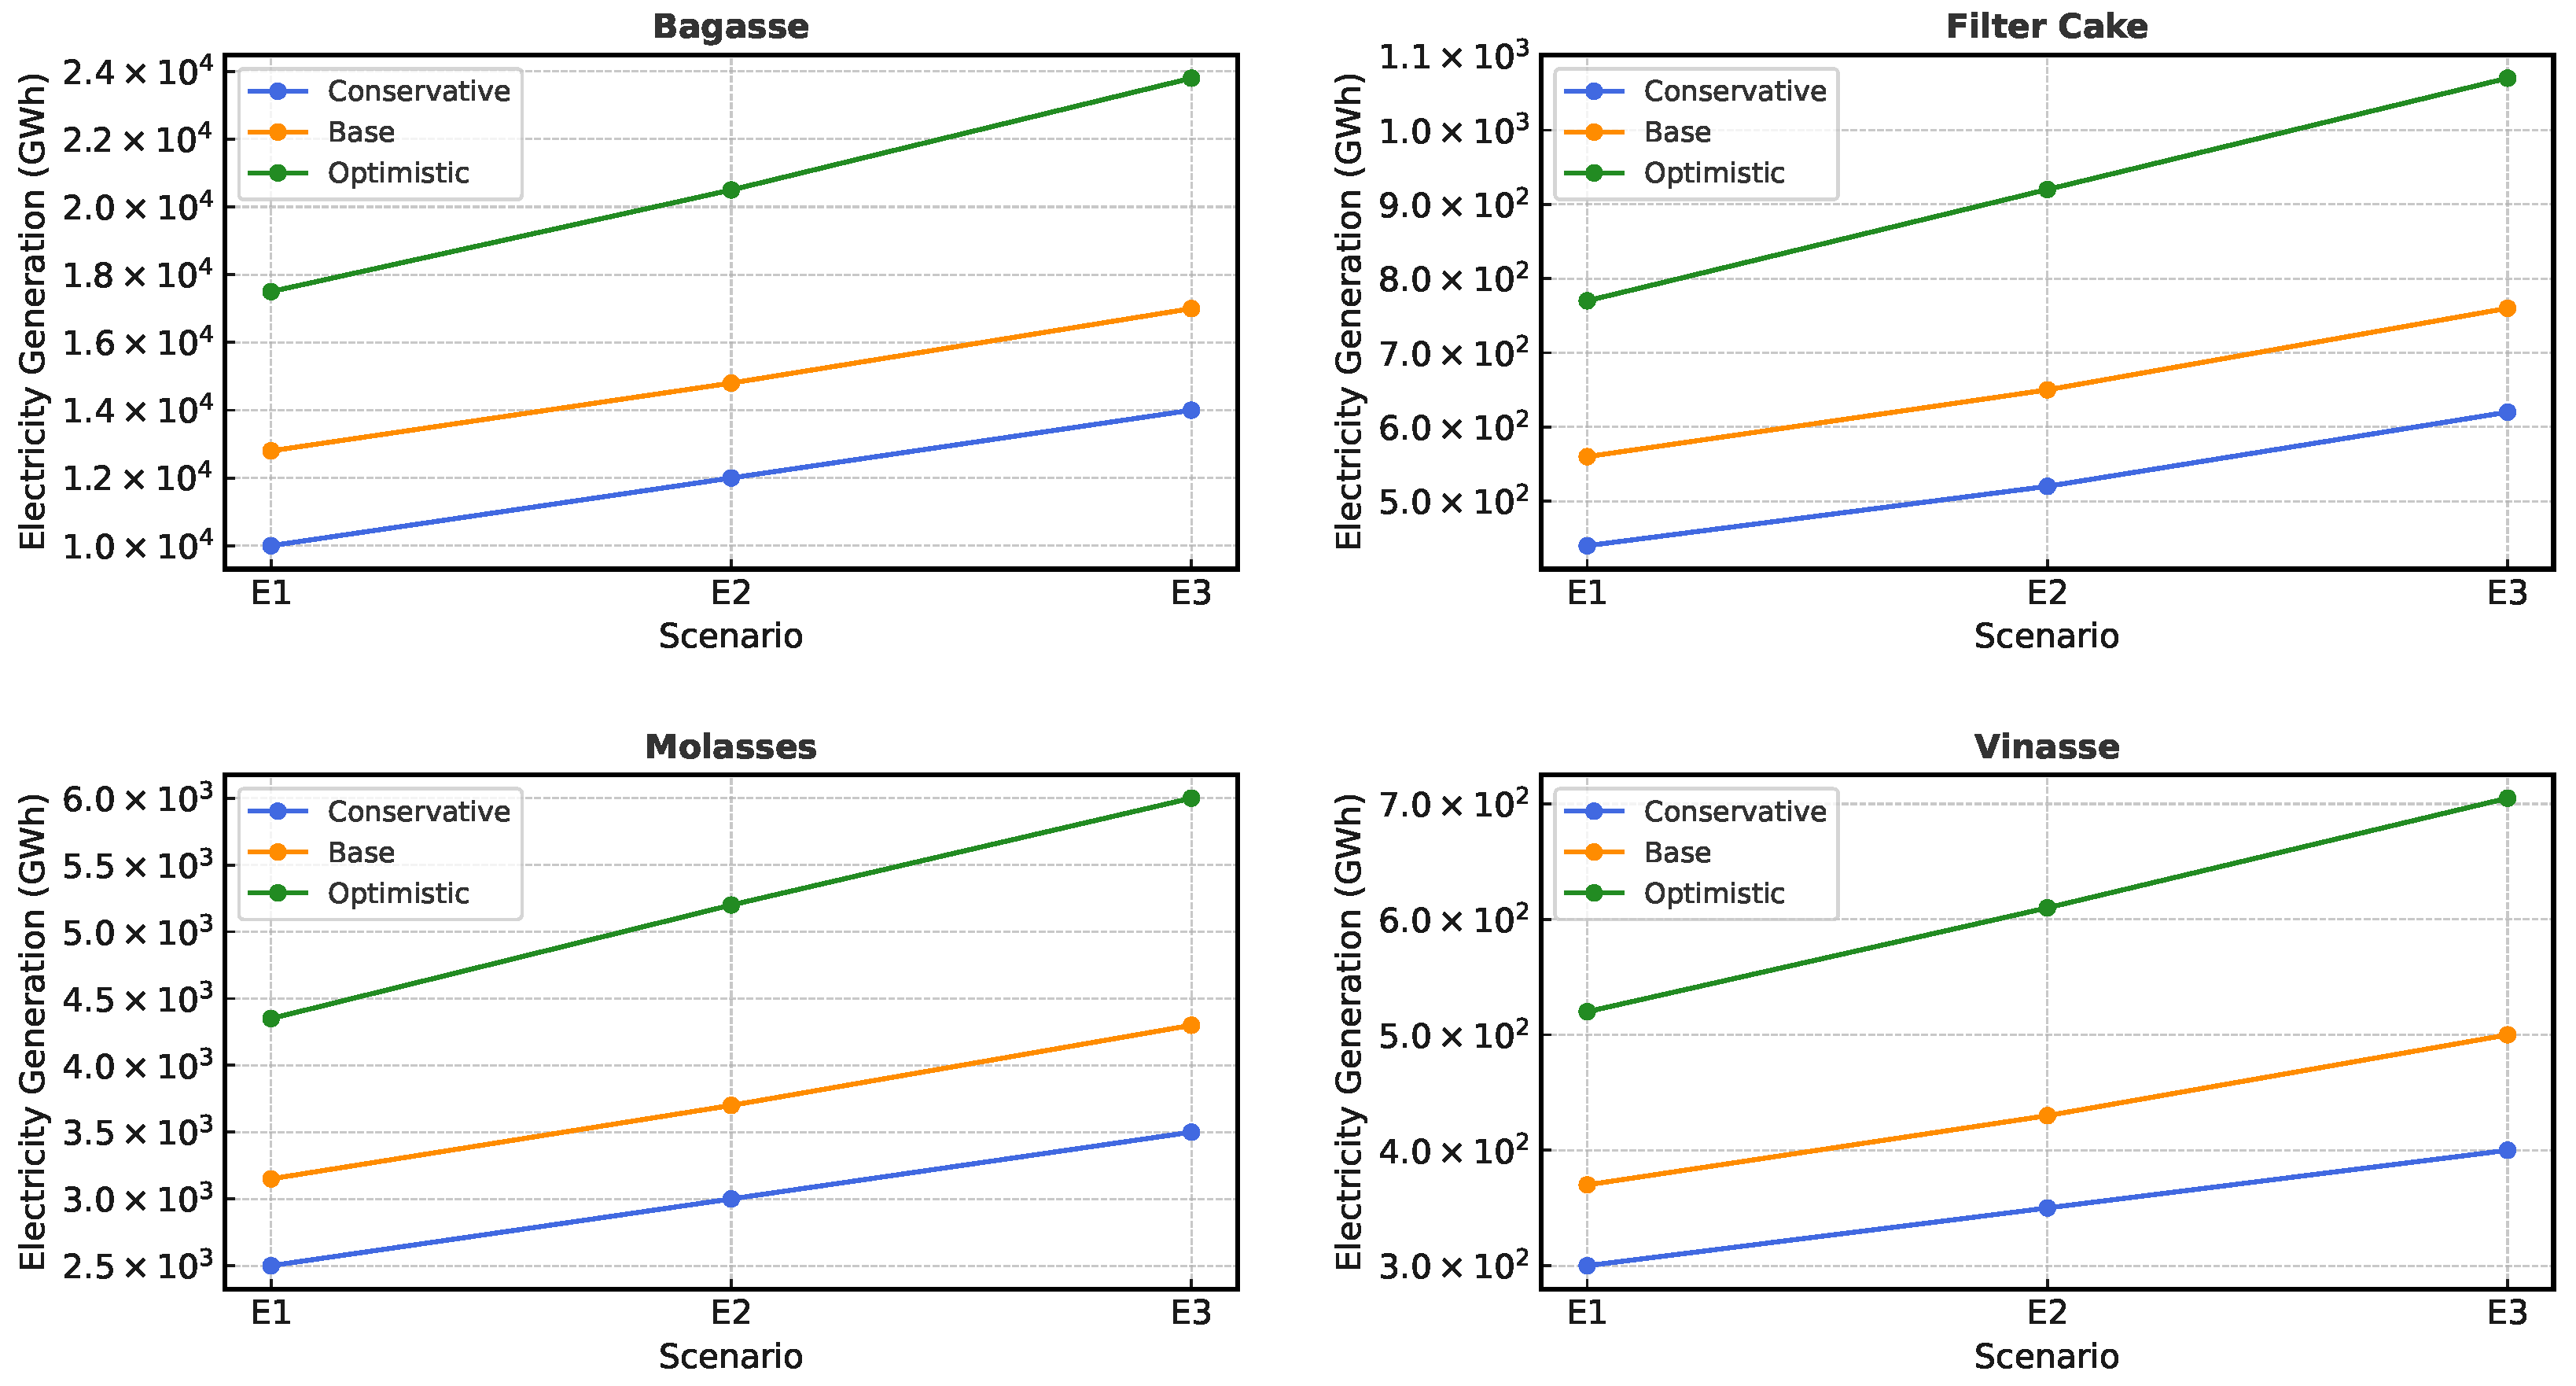
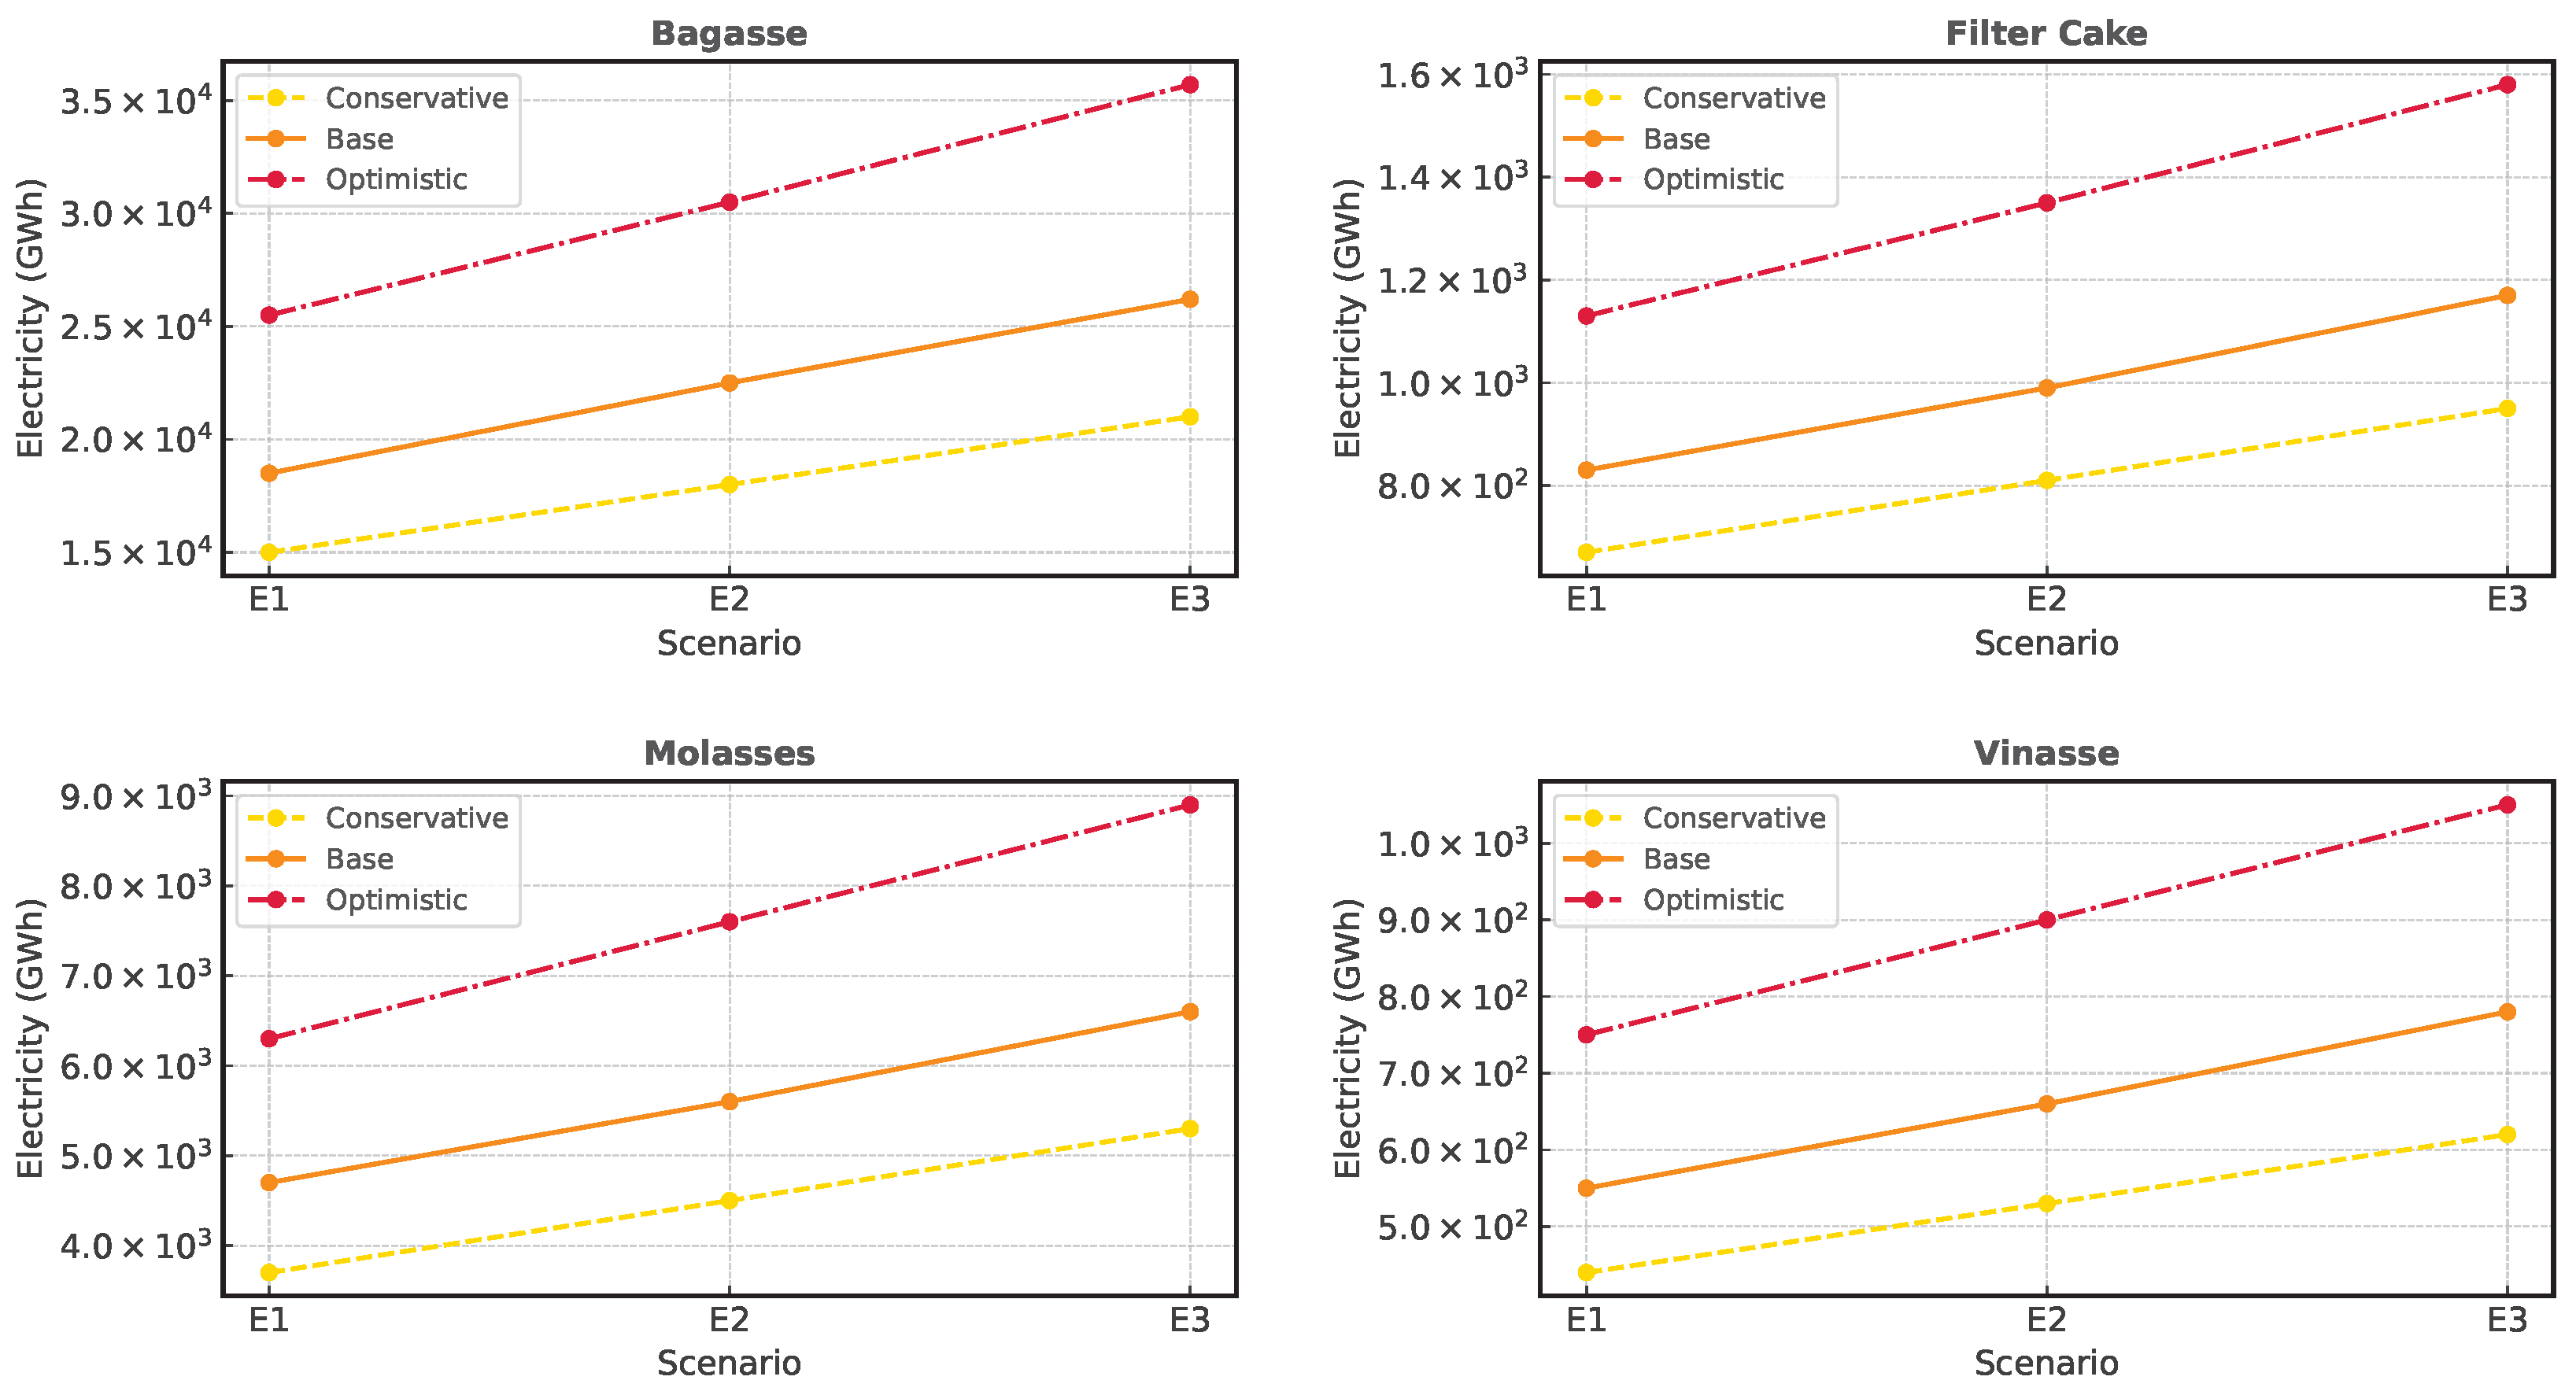

Disclaimer/Publisher’s Note: The statements, opinions and data contained in all publications are solely those of the individual author(s) and contributor(s) and not of MDPI and/or the editor(s). MDPI and/or the editor(s) disclaim responsibility for any injury to people or property resulting from any ideas, methods, instructions or products referred to in the content. |
© 2025 by the authors. Licensee MDPI, Basel, Switzerland. This article is an open access article distributed under the terms and conditions of the Creative Commons Attribution (CC BY) license (https://creativecommons.org/licenses/by/4.0/).