Article

A Novel Dataset for Early Cardiovascular Risk Detection in School Children Using Machine Learning

by
Rafael Alejandro Olivera Solís
1,*,
Emilio Francisco González Rodríguez
1,
Roberto Castañeda Sheissa
2,
Juan Valentín Lorenzo-Ginori
1 and
José García
3,*
1
Electronic and Telecommunications Department, Faculty of Electrical Engineering, “Marta Abreu” Central University of Las Villas, Santa Clara 50100, Cuba
2
Department of Biomedical Engineering, Faculty of Electronic Instrumentation, University of Veracruz, Xalapa 91000, Veracruz, Mexico
3
Aragon Engineering Research Institute (I3A), School of Engineering and Architecture (EINA), University of Zaragoza (UINZAR), 50006 Zaragoza, Spain
*
Authors to whom correspondence should be addressed.
Technologies 2025, 13(6), 222; https://doi.org/10.3390/technologies13060222
Submission received: 8 April 2025 / Revised: 14 May 2025 / Accepted: 27 May 2025 / Published: 29 May 2025

Abstract

:
This study introduces the PROCDEC dataset, a novel collection of 1140 cases with 30 cardiovascular risk factors gathered over a 10-year period from school children in Santa Clara, Cuba. The dataset was curated with input from medical experts in pediatric cardiology, endocrinology, general medicine, and clinical laboratory, ensuring its clinical relevance. We conducted a rigorous performance evaluation of 10 machine learning (ML) algorithms to classify cardiovascular risk into two categories: at risk and not at risk. The models were assessed using a stratified k-fold cross-validation approach to enhance the reliability of the findings. Among the evaluated models—Bayes Net, Naive Bayes, SMO, K-Nearest Neighbors (KNN), Logistic Regression, AdaBoost, Multilayer Perceptron (MLP), J48, Logistic Model Tree (LMT), and Random Forest (RF)—the best-performing classifiers (MLP, LMT, J48 and Logistic Regression) achieved F1-score values exceeding 0.83, indicating strong predictive capability. To improve interpretability, we employed feature selection techniques to rank the most influential risk factors. Key contributors to classification performance included hypertension, hyperreactivity, body mass index (BMI), uric acid, cholesterol, parental hypertension, and sibling dyslipidemia. These findings align with established clinical knowledge and reinforce the potential of ML models for pediatric cardiovascular risk assessment. Unlike previous studies, our research not only evaluates multiple ML techniques but also emphasizes their clinical applicability and interpretability, which are critical for real-world implementation. Future work will focus on validating these models with external datasets and integrating them into decision-support systems for early risk detection.

1. Introduction

Cardiovascular diseases are the leading cause of death worldwide. The use of Artificial Intelligence (AI) techniques to study cardiovascular risk represents a rapidly growing field with broad scientific and practical applications. Understanding the prevalence of cardiovascular risk factors and the elements influencing this phenomenon is a top priority. The integration of AI and machine learning (ML) has become essential in the treatment of cardiovascular diseases today [1,2,3]. The selection of appropriate techniques and algorithms depends on the characteristics of the data processed by the system. Cardiovascular diseases have been a primary focus in the application of these algorithms, with the main objective being to identify patterns in risk factor behavior and determine which algorithms perform best under different dataset conditions.
In [4], the authors propose a tool for detecting cardiovascular diseases using the Random Forest algorithm, achieving an accuracy of 83% in data analysis. The study describes a simple Python-based application model. However, the origin of the data and the dataset used in the paper are not clearly specified.
In [5], cardiovascular diseases are detected using a dataset from the University of California, Irvine, consisting of 303 samples and 76 attributes. Of these attributes, only 13 were considered for the study, acknowledging that the dataset is unbalanced at the initial classification stage. Two classifiers are used: KNN and MLP. Performance metrics derived from the confusion matrix, such as accuracy, recall, F1-score, and ROC, among others, are analyzed. The study concludes that the MLP-based classifier outperforms the KNN classifier, achieving an accuracy of 82.47%.
A comparative analysis of 11 ML algorithms for stroke prediction is performed in [6]. The study uses a Kaggle dataset containing 43,400 cases and 12 attributes, including gender, age, body mass index, cardiovascular disease, and other social factors. Additionally, the research is integrated with the development of a mobile application and a website. Performance metrics derived from the confusion matrix, such as precision, recall, F-measure, and error rate, are analyzed. Finally, the results are compared with those of other studies using datasets with different characteristics. The algorithms achieving the highest accuracy were Random Forest and SVM, with 99.87% and 99.99%, respectively.
In [7], a cardiovascular disease prediction model is proposed based on the analysis of a Kaggle dataset containing 70,000 cases and considering 11 attributes. The model evaluates algorithms such as KNN, Bayes Network, C5.0, Random Forest, and QUEST. Classification is performed using a 70-30 training–testing split. The main contribution of this study lies in clustering the results obtained individually for each algorithm and applying hybrid learning through voting with a simple rule-based algorithm.
The works cited above share a common characteristic: they are based on public datasets related to adults. All of them compare various ML algorithms to establish selection criteria based on the analyzed metrics. Although most studies on cardiovascular disease focus on adults, it is also important to address this challenge from an early age. In [8], a real-case study was conducted involving 516 children aged 4 to 14 years. The primary objective was to identify the appropriate model for predicting mitral regurgitation and mitral stenosis in children with rheumatoid cardiovascular diseases. Attributes such as gender, body mass index, heart size, diabetes, family history, apnea, anemia, and others were considered. Variants of Logistic Regression, neural networks, and Random Forest were used, with performance metrics such as the ROC curve, hit rate, and accuracy being analyzed.
In [9], it is recognized that the early detection of cardiovascular diseases contributes to their prevention and reduction of associated consequences. This comparative study uses data from 1287 school-aged children aged 7 to 13 years. The study proposes a prediction method using classifier clustering, employing decision trees, Naive Bayes, KNN, neural networks, and SVM. The majority voting method with weighted voting is applied. The metrics used include accuracy, recall, and precision. The proposed method achieves an accuracy of 90.31%. Unlike the referenced study, which focuses on hypertension prediction using high-complexity preprocessing and modeling, our work proposes a low-complexity approach for cardiovascular risk prediction using a new real-world dataset. Additionally, our study emphasizes clinical relevance, factor identification, and model validation for decision-making support.
In [10], an ML-based model using the Extreme Gradient Boosting algorithm and 10-fold cross-validation is proposed to predict clinical diagnoses in young patients with hypertension. The sample for analysis consists of 508 cases, with ages ranging from 14 to 39 years. Factors such as age, gender, diabetes, stroke, body mass index, and clinical laboratory tests (e.g., uric acid, creatinine, hemoglobin, and cholesterol) were analyzed. Various clinical pathologies characteristic of cardiovascular disease were also considered. This model was compared with traditional Cox regression models and the recalibrated Framingham equation. The data collection period was approximately 3 years. Additionally, two new predictors were introduced: mean arterial oxygen saturation and big endothelin-1.
In the studies analyzed above, the general trend is to use ML models to predict diagnoses related to cardiovascular disease, based on the assumption that the individual has a medical condition. The datasets used for these purposes do not exceed 2000 cases, and the number of factors considered ranges between 8 and 14 after preprocessing and data cleaning. The datasets are unbalanced and contain missing data and anomalous cases, necessitating the application of data manipulation techniques to improve the performance of the algorithms used.
The issue of data sourcing for ML model building remains an ongoing challenge. Currently, public data sources are limited. In the previously referenced studies [5,8,9,10], the data sources are either proprietary or derived from studies conducted at medical centers, with some authors reserving the right to share such data. For studies similar to the one presented in this paper, datasets with a limited number of cases are typically used. In most cases, a long period of time is required to assemble these datasets.
Other works use public datasets [11,12,13], which are focused on building models or measuring classifier performance under certain circumstances controlled by the authors. In [14], a classification model is built based on the combined analysis of three datasets using decision trees, with the largest dataset not exceeding 4000 cases. The factors considered are the classic ones for this type of disease, and the aim is to maximize the accuracy of the model in comparison to other models or similar studies.
The primary objective of this study is to compare various machine learning (ML) algorithms using a novel dataset, thereby contributing to the prediction of cardiovascular risk in pediatric populations. It is important to note that the individuals appearing in the dataset are healthy, which gives the study a unique importance. The goal is to identify possible diagnoses based on the prediction made. The key contributions of this research are summarized as follows:
  • The introduction of a new dataset focused on pediatric populations, incorporating novel markers, which distinguishes it from other datasets related to cardiovascular risk.
  • A comprehensive benchmark study evaluating different ML techniques applied to the PROCDEC dataset, aimed at identifying the best-performing algorithms in terms of cardiovascular risk classification and execution time.
  • A thorough study of the most relevant indicators for risk classification through the application of different feature selection methods.
The remainder of the paper is structured as follows: Section 2 provides a description of the main materials and methods used in this work, including a detailed overview of the dataset and the machine learning techniques applied. Section 3 outlines the methodology used for cardiovascular risk classification, considering different approaches to the problem. The performance results of the ML techniques and their discussion are presented in Section 4. The strengths and limitations of the study are discussed in Section 5, and finally, the conclusions are summarized in Section 6.

2. Materials and Methods

2.1. Description of the PROCDEC Dataset and Exploratory Data Analysis

The dataset used in this study was collected over 10 years (2012–2022) in Santa Clara (Cuba) as part of the PROCDEC project (Community Projection of Cardiovascular Diseases). The PROCDEC experimental protocol complies with the statutes described in the Declaration of Helsinki and was approved by the National Coordinating Centre for Clinical Trials (CENCEC) and the Center for State Control of Medicines, Medical Equipment and Devices (CECMED) from Cuba. For the development of this study, informed consent was obtained from parents and/or legal guardians of minors with all guarantees of confidentiality and data security. The dataset consists of 1140 real cases involving individuals aged 8 to 14 years (mean = 9.74, standard deviation = 1.22). For each individual, 30 attributes were collected, representing the markers or risk factors, as detailed in Table 1. Throughout the study period, the PROCDEC project quantified cardiovascular risk based on criteria established by a panel of medical experts from various specialties, including pediatric cardiology, endocrinology, general medicine, and clinical laboratory sciences. All project members continuously updated the markers and their respective weights over the course of the study. The final diagnosis was determined by the characteristics of each marker in individual cases, resulting in a class attribute that indicates the level of cardiovascular risk. The final risk classification includes 802 cases categorized as “no risk” and 338 cases classified as “at risk”. It is important to emphasize that the initial diagnoses made by specialists were empirical, relying solely on clinical judgment. The dataset includes 10 attributes specific to the minors and 20 attributes related to family members’ factors. A distinctive aspect of this dataset is its focus on pediatric populations and the inclusion of new markers, which represents a novel aspect compared to other cardiovascular risk datasets.
The PROCDEC dataset comprises 575 female (50.44%) and 565 male participants (49.56%). Body mass index (BMI) values were calculated using percentile tables appropriate for pediatric ages, based on each individual’s height and weight [15,16]. These values differ from BMI calculations for adults. Notably, the specific BMI values based on height and weight were omitted from the study. The analysis revealed that 66.3% of the subjects fall within the normal weight or thin category (n = 756), 17.8% are classified as overweight (n = 203), and 15.8% as obese (n = 181). The Sustained Weight Test (SWT), a novel marker for minors, provides insight into cardiovascular hyperreactivity [17,18,19] and is considered a significant factor associated with the onset of hypertension in childhood and adulthood. Among the cases, 44.65% were normo-reactive (n = 509) and 55.35% were hyper-reactive (n = 631). The mean glycemia value is 4.346 with a standard deviation of 0.838, though 13% of this attribute’s data are missing (n = 146). Uric acid levels have a mean of 252.9 with a standard deviation of 84.9, with 39% missing values (n = 440). Cholesterol levels average 3.97 with a standard deviation of 0.92, with 13% missing data (n = 143). Triglycerides show a mean value of 1.092 and a standard deviation of 0.46, with 14% missing data (n = 165). Blood pressure data indicate that 67.6% of cases are normotensive (n = 771), 25.1% are pre-hypertensive (n = 286), 5.6% are grade 1 hypertensive (n = 64), and 1.7% are grade 2 hypertensive (n = 19). Factors associated with Family Pathological History (FPH) are detailed in Table 2.

2.2. Machine Learning Techniques for Classification

The ML techniques used in the cardiovascular risk classification of school children are described here in more detail. For this study, a comparative analysis was conducted using several ML algorithms [20], including Bayes Net, Naive Bayes, Sequential Minimal Optimization (SMO), Random Forest (RF), Logistic Model Tree (LMT), K-Nearest Neighbors (KNN), J48, Logistic Regression, Multilayer Perceptron (MLP), and AdaBoost (AB). Below is a concise description of each technique.
  • Bayes Net
A Bayesian network is a graphical model that encodes probabilistic relationships among variables of interest [21,22]. When combined with statistical techniques, this model offers several advantages for data analysis. Because it efficiently encodes dependencies among all variables, it handles missing data entries. It can be used to learn causal relationships and thus to understand the domain of a problem and predict the consequences of interventions [22]. Bayesian networks are used as classifiers by estimating the probability of different outcomes based on the relationships between variables.
  • Naive Bayes
This is a simple and powerful probabilistic classifier based on Bayes’ Theorem [21,23]. It is called “naive” because it makes a strong assumption: all features are independent of each other, given the class. This assumption rarely holds in real-world data, but Naive Bayes sometimes performs surprisingly well despite this simplification.
  • Sequential Minimal Optimization (SMO)
The Sequential Minimal Optimization algorithm uses John Platt’s algorithm to train a Support Vector Machine (SVM), which is a powerful classifier in machine learning [24]. SVMs are supervised learning models that find the optimal hyperplane to separate data into different classes. SMO is specifically designed to solve the optimization problem involved in training an SVM efficiently.
  • Random Forest (RF)
This technique is an ensemble learning method that combines multiple decision trees to enhance classification accuracy and robustness [21,25]. It is a widely used and powerful classifier, particularly effective for both classification and regression tasks. The trees generated by this algorithm consider a specific number of random features at each node and are not subject to pruning. The algorithm operates by performing random tests on numerous models, allowing the combination of hundreds of decision trees, each trained on a different subset of cases. The final predictions of the random forest are generated by averaging the predictions of each individual tree. Random forests help mitigate overfitting, which is common in individual decision trees.
  • Logistic Model Tree (LMT)
The LMT is a hybrid machine learning algorithm that combines the strengths of decision trees and Logistic Regression [26]. It builds a decision tree where each leaf node contains a Logistic Regression model. LMT is effective in modeling non-linear relationships and provides probability estimates, making it useful for both classification and regression tasks. The algorithm can handle binary and multiclass target variables, numerical and nominal attributes, and missing values.
  • K-Nearest Neighbors (KNN)
KNN is a simple, instance-based learning algorithm used for classification and regression tasks [21,27]. The KNN method classifies a case based on the classes of the k most similar training cases. It is a non-parametric classification method that estimates the probability density function or, directly, the posterior probability of a case belonging to a class, using information from the classified case set.
  • J48
This is an implementation of the C4.5 algorithm, which is one of the most popular decision tree algorithms for classification tasks [28]. It is based on generating a decision tree through recursive partitioning of the data. The process involves selecting an attribute as the root of the tree and creating a branch for each possible value of that attribute. Within each resulting branch, a new node is established, and the process is repeated by selecting another attribute and generating new branches for each possible value of that attribute.
  • Logistic Regression
It is a statistical model used for binary classification tasks, although it can be extended to multiclass problems [21,29]. Despite its name, Logistic Regression is a classification algorithm, not a regression algorithm. It models the relationship between a set of input features and a binary outcome. It is used to predict the probabilities of various potential outcomes within a categorical distribution, where the dependent variable is the class, based on a set of independent variables or attributes.
  • Multilayer Perceptron (MLP)
MLP is a type of artificial neural network that is widely used for both classification and regression tasks [21,30]. It is a feedforward neural network, meaning that data move in one direction (from input to output), and it consists of multiple layers of neurons. The network comprises an input layer where attribute values are entered, one or more hidden layers connected to all input nodes, and an output layer where the classification values are determined based on their respective classes. MLP is particularly known for its ability to learn complex, non-linear relationships in data.
  • AdaBoost (AB)
AdaBoost is an ensemble learning method used primarily for classification, although it can also be adapted for regression tasks [31]. It is a boosting algorithm that combines the predictions of several weak learners (typically decision trees with a single split) to create a strong non-linear classifier. AdaBoost is particularly effective for classification tasks and tends to be less prone to overfitting compared to other ensemble methods.

2.3. Performance Indicators

After presenting the fundamentals of classification techniques, the key indicators for evaluating the performance of classifiers are introduced [21]. The confusion matrix provides a summary of the number of instances correctly or incorrectly classified. The components of the classification are defined as follows: true positives (TP) represent the number of “at risk” instances correctly classified; true negatives (TN) indicate the number of “no risk” instances correctly classified; false positives (FP) denote the number of “no risk” instances misclassified as “at risk”; and false negatives (FN) refer to the number of “at risk” instances misclassified as “no risk”. Based on these elements, the following performance indicators can be derived [20]:
  • Accuracy: Defined as the ratio of correctly classified instances to the total number of instances. Its complement, 1-Accuracy, represents the error rate. Accuracy is commonly used to evaluate the effectiveness of classification algorithms and is also referred to as the classification rate (CR). However, in highly imbalanced domains, accuracy may be misleading. In such cases, it is necessary to rely on alternative metrics, such as recall and precision, to provide a more accurate assessment of the model’s performance.
A c c u r a c y = T P + T N T P + T N + F P + F N
  • Recall or True Positive Rate (TPR): Represents the probability that an “at risk” instance is correctly identified by the classifier. It is also referred to as the detection rate (DR) or sensitivity.
T P R = T P T P + F N
  • Precision: Represents the ratio of “at risk” instances to all instances classified as “at risk”. It is a measure of the estimated probability of a correct positive prediction and is also known as the Positive Predictive Value (PPV). While precision measures the frequency of true positives (“at risk”) among all instances classified as positive by the classifier, recall measures the frequency of true positives (“at risk”) among all actual positive instances in the dataset.
P r e c i s i o n = T P T P + F P
  • Negative Predictive Value (NPV): Represents the ratio of “no risk” instances to all instances classified as “no risk”. This metric was selected with the aim of minimizing the number of false negatives. False negatives could lead to situations where individuals do not receive necessary treatment because their true condition is overlooked in the classification process. This, in turn, poses a risk to those incorrectly classified as “no risk”. The reasoning above suggests that a high NPV value serves as a strong indicator of confidence in cardiovascular risk prediction.
N P V = T N T N + F N
  • F-Measure or F1-Score: Combines precision and recall in a single weighted indicator. When equal weight is assigned to both precision and recall, the F-measure is referred to as the F1-score. This metric reflects the reliability of the algorithm for each classification model. It is essential for the algorithm to accurately identify individuals at risk to achieve the highest possible F1-score.
F 1 = 2   T P 2   T P + F P + F N = 2 p r e c i s i o n · c a l l p r e c i s i o n + r e c a l l
Several validation methods are available to obtain the metrics and performance indicators described. The simplest technique is known as simple validation or training-testing, where the model is created using the training set and applied to the testing set. Alternatively, in the n-fold cross-validation technique, the dataset is divided into n disjoint subsets of equal size. The model is then trained on n − 1 folds and tested on the remaining fold. This process is repeated for all combinations, resulting in averaged performance metrics.
WEKA (Waikato Environment for Knowledge Analysis) [32,33] version 3.8.6 was selected for the application of ML techniques. This platform is recognized for its user-friendly interface and a broad array of machine learning algorithms available to users. For data processing and algorithm execution, a standard-performance personal computer was utilized, equipped with an Intel Core i5 processor (2.7 GHz) and 4 GB of RAM (1600 MHz).

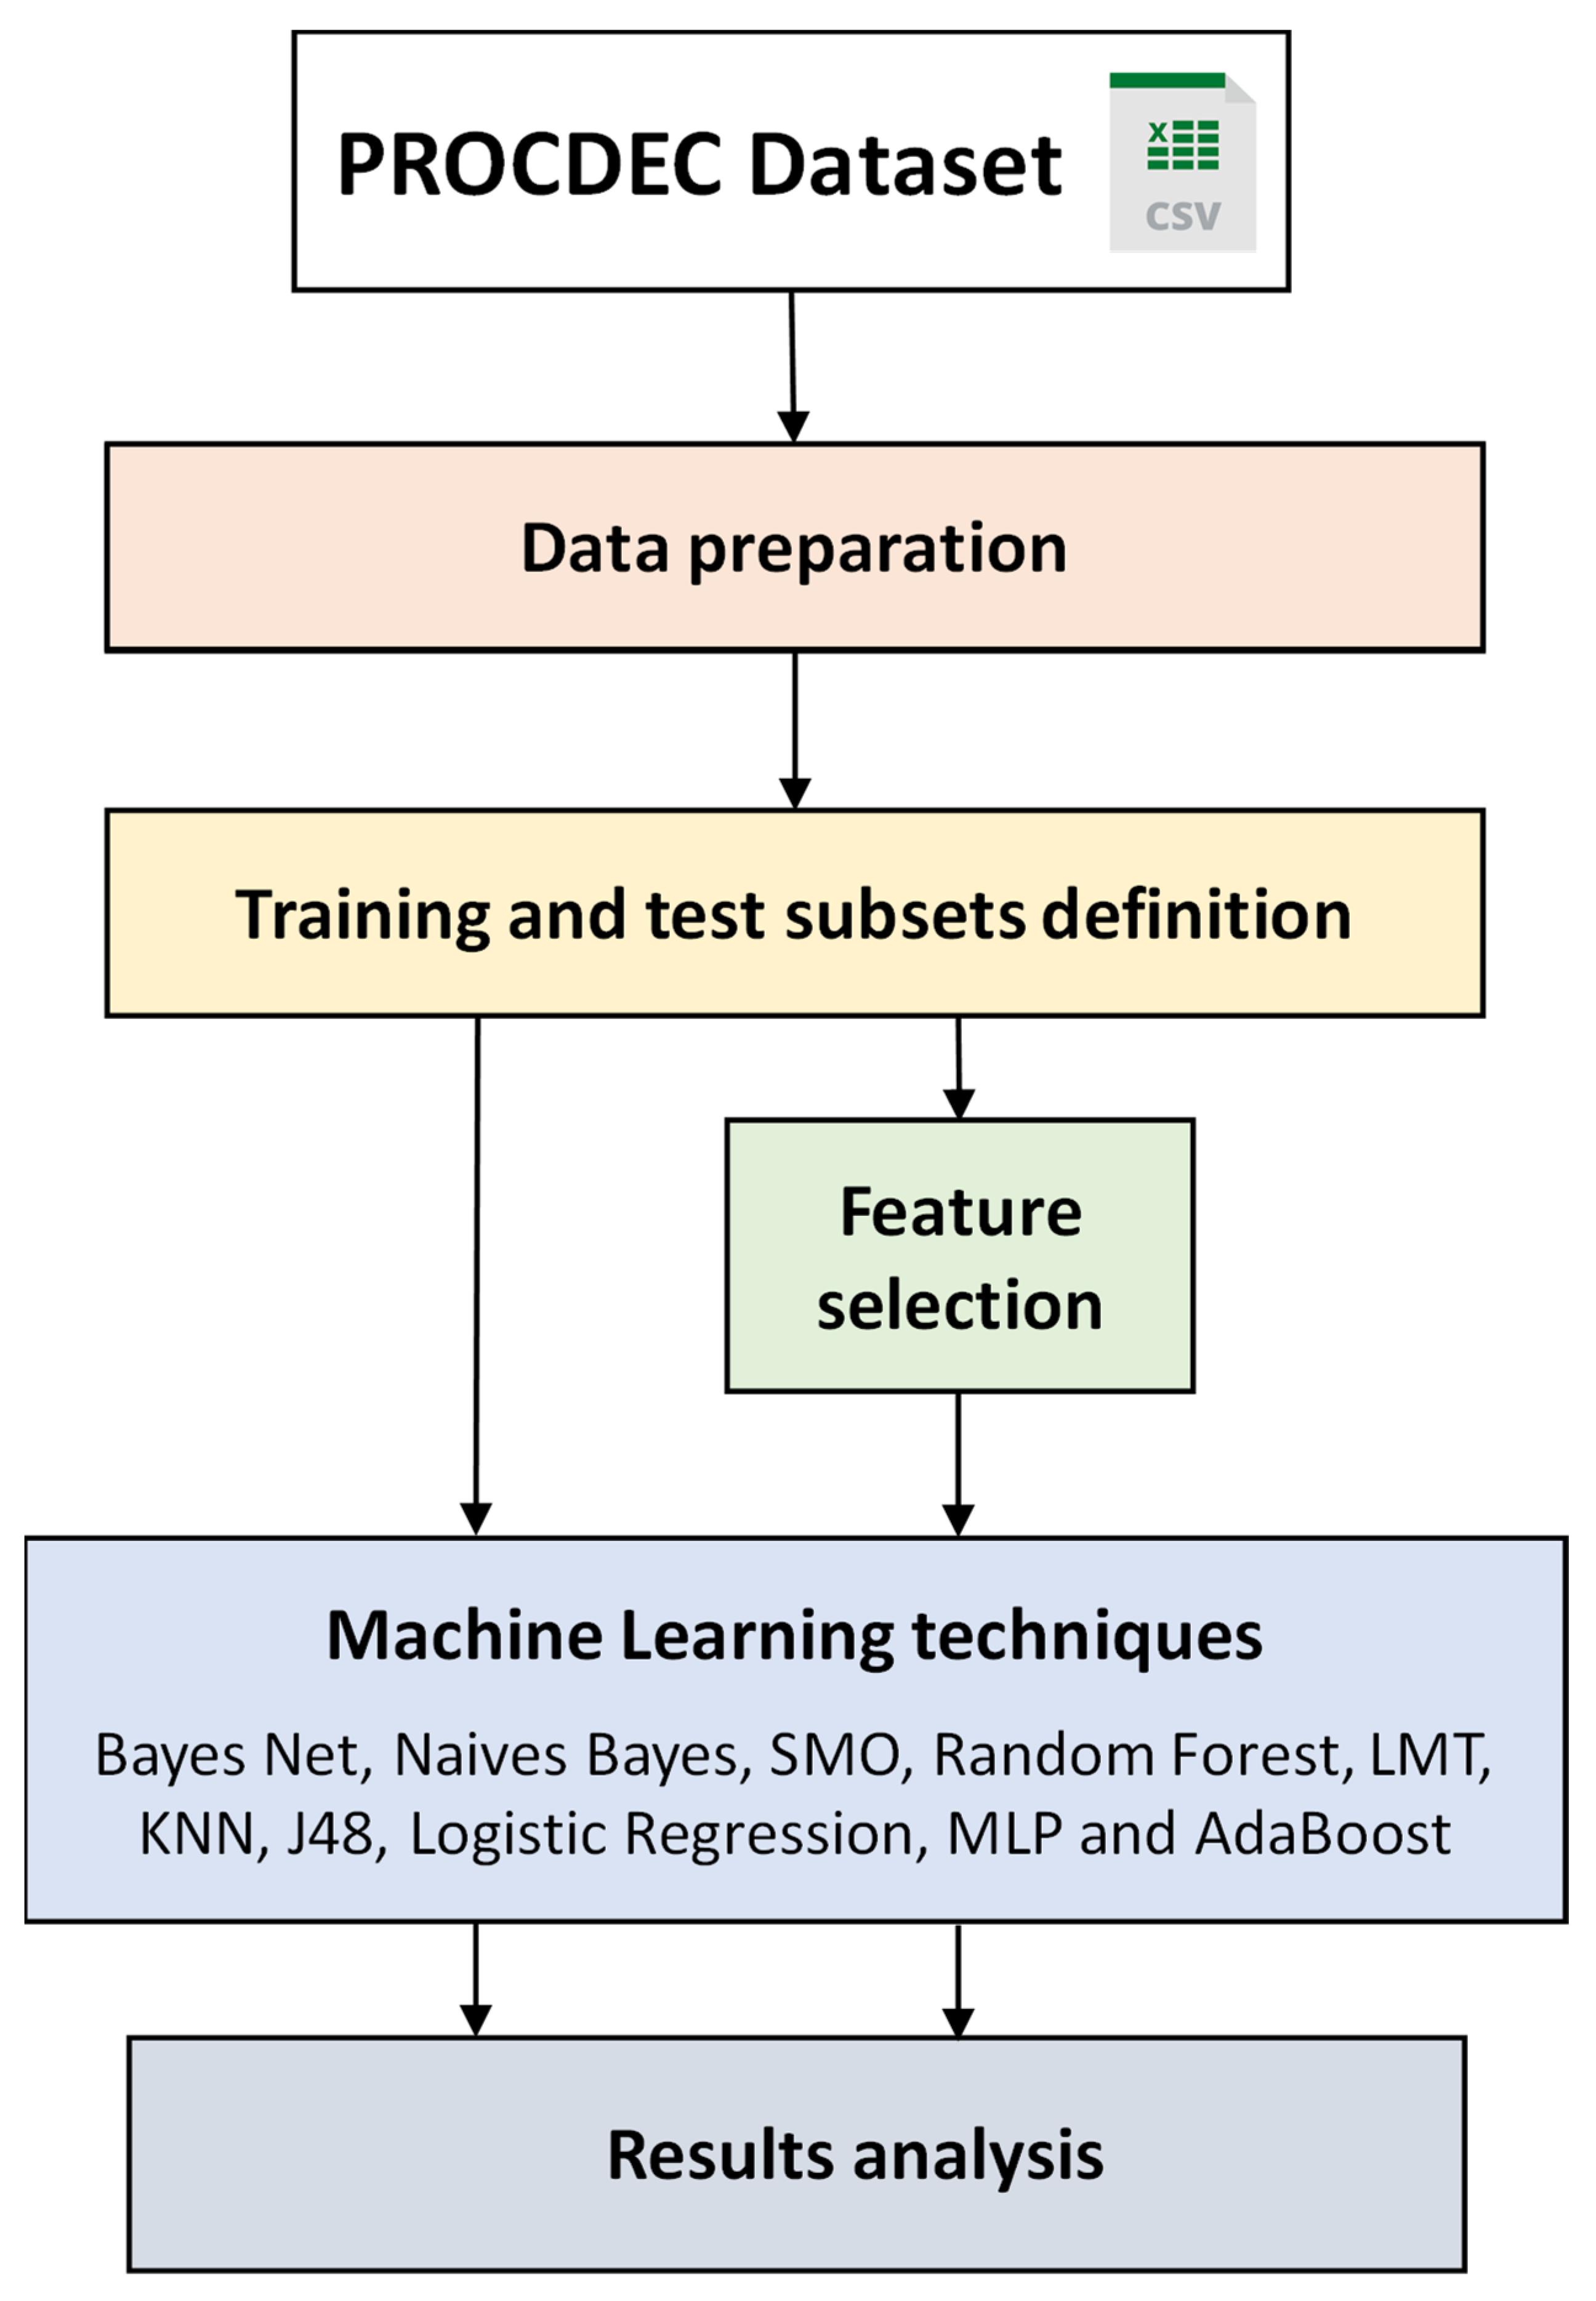
3. Methodology for Cardiovascular Risk Classification

The overall methodology used for cardiovascular risk classification among the individuals in the dataset described earlier is depicted in Figure 1. This methodology includes several key phases: data preparation, the division of data into training and testing sets, the application of feature selection techniques, and the deployment of machine learning algorithms.

3.1. Data Preparation

This phase involves preparing the data recorded in the PROCDEC dataset for its subsequent use by the ML algorithms. The dataset comprises both numerical and nominal attributes, which restricts the selection of algorithms to those capable of processing these data types without substantial alteration. It is important to note that not all attributes have complete data coverage for each case, as there are missing values.

3.2. Training and Test Subsets Definition

A supervised learning classification algorithm seeks to extract knowledge from a dataset (training set) and model for application in decision-making on a new dataset (test set). In this study, the 10-fold cross-validation technique was employed for model validation.

3.3. Feature Selection

A preliminary selection of the most relevant attributes can be conducted before applying machine learning (ML) techniques. Feature selection (FS) is a well-established approach for managing the dimensionality problem [34,35,36]. Filter Feature Ranking (FFR) methods assess and rank features based on the properties of the dataset. Attributes are selected independently of the learning algorithm employed in the subsequent classification. Some common FFR methods include information gain, gain ratio attribute, correlation, etc. In Filter-Feature Subset Selection (FSS) methods, features are evaluated and ranked by a search method that acts as the subset evaluator. These search methods generate and evaluate features according to their contribution to improved prediction performance. One of the most widely used FSS techniques is Correlation-Based Feature Subset Selection (CFS) [37]. Conversely, Wrapper-Based Feature Selection (WFS) methods utilize a classifier to determine the suitability of attribute subsets, identifying the most significant attributes for that particular classifier [38]. In WFS, the classifier is predefined, and the resulting feature subsets are typically biased towards the base classifier employed for evaluation [39]. In this work, we have compared various FS techniques from distinct categories, namely FFR, FSS, and WFS, to determine whether significant differences exist among the attributes identified as the most relevant for cardiovascular risk classification.
The Weka parameter settings of the implemented FS method in this work were the following:
  • Attribute evaluator: CfsSubsetEval (locally-Predictive = True; missing-Separate = False; precompute Correlation-Matrix = False)
  • Search method: best first (lookupCach-eSize = 1; direction = Forward; search-Termination = 5).

3.4. ML Techniques

Each classifier—Bayes Net, Naive Bayes, Logistic Regression, Multilayer Perceptron (MLP), Sequential Minimal Optimization (SMO), K-Nearest Neighbors (KNN), J48, Logistic Model Tree (LMT), Random Forest (RF), and AdaBoost (AB)—was independently applied to the PROCDEC dataset. The selection of these classifiers aimed to ensure a comprehensive comparison, aligning with the methodologies of previous research studies [refs]. The Weka parameter settings for the ML methods implemented in this study were as follows:
  • Naive Bayes: Num-Decimal-Places = 2; use-Kernel-Estimator = False.
  • Bayes Net: Estimator = Simple-Estimator-A 0.5; Num-Decimal-Places = 2; search-algorithm = K2-P1-SBAYES.
  • Logistic: num-Decimal-Places = 4; ridge = 1.0 × 10⁻⁸; do-Not-Standardize-Attributes = False.
  • Multilayer Perceptron: hidden-Layers = 1; learning-Rate = 0.3; validation-Threshold = 20; training-Time = 300 epochs.
  • SMO: complexity-parameter-C = 1.0; Kernel = Poly-Kernel; calibrator = Logistic.
  • Ibk: Num-Decimal-Places = 2; KNN = 1; nearest-Neighbour-Search-Algorithm = LinearNNSearch.
  • AB: classifier = Decision-Stump; num-Iterations = 10; weight-Threshold = 100.
  • J48: confidence-Factor = 0.25; num-Folds = 3; min-Num-Obj = 2; use-MDL-correction = True.
  • LMT: Fast-Regression = True; min-Num-Instances= 15; Num-Decimal-Places = 2; num-Boosting-Iterations = −1; split-On-Residuals = False.
  • Random Forest: num-Iterations = 100; max-Depth = un-limited; bag-Size-Percent = 100; num-Features = int(log_2(#predictors) + 1).

4. Results and Discussion

This section provides an overview of the experimental results obtained for risk classification, both using the complete set of risk factors and using a reduced subset of them.

4.1. Classification Results Using All the Attributes

The performance results obtained from applying the selected ML techniques to the risk classification using the 30 available features are summarized in Table 3. Overall, F1 scores and other metrics indicate that ML methods achieved high classification rates for most algorithms, with F1 scores above 0.83, reflecting appropriate values for precision and recall. The exceptions are Naive Bayes and RF, with F1 scores below 0.8. A closer examination of the results highlights that MLP, SMO, and LMT algorithms stand out, with accuracy values above 0.90. Logistic Regression and J48 also demonstrated high F1-score values in accurately identifying individuals at risk. The Negative Predictive Value (NPV) is particularly relevant, as accurately identifying both at-risk and not-at-risk individuals is crucial for diagnostic reliability. The highest NPV values were recorded for MLP, J48, and Logistic Regression, with LMT following closely. These findings largely correspond with the high F1-scores observed.
Table 4 presents the computational complexity analysis of the ML techniques. In most cases, execution times did not exceed 20 s, except for the KNN algorithm applied to the dataset, which took approximately 30 min to complete. The execution times for building the ML models were always longer than those for applying the models to testing, and were usually negligible—except in the case of instance-based learning classifiers such as KNN, where the learning phase is simpler and the classification phase is the most time-consuming.
While the algorithms may initially appear to produce similar results, a deeper analysis is necessary to understand their differences. For instance, examining the confusion matrices can highlight distinct classification behaviors among the ML techniques. As an example, Table 5 and Table 6 present the confusion matrices obtained using the J48 and Random Forest (RF) techniques, respectively. The RF technique generates significantly more false negatives (115 compared to 56) due to its tendency to preserve class balance, given the larger size of the no-risk group. In contrast, J48 demonstrates a more balanced classification behavior, resulting in a lower number of false negatives. These results demonstrate that achieving similar high F1-scores can be influenced by prioritizing the optimization of either false positives (FP) or false negatives (FN). Depending on the specific requirements of the classification task, certain algorithms may exhibit more suitable behavior than others, with some favoring the minimization of false positives, while others focus on reducing false negatives. Therefore, understanding the underlying trade-offs between these metrics is essential for selecting the most appropriate machine learning algorithm for a given application.

4.2. Analysis of Attribute Relevance

The purpose of applying FS techniques is to identify a reduced set of attributes with high predictive capacity, enabling the construction of an optimized prediction model that delivers performance levels comparable to those achieved using the full set of attributes. These methods help identify the most relevant features that contribute to accurate classification, allowing for more efficient and interpretable models.
As described in the previous section, FFR methods evaluate and rank features based on the inherent properties of the dataset. For instance, when applying the gain ratio feature evaluator, which determines an attribute’s significance by calculating the gain ratio in relation to the class, a ranking of attributes is generated, as shown in Table 7. Similarly, when using the information gain ranking filter, which ranks attributes based on their individual evaluations, the top 10 attributes selected are detailed in Table 8. In both cases, nearly identical features (and in a very similar order) were identified as the most significant: HTA (individual), hyperreactivity, real BMI, dyslipidemia (sibling), cholesterol, obesity (mother), obesity (father), triglycerides, age, glucose, and uric acid. It is also noteworthy that attributes related to diabetes (in family members), dyslipidemia (in family members), sex, and physical activity were among the least relevant for cardiovascular risk classification in the study group.
Alternatively, if the goal is not to assess the predictive capability of individual attributes but rather to determine the most effective subsets of attributes for optimal classification, other feature selection methods should be considered. The Correlation-based Feature Selection (CFS) method, a type of FSS technique, evaluates the value of an attribute subset by considering both the individual predictive power of each attribute and the degree of redundancy among them (i.e., removing highly correlated features). The CFS method identified a subset consisting of the following eight attributes as the most relevant: real BMI, hyperreactivity, uric acid, cholesterol, hypertension (individual), hypertension (father), obesity (mother), and dyslipidemia (sibling). Using these eight attributes, the classification outcomes presented in Table 9 and Table 10 were achieved. In terms of the F1-score, MLP, SMO, and LMT algorithms demonstrate consistency with the results obtained using the same model with 30 risk factors. In fact, MLP even slightly improved its performance when the number of attributes used for classification was reduced (F1 > 0.85, accuracy = 0.912, NPV = 0.937), highlighting the benefits of employing FS methods to eliminate parameters that may negatively impact classification. In terms of execution times, a reduction was achieved when the number of attributes was decreased, demonstrating the efficiency gained through feature selection in streamlining the classification process.
Finally, to identify the optimal subset of factors for a specific classification scheme, a Wrapper-Based Feature Selection (WFS) method was employed. In contrast to previous FS methods, Wrapper-Based Feature Selection methods employ a classifier to determine the adequacy of an attribute subset, returning the most significant attributes for that classifier. This method evaluates attribute subsets by applying a specific ML algorithm and uses cross-validation to estimate the algorithm’s accuracy for each attribute subset. In this study, following several simulations involving WFS, the top-performing algorithms were Logistic Regression, MLP, and LMT. The attributes most frequently selected by these algorithms after applying WFS included real BMI, hyperreactivity, uric acid, cholesterol, hypertension (individual), and hypertension (father), showing a high level of coincidence with previous FS methods. When the derived WFS attribute subsets were considered, the Logistic Regression algorithm achieved an F1-score of 0.837 and an NPV of 0.923 (see Table 11). For the LMT algorithm, the F1-score with the selected attributes was 0.836, while the NPV reached 0.925. In contrast, the MLP algorithm did not demonstrate any improvement over the CFS method, maintaining the same values for both F1-score and NPV.
In summary, the FS study revealed that there were no significant differences in the performance metrics of the algorithms when applying feature selection (FS) methods compared to using the full set of features. This is actually a very promising result, as it demonstrates that comparable classification performance can be achieved with a reduced set of attributes (e.g., using only 8 attributes) instead of all 30.

5. Strengths and Limitations of the Study

This study has several noteworthy strengths. First, the dataset comprises real-world data collected over a 10-year period from school-aged children (8–14 years old). Furthermore, this study addresses a gap in Cuba and potentially the broader Latin American region, as there are no comparable datasets or studies focused on pediatric individuals in this context. Although traditional risk factors were employed, the study includes notable innovations. The dataset reflects the expertise of a multidisciplinary team comprising medical specialists (e.g., four cardiologists with a second degree in cardiology, three pediatric cardiologists, two endocrinologists, two clinical laboratory specialists, and two ophthalmologists), engineers, primary school educators, and faculty from the University of Medical Sciences. The risk factors were updated and validated annually by this team, ensuring they remain accurate and relevant. Furthermore, the Cardiovascular Risk Scoring System for Minors used in this dataset has been officially endorsed by the Provincial Health Directorate and the Technical Advisory Commission for Hypertension (HTA) of the Ministry of Public Health.
The study has demonstrated that high scores for risk classification can be achieved with certain ML algorithms analyzed. Moreover, it highlights that the selection of a specific ML technique allows prioritizing trade-offs, such as emphasizing the Negative Predictive Value or other performance metrics, based on the desired objectives.
Considering the results obtained across different approaches to feature selection, it can be concluded that, in general, all FS methods produced relatively consistent selections of the most significant attributes. Among these, the use of correlation-based feature selection appears particularly suitable for this type of system. Unlike methods that rank attributes individually based solely on their discriminatory power, CFS identifies the optimal subset of attributes by evaluating their combined effectiveness while accounting for correlations and redundancy. On the other hand, the high computational cost associated with WFS methods, coupled with their tendency to overfit the dataset, renders them less appropriate for practical applications in this context. In any case, it would be desirable in the future to have more instances in the dataset to corroborate these findings, which is highly costly due to the difficulty of obtaining these data.
The study also may have certain limitations. Firstly, missing data due to the absence of information for certain attributes was observed in some cases. To assess its impact, simple value imputation techniques were tested; however, the performance of the ML algorithms did not improve in most cases, likely due to alterations in the statistical structure of the data. Fortunately, the selected algorithms are capable of handling missing data without difficulty and represent a broad sample of available algorithm families. Furthermore, the dataset spans a decade and represents linear rather than cross-sectional data, which precludes the possibility of performing a longitudinal analysis of the individuals initially included in the study. Ideally, it would be highly valuable to track the evolution of the children included in the dataset throughout their lives. This would allow for confirmation of the emergence or absence of new cardiovascular risk factors and even the development of long-term conditions, providing deeper insights into the progression and prevention of cardiovascular diseases.

6. Conclusions

This study analyzes real cases involving children, making it highly significant due to the scarcity of similar datasets. The application of ML algorithms revealed that the MLP and LMT algorithms achieved the highest F1-scores, with values of 0.852 and 0.837, respectively. For NPV, the best-performing algorithms were MLP (0.937) and J48 (0.931). The optimization of attributes identified those with the most significant individual impact on classification, as well as the most effective subsets for high-performing classification schemes. Attributes such as hypertension (individual), hyperreactivity, BMI, uric acid, cholesterol, hypertension (parent), and dyslipidemia (sibling) were determined to be highly relevant and decisive. These factors provided robust results, with no loss of performance and even slight improvements in classification schemes such as MLP and LMT. Notably, no significant degradation in algorithm performance was observed when employing optimized subsets of attributes, reinforcing their suitability for future predictive models. Building upon these findings, future work will aim to identify the factors with the greatest impact on risk classification, extending the analysis to larger populations. This will involve validating the risk labels assigned by experts through the application of the top-performing algorithms identified in this study.

Author Contributions

Conceptualization, R.A.O.S., J.V.L.-G. and J.G.; Data curation, R.A.O.S., R.C.S. and J.G.; Formal analysis, R.A.O.S. and J.G.; Investigation, R.A.O.S., E.F.G.R. and J.G.; Methodology, R.A.O.S., J.V.L.-G. and J.G.; Project administration, E.F.G.R.; Resources, E.F.G.R. and R.C.S.; Software, R.A.O.S., R.C.S. and J.G.; Supervision, E.F.G.R. and J.G.; Validation, R.A.O.S. and J.G.; Visualization, R.A.O.S., E.F.G.R., J.V.L.-G. and J.G.; Writing—original draft, R.A.O.S.; Writing—review and editing, E.F.G.R., R.C.S., J.V.L.-G. and J.G. All authors have read and agreed to the published version of the manuscript.

Funding

This research was partially supported by Grant PID2022-136476OB-I00 funded by MICIU/AEI/10.13039/501100011033/FEDER EU, ERDF/EU, and Gobierno de Aragón (reference group T31_20R).

Institutional Review Board Statement

According to Resolution 435 of the Ministry of Public Health, the institutions that regulate clinical studies and trials—National Coordinating Centre for Clinical Trials (CENCEC) and Center for State Control of Medicines, Medical Equipment and Devices (CECMED)—are identified, which comply with the statutes described in the Declaration of Helsinki.

Informed Consent Statement

For the development of this study, informed consent was obtained from parents and/or legal guardians of minors with all guarantees of confidentiality and data security.

Data Availability Statement

The dataset collected in this study will be made available upon request to the first author (Rafael Alejandro Olivera Solís).

Acknowledgments

Special thanks are due to the specialists from various branches of science who have contributed to the compilation of the data analyzed. Thanks are due to the team of authors who contributed their experiences to this work. Thanks are due to the health and education institutions of the city of Santa Clara, who made it possible to carry out the study described.

Conflicts of Interest

The authors declare no conflicts of interest.

Abbreviations

The following abbreviations are used in this manuscript:
ABAdaBoost
BMIBody mass index
CFSCorrelation-Based Feature Subset Selection
F1F1-score
FNFalse negatives
FPFalse positives
FPHFamily Pathological History
FSFeature selection
FFRFilter Feature Ranking
FSSFilter-Feature Subset Selection
KNNK-Nearest Neighbors
HTAHypertension
LMTLogistic Model Tree
MLMachine learning
MLPMultilayer Perceptron
NPVNegative Predictive Value
PPVPositive Predictive Value
RFRandom Forest
SMOSequential Minimal Optimization
SWTSustained Weight Test
TNTrue negatives
TPTrue positives
TPRTrue Positive Rate
WEKAWaikato Environment for Knowledge Analysis
WFSWrapper-Based Feature Selection

References

  1. Naser, M.A.; Majeed, A.A.; Alsabah, M.; Al-Shaikhli, T.R.; Kaky, K.M. A Review of Machine Learning’s Role in Cardiovascular Disease Prediction: Recent Advances and Future Challenges. Algorithms 2024, 17, 78. [Google Scholar] [CrossRef]
  2. Singh, S.; Tiwari, S.; Singh, P. Machine learning algorithms in cardiovascular disease prediction: A systematic literature review. Pharma Innov. 2019, 8, 05–08. [Google Scholar] [CrossRef]
  3. Castel-Feced, S.; Malo, S.; Aguilar-Palacio, I.; Feja-Solana, C.; Casasnovas, J.A.; Maldonado, L.; Rabanaque-Hernández, M.J. Influence of cardiovascular risk factors and treatment exposure on cardiovascular event incidence: Assessment using machine learning algorithms. PLoS ONE 2023, 18, e0293759. [Google Scholar] [CrossRef]
  4. Chang, V.; Bhavani, V.R.; Xu, A.Q.; Hossain, M. An artificial intelligence model for heart disease detection using machine learning algorithms. Health Anal. 2022, 2, 100016. [Google Scholar] [CrossRef]
  5. Pal, M.; Parija, S.; Panda, G.; Dhama, K.; Mohapatra, R.K. Risk prediction of cardiovascular disease using machine learning classifiers. Open Med. 2022, 17, 1100–1113. [Google Scholar] [CrossRef]
  6. Biswas, N.; Uddin, K.M.M.; Rikta, S.T.; Dey, S.K. A comparative analysis of machine learning classifiers for stroke prediction: A predictive analytics approach. Health Anal. 2022, 2, 100116. [Google Scholar] [CrossRef]
  7. Dalal, S.; Goel, P.; Onyema, E.M.; Alharbi, A.; Mahmoud, A.; Algarni, M.A.; Awal, H. Application of Machine Learning for Cardiovascular Disease Risk Prediction. Comput. Intell. Neurosci. 2023, 2023, 9418666. [Google Scholar] [CrossRef]
  8. Shahid, S.; Khurram, H.; Billah, B.; Akbar, A.; Shehzad, M.A.; Shabbir, M.F. Machine learning methods for predicting major types of rheumatic heart diseases in children of Southern Punjab, Pakistan. Front. Cardiovasc. Med. 2022, 9, 996225. [Google Scholar] [CrossRef]
  9. Besharati, R.; Tahmasbi, H. Hypertension Prediction in Primary School Students Using an Ensemble Machine Learning Method. J. Health Biomed. Inform. 2022, 9, 148–157. [Google Scholar] [CrossRef]
  10. Wu, X.; Yuan, X.; Wang, W.; Liu, K.; Qin, Y.; Sun, X.; Ma, W.; Zou, Y.; Zhang, H.; Zhou, X.; et al. Value of a Machine Learning Approach for Predicting Clinical Outcomes in Young Patients With Hypertension. Hypertension 2020, 75, 1271–1278. [Google Scholar] [CrossRef] [PubMed]
  11. Cardiovascular Disease Dataset. Available online: https://www.kaggle.com/datasets/sulianova/cardiovascular-disease-dataset (accessed on 6 February 2025).
  12. Halder, R.K.H. Cardiovascular Disease Dataset. IEEE, 10 November 2020. Available online: https://ieee-dataport.org/documents/cardiovascular-disease-dataset (accessed on 6 February 2025).
  13. Janosi, W.S.A. Heart Disease; UCI Machine Learning Repository: Oakland, CA, USA, 1989. [Google Scholar] [CrossRef]
  14. Uddin, K.M.M.; Ripa, R.; Yeasmin, N.; Biswas, N.; Dey, S.K. Machine learning-based approach to the diagnosis of cardiovascular vascular disease using a combined dataset. Intell. Med. 2023, 7, 100100. [Google Scholar] [CrossRef]
  15. Hammer, L.D.; Kraemer, H.C.; Wilson, D.M.; Ritter, P.L.; Dornbusch, S.M. Standardized Percentile Curves of Body-Mass Index for Children and Adolescents. Arch. Pediatr. Adolesc. Med. 1991, 145, 259–263. [Google Scholar] [CrossRef] [PubMed]
  16. Xi, B.; Zong, X.; Kelishadi, R.; Litwin, M.; Hong, Y.M.; Poh, B.K.; Steffen, L.M.; Galcheva, S.V.; Herter-Aeberli, I.; Nawarycz, T.; et al. International Waist Circumference Percentile Cutoffs for Central Obesity in Children and Adolescents Aged 6 to 18 Years. J. Clin. Endocrinol. Metab. 2020, 105, e1569–e1583. [Google Scholar] [CrossRef] [PubMed]
  17. Riordan, A.O.; Howard, S.; Gallagher, S. Blunted cardiovascular reactivity to psychological stress and prospective health: A systematic review. Health Psychol. Rev. 2022, 17, 121–147. [Google Scholar] [CrossRef]
  18. Lovallo, W.R. Cardiovascular reactivity: Mechanisms and pathways to cardiovascular disease. Int. J. Psychophysiol. 2005, 58, 119–132. [Google Scholar] [CrossRef]
  19. Whittaker, A.C.; Ginty, A.; Hughes, B.M.; Steptoe, A.; Lovallo, W.R. Cardiovascular stress reactivity and health: Recent questions and future directions. Psychosom. Med. 2021, 83, 756–766. [Google Scholar] [CrossRef]
  20. Mitchell, T.M. Machine Learning; McGraw-Hill: New York, NY, USA, 1997; ISBN 9780070428072. [Google Scholar]
  21. Kubat, M. An Introduction to Machine Learning; Springer International Publishing: Cham, Switzerland, 2021. [Google Scholar] [CrossRef]
  22. Heckerman, D. A Tutorial on Learning with Bayesian Networks, en Learning in Graphical Models. Jordan, M.I., Ed.; Springer Netherlands: Dordrecht, The Netherlands, 1998; pp. 301–354. [Google Scholar] [CrossRef]
  23. John, G.H.; Langley, P. Estimating continuous distributions in Bayesian classifiers. In Proceedings of the Eleventh Conference on Uncertainty in Artificial Intelligence, Montreal, QU, Canada, 18–20 August 1995; pp. 18–20. [Google Scholar]
  24. Platt, J.C. Fast training of support vector machines using sequential minimal optimization. Adv. Kernel Methods 1998, 185–208. [Google Scholar] [CrossRef]
  25. Breiman, L. Random forests. Mach. Learn 2001, 45, 5–32. [Google Scholar] [CrossRef]
  26. Landwehr, N.; Hall, M.; Frank, E. Logistic Model Trees. Mach. Learn. 2005, 59, 161–205. [Google Scholar] [CrossRef]
  27. Aha, D.W.; Kibler, D.; Albert, M.K. Instance-based learning algorithms. Mach. Learn. 1991, 6, 37–66. [Google Scholar] [CrossRef]
  28. Quinlan, J.R. C4. 5: Programs for Machine Learning; Elsevier: Amsterdam, The Netherlands, 2014. [Google Scholar]
  29. Le Cessie, S.; Van Houwelingen, J.C. Ridge estimators in logistic regression. J. R. Stat. Soc. Ser. C (Appl. Stat.) 1992, 41, 191. [Google Scholar] [CrossRef]
  30. Haykin, S. Neural Networks and Learning Machines, 3/E; Pearson Education India: Noida, India, 2009. [Google Scholar]
  31. Freund, Y.; Schapire, R.E. Experiments with a New Boosting Algorithm, en icml, Citeseer. 1996, pp. 148–156. Available online: https://citeseerx.ist.psu.edu/document?repid=rep1&type=pdf&doi=d186abec952c4348870a73640bf849af9727f5a4 (accessed on 23 December 2024).
  32. Frank, E.; Hall, M.A.; Witten, I.H. The WEKA Workbench. Online Appendix for “Data Mining: Practical Machine Learning Tools and Techniques”. 2016. Available online: https://researchcommons.waikato.ac.nz/entities/publication/d1c32263-dd7f-48fc-899d-2893b45205c7 (accessed on 29 July 2018).
  33. Foulds, J.; Witten, I.H.; Frank, E.; Hall, M.A.; Pal, C.J. Data Mining: Practical Machine Learning Tools and Techniques; Elsevier: Amsterdam, The Netherlands, 2025. [Google Scholar]
  34. Khalid, S.; Khalil, T.; Nasreen, S. A survey of feature selection and feature extraction techniques in machine learning. In Proceedings of the 2014 Science and Information Conference, London, UK, 27–29 August 2014; pp. 372–378. [Google Scholar]
  35. Guyon, I.; Gunn, S.; Nikravesh, M.; Zadeh, L.A. Feature Extraction: Foundations and Applications; Springer: Berlin/Heidelberg, Germany, 2008; Volume 207. [Google Scholar]
  36. Wah, Y.B.; Ibrahim, N.; Hamid, H.A.; Abdul-Rahman, S.; Fong, S. Feature selection methods: Case of filter and wrapper approaches for maximising classification accuracy. Pertanika J. Sci. Technol. 2018, 26, 329–340. [Google Scholar]
  37. Hall, M.A. Correlation-Based Feature Selection for Machine Learning. Ph.D. Thesis, The University of Waikato, Hamilton, New Zealand, 1999. Available online: https://researchcommons.waikato.ac.nz/handle/10289/15043 (accessed on 23 December 2024).
  38. Kohavi, R.; John, G.H. Wrappers for feature subset selection. Artif. Intell. 1997, 97, 273–324. [Google Scholar] [CrossRef]
  39. Balogun, A.O.; Basri, S.; Mahamad, S.; Abdulkadir, S.J.; Almomani, M.A.; Adeyemo, V.E.; Al-Tashi, Q.; Mojeed, H.A.; Imam, A.A.; Bajeh, A.O. Impact of Feature Selection Methods on the Predictive Performance of Software Defect Prediction Models: An Extensive Empirical Study. Symmetry 2020, 12, 1147. [Google Scholar] [CrossRef]
Figure 1. General methodology for classifying individuals based on cardiovascular risk.
Technologies 13 00222 g001
Table 1. List of dataset attributes.
NAttribute
1Age
2Sex
3Real BMI
4Hyperreactivity
5Glycemia
6Uric Acid
7Cholesterol
8Triglycerides
9Physical Activity
10Hypertension (Individual)
11Hypertension (Father)
12Hypertension (Mother)
13Hypertension (Sibling)
14Hypertension (Maternal Grandparent)
15Hypertension (Paternal Grandparent)
16Obesity (Father)
17Obesity (Mother)
18Obesity (Sibling)
19Obesity (Maternal Grandparent)
20Obesity (Paternal Grandparent)
21Diabetes (Father)
22Diabetes (Mother)
23Diabetes (Sibling)
24Diabetes (Maternal Grandparent)
25Diabetes (Paternal Grandparent)
26Dyslipidemia (Father)
27Dyslipidemia (Mother)
28Dyslipidemia (Sibling)
29Dyslipidemia (Maternal Grandparent)
30Dyslipidemia (Paternal Grandparent)
Table 2. Prevalence of risk factors in Family Pathological History (FPH).
AttributesFather
Yes/No
(Missing)
Mother
Yes/No
(Missing)
Siblings
Yes/No
(Missing)
Paternal Grandparents
Yes/No
(Missing)
Maternal Grandparents
Yes/No
(Missing)
Hypertension210/816
(114)
139/889
(112)
28/1000
(112)
401/626
(113)
517/510
(113)
Obesity105/922
(113)
111/917
(112)
16/1012
(112)
115/913
(112)
161/867
(112)
Diabetes29/997
(114)
19/1009
(112)
5/1023
(112)
208/820
(112)
232/796
(112)
Dyslipidemia52/976
(112)
27/1001
(112)
4/1023
(113)
156/872
(112)
110/918
(112)
Table 3. Performance of different machine learning methods in cardiovascular risk classification.
Bayes NetNaive BayesLogisticMLPSMOKNNJ48LMTRFAda Boost
Precision0.87508470.8530.8390.8680.8590.8420.8750.9340.914
Recall0.7870.7540.8220.8610.8140.7720.8340.8080.6660.719
Accuracy0.90308860.9050.9100.9080.8960.9040.9080.8870.896
NPV0.9130.9010.9260.9400.9230.9070.9300.9210.8720.891
F1-score0.8290.7980.8370.8500.8400.8130.8380.8400.7770.805
Table 4. Execution times (in seconds) for risk classification models.
Bayes NetNaive BayesLogisticMLPSMOKNNJ48LMTRFAda Boost
Model building0.880.151.847.431.991758.430.6916.183.931.33
Table 5. Confusion matrix for J48 algorithm.
Class\PredictionAt Risk No Risk
At risk28256
No risk53749
Table 6. Confusion matrix for RF algorithm.
Class\PredictionAt Risk No Risk
At risk225 113
No risk16789
Table 7. Attributes ranked by gain ratio with respect to the classification class.
RelevanceGain RatioAttribute
10.1985117HTA (individual)
20.1271846Hyperreactivity
30.0901285Real BMI
40.0499216Dyslipidemia (sibling)
50.0404037Cholesterol
60.0403338Obesity (mother)
70.0320212Obesity (father)
80.0301546Triglycerides
90.0266643Age
100.0242773Glucose
110.0213532Obesity (sibling)
120.0194491HTA (sibling)
130.0169969Uric Acid
140.0168717HTA (mother)
150.0124389Obesity (paternal aunt/uncle)
160.0113923Obesity (maternal aunt/uncle)
170.0104232Dyslipidemia (father)
180.0093344Diabetes (mother)
190.0087188HTA (father)
200.0068116Dyslipidemia (mother)
210.0048233HTA (paternal aunt/uncle)
220.0044644Diabetes (sibling)
230.0026934HTA (maternal aunt/uncle)
240.0017668Diabetes (father)
250.0006764Diabetes (maternal aunt/uncle)
260.0004441Diabetes (paternal aunt/uncle)
270.0002678Dyslipidemia (maternal aunt/uncle)
280.0001317Sex
290.0000999Dyslipidemia (paternal aunt/uncle)
300.0000600Physical Activity
Table 8. Attributes ranked by information gain with respect to the classification class.
RelevanceInfo GainAttribute
10.2415HTA (individual)
20.1657Hyperreactivity
30.1544Real BMI
40.0555Cholesterol
50.0525Triglycerides
60.0234Age
70.0216Glucose
80.0199Obesity (mother)
90.0152Obesity (father)
100.0133Uric Acid
Table 9. Performance in classification using the subset of eight attributes obtained with CFS.
Bayes NetNaive BayesLogisticMLPSMOKNNJ48LMTRFAda Boost
Precision0.8700.8840.8600.8520.8640.8130.8160.8460.8540.849
Recall0.7900.7630.8170.8520.7870.7990.8400.8280.7930.796
Accuracy0.9020.9000.9060.9120.9000.8850.8960.9040.8980.897
NPV0.9140.9050.9240.9370.9130.9150.9310.9280.9150.916
F1-score0.8280.8190.8380.8520.8240.8060.8280.8370.8220.821
Table 10. Execution times (in seconds) for risk classification models using the subset of eight attributes obtained with CFS.
Bayes NetNaive BayesLogisticMLPSMOKNNJ48LMTRFAda Boost
Model building0.010.010.040.240.07530.340.020.620.180.03
Table 11. Performance in classification using the subsets of attributes obtained with WFS.
LogisticMLPLMT
Precision0.8620.8520.852
Recall0.8140.8520.820
Accuracy0.9060.9120.904
NPV0.9230.9370.925
F1-score0.8370.8520.836
Disclaimer/Publisher’s Note: The statements, opinions and data contained in all publications are solely those of the individual author(s) and contributor(s) and not of MDPI and/or the editor(s). MDPI and/or the editor(s) disclaim responsibility for any injury to people or property resulting from any ideas, methods, instructions or products referred to in the content.

