1. Introduction
Among the most important causes of cancer-related morbidity and death worldwide are lung and colon cancer [
1]. Causing almost 1.8 million deaths annually, lung cancer is the most deadly cancer known to exist globally according to recent statistics. In comparison, colon cancer, with an estimate of almost 1.1 new cases every year [
2], is the third most prevalent after lung cancer and is one of the leading causes of cancer-related deaths. Lung cancer and colon cancer may occur in different organs, but several studies raise a substantial suspicion of such similar conditions [
3,
4]. Prevalent risk factors such as family history, exposure to environmental toxins, and the frequency of tobacco use may be the cause of this relationship. An additional contributing factor may be the existence of an immune response mechanism that is either associated with or triggered by another type of cancer, as well as widespread inflammation. Such relationships highlight the importance of accurate and immediate diagnosis for proper planning for treatment.
There are several imaging modalities by which lung and colon cancers are diagnosed, namely, computed tomography (CT), magnetic resonance imaging (MRI), and positron emission tomography (PET) [
5]. Although providing valuable information on the location, size, and presence of metastases within the tumor, their major drawbacks range from great expenses, to excess utilization of radiation, and to poor resolution to differentiate small tissue anomalies [
6]. The gold standard for lung and colon cancer diagnosis is histopathology, which involves microscopic study of stained tissue sections [
5,
7]. Histopathology is quite accurate in identifying structural and cellular changes suggestive of cancer. Still, manual diagnosis using histopathological images is subjective, labor-intensive, and prone to pathologist variation, especially when looking at complex patterns in large-scale datasets [
8]. Thus, automated methods for cancer subtype identification are absolutely essential to reduce doctors’ workload [
9].
Recent technological advances in computers have enabled clinicians and physicians to identify and recognize various tumors and illnesses through computer-aided diagnostic (CAD) tools. CAD systems have evolved into efficient tools to overcome the constraints of manual diagnosis [
10,
11,
12]. CAD systems can be classified into two primary methods: those based on handcrafted features and those employing deep-learning-based feature techniques. Handcrafted features utilizing CAD techniques may provide accuracy within an acceptable range [
13] typically between 80% to 90% without necessitating extensive data or being computationally demanding [
14]. Feature extraction is crucial in conventional handcrafted-feature-based CAD methods for classifying anomalies in medical imaging [
15]. Enhancing diagnostic reliability necessitates the extraction of a varied array of features, encompassing texture, statistical, and shape-based descriptors. Texture features, for example, offer significant insights into the spatial distribution of pixel intensities within an image. Methods such as the gray-level co-occurrence matrix (GLCM) [
16] and local binary pattern (LBP) [
17], which effectively capture distinct attributes of tissue morphology, are frequently utilized for this objective. Nevertheless, these techniques frequently concentrate on a singular characteristic of the image. A shape descriptor may inadequately capture essential texture-related information, thereby restricting its efficacy when deployed on intricate medical images of the lung and colon.
Conversely, deep-learning-based CAD systems have garnered considerable interest owing to their capacity to autonomously learn hierarchical features from unprocessed image data. Deep learning approaches, alongside conventional methods of feature extraction, can be employed to derive discriminative attributes from raw image data. However, in terms of classification challenges, deep learning algorithms significantly outperform traditional methods [
18]. Nevertheless, certain studies indicate that integrating deep learning features with conventional handcrafted features could enhance diagnostic efficacy [
14,
19,
20,
21]. Convolutional neural networks (CNNs) are nowadays the leading deep learning method in medical imaging research due to their ability to identify complex patterns and achieve high diagnostic accuracy [
22]. CNNs have achieved notable success in various medical applications, particularly in X-ray [
23], histopathology [
24,
25], Pap smear [
26], and CT. Inspired by the significant achievements of CNNs in various medical and health fields, they have been incorporated into multiple CAD designs for lung and colon identification. Substantial quantities of information are necessary for these structures to prevent overfitting and inadequate generalization. Due to the difficulties in labeling histopathological photographs, transfer learning (TL) aims to transfer knowledge from a source realm to a desired field to mitigate overfitting. CNNs, formerly learned on ImageNet with TL, could be leveraged for cancer diagnosis [
27].
This study presents a CAD system that incorporates multi-domain attributes via diverse feature extraction methodologies. The method extracts various spatial deep features from three lightweight CNN models and reduces their dimensionality through non-negative matrix factorization (NNMF). Furthermore, it generates handcrafted features, encompassing temporal statistical attributes through various methods and textural attributes employing GLCM and LBP extractors. These handcrafted features are merged into an integrated ensemble. The deep feature sets derived from the individual CNNs are subsequently integrated with the aggregated handcrafted features. Thereafter, all deep features from the three CNNs are integrated with the fused handcrafted features, followed by the implementation of the minimum redundancy maximum relevance (mRMR) feature selection technique to ascertain the most pertinent features and further diminish dimensionality.
A thorough comparative analysis assesses the diagnostic efficacy of the proposed CAD system. The analysis evaluates (1) the diagnostic efficacy of deep features from each CNN independently, (2) the performance of individual and aggregated handcrafted features, (3) the efficacy of integrating each deep feature set with the aggregated handcrafted features, and (4) the overall performance of deep features from all CNNs amalgamated with the aggregated handcrafted features following mRMR feature selection.
The principal contributions and novelty of the presented CAD approach can be encapsulated in the following manner:
The creation of an effective CAD structure employing numerous light CNNs characterized by fewer layers and diminished parameters, in conjunction with various handcrafted feature extraction methods. This method differs from current CAD systems, which generally depend on a solitary, parameter-intensive CNN or a unique handcrafted technique.
The suggested CAD obviates the necessity for pre-segmentation or enhancement procedures, typically mandated by numerous existing CAD systems.
Incorporation of attributes from multiple categories, such as spatial deep learning and texture-based attributes, instead of relying solely on a single feature extraction technique from a particular field, thus improving classification performance.
Extraction of texture features, including GLCM and LBP, alongside statistical attributes obtained from both temporal and spatial domains.
Examination of the effects of integrating various handcrafted types of features with each deep learning feature set individually derived from separate CNNs, an approach infrequently investigated in current CAD systems.
Integration of deep-learning-generated feature sets and manually crafted features through a feature selection method, such as non-negative matrix factorization (NNMF), to diminish feature dimensionality and reduce training duration.
This study thoroughly investigates the diagnostic efficacy of using deep features only, handcrafted features only, and a combination of both. The analysis also explores the effects of combining deep features extracted from different CNNs with different handcrafted features on diagnostic accuracy, giving an insight into the efficacy of this hybrid approach in classifying lung and colon cancer.
This study expands on our earlier work [
28], which presented a CAD system that uses compact CNNs and CCA-based dimensionality reduction for the classification of lung and colorectal cancer. While both studies focus on using deep learning to classify lung and colon cancer, our current study offers significant methodological improvements:
1. Contrary to our earlier research [
28], which leveraged multi-scale deep features obtained from two CNN deep layers to evaluate the effects of using multi-scale features from various deep layers, the current study presents a more varied and hybrid methodology. The present study incorporates handcrafted features, encompassing statistical, textural (GLCM, LBP), and temporal domain features, with attributes obtained from deep CNNs.
2. Our prior research [
28] implemented canonical correlation analysis (CCA) for dimensionality reduction, while the present study utilizes NNMF, which offers superior interpretability and improves feature selection.
3. In the present study, the mRMR feature selection technique is employed, which efficiently selects features from both deep and handcrafted domains, thereby minimizing computational complexity and enhancing classification performance.
4. The present study conducts a comprehensive examination of the integration of handcrafted and deep features, a topic not addressed in our prior research. We evaluate the influence of various feature sets both individually and collectively to determine their effect on classification performance. The joint incorporation of handcrafted features and deep learning features is a major advancement. By integrating spatial, textural, and statistical features, the framework captures a more comprehensive and varied amount of information than deep learning features alone.
5. An extensive array of experiments are performed assessing various CNN architectures, handcrafted feature extractions, and machine learning classifiers, providing an enhanced understanding of feature interactions and their impact on diagnostic efficacy. These modifications emphasize the originality of our current research, distinguishing it from previously published studies. The amended manuscript now clearly delineates these distinctions.
2. Literature Review
The present section features a brief overview of some of the important CAD tools developed for the detection of lung and colon tumors using histopathological images. First, conventional CAD approaches employed in the diagnosis of such cancers are discussed. Subsequently, CAD systems based on deep learning are explored. Lastly, the hybrid approaches that combine classical and deep-learning-based techniques to improve diagnostic accuracy are examined.
2.1. Handcrafted-Features-Based CAD Tools
The CAD technique [
14] involves the mining of texture features using the Haralick method and color attributes via the color histogram algorithm. The attributes extracted were merged to form a cohesive set of attributes. Thus, three feature sets were studied with the LightGBM (Light Gradient Boosting Machine) classifier: texture, color, and combined features. The classifier LightGBM achieved an accuracy of 97.72%, 99.92%, and 100% for feature extraction using texture, color, and combining textural and color features, respectively. Similarly, the paper presents a CAD system [
29] with two preprocessing methods: unsharp masking and stain normalization. Renfield shifted the images into grayscale, and, hence, feature extraction preceded. Various feature extraction techniques were utilized to acquire features, including GLCM, statistical methods, and Hu moment variants. Afterwards, recursive feature elimination, a feature selection technique, was employed to identify the most effective features. Following that, six machine learning algorithms were employed to classify the images based on the chosen features.
2.2. Deep-Learning-Based CAD Tools
The latest deep learning methodologies have demonstrated encouraging outcomes for the diagnosis of lung and colon cancer histopathology. Ref. [
30] combined a marine predator (MP) method with MobileNet and deep belief networks (DBNs). This CAD leveraged CLAHE for contrast enhancement and MP for optimization, attaining an accuracy of 99.28%. The model demonstrated notable efficacy in managing intricate histopathological characteristics. Ref. [
31] adapted ResNet50 and EfficientNetB0 layouts, utilizing gray wolf optimization and soft voting to attain an accuracy of 98.73%. Ref. [
1] employed EfficientNetV2 variations, achieving an accuracy of 99.97% with the large EfficientNetV2 construction, validated via gradient-weighted class activation mapping (Grad-CAM) visualization. Ref. [
9] presented a sophisticated framework that integrates ResNet-18 to classify binary classes and EfficientNet-b4-wide to classify multiple classes. An optimization procedure was used that integrates the whale optimization algorithm (WOA) with adaptive β-Hill Climbing, which attained an accuracy of 99.96% using the LC25000 dataset. Ref. [
32] introduced a compact CNN utilizing multi-scale feature extraction, attaining 99.20% accuracy across five categories, bolstered by explainable AI techniques including Grad-CAM and Shapley additive explanation (SHAP). Ref. [
33] introduced ColonNet, which combines dual CNN structures with global–local pyramid patterns and deep residual blocks, surpassing conventional architectures such as VGG and DenseNet. Ref. [
34] employed the Al-Biruni Earth radius (BER) technique integrated with ShuffleNet and recurrent networks.
Recent research efforts have concentrated on ensemble methodologies. Ref. [
35] integrated three CNNs with a kernel extreme learning machine (KELM), attaining 99.0% accuracy by effectively managing multi-dimensional feature sets. Ref. [
36] employed three deep networks for extracting features, exploiting principal component analysis (PCA) and fast Walsh Hadamard transform (FWHT) for dimensionality reduction. The framework attained 99.6% accuracy through discrete wavelet transform (DWT) fusion and SVM classification utilizing merely 510 features. Conversely, Ref. [
37] introduced a deep capsule network approach. The above algorithm employed different forms of convolutional layers. The suggested approach attained 99.58% accuracy.
2.3. Hybrid CAD Tools
Ref. [
38] combined Inception-ResNetV2 with LBP features, attaining an accuracy of 99.98%, and applied SHAP for improved model interpretability. Likewise, Ref. [
6] created a hybrid CAD approach that integrates random forest (RF), SVM, and logistic regression (LR). The CAD employed VGG16 for deep feature extraction in conjunction with the LBP handcrafted feature extraction technique, attaining 99.00% accuracy, 99.00% precision, and 98.80% recall using the LC25000 dataset, indicating strong performance across various metrics. Ref. [
19] developed three methodologies, each utilizing dual deep networks and artificial neural networks (ANN) to construct a CAD system. The dual deep models produced a massive amount of variables; consequently, unrelated and redundant variables were removed to reduce dimensions and retain vital features through PCA. The initial method for cancer detection using ANN utilizes significant attributes from the two deep networks separately. The following method leverages an ANN that combines the features of GoogleNet and VGG19. A pair sorts of systems were emplaced; one consisted of reduced dimensions and incorporated attributes, while the other combined the extensive dimensions of attributes and, thereafter, lowered those large dimensions. The ultimate method leverages an ANN that amalgamates features from the two deep models in conjunction with handmade variables. The shallow network attained 99.64% accuracy, through the integration of VGG19 merged attributes with handcrafted features. Masud et al. [
39] proposed a classification system for five categories of lung and colon tissues utilizing histopathological photographs. Initially, photographs underwent image sharpening. Subsequently, features were obtained from the photos using two different transform-based techniques. The attributes were employed to feed a custom-optimized deep model. The accuracy of the suggested CAD was found to be 96.33%.
On the other hand, Ref. [
40] carried out an in-depth comparison of two-fold classification strategies. The initial approach involved the extraction of texture, color, and shape-based attributes. Such features were utilized for identification employing various machine learning techniques. The subsequent approach employed TL for feature extraction. Numerous deep neural networks were employed to acquire features. The RF technique demonstrated a superior performance of 98.60% accuracy using variables derived from DenseNet-121.
This study builds upon our previous work [
28], which introduced a CAD system leveraging lightweight CNNs and CCA-based dimensionality reduction for lung and colon cancer classification. Similar to our previous study [
28], the current work utilizes the LC25000 dataset and evaluates performance using metrics such as accuracy, sensitivity, specificity, and F1-score. Both studies concentrate on the classification of lung and colon cancer through deep learning. However, the present study introduces several key innovations. In contrast to our prior research [
28], which concentrated on utilizing multi-scale feature extraction from two CNN deep layers to evaluate the effects of employing multi-scale features from various deep layers, the present study presents a more varied and hybrid methodology. In particular:
1. Our previous research [
28] used only CNN-based features extracted from two deep layers; however, the current study emphasizes the value of using diverse feature representation (i.e., textural and statistical features) to create robustness for classification. This provides a solution to the limitation of existing CAD systems having a preference for either textural features or statistical measures.
2. The benefit of using handcrafted features and CNN-based features by combining them was demonstrated. The statistical and textural features add to the CNN-based representation when used for the classification of medical images. The blending of features allows both features to use high-level hierarchical patterns (i.e., CNN) and low-level texture/statistical features (i.e., handcrafted). This approach solves the limitations of relying on a singular feature type.
3. Our previous work [
28] used CCA and ANOVA. This work adopts NNMF for dimensional reduction, and mRMR for feature selection. NNMF is better suited for non-negative feature spaces, which are more common for medical images. Also, mRMR targets features that optimize feature relevance, with the least amount of redundancy, and likely offers a more principled approach to feature fusion.
4. This study also has a larger comparative analysis in evaluating the diagnostic performance of
Deep features from separate CNNs.
Handcrafted features, both separately and combined.
Combining deep and handcrafted features.
The impact of feature reduction and selection methods (NNMF and mRMR) upon classification performance.
This study’s hybrid approach enhances present approaches by overcoming significant drawbacks in feature representation, fusion strategies, and computational efficiency. Previous CAD tools for the classification of lung and colon cancer can be categorized into three distinct types: (1) handcrafted-feature-based methods, which depend on manually designed attributes such as texture (GLCM, LBP) or statistical descriptors; (2) deep-learning-based approaches, which utilize hierarchical patterns acquired by CNNs; and (3) hybrid techniques that integrate both methodologies. Although these works have shown encouraging outcomes, they frequently exhibit limited feature scope, inadequate fusion methodologies, or dependence on resource-intensive preprocessing.
Conventional handcrafted-feature-based systems include those utilizing Haralick texture features or color histograms. Refs. [
14,
29] excel at capturing subtle textural and statistical features but are deficient in modeling intricate hierarchical patterns present in histopathological images. In contrast, deep-learning-focused approaches [
1,
30,
31] prioritize high-level spatial representations from CNNs but may neglect the discriminative local textures essential for distinguishing subtle cancer subtypes. Current hybrid frameworks, including those [
6,
38] that integrate VGG16 with LBP or Inception-ResNetV2 with handcrafted features, frequently utilize primitive fusion methods (e.g., concatenation without feature selection) or depend on antiquated methods for reducing dimensionality such as PCA. For example, [
6] achieved 99% accuracy by integrating VGG16 and LBP features; however, it employed PCA for dimensionality reduction, which presumes linear feature relationships and may result in the loss of non-linear discriminative information. Likewise, [
38] integrated LBP with deep features but failed to systematically assess the synergistic effects of multi-domain features or utilize advanced selection techniques to reduce redundancy.
Conversely, our hybrid methodology presents three principal innovations that set it apart from current techniques. Initially, it merges multi-domain attributes encompassing deep spatial representations derived from lightweight CNNs and an extensive array of handcrafted attributes, including GLCM, LBP, and 13 statistical descriptors. This combination encompasses both primary morphological frameworks and intricate textural specifics, rectifying the limited feature range of previous studies. The framework utilizes NNMF for dimensionality reduction, which is particularly appropriate for medical imaging data where features, such as pixel intensities and texture values, are intrinsically non-negative. In contrast to PCA or CCA, utilized in previous studies, NNMF maintains comprehension by breaking data into additive, non-negative components, which aligns more effectively with the biological interpretability necessary in clinical contexts. This study employs mRMR for feature selection, a systematic approach that maximizes feature relevance to the target class while minimizing redundancy among features. This differs from traditional methods such as ANOVA or recursive feature elimination, which focus solely on relevance and may retain redundant features that compromise model robustness.
Moreover, our framework obviates preprocessing procedures like image sharpening or stain normalization, which are resource-intensive and susceptible to artifact introduction. The system enhances clinical applicability and preserves diagnostic accuracy by utilizing raw histopathological images modified through dynamic scaling and spatial transformations. The thorough comparative analysis—assessing deep features, handcrafted features, and their integration—confirms the superiority of the hybrid approach through empirical evidence. For instance, although the authors of [
39] reported an accuracy of 99.98% utilizing Inception-ResNetV2 with LBP, their research failed to delineate the contributions of distinct feature types or assess redundancy within the fused set. Our ablation studies reveal that the amalgamation of NNMF-reduced deep features with mRMR-selected handcrafted attributes enhances sensitivity by 2.3% relative to deep-only models and decreases training time by 18% compared to previous hybrid methods, highlighting both performance and efficiency improvements.
5. Experimental Results
The experimental results section will initially represent the outcomes of each deep feature set acquired from each CNN independently and then reduced using NNMF, and employed to train the six machine learning algorithms. Afterward, it will present the outcomes of the same classifiers fed with each feature set of the handcrafted feature extraction approaches, including GLCM, LBP, and statistical. Furthermore, it will demonstrate the results of the classification algorithms when input with the combined handcrafted features. Next, the results derived from these machine learning methods will be displayed after each deep feature collection has been supplied along with the aggregated handcrafted features. Finally, the results after the integration of the three deep feature sets obtained from the three CNNs and combined with the fused handcrafted features and the application of the mRMR feature selection are demonstrated and discussed.
5.1. Deep Features Results
The section will provide the results of the independent deep feature sets acquired out of every CNN and diminished using NNMF and fed to the six machine learning models.
Table 1 presents an in-depth evaluation of the performance of the presented CAD exploiting deep features derived from EfficientNetB0, MobileNet, and ResNet-18. The features were diminished through NNMF and utilized in six machine learning classifiers: DT, KNN, linear support vector machine (LSVM), quadratic support vector machine (QSVM), cubic support vector machine (CSVM), and medium Gaussian support vector machine (MGSVM). The results indicate discrepancies in the efficacy of these classifiers across various feature sets and CNN models, providing significant insights into the system’s diagnostic proficiency.
EfficientNetB0 exhibited consistent enhancements in accuracy with the augmentation of NNMF features. Both QSVM and MGSVM attained the highest accuracy of 98.9% employing 50 NNMF variables. MGSVM continually demonstrated outstanding accuracy across all feature sets, emphasizing its reliability in classifying the extracted features. DT exhibited comparatively diminished accuracy, commencing at 97.0% with 10 attributes and decreasing as the number of features increased.
MobileNet was identified as the superior model among the three CNN structures. It continuously surpassed EfficientNetB0 and ResNet-18, attaining a maximum accuracy of 99.4% with 40 NNMF attributes employing MGSVM. Despite a reduction in features (10 NNMF), the performance remained robust, with QSVM and MGSVM achieving 98.9% accuracy. Those findings highlight MobileNet’s proficiency in feature extraction and classification, rendering it a suitable selection for this CAD system. On the other hand, ResNet-18 demonstrated commendable performance, attaining its peak accuracy of 99.2% with QSVM and MGSVM leveraging 30 and 40 NNMF attributes, respectively. Nonetheless, its performance was marginally inferior to that of MobileNet, particularly at elevated feature sizes. The DT classifier demonstrated reduced accuracy for ResNet-18, varying from 97.9% with 10 NNMF variables to 90.7% with 50 attributes, indicating its constraints relative to other classifiers.
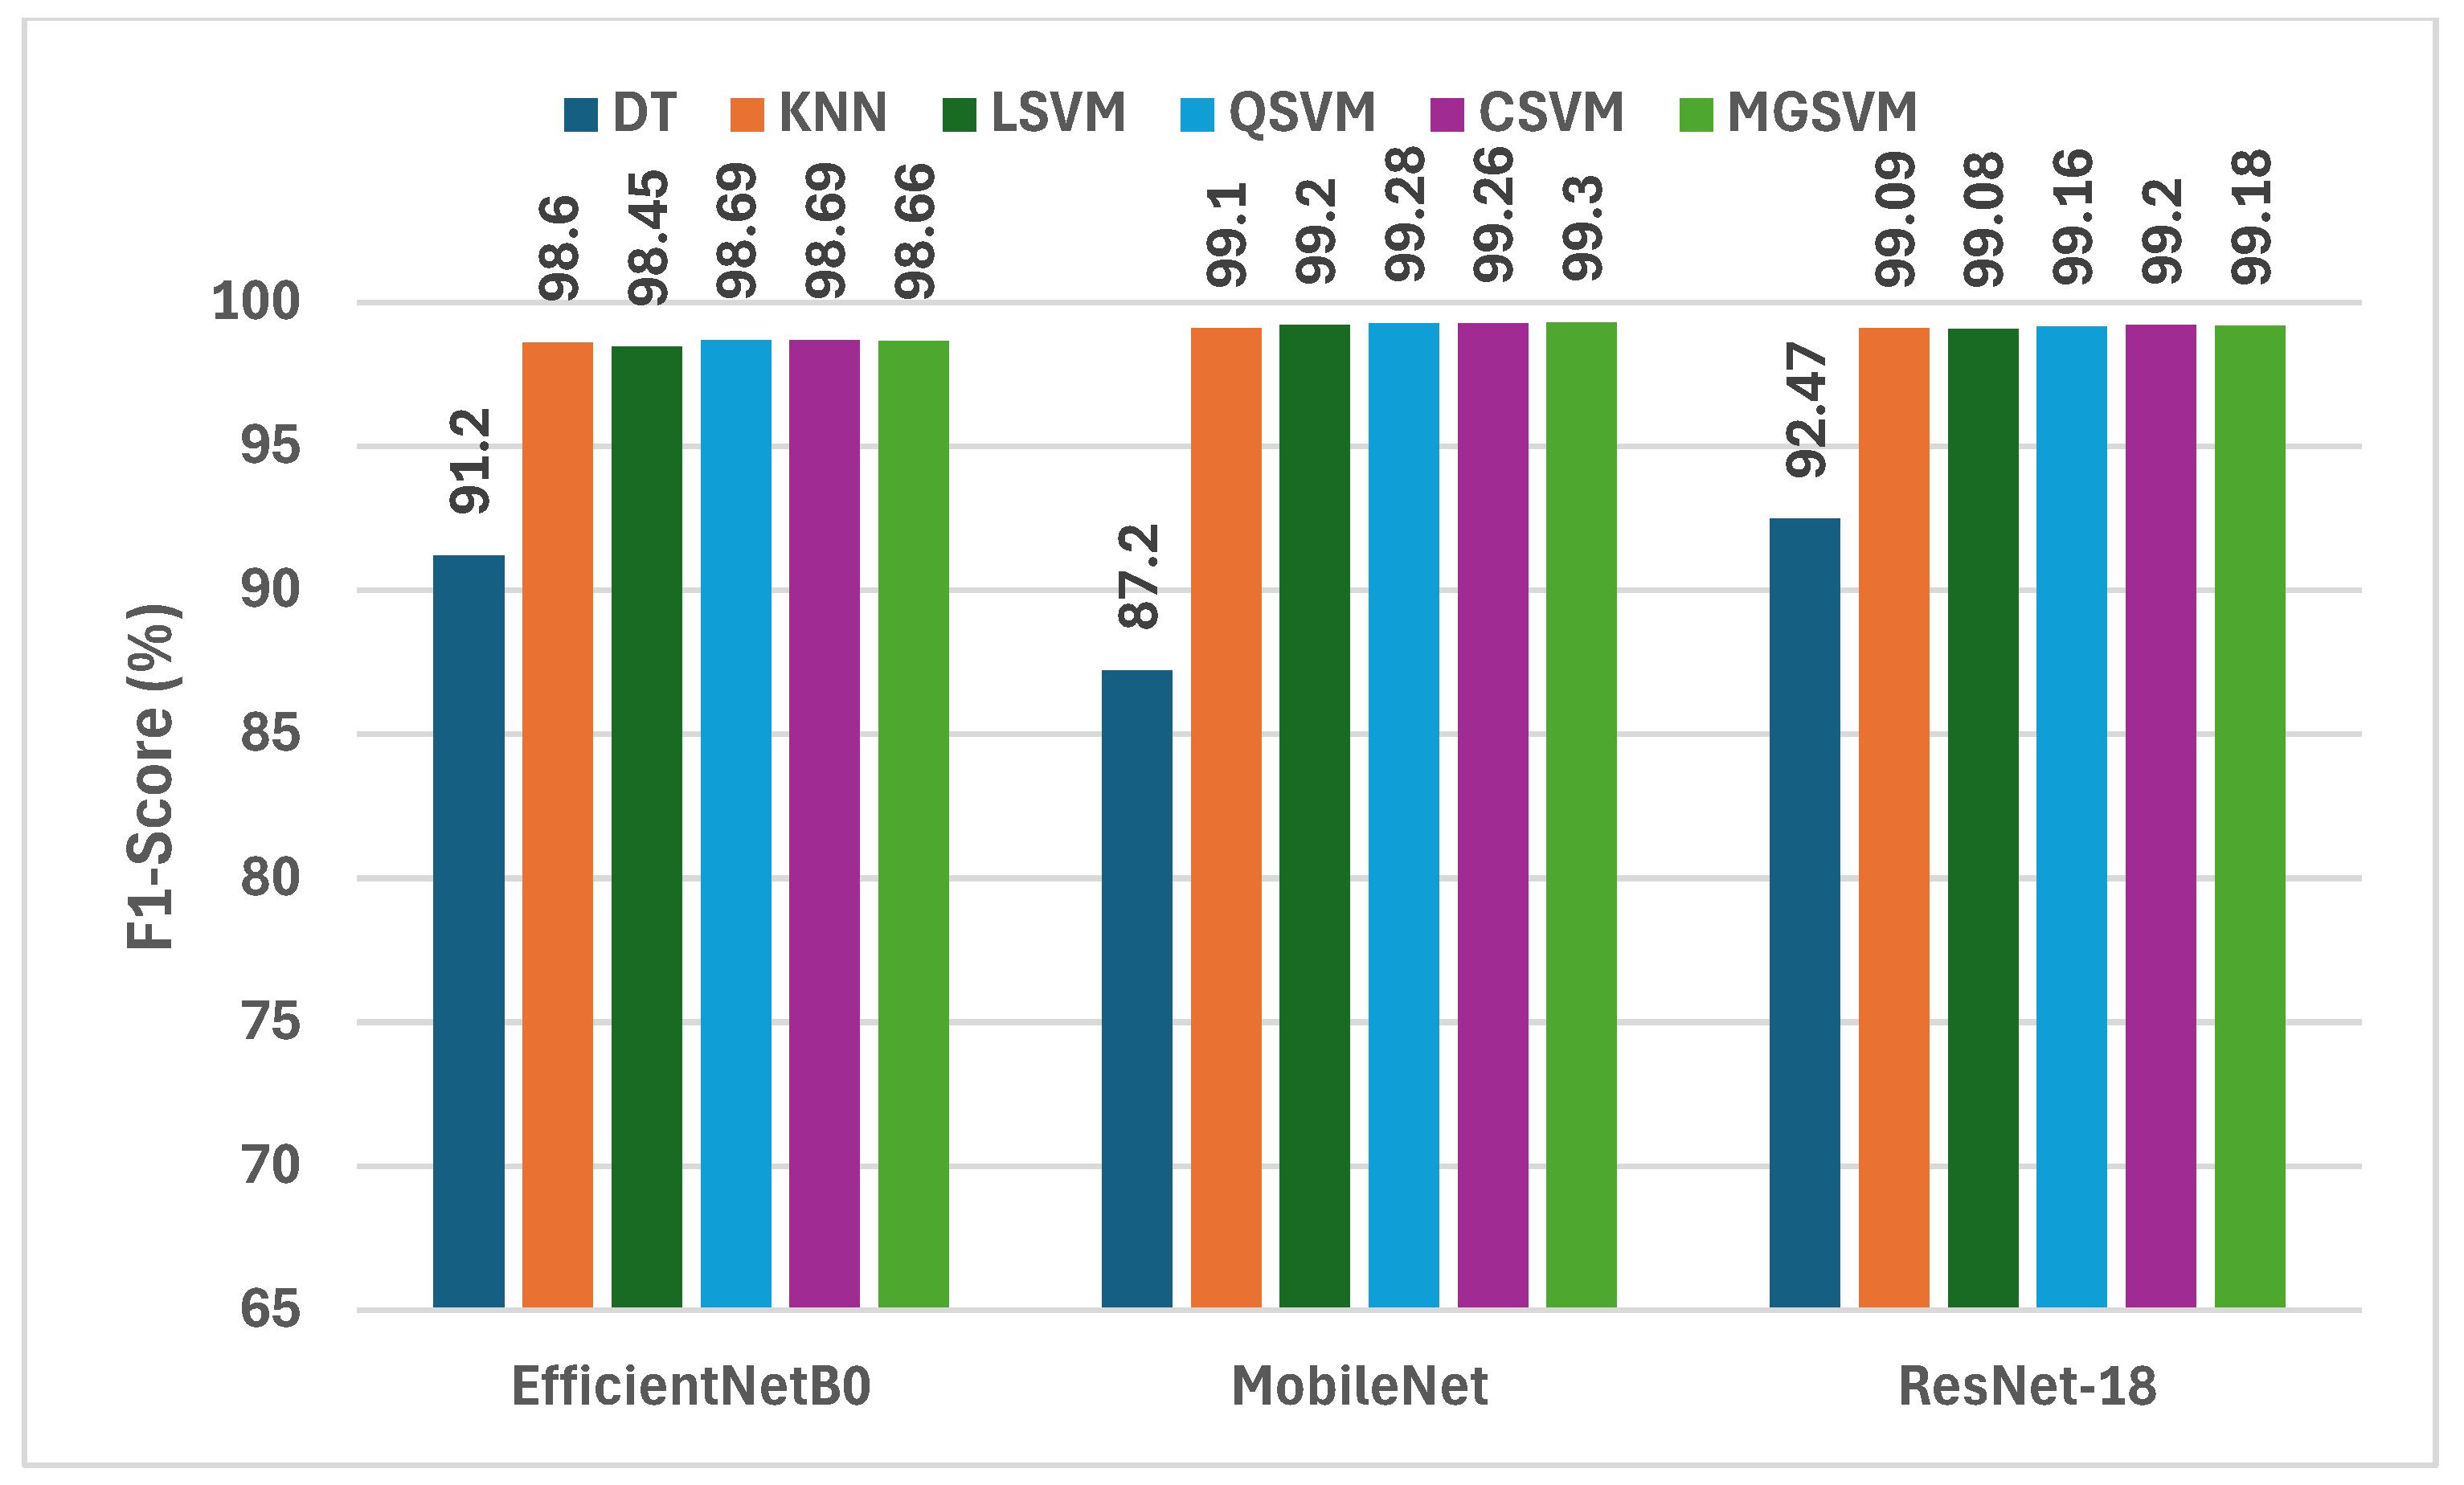
Figure 3 displays a comprehensive assessment of the F1-scores attained by six machine learning classifiers, trained on deep features derived from three compact CNNs subsequent to dimensionality reduction via NNMF. Analysis of the F1-scores among the three CNNs reveals that MobileNet regularly surpasses EfficientNetB0 and ResNet-18 in the majority of instances. For example, MobileNet attains F1-scores between 87.2% (DT) and 99.30% (MGSVM), illustrating its exceptional capacity to identify distinctive attributes for the classification of lung and colon cancer. Likewise, ResNet-18 exhibits outstanding efficiency, with F1-scores varying from 92.47% (DT) to 99.20% (CSVM). Conversely, EfficientNetB0 demonstrates marginally reduced F1-scores, with values spanning from 91.20% (DT) to 98.69% (QSVM). The findings indicate that although all three CNNs exhibit outstanding performance, MobileNet is the most efficient structure for feature extraction within this framework, especially when paired with powerful classifiers.
Out of all three CNNs, CSVM and MGSVM are the classifiers that continuously obtain the highest F1-scores. CSVM attains F1-scores of 98.69%, 99.26%, and 99.20% for EfficientNetB0, MobileNet, and ResNet-18, correspondingly. MGSVM trails closely, achieving F1-scores of 98.66%, 99.30%, and 99.18%. The outcomes demonstrate that both of the SVM-based classifiers are exceptionally proficient in managing the high-dimensional feature space generated by the NNMF-reduced deep features. Conversely, the DT exhibits the lowest performance, yielding F1-scores of 91.20%, 87.20%, and 92.47% for EfficientNetB0, MobileNet, and ResNet-18, respectively. This variation highlights the necessity of choosing suitable classifiers that can utilize the abundant information offered by the deep features.
5.2. Handcrafted Features Results
The following part will demonstrate the findings of the classification algorithms utilizing each independent handcrafted feature set as well as the fused feature sets.
Table 2 presents a summary of the performance evaluation of the suggested CAD system deploying handcrafted features, both singularly and in conjunction, across six machine learning classifiers. The results demonstrate the diagnostic potential of each feature set and their combinations, offering significant insights into the role of handcrafted features in cancer identification. The statistical features demonstrated solid results among the classifiers, with the greatest accuracy recorded for CSVM at 93.3%, followed by KNN at 92.9%. Nonetheless, DT attained a reduced accuracy of 86.8%, underlining its constraints in comparison to more advanced classifiers. The findings demonstrate the reliability of statistical features in conveying pertinent information for classification, while also highlighting the differing efficacy of classifiers in utilizing these features. The GLCM features exhibited moderate efficacy, with optimal results once more realized through CSVM, achieving an accuracy of 90.7%. KNN achieved an accuracy of 86.9%, whereas DT recorded the lowest accuracy at 79.7%. The findings indicate that although GLCM features aid in the classification process, their independent efficacy is constrained relative to statistical features. LBP features demonstrated marginally superior performance compared to GLCM, with CSVM attaining the highest accuracy of 94.0%, succeeded by QSVM at 92.1%. DT exhibited the lowest performance at 77.2%, suggesting that although LBP features offer significant insights into texture, they necessitate sophisticated classifiers to attain elevated diagnostic accuracy.
The combination of the three distinct feature sets—statistical, GLCM, and LBP—yielded substantial enhancements for all classifiers. The integrated features attained a maximum accuracy of 98.1% with CSVM, succeeded by 96.3% with QSVM and 95.2% with MGSVM. The results demonstrate the beneficial effects of integrating various feature sets, emphasizing the importance of multi-domain feature aggregation in improving classification efficacy. Significantly, DT demonstrated enhanced accuracy of 89.8% with the integration of combined features, highlighting the advantages of feature fusion even for less complex classifiers.
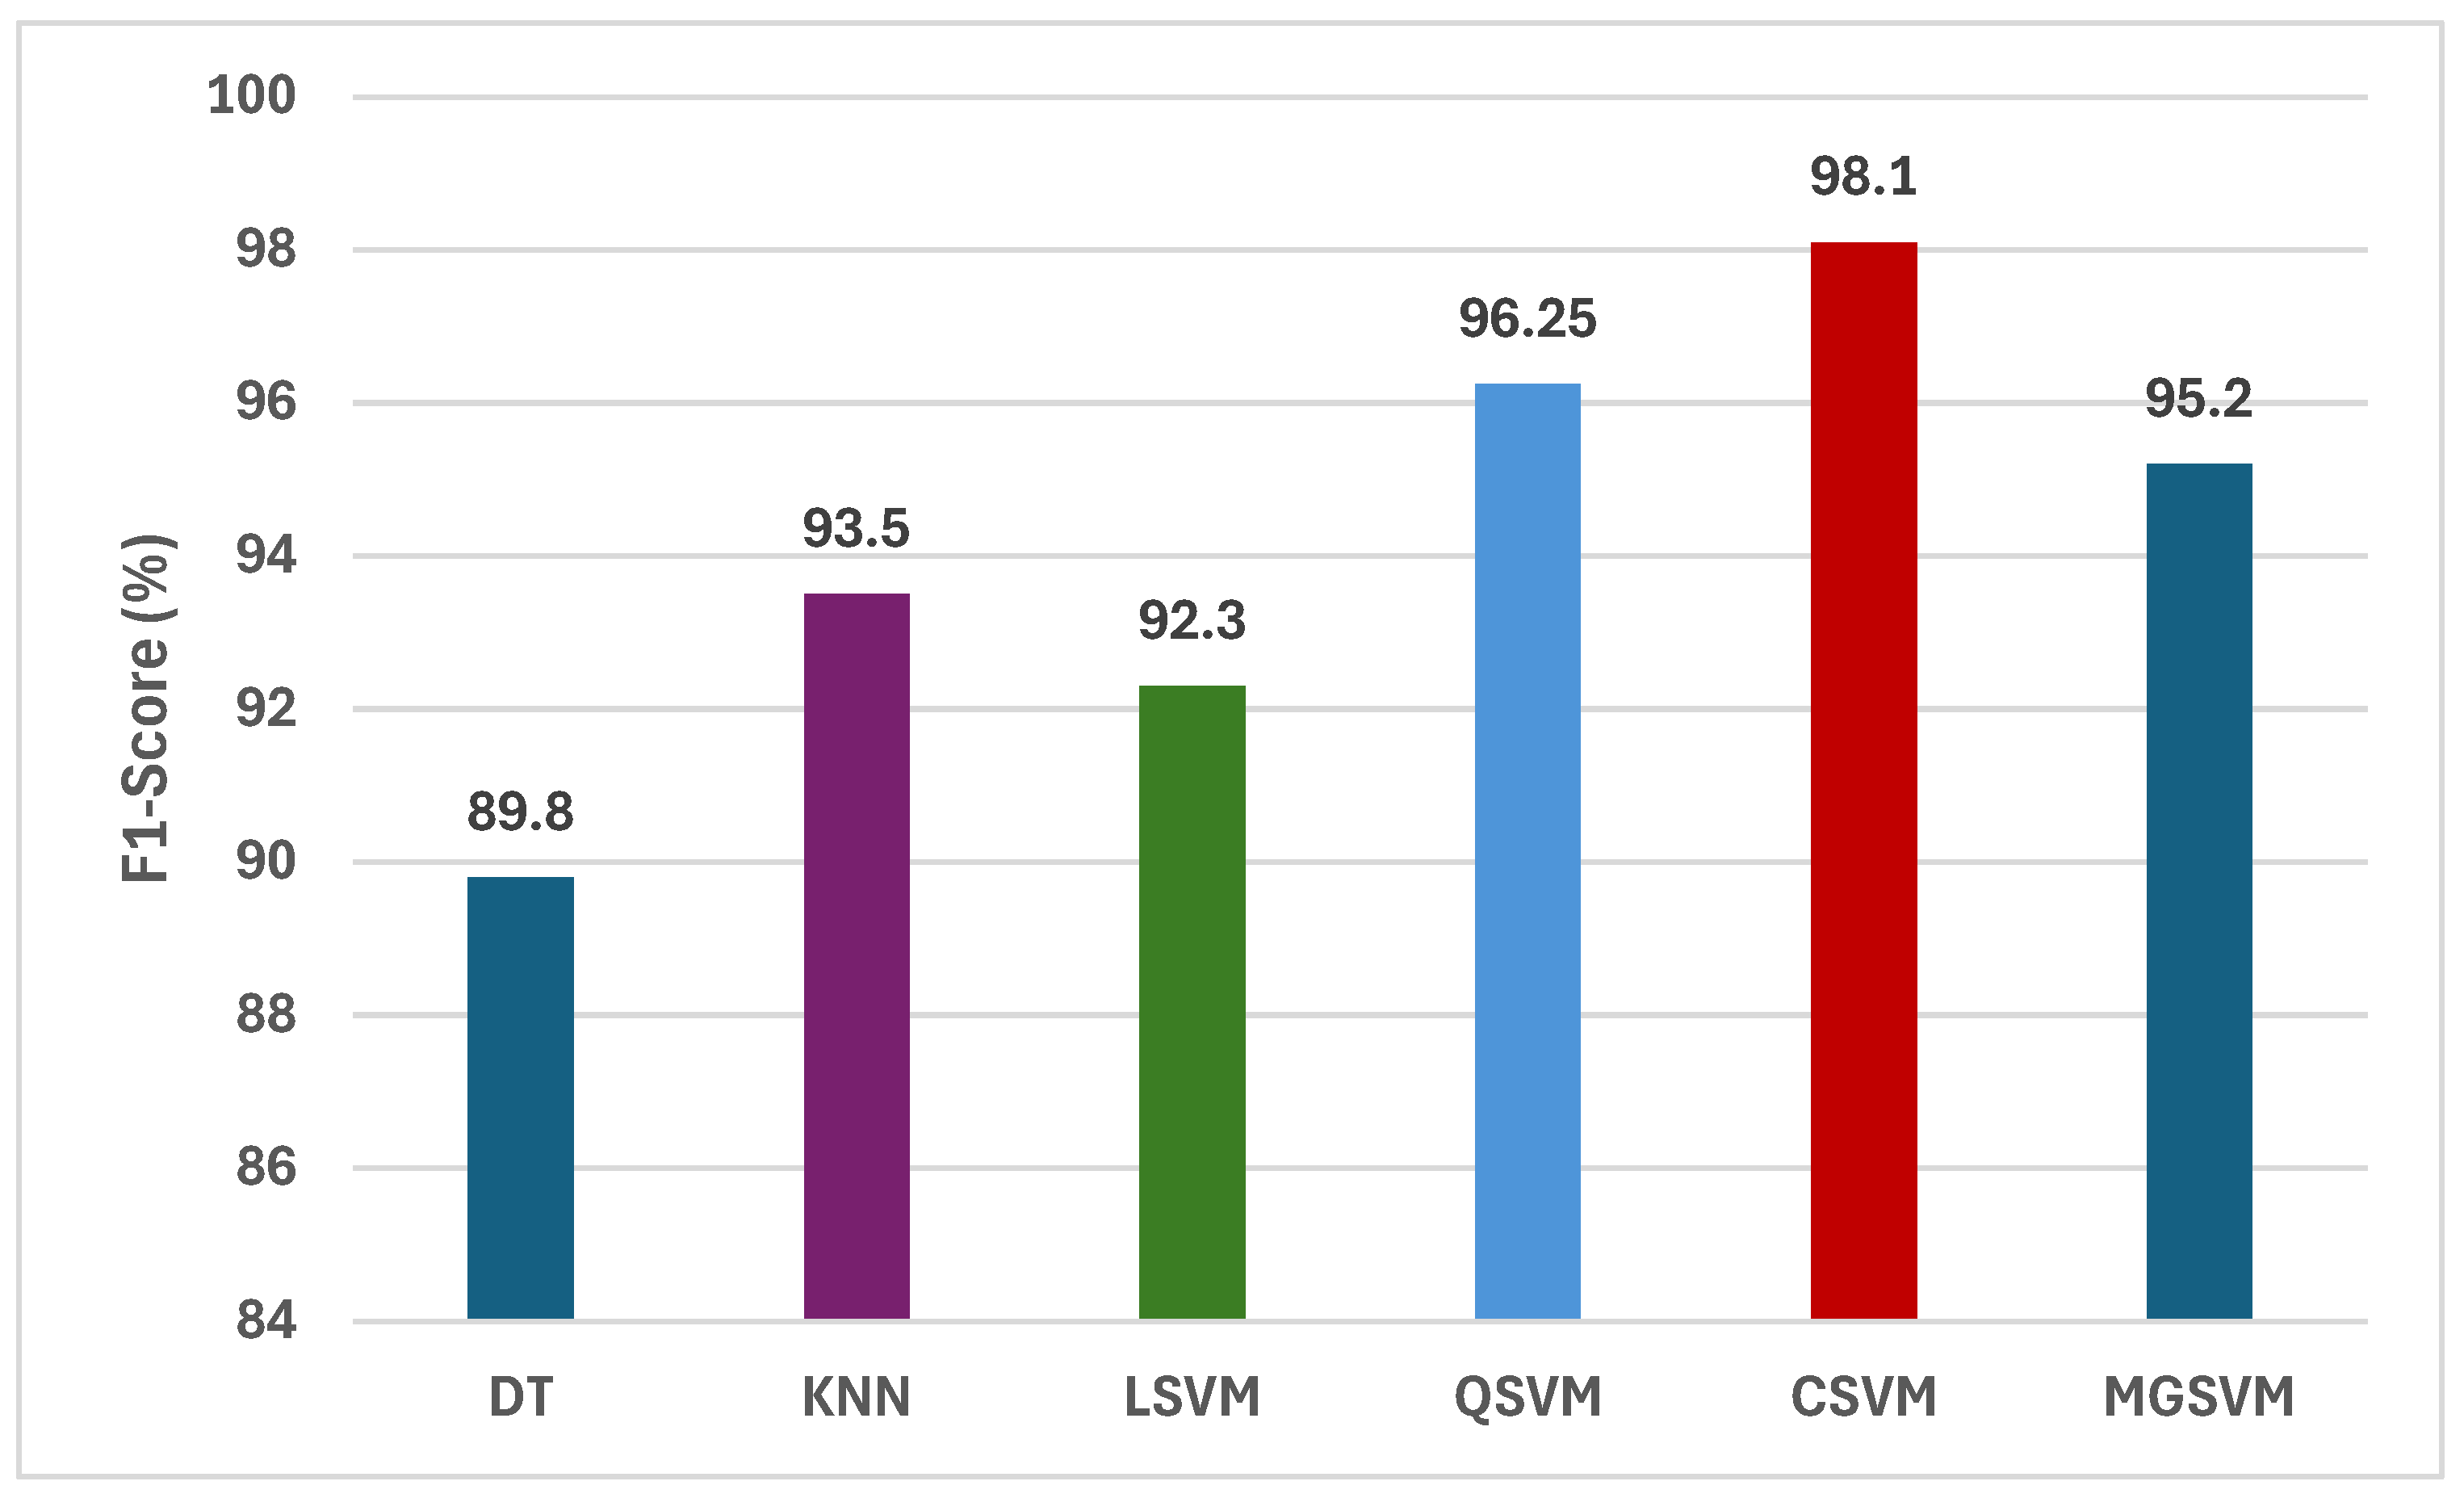
Figure 4 illustrates a comprehensive assessment of the F1-scores attained by six machine learning classifiers trained on the merged handcrafted feature sets, encompassing statistical, GLCM, and LBP features. Analysis of the F1-scores for the six classifiers reveals that CSVM and MGSVM constantly attain the greatest outcomes, at 98.14% and 95.20%, respectively. The findings demonstrate that both SVM-based classifiers are exceptionally proficient in managing the high-dimensional feature space generated by the amalgamation of statistical, GLCM, and LBP features. The QSVM demonstrates remarkable performance, attaining an F1-score of 96.25%, while the KNN follows with an F1-score of 93.50%. Conversely, DT and LSVM demonstrate comparatively lower F1-scores, recorded at 89.80% and 92.30%, respectively. This difference highlights the necessity of choosing suitable classifiers that can efficiently utilize the extensive information offered by the amalgamated handcrafted features.
5.3. Hybrid Features Results
The outcomes of merging every deep feature collection with the aggregate handcrafted attributes that are fed into the machine learning classifiers will be shown in this section.
Table 3 presents an assessment of the presented CAD system’s capability by integrating deep features from EfficientNetB0, MobileNet, and ResNet-18 with the aggregated handcrafted features. The results emphasize the advantages of combining handcrafted features with deep features, demonstrating enhanced classification accuracy in the majority of configurations relative to the exclusive use of deep features. The incorporation of handcrafted attributes in EfficientNetB0 markedly enhanced accuracy for simpler classifiers such as DT, elevating it from 90.1% to 95.2%. The KNN, LSVM, QSVM, and MGSVM classifiers exhibited only slight enhancements, with QSVM attaining 99.0% accuracy and CSVM achieving the highest accuracy of 99.2%. The incorporation demonstrated the efficacy of hybrid features in enhancing consistency as well as efficiency throughout different classifiers.
MobileNet exhibited strong performance both individually and in conjunction with handcrafted features. The incorporation of handcrafted features enhanced the accuracy of DT from 88.6% to 96.2%, highlighting the significance of merging features in less complicated models. The peak accuracy was attained with CSVM, achieving 99.5% using the hybrid feature set, shortly followed by QSVM and MGSVM at 99.4%. These findings demonstrate the enhanced efficacy of MobileNet’s deep features, strengthened by additional data gathered from handcrafted features. The incorporation of handcrafted features in ResNet-18 enhanced the DT accuracy from 92.7% to 96.4%, demonstrating the efficacy of feature fusion. Although the enhancements for other classifiers were not as significant, the QSVM and CSVM classifiers attained an accuracy of 99.4% when employing the hybrid feature set. The overall accuracy of MGSVM stood steady at 99.2%, indicating the reliability of ResNet-18’s feature extraction capacities.
Critical insights from these findings indicate that the combination of deep features with handcrafted features regularly boosts classification accuracy, especially for DT. The enhancements for classifiers like QSVM and CSVM, although more modest, emphasize the valuable contribution of handcrafted features in optimizing the classification process. Of the three deep networks, MobileNet demonstrated the greatest overall accuracy when integrated with handcrafted features, affirming its exceptional adaptability for this hybrid methodology. The results illustrate the effectiveness of integrating deep features with handcrafted features to enhance the diagnostic performance of the CAD system. The findings highlight the significance of multi-domain feature integration, offering a robust mechanism for enhancing the precision and dependability of lung and colon cancer identification in biomedical informatics applications.
The findings from
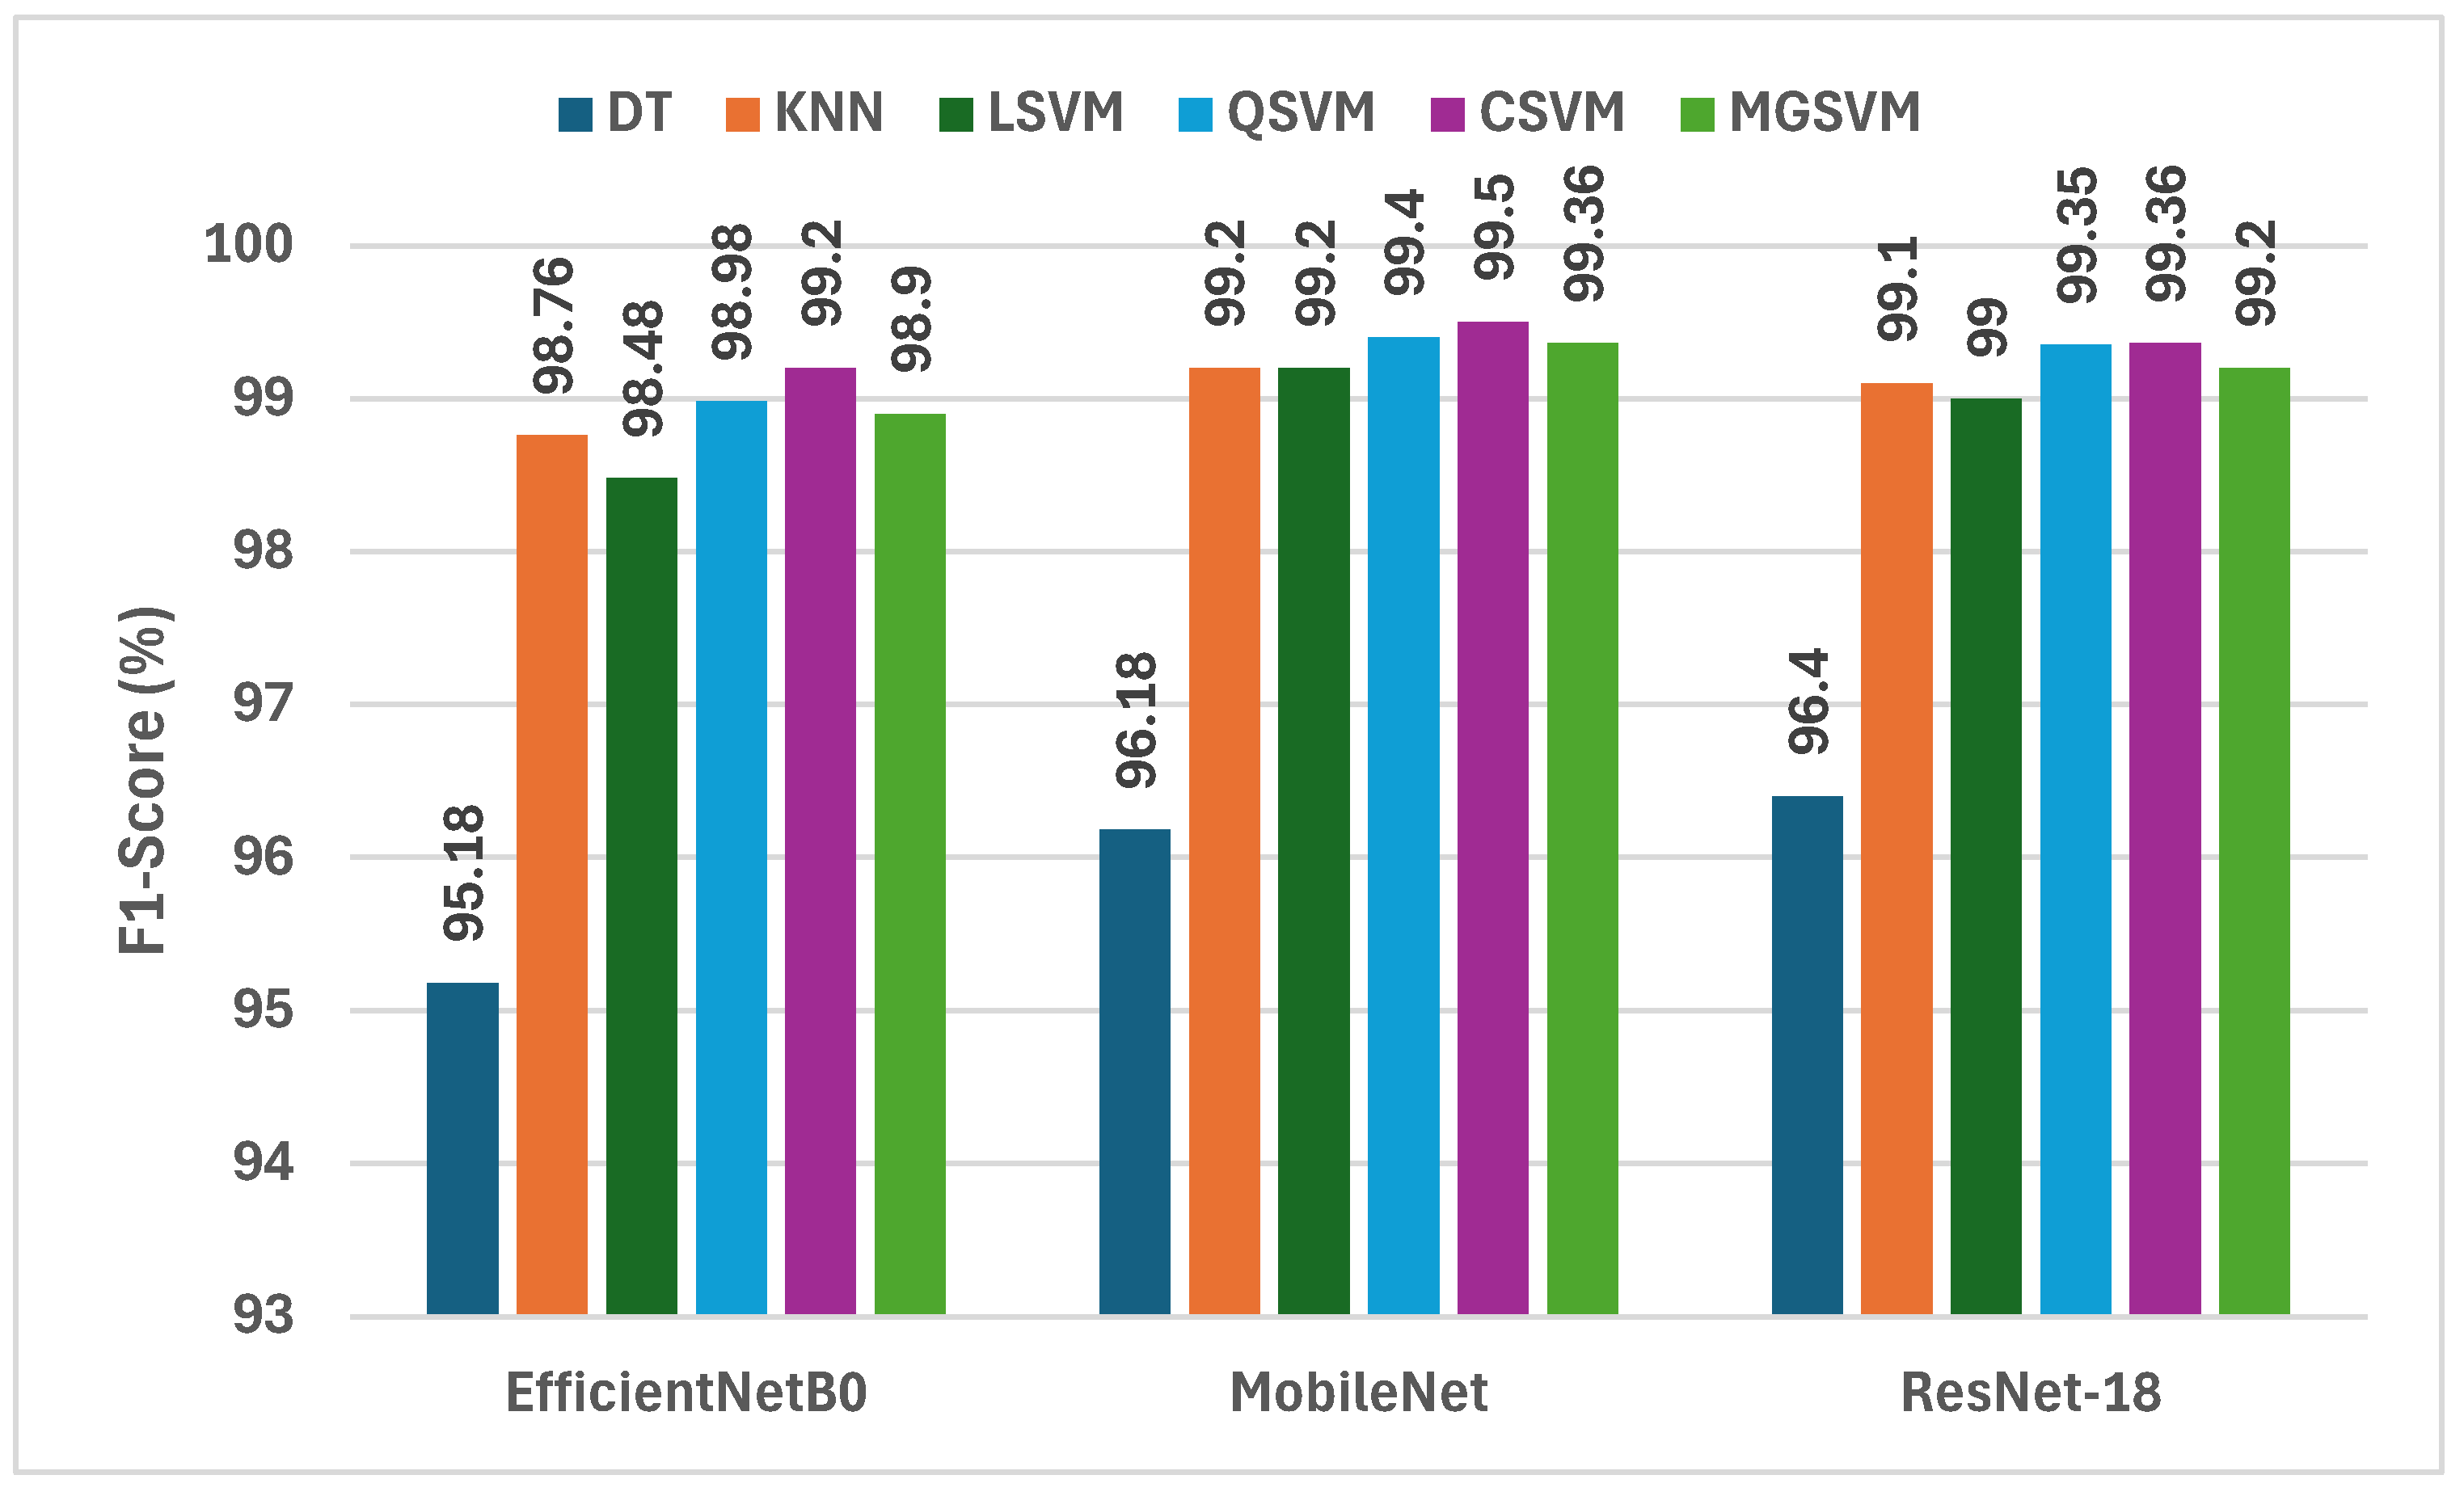
Figure 5 give an in-depth analysis of the F1-scores obtained by six machine learning classifiers using deep features taken from three incredibly lightweight CNNs that are EfficientNetB0, MobileNet, and ResNet-18 in conjunction with fused crafted features. Analysis of the F1-scores from the three deep CNNs shows that MobileNet has the highest F1-scores more frequently than EfficientNetB0 or ResNet-18. For example, the F1-scores for MobileNet ranged from 96.18% DT to 99.50% CSVM, which shows that it has the highest capability to capture discriminative features for lung and colon cancer classification. Like MobileNet, ResNet-18 obtained competitive F1-scores for lung and colon cancer classification from 96.4% DT to 99.36% for CSVM and MGSVM. EfficientNetB0 obtained marginally lower F1-scores of 95.18% for DT to 99.20% for CSVM. The outcomes indicate that all three CNNs performed exceptionally well; however, MobileNet was the most effective architecture for feature extraction in the hybrid modeling approach that was performed for lung and colon cancer classification.
CSVM and MGSVM consistently exhibit the highest F1-scores across all three CNNs in the classifiers list. CSVM is able to achieve F1-scores of 99.20%, 99.50%, and 99.36% for EfficientNetB0, MobileNet, and ResNet-18, respectively, while MGSVM closely follows with F1-scores of 98.90%, 99.36%, and 99.20%. This observation suggests that both SVM-based classifiers are effective in dealing with the high-dimensional feature space created from the fusion of deep and handcrafted features. In contrast, DT performs least effectively, resulting in F1-scores of 95.18%, 96.18%, and 96.40% for EfficientNetB0, MobileNet, and ResNet-18, respectively. This disparity highlights the need for appropriate classifiers that can take advantage of the wealth of information represented by the hybrid feature set.
5.4. Outcomes of Feature Selection
The following paragraphs present and analyze the outcomes of the classification algorithms developed using the integrated deep learning features from the three CNNs and the aggregated handcrafted features following the application of mRMR feature selection.
Table 4 shows the classification accuracy of these machine learning models. The experimental findings illustrate the effectiveness of integrating deep learning attributes of three CNNs with handcrafted attributes, succeeded by mRMR feature selection. The performance evaluation of various feature set lengths demonstrates continual enhancements in classification accuracy with a rise in the number of attributes, ultimately stabilizing at elevated feature counts. The DT classifier exhibited the least impressive performance across all classifiers, yet it attained commendable accuracy rates between 92.7% with 10 features and 97.3% with 100–110 features. This incremental enhancement indicates that the DT classifier benefits from added discriminatory attributes, although its performance enhancements cease after 60 attributes, sustaining roughly 97% accuracy.
The KNN classifier demonstrated enhanced performance, increasing from 94.8% with 10 attributes to 99.7% with 100–110 variables. Significant enhancements were noted when augmenting from 10 to 20 variables (94.8% to 98.3%), and from 20 to 30 variables (98.3% to 98.9%), demonstrating the classifier’s proficient use of the chosen feature sets. All SVM variants exhibited strong performance across various feature set sizes. The LSVM attained accuracies between 94.8% and 99.6%, whereas the QSVM demonstrated marginally superior performance, achieving 99.7% accuracy with 100 variables. The CSVM exhibited comparable proficiency, attaining 99.7% accuracy with 90 features and sustaining this performance with an increased number of features. The MGSVM repeatedly exhibited strong performance, achieving a maximum accuracy of 99.7%, comparable to other SVM variants.
A significant observation is the declining returns in accuracy enhancement over 80–90 variables for all classifiers. This indicates that although the feature selection process successfully determines the most pertinent attributes, there is an optimal size for the feature set above which extra attributes contribute negligibly to classification performance. The findings demonstrate that integrating deep learning features from various CNNs with meticulously chosen handcrafted features via mRMR yields a resilient feature set that attains elevated classification accuracy across diverse classifier models.
The findings displayed in
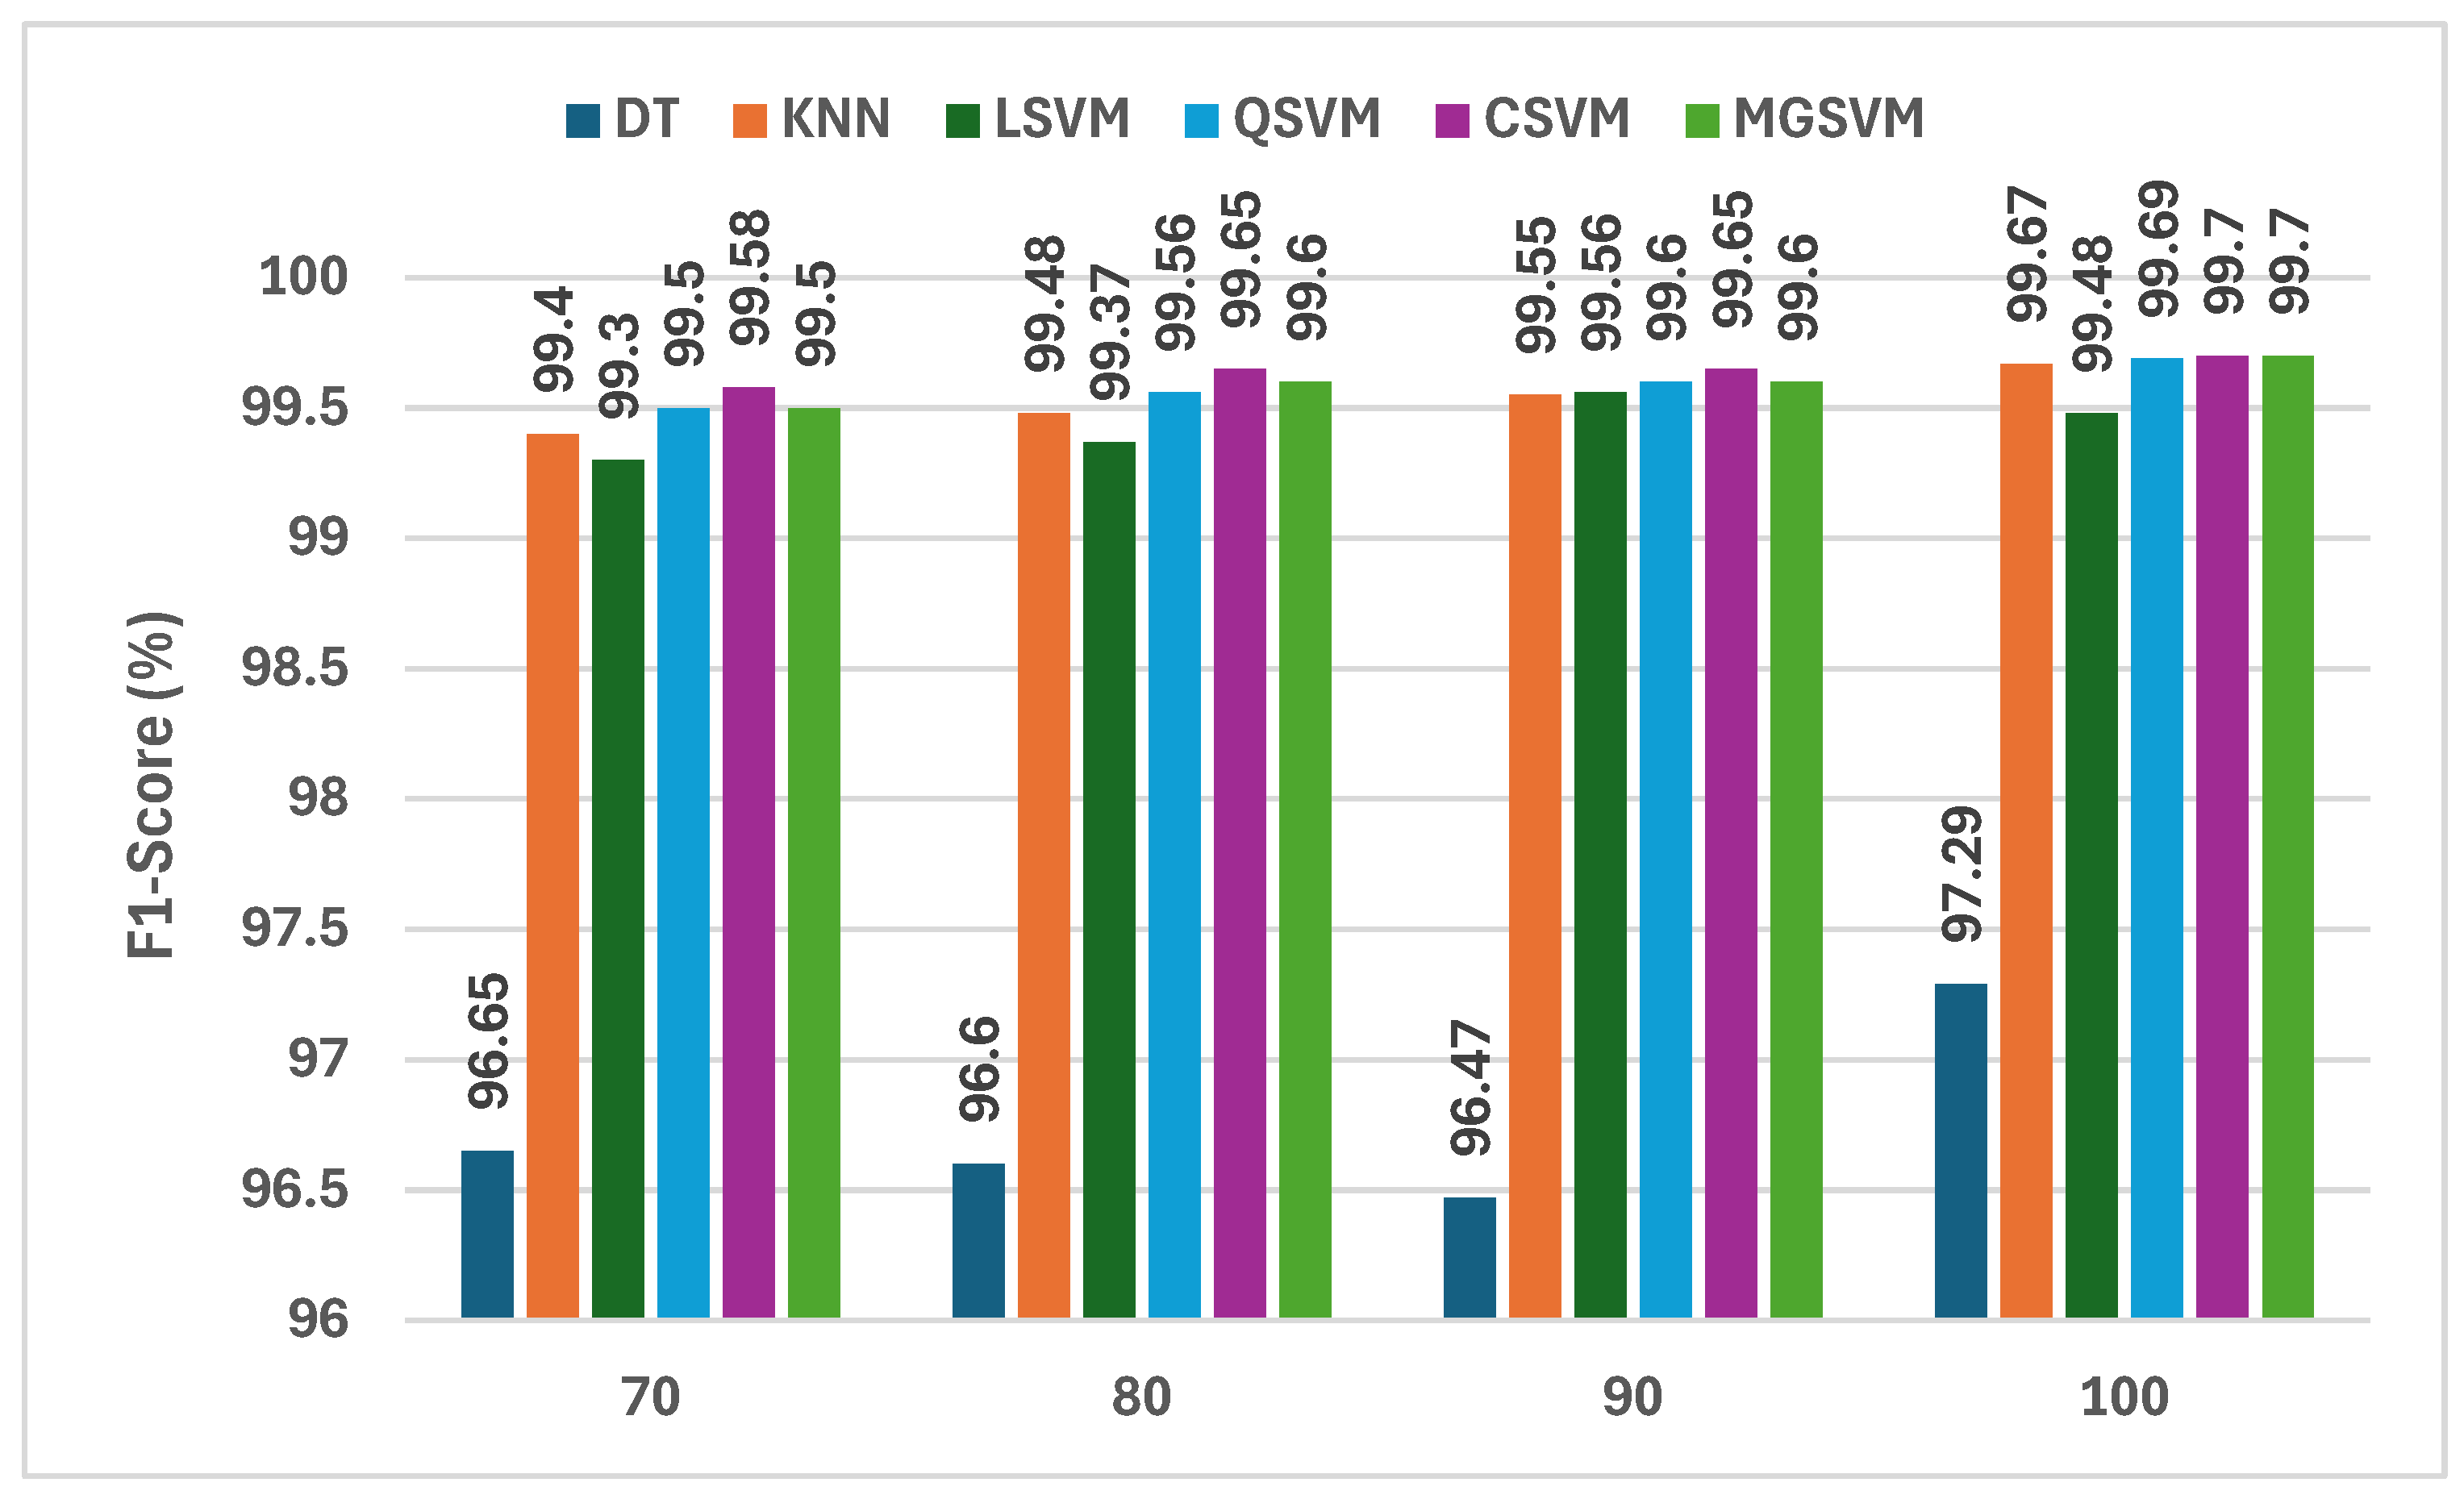
Figure 6 provide a continuous assessment of the F1-scores of six machine learning classifiers trained using the fused deep learning features from three lightweight CNNs in addition to the handcrafted features following the mRMR feature selection method. The analysis of the F1-scores for each classifier demonstrates that the CSVM classifier has the best F1-scores, at 99.70%, with 100 features selected. Hence, this indicates that the CSVM classifier is highly capable of dealing with the high-dimensional feature space created by fused features of deep learning and handcrafted features. The MGSVM classifier is equally capable of handling the high-dimensional space, with F1-scores of 99.60% and 99.70% using 90 and 100 features, respectively. The KNN classifier also performs well, with F1-scores between 99.40 and 99.67 as the number of features increases. The DT classifier exhibits relatively lower performance, with F1-scores ranging from 96.65% to 97.29%, demonstrating its inadequacies in exploiting the vast amount of data offered by the hybrid feature set.
One of the notable points highlighted in
Figure 6 is the increase in the F1-scores as the number of selected features grows. For instance, the F1-score for CSVM improved from 99.58% with 70 features to 99.70% with 100 features, indicating that creating the most relevant set of selected features is essential, specifically when using mRMR. As mRMR removes redundant or noisy features and selects the most discriminative features, the classifiers were probably generalizing better. Overall, the F1-scores across all classifiers were sufficiently high, demonstrating the general applicability and robustness of the proposed hybrid approach that built off the strengths from both deep learning and traditional feature extraction methods, especially for CSVM and MGSVM.
Table 5 presents a thorough assessment of the performance of different classifiers developed using fused deep-learning features from three CNNs and integrated handcrafted features, subsequent to the implementation of the mRMR feature selection method. The evaluated performance metrics include sensitivity, specificity, precision, F1-score, and MCC. The DT classifier attained a sensitivity equal to 97.29%, specificity equivalent to 99.32%, precision corresponding to 97.29%, F1-score reaching 97.29%, and MCC equal to 96.61%. The findings demonstrate that the DT classifier is exceptionally proficient in accurately identifying true positive cases, exhibiting a high level of precision and dependability. Nonetheless, in comparison to other classifiers, its performance is marginally inferior, especially regarding sensitivity and MCC. The KNN classifier exhibited outstanding performance, achieving sensitivity, specificity, precision, F1-score, and MCC of 99.67%, 99.92%, 99.67%, 99.67%, and 99.59%. The metrics indicate that the KNN classifier demonstrates high accuracy and reliability, exhibiting minimal false positives and false negatives. Its performance ranks among the highest of all assessed classifiers, rendering it a formidable option for the classification task.
The LSVM classifier demonstrated robust performance, achieving a sensitivity of 99.48%, specificity of 99.89%, precision of 99.48%, F1-score of 99.48%, and MCC of 99.36%. The LSVM classifier’s elevated specificity and precision demonstrate its efficacy in accurately identifying true negative instances while sustaining a high overall accuracy level. The QSVM classifier attained a sensitivity equal to 99.68%, a specificity corresponding to 99.92%, a precision equivalent to 99.68%, an F1-score equal to 99.68%, and an MCC reaching 99.59%. The results are analogous to those of the KNN classifier, demonstrating the QSVM’s resilience and dependability in classification tasks. Its elevated sensitivity and specificity highlight its capacity to precisely differentiate between positive and negative cases. The CSVM classifier demonstrated exceptional performance, achieving sensitivity, specificity, precision, F1-score, and MCC of 99.70%, 99.92%, 99.70%, 99.78%, and 99.62%. The CSVM classifier exhibits some of the highest metrics, demonstrating its exceptional capacity for accurate classification with minimal errors. The MGSVM classifier exhibited outstanding performance, achieving sensitivity, specificity, precision, F1-score, and MCC of 99.70%, 99.92%, 99.70%, 99.70%, and 99.60%. The results indicate that the MGSVM classifier is both efficient and trustworthy, with evaluation criteria closely aligning with those of the CSVM classifier.
The confusion matrices for the prominent classification models—Q-SVM, C-SVM, and MG-SVM—were examined to assess their ability to classify accurately.
Figure 7 illustrates these matrices, emphasizing the ratios of accurate and inaccurate predictions for every cancer subcategory. The results demonstrate that the classifications of colon adenocarcinoma, colon benign cells, and lung benign tumor were precisely identified, achieving flawless sensitivities across all three classification algorithms. Nonetheless, the lung squamous carcinoma and adenocarcinoma subtypes were identified as the most commonly misclassified category across the three models.
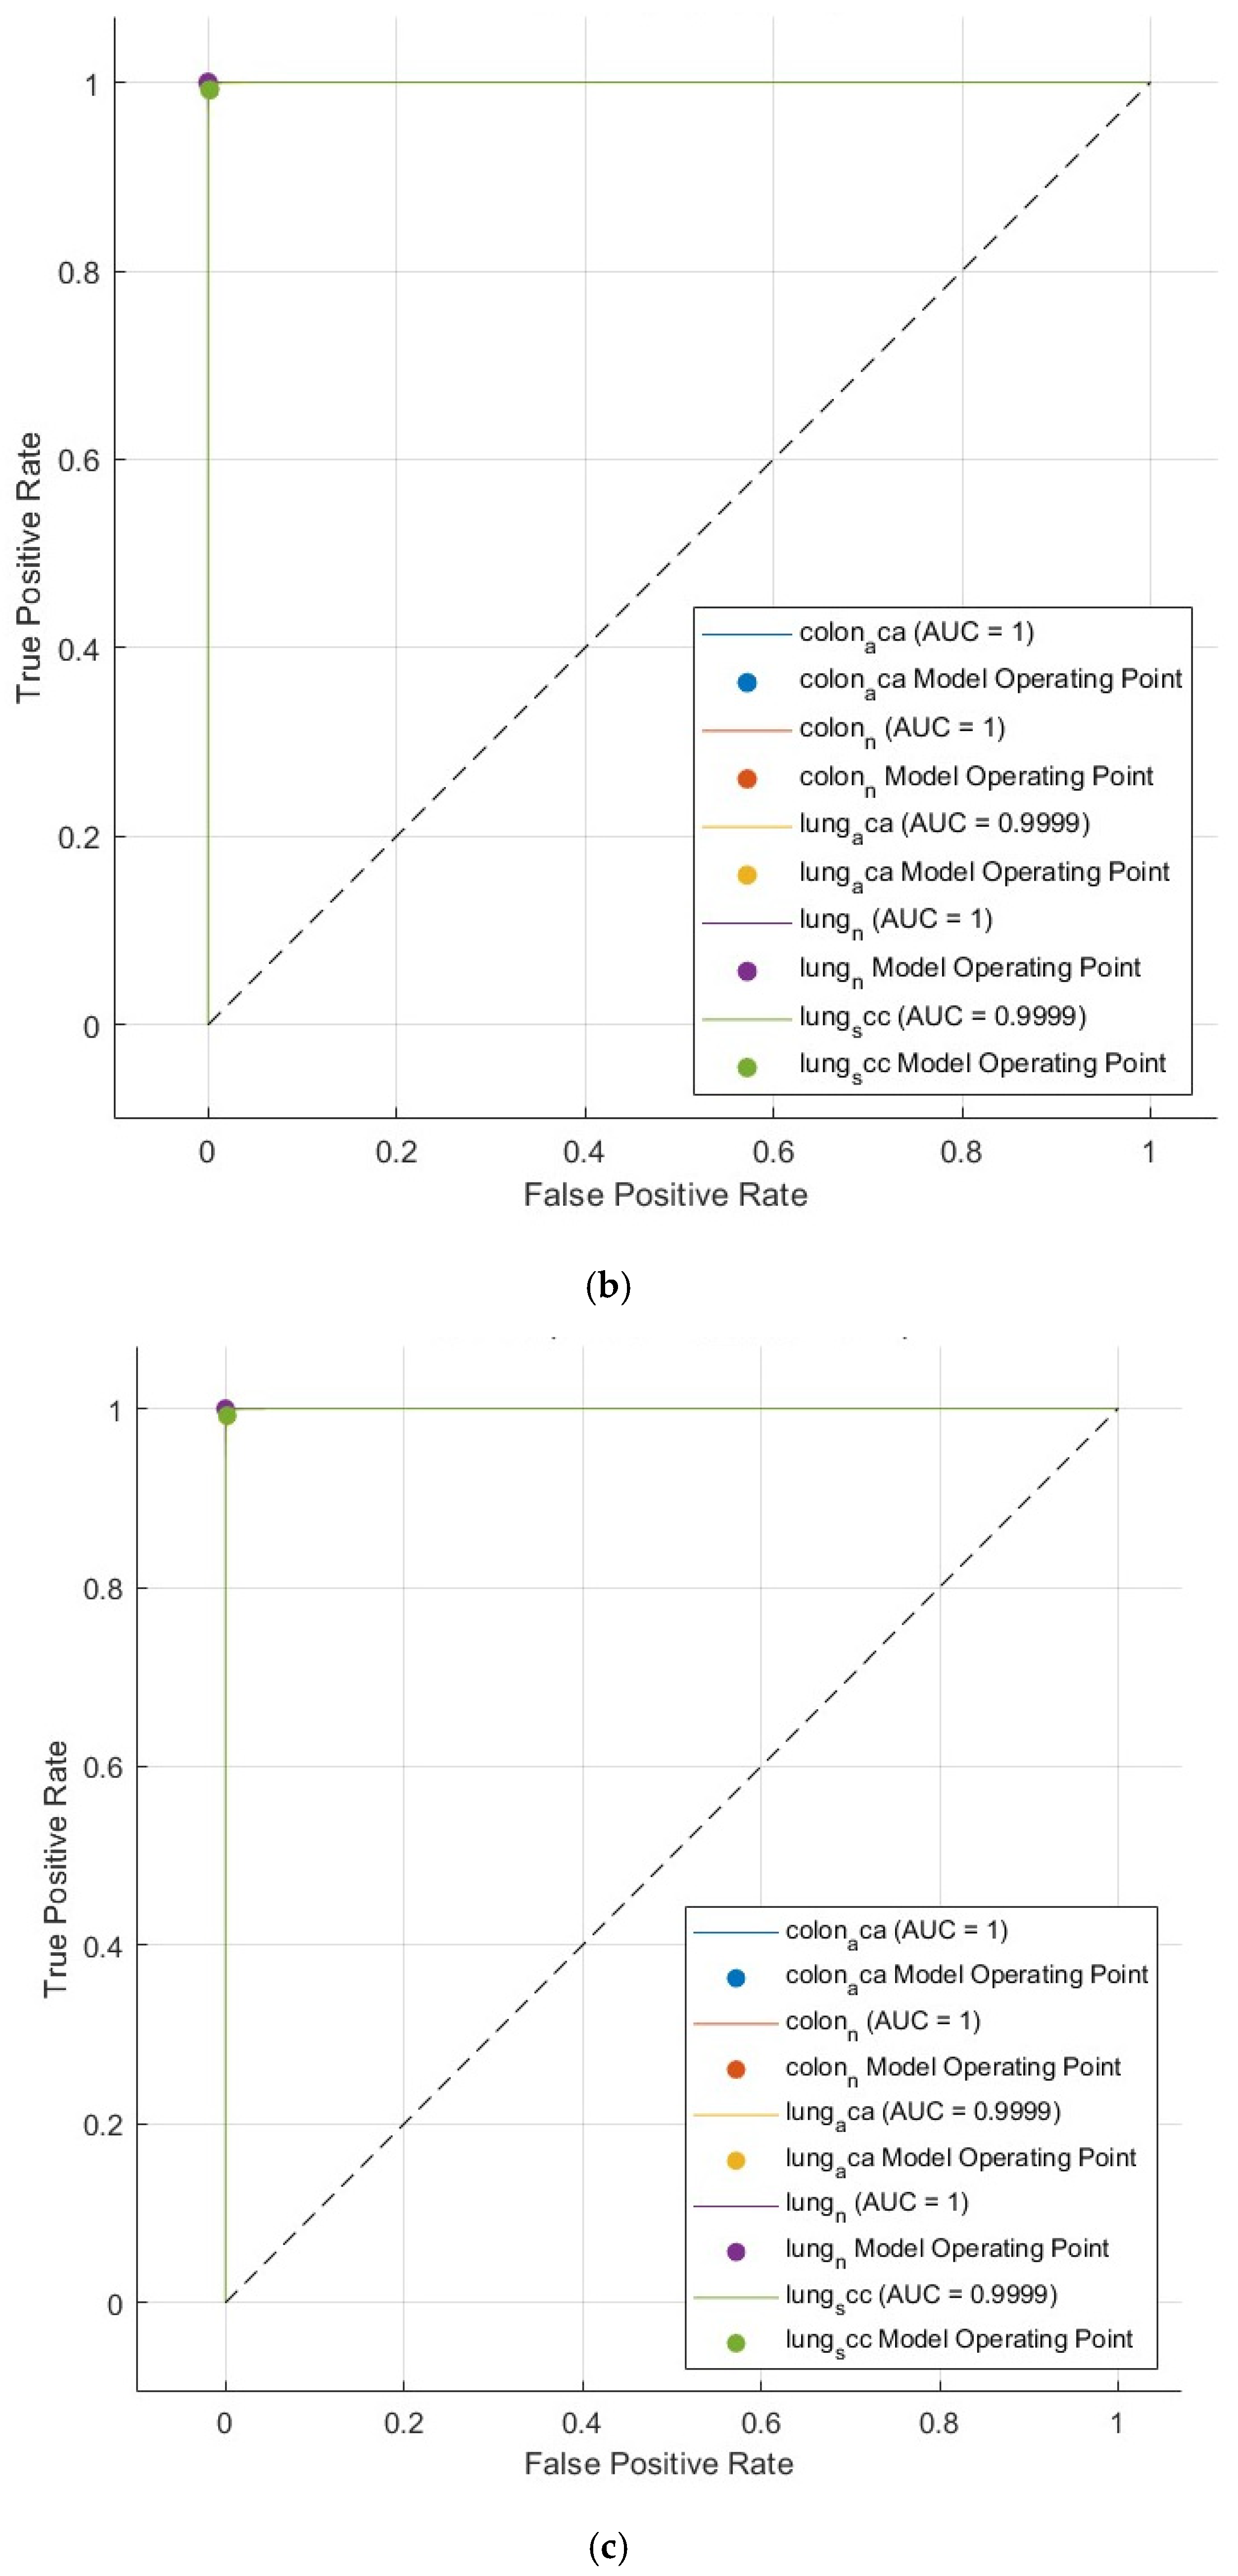
Furthermore, receiver operating characteristic (ROC) curves for the Q-SVM, C-SVM, and MG-SVM classifiers, which exhibited superior performance, can be seen in
Figure 4. These graphs illustrate the sensitivities in relation to one minus specificities, offering a visual depiction of classifier efficacy. AUC values approaching one signify highly effective classification.
Figure 8 points out that the AUC is one for all three classification algorithms, demonstrating their remarkable accuracy. These results validate that the proposed CAD system provides a highly precise, impartial, and economical methodology for detecting tumors.
6. Discussion
The present study introduces a hybrid CAD approach that combines deep-learning-derived attributes from three compact CNNs with handcrafted attributes, subsequently employing mRMR feature selection for the classification of lung and colon cancer.
Table 1,
Table 2,
Table 3,
Table 4 and
Table 5 and
Figure 3,
Figure 4,
Figure 5,
Figure 6,
Figure 7 and
Figure 8 cumulatively illustrate the effectiveness of the suggested approach in improving diagnostic accuracy, reliability, and efficiency. This section consolidates the principal findings and offers insights into the efficacy of the suggested approach.
Table 1 presents the independent performance of deep features derived from EfficientNetB0, MobileNet, and ResNet-18 when utilized with six classifiers. MobileNet continuously surpassed the other models, reaching the greatest classification accuracy of 99.4% with the MG-SVM classifier. This outstanding performance demonstrates MobileNet’s proficiency in feature extraction and classification. The results indicate that reducing the number of attributes to 30–40 using NNMF improved performance, with diminishing returns noted beyond this limit.
Table 2 assessed the efficacy of classifiers utilizing both singular handcrafted features and their aggregated set. Statistical features alone demonstrated strong performance, attaining 93.3% accuracy with CSVM. The integration of statistical, GLCM, and LBP features markedly enhanced classification accuracy for all classifiers, with CSVM achieving 98.1% accuracy. This enhancement highlights the synergistic relationship of multi-domain handcrafted features and their significance in attaining elevated diagnostic precision. The combination of deep learning attributes with manually crafted attributes, as illustrated in
Table 3, exhibited the complementary advantages of hybrid feature sets. The incorporation of handcrafted features enhanced the performance of all classifiers, especially simpler models such as DT, which experienced an accuracy increase from 90.1% to 95.2% for EfficientNetB0. MobileNet with CSVM attained the highest accuracy of 99.5%, demonstrating the benefits of feature fusion in enhancing classifier performance.
Table 4 examined the effect of mRMR feature selection on hybrid features in more detail. The results revealed steady enhancements in performance as the total number of chosen attributes rose, with performance settling at higher feature numbers. Despite having the worst overall performance, DT managed to attain a respectable 97.3% accuracy with 100–110 attributes. Other classification algorithms, such as KNN, QSVM, CSVM, and MGSVM, regularly achieved accuracy rates above 99.5%, highlighting the efficiency of the mRMR methodology in optimizing feature sets. The assessment measures in
Table 5 demonstrated the overall efficacy of the classifiers. KNN, QSVM, CSVM, and MGSVM appeared to be the most reliable models, reaching sensitivity, specificity, precision, and F1-scores above 99.6%, with MCC surpassing 0.995. Such metrics demonstrate the robustness and precision of the suggested hybrid methodology.
Figure 3 describes the confusion matrix that elucidates the classification efficacy of the highest-performing models. These matrices demonstrate a remarkably high count of accurately classified instances for both lung and colon cancer categories, with negligible misclassifications. The counts of true positives and true negatives predominate along the diagonal of the matrices, highlighting the models’ proficiency in accurately distinguishing between positive and negative instances. Misclassified instances, though minimal, remained consistently low across all classifiers, underscoring the efficacy of the proposed hybrid feature integration and selection strategy. These insights indicate that the system is highly suitable for practical diagnostic applications, providing both accuracy and dependability. Moreover, the ROC curves in
Figure 4, exhibiting an AUC value of 1 for QSVM, CSVM, and MGSVM, confirm the classifiers’ outstanding accuracy and reliability.
The results collectively demonstrate that the fusion of deep learning attributes from various CNNs with handcrafted features, alongside the implementation of mRMR feature selection, establishes a robust and efficient diagnostic system. The hybrid method effectively utilizes the complementary advantages of deep and manually crafted features, attaining superior classification performance. Furthermore, this study emphasizes the significance of feature selection in diminishing dimensionality and improving model generalization. These findings offer substantial insights into the capabilities of hybrid methodologies in medical informatics, especially concerning automated cancer diagnosis.
The suggested CAD framework, which incorporates various feature extraction techniques and utilizes sophisticated dimensionality reduction and feature selection processes, inherently heightens computational complexity. The hybrid strategy, integrating deep learning features with handcrafted attributes, necessitates greater processing time and memory resources than models that depend exclusively on deep features. To address this, this study leverages compact CNN structures (MobileNet, EfficientNetB0, and ResNet-18) and implements NNMF for feature reduction, thereby substantially decreasing the dimensionality of the extracted features prior to classification. Furthermore, this study employs the mRMR method to minimize redundant features, enhancing computational efficiency while maintaining classification efficacy.
Concerning dataset bias, the suggested research employs the LC25000 dataset, a recognized benchmark for the classification of lung and colon cancer. This dataset exhibits a balanced distribution among various cancer subtypes; however, possible biases may emerge from discrepancies in staining methodologies, scanning conditions, or the institutional origins of histopathological specimens. These aspects may influence the generalizability of our model to additional datasets from various medical centers. To mitigate this, this study employed comprehensive data augmentation techniques, such as scaling, flipping, translation, and shearing, to improve the model’s resilience to variations in image acquisition. Moreover, our feature selection methodology mitigates the impact of dataset-specific artifacts by emphasizing the most discriminatory and pertinent features across various instances.
The proposed hybrid approach of combining spatial features using deep learning with handcrafted statistical and textural features improves classification accuracy while retaining computational efficiency, which makes it an attractive option for use in a clinical implementation where automated histopathological analysis can support pathologists’ diagnoses of lung and colon cancer. Another advantage of the suggested system is that it is implemented using lightweight CNN architectures and efficient feature reduction and selection methods, allowing it to be used in constrained resource settings, such as smaller health systems, or even incorporated into telemedicine models. Further, the incorporation of handcrafted features, such as statistical, GLCM, and LBP attributes, guarantees that the framework retains both low-level textural patterns and high-level spatial representations, thereby increasing its robustness and adaptability to various clinical contexts. The proposed system can also be used as part of a large-scale screening program for cancers, leading to earlier detection and timely treatment in communities with limited access to specialized pathologists.
6.1. Comparisons with Previous CADs
This suggested CAD scheme was assessed in comparison to various existing state-of-the-art systems for the classification of cancer subcategories of the LC25000 dataset, as detailed in
Table 6. The comparison emphasizes the enhanced efficacy of the proposed method, which incorporates deep features from the three deep networks with handcrafted features, subsequently employing feature reduction through NNMF and feature selection via mRMR. The integration achieved a classification accuracy equal to 99.7%, sensitivity corresponding to 99.7%, specificity equivalent to 99.92%, precision equal to 99.7%, and an F1-score equal to 99.70%, exceeding or closely aligning with the top-performing approaches described in the literature.
Among current CAD systems, EfficientNet-based approaches, including those utilizing AdBet-WOA feature selection [
9], attained high accuracies of 99.96% alongside comparable sensitivity, specificity, and precision metrics. The CLAHE with MobileNet and DBN method [
30] exhibited an accuracy equal to 99.27%, whereas Capsule Networks [
37] attained a marginally superior accuracy of 99.58%. Notwithstanding these robust performances, the suggested CAD approach exhibited superior metrics for sensitivity and F1-score, demonstrating its reliability in accurately identifying true positive cases with minimal misclassifications. The VGG19-based CAD system [
19], integrated with PCA and handcrafted attributes, attained competitive outcomes, achieving an accuracy equal to 99.64% and a specificity corresponding to 100%. Nonetheless, its dependence on an extensive feature set (699 variables) demonstrates the efficacy of the presented system, which attains the same or higher performance with merely 100 chosen attributes. The CAD system [
31] that combines ResNet, EfficientNet, and other sophisticated CNNs with optimization algorithms like GWO and soft voting classifiers achieved an accuracy of 98.73%. The suggested method exhibits its efficacy without requiring complex ensemble models. The ShuffleNet-based framework [
34], employing DCRNN and BER, attained an accuracy of 99.22%, which is inferior to the measures of the proposed approach. Another significant competitor, DenseNet-121 [
40] integrated with RF, achieved an accuracy of 98.6%, thereby highlighting the benefits of the presented hybrid-features-based CAD methodology.
The proposed CAD system uniquely integrates multi-domain features while reducing computational complexity. By employing lightweight CNNs and choosing the 100 most pertinent features through mRMR, it attains optimal classification performance while minimizing model complexity and training duration. These results demonstrate the effectiveness and feasibility of the indicated methodology for biomedical informatics applications, especially in lung and colon cancer detection.
One important difference between the proposed method and the previous study [
14] reporting 100% accuracy is the operational complexity of the computer-aided diagnosis (CAD) system. Previous research used multiple preprocessing methods, which may improve accuracy but can also potentially increase the complexity of the computational pipeline considerably. The preprocessing methods can consist of processing operations such as image enhancement, noise reduction, and normalization, which add additional computational overhead and may not be able to implement models in low-computation settings. Another key limitation of the study [
14] is not using feature selection methods that can minimize any extracted features before classification. The proposed approach provides a valuable strategy to mitigate this issue by using feature selection to retain the more informative features and determine classification performance even with reduced dimensions in the feature set. This is a considerable improvement toward making the model generalizable and computationally lightweight when deploying in the real world.
Although prior research has utilized diverse feature selection methodologies, the proposed approach is notable for its selection of a markedly reduced set of 100 highly informative features, in contrast to the 445–699 features commonly preserved in previous research [
9,
34,
36]. This, along with the utilization of lightweight CNNs, facilitates a robust equilibrium among accuracy and computational effectiveness.
While the proposed method provides an outstanding accuracy of 99.7%, which is marginally lower than the 100% achieved in the prior study [
14], it affords the benefit of achieving high accuracy and computational efficiency. The proposed method acquires efficiency by eliminating preprocessing steps and including feature selection and lightweight CNNs, which allows the CAD system to be lightweight and interpretable while still providing near-perfect classification performance. These upgrades entail that the proposed approach is effective and more suited to being implemented in clinical and real-time settings, emphasizing its value as a worthy consideration in histopathological image classification.
6.2. Comparative Analysis in Terms of Number of Parameters and Deep Layers
In CAD systems, for the identification of cancer, decisions regarding the architecture of CNNs play a role in their performance and computational effectiveness. A comparative analysis of current CAD systems and the proposed model in terms of the number of deep layers and parameters and this comparison is illustrated in
Table 7. As shown in
Table 7, heavy models such as VGG-16 and VGG-19 [
6,
19,
58] had deep architectures defined by 16–19 layers and 138–143 million parameters, respectively; hence, they are deeper networks with high representational power and low computational efficiency. EfficientNet Large [
1,
9] pushed complexity further, with the architecture having roughly 550 layers and 66 million parameters, prioritizing diagnostic accuracy over computational requirements. As shown in Ref. [
35], this CAD incorporates a combination of multiple heavy architectures, ResNet-50 (50 layers, 25M parameters), InceptionV3 (159 layers, 23M parameters), DenseNet-121 (121 layers, 8M parameters), and added Kernel Extreme Learning Machine (KELM). The ensemble model presents competitive accuracy (0.9900 F1-score), indicating the limitation of the ensemble model with three heavy models (56M parameters total), reflecting the established trade-off between accuracy and efficiency of the ensemble using the model with differing heavy architectures. Alternatively, lightweight CNNs, such as MobileNet [
30,
36] and ShuffleNet combined with DCRNN [
34], offer a more streamlined design (28 layers, 4.2M parameters; and ≈58 layers, 5.4M parameters, respectively). Lightweight models can decrease computational costs by over 90% in comparison to heavy models (e.g., 4.2M vs. 138M parameters) while competing in accuracy (e.g., 0.9927 vs. 0.9997), therefore rendering them suitable models for constrained environments. In other words, the overall costs would be 4.2M compared to 138M, and hyperfocal modeling both maintained overall accuracy, e.g., 0.9927 for the lighter model compared to −0.9997 for the heavier model, a similar accuracy despite the difference of over 90% in overall cost by millions.
Ref. [
36] clearly illustrates the potential to develop hybrid lightweight systems, where the proposed architectures leverage a combination of MobileNet, ShuffleNet, and SqueezeNet (18 layers, 1.2M) with feature transforms (FWHT, DWT) and SVMs, achieving a 0.9960 F1-score (~10.8M total parameters). This indicates that the utilization of a lightweight heterogeneous model for an ensemble exhibits the potential to achieve similar accuracy, compared with heavy architecture CNN, while achieving more computational efficiency.
The proposed model in the current study improves upon this equilibrium by utilizing ResNet18 (18 layers, 11.7M parameters), MobileNet (28 layers, 4.2M parameters), and EfficientNetB0 (18 layers, 5.3M parameters) in conjunction with feature selection algorithms, such as non-negative matrix factorization (NNMF) and minimum redundancy maximum relevance (mRMR). This dependence reduces redundancy, constrains the model to 100 features (compared to 445–699 in the other model), and attains an F1-score of 0.9970 with just 21.2M total parameters—much less than heavy models individually. The trade-off is strategic; as illustrated in [
36], lightweight architectures sacrifice marginal accuracy for efficiency, while hybrid models benefit from the use of dimensionality reduction to sustain performance without incurring excessive computations. This analysis suggests that “light CNNs”, with fewer layers and parameters, are more than sufficient to attain diagnostically relevant accuracy while remaining computationally efficient—an important factor in the clinic, where time and resources are limited. Studies such as [
35,
36] have emphasized the spectrum of design perspectives, from heavy ensembles favoring accuracy to lightweight hybrids stressing efficiency; this work strikes a balance by utilizing smart feature selection.
6.3. Limitations and Future Work
Although the suggested CAD system demonstrates notable effectiveness in classifying lung and colon cancer, specific limitations require consideration. The system’s assessment was initially performed using the LC25000 dataset, which, while extensive, may not adequately represent the diversity and variability of real-world histopathological photos. The dependence on this dataset may restrict the applicability of the method to additional datasets or imaging techniques, such as radiological or genomic data, commonly utilized in clinical practice. The proposed approach incorporates deep learning attributes from three lightweight CNN models in conjunction with handcrafted features. This hybrid method enhances classification accuracy, but the feature fusion and selection process adds extra computational burden. While mRMR effectively diminishes feature dimensionality, optimizing the system for real-time clinical applications continues to pose a challenge. This constraint is especially critical in resource-limited settings where computational resources are scarce.
The present CAD system is solely concentrated on lung and colon cancer, rendering its applicability to other kinds of tumors or illnesses unexamined. The efficacy of its performance in identifying multi-class or overlapping conditions has yet to be investigated, constraining its applicability in wider diagnostic scenarios. Moreover, although the proposed CAD system exhibited elevated classification accuracy, its interpretability for clinical decision making remains limited. The system lacks comprehensive visual interpretations or rationales for its classifications, which are essential for fostering confidence and embrace among physicians.
Future endeavors could improve the system’s applicability and efficacy. Incorporating multiple datasets from various sources into the assessment would enhance the thoroughness of the system’s generalizability validation. Integrating data from auxiliary imaging techniques, such as CT or MRI scans, could enhance its efficacy in a multi-modal diagnostic framework. Furthermore, the investigation of the incorporation of other feature selection and optimization methods, including metaheuristic algorithms, may diminish computational burden while preserving or improving classification efficacy. Future research may explore the application of sophisticated deep learning architectures, particularly transformer-based models, which have demonstrated considerable potential in various fields, to enhance feature extraction efficacy. In addition, the adaptation of explainable artificial intelligence techniques will help doctors understand how deep networks achieve the decision. Furthermore, follow-up work could focus on possibly placing this system into the cloud for diagnostic purposes or integrating it into a digital diagnostic workflow, thus supporting clinical implementation.
To mitigate the challenges posed by variability in imaging conditions, the integration of domain adaptation strategies or the training of the system with supplementary datasets that replicate real-world variations could improve its robustness. Ultimately, prospective studies with clinical validation are crucial for evaluating the system’s effectiveness in practical applications. In order to verify the CAD system’s efficacy in clinical settings and help move it from research to practice, partnerships with healthcare organizations may be able to offer insightful information. These strategies would guarantee that the suggested CAD approach not only enhances the forefront of biomedical informatics but also meets essential requirements in cancer diagnostics.


