Abstract
This paper provides an in-depth literature review on image processing techniques, focusing on deep learning approaches for anomaly detection and classification in photovoltaics. It examines key components of UAV-based PV inspection, including data acquisition protocols, panel segmentation and geolocation, anomaly classification, and optimizations for model generalization. Furthermore, challenges related to domain adaptation, dataset limitations, and multimodal fusion of RGB and thermal data are also discussed. Finally, research gaps and opportunities are analyzed to create a holistic, scalable, and real-time inspection workflow for large-scale installation. This review serves as a reference for researchers and industry professionals to advance UAV-based PV inspection.
1. Introduction
Photovoltaic (PV) energy constitutes one of the principal renewable and clean energy sources worldwide, with a cumulative global capacity of 1642 GW at the end of 2023 [1]. The capacity additions utilizing renewable electricity sources reached 510 GW in 2023, representing the most rapid growth in the last two decades at 50% [2], with PV-based electric energy accounting for three-quarters of it. It harnesses the sun’s potential and converts it into electrical energy via the photovoltaic effect [3]. However, installed PV systems may fail to deliver the estimated power in the event of faults and defects that impede their performance. Anomalies can occur due to environmental factors such as dust, foreign objects obstructing the received irradiation, and snow [4]. The PV systems can also experience electrical issues that affect their components and cause energy dissipation [4]. Furthermore, degradation over time can result in energy loss and increase the discrepancy between the estimated and produced energy [5]. Consequently, researchers are currently focusing on preventive and predictive maintenance to detect these anomalies in the preliminary stages. Thus, they adjust their O&M operations and take action to prevent energy loss that affects the Return On Investment (ROI) [6]. Nevertheless, detecting and localizing these anomalies in large-scale installations using manual techniques and electrical data can be challenging [7]. The former depends on the available human resources, the area covered by the installation, and the tools deployed for inspection (IR camera, I-V tracers, etc.). The latter can detect anomalies at the string level, which necessitates the inspection of individual panels in the affected strings. Electrical approaches are intrusive and insufficiently rapid to inspect large-scale installations and require expert knowledge to interpret and inspect effectively [7].
1.1. Types of Anomalies and Detection Methods
An anomaly, also referred to as a fault or defect, is a deviation of the system from its normal behavior, sudden breakdown, or power loss due to various factors such as environmental stresses [8]. Each anomaly possesses a distinct signature and pattern that enables experts to determine its nature and cause. Consequently, they select the appropriate tools required to detect each type effectively. Electrical data that characterize the system’s output facilitate the detection of abnormal behavior in comparison to normal behavior under specific weather conditions. In offline scenarios, this can be detected using I-V tracers. These instruments generate the I-V and P-V characteristics while measuring the temperature, irradiance, and standard curve under Standard Test Conditions (STCs) [9]. This enables operators to analyze the differences between curves and predict anomalies affecting the system. Analysis of the I-V curve can aid in detecting electrical component defects and environmental factors such as aging, partial shading, short circuits, and cracks [9,10,11]. However, this method is time-consuming, requires human resources for large-scale installation, and necessitates the system to be offline to measure the performance of the tested panels, which results in additional energy loss [12]. Figure 1 illustrates an example of I-V curves with different crack (a) and hotspot (b) representations.

Figure 1.
Examples of anomaly representations in I-V curves [11]: (a) shows variations in the I-V curves with the number of cracked substrings in comparison to the normal module (more cracks further reduced the performance), and (b) shows the impact of hotspots in different modules in comparison with the normal module.
Detecting and classifying anomalies using online data requires more sophisticated data analysis methods, such as thresholding and machine learning algorithms, to utilize their automation. The study presented in [13] adopted a system comparison between simulated and actual DC outputs. It employed a fixed threshold to analyze the free fault system. The same approach was proposed in refs. [14,15].
This detection method requires a large amount of labeled data to create a robust machine learning pipeline, which makes it challenging to create or simulate large-scale fields [16]. Thresholding and classical programming overfit the data handled, and generalization to other systems or installations cannot be easily performed. Electrical methods are sensor-based and can be expensive if operators intend to cover a vast area of photovoltaics [17]. Therefore, the most common data acquired concern the strings, and the inspection is consequently focused on the strings and not the individual solar modules.
Some anomalies can be detected through RGB, Infrared (IR), or electroluminescence (EL) images. RGB images detect visual artifacts and defects observable by the human eye. In IR images, each anomaly affects the temperature of the affected components [18,19]. The faults cause the energy to dissipate as heat, and the cell, substring of cells, or whole module appears overheated compared to its normal state. The overheating pattern enables experts to differentiate and distinguish between anomalies and characterize each to act accordingly. However, the need for another image type to further interpret the anomaly has been recommended [20]. EL is primarily adopted for indoor tests, which are based on the principle of measuring the light emission by cells when a current is fed into them [21]. It aids in detecting manufacturing defects, such as microcracks, which are difficult to detect visually or using IR imaging. This method is expensive and challenging to apply outdoors; consequently, testing requires dismounting individual modules from the field [19]. RGB and IR images can be implemented outdoors and indoors, respectively, to detect different anomaly types.
As Table 1 indicates, these anomalies are occasionally interconnected, and each may be related to another. Soiling and shading exhibit nearly identical thermal responses in the IR images, as both phenomena cause the affected area to overheat. A diode may be faulty or activated due to soiling covering the module’s surface. Furthermore, cell overheating can result from cracks, shadowing, or delamination. These causal relationships between anomalies are summarized in an illustration in [8] (see Figure 2). Consequently, RGB images are necessary to interpret and identify the causes of thermal anomalies.

Table 1.
Anomalies’ descriptions and the image types used for their detection.

Figure 2.
Anomalies’ causes and effects on photovoltaics, as illustrated in [8].
These types of images can be acquired by handheld cameras to manually inspect the PV systems or embedded in UAVs to expedite the time of acquisition and take advantage of the large coverage provided by these aerial vectors.
1.2. UAVs as a Fast Inspection Tool
Interest in imaging to detect and classify anomalies in photovoltaic installations has increased as the prices of cameras have decreased and their availability has increased [32,33]. Conversely, to solve the problem of coverage of large-scale installations, industrial UAVs equipped with both types of cameras have emerged to reduce the time and cost of operations. These aerial vectors can capture high-resolution images from an altitude that can be adjusted according to the precision required for the inspection mission. In [34], the optimal altitude for the mission was approximately 5 to 20 m, depending on the anomaly type, using Nikon-V1 for visual faults. Similarly, refs. [35,36] specified the Ground Sampling Distance (GSD) required for a comprehensive inspection using RGB and IR cameras to meet the requirement of [37], which identified a GSD of 3 cm/pixel for the thermal camera and 1 cm/pixel for RGB. In [38], a minimal spatial resolution of 5 × 5 pixels per cell was specified.
Inspections using drones are significantly more cost-effective compared with field inspections using handheld cameras or electrical tools, which require substantial time and human resources. Regarding time efficiency, ref. [39] compared manual inspection to UAV-based inspection of 20 MWp installations equipped with 52,630 solar modules of 380 Wp. The comparison demonstrates that the UAV can perform a four-hour inspection flight, whereas human inspection can take up to 220 h. In terms of cost-effectiveness, utilizing UAVs for inspection is estimated to result in savings of up to USD 7.4 million per year in a 1 GWP plant [40].
1.3. Image Processing Techniques for Anomaly Classification
These imaging tools can detect and classify anomalies either manually or visually by operators or automatically using classical or advanced artificial intelligence algorithms such as machine learning and deep learning. For image processing, visual inspection of the acquired images has proven effective with the requisite expertise, as each type of anomaly can be analyzed and distinguished from the others. However, using UAV for acquisition produces a considerable amount of data that depend on the area covered by the installation and the altitude fixed for the operations. Therefore, visual inspection of images can be challenging for operators, as they are susceptible to errors when the amount of data is significant. Regarding automatic image processing, classical approaches rely on pixel value analysis. RGB images represent the light reflected from objects in the Red, Green, and Blue spectral ranges. Meanwhile, IR sensors, which operate in the short-wave infrared range, are commonly embedded in industrial cameras and represent the thermal response of objects within the scene.
1.3.1. Conventional Methods
Classical computer vision employs knowledge-based programming that utilizes manual feature extraction of pixel values or the temperature of the affected locations in images. Subsequently, thresholds are established for each image channel to automatically detect and classify anomaly types [17,41]. Additionally, geometrical properties can facilitate the detection and classification of defects. Edges, contours, and shapes are frequently utilized for the classification of anomalies in photovoltaics, as certain anomalies can cause abrupt shifts in pixel values and temperature or possess specific shapes (cell shapes), which aids in distinguishing them from normal cells [18,30,42]. However, this level of automation exhibits limited generalization capabilities. Thresholding and morphological operations are data-dependent and become invalid if the image properties differ. This occurs when environmental conditions vary (time of shooting, weather conditions) and depends on the installed photovoltaic technology. Consequently, these methods are not end-to-end and are valid only for specific features [43].
1.3.2. AI-Based Methods
Artificial intelligence methods utilize neural networks to interpret images and associate them with provided data labels, thereby establishing rules and knowledge for subsequent inferences and classification. This approach differs between machine learning and deep learning methodologies. The former necessitates human intervention prior to training by introducing salient features that characterize each image in the dataset. These features are subsequently input into the network along with the corresponding class labels. This approach requires feature engineering and selection to identify relevant attributes, ensuring model generalizability and effective class distinction. Conversely, deep learning methods exhibit a higher degree of automation compared to machine learning methods. This model conducts feature extraction without human intervention. However, to fully leverage the potential of this approach, deep learning models require substantial amounts of data to recognize and categorize each class within the datasets [44,45]. Moreover, increased data availability facilitates the achievement of robust generalization, provided the model is appropriately trained and optimized. Nevertheless, deep learning remains the most suitable tool for inspecting and classifying photovoltaics in large-scale installations. This has been empirically demonstrated in previous studies, where deep learning outperformed machine learning and classical computer vision algorithms [46,47].
- Training and finetuning:
Deep learning algorithms, particularly Convolutional Neural Networks (CNNs), can simulate operator decision-making in classifying the images received as inputs. This simulation requires adjusting the weights and biases (see Figure 3) of each convolution layer in the network to optimize the decision made by the model [48]. The optimization process focuses on reducing the margin between the correct class and the predicted class obtained by the model at each iteration. This margin is quantified by a loss function that measures it. The feature extraction component comprises convolution layers that filter images to extract features relevant to the decision step (feature maps). In deep learning, the model determines the features by adjusting the filter values (weights and biases) in each iteration to reduce the loss function. Furthermore, these values are adjusted through the backpropagation process, where the difference between the correct output class and the predicted class is considered in the optimization process through an optimizer selected according to the complexity of the problem. After each convolution layer, an activation function introduces nonlinearity and complexity in the architecture and detects the features relevant to each class. A pooling layer is commonly incorporated to condense the information and reduce the output size of each convolution layer. As the model output is the probability of an image belonging to an output class, the 2D feature maps are converted to 1D values through the fully connected layers [46,48].
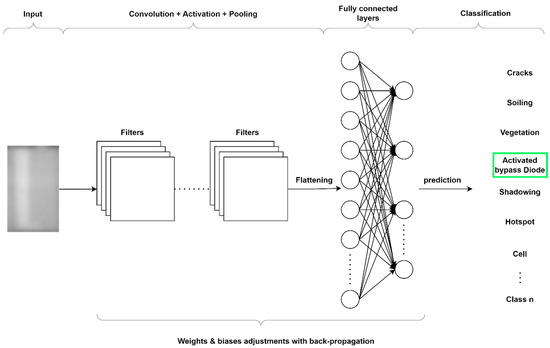
Figure 3.
CNN training process for image classification.
Figure 3 illustrates a typical deep learning architecture for image classification. However, numerous advancements, such as residual blocks [49], dropout [50], and regularization layers [51], have been introduced to optimize the learning process and enhance the efficiency of the trained model for detection.
The selection of hyperparameters and the initial training point can optimize the learning curve of the model. This necessitates skilled users to possess knowledge while adjusting and fine-tuning the hyperparameters [52]. However, it requires manual execution of trials and testing, which can be challenging and time-intensive.
An alternative approach for deep learning model training involves utilizing pre-trained models on similar or different tasks and fine-tuning them to the specific task at hand [53]. This method leverages existing architecture and pre-trained weights as starting points while further optimizing them based on the hyperparameters established during fine-tuning. Subsequently, the final trained model is deployed to process new input images and generate predictions. This process of applying the trained model to unseen data is referred to as inference.
- Generalization and optimization for real-time applications:
For datasets required for training, the quantity of images for each class is essential to improve not only the model’s performance, but also the diversity in representation of the objects to classify, the data quality, and, in some instances, the modalities introduced as input to the model. To enhance generalization to unseen data, utilizing data captured in different timeframes and for various types of instances within the same class can improve the robustness and generalization rate. Consequently, it can perform more effectively on unseen data and mitigate the domain shift effect. Furthermore, analogous to human interpretation, having multiple data sources enables significantly more insight into the data and better characterizes the classes concerned [12,43].
To incorporate deep learning classification for large-scale installation monitoring, optimization for real-time inference should be addressed to further enhance the operation. This encompasses not only the inference speed of the algorithms, but also the efficiency of their execution in real time across various devices, including those with limited computational capacity [54,55].
1.4. Aims, Contributions, and Paper Organization
Anomalies impacting PV systems can be detected through electrical data analysis and manual inspection to identify defects at the string and panel levels, respectively. However, these methods are limited in their scope, requiring significant effort and cost for comprehensive assessments. Consequently, UAV inspections combined with DL have gained traction, utilizing IR and RGB images for anomaly detection and classification. While prior studies have classified both image types, the potential of combining RGB and IR data to enhance classification remains underexplored. It can improve failure detection and deepen understanding of underlying causes [12,43].
Despite advancements in deep learning models for PV inspection, their efficacy depends heavily on the availability and quality of training data. A robust classifier should handle images from diverse environments to detect anomalies and overcome domain shifts. However, existing datasets often suffer from low resolution, limited diversity, and class imbalance. Model selection and optimization are also critical for real-world performance.
Another critical challenge is to complement electrical with individual PV module inspection, focusing deep learning on module-level analysis. PV module segmentation should undergo similar optimizations for effective deployment. Large-scale PV installations necessitate a geolocation step to facilitate in-field inspection. In previous studies, the geolocation of the extracted modules was based on photogrammetric processing, which is computationally intensive and unsuitable for real-time applications. Thus, individual module geolocation from raw UAV images represents a significant improvement opportunity.
This paper presents a comprehensive review of literature on anomaly detection and classification in PV modules. This state-of-the-art (SOTA) study encompasses recently adopted methodologies for segmenting and diagnosing PV systems utilizing UAV, satellite, and handheld camera images. It examines both classical and advanced computer vision techniques, evaluating their efficacy, limitations, and recent advancements.
Beyond anomaly detection and classification, developing a holistic UAV-based PV monitoring approach requires addressing the optimization of data acquisition, preprocessing, storage, and visualization of results. Consequently, this study complements previous review studies [4,8,16,19,32,56] and focuses on these aspects to identify the best practices and highlight research gaps that future studies may address to develop a holistic approach for PV inspection (see Figure 4). A comprehensive review of SOTA methods will facilitate the assessment of current requirements and identify unexplored solutions to enhance the decision-making process of deep learning models. It will also serve as a foundation for future research, guiding researchers toward the development of a holistic approach for large-scale installation inspections using UAV imagery.

Figure 4.
Review structure and key components to create a holistic approach for UAV-based PV inspection.
To underscore the relevance of this paper in relation to existent literature reviews, this initial section outlines the context and rationale underlying it. The subsequent sections provide a comprehensive analysis of the literature pertaining to anomaly detection and classification in large-scale photovoltaic installations through the utilization of drone imagery. Ultimately, the paper delineates and discusses research gaps and areas for potential improvement, intending to contribute to the development of a holistic approach for monitoring large-scale installations using UAV data.
2. Guidelines and Best Practices for UAV Data Acquisition in PV Inspection
The inspection of PV modules through UAV thermal and RGB images necessitates adherence to specific guidelines. For thermal camera usage, the IEC Technical Specification 62446-3 [37] establishes the protocols for outdoor infrared thermography and delineates the considerations that must be observed regarding minimum camera specifications, suitable environmental conditions for image capture, and imaging procedures. It also encompasses instructions for visual cameras, which provide valuable supplementary insights into thermal imaging.
Moreover, previous studies have focused on elucidating data acquisition guidelines to ensure successful inspections and facilitate the identification of anomalies in the acquired images. These guidelines encompass camera attitude and distance to the panel to enhance anomaly detection.
Firstly, the thermal camera should meet minimum specifications to fulfill the requirements, such as a thermal object temperature range from −20 °C to 120 °C and the ability to function in ambient temperatures between −10 °C and 40 °C [37,38]. The inspection should be conducted at an irradiance exceeding 600 W/m2, with wind speeds below 28 km/h, and cloud coverage of less than two oktas of cumulus clouds to mitigate undesirable reflectance on the module surface [37,57]. These conditions are essential to prevent noisy and blurred thermal images that may compromise the accuracy of the thermal response and panel representation [43].
The attitude of the UAV for aerial inspection should be adjusted to prevent sun glare on the module surface and self-shading of the module by the UAV. To this end, the technical specifications stipulate maintaining a perpendicular angle during data capture. For handheld cameras, where ensuring a perpendicular angle may be challenging, an angle greater than 30° is recommended [37]. The angle of acquisition should be perpendicular to and exceed 60° relative to the normal of the solar module surface [58]. For both automatic and manual inspections, the flight should be conducted parallel to the arrays [35,36].
The altitude at which the mission should be conducted depends on the camera resolution, the GSD at which anomalies are identifiable through the images, and the types of faults under investigation. In this regard, refs. [20,34,36] estimated that the optimal flight height for anomaly inspection ranges between 5 and 20 m. Lastly, the technical specifications require operators to indicate the precise locations of detected anomalies in their reports.
3. Data Preprocessing and Preparation for the Inspection
Before image classification and segmentation, the process begins with preprocessing images to enhance relevant features that improve data quality and deep learning capacity. In addition to preprocessing, the data preparation incorporates geolocation as a step to facilitate in-site inspection and data curation to mitigate the imbalance impact.
3.1. UAV Image Pre-Processing
Image processing aims to reduce noise and enhance image quality and features to facilitate detection. Moreover, the data utilized for advanced image classification should be curated to optimize model learning. To this end, previous attempts to detect and classify anomalies have proposed various strategies for data preprocessing.
To improve classifier performance, manual removal of background objects and image cropping have previously been adopted to reduce false detection of anomalies. Refs. [53,59] adopted this approach in addition to resizing to obtain uniform image size. Similarly, ref. [60] applied cropping, scaling, and interference deletions. Ref. [61] converted 16-bit images into 8-bits before normalizing them to the range of 0 to 255. Standardization was performed to reduce the domain shift within the dataset.
Computer vision techniques are employed to denoise and augment data quality before classification or segmentation. Ref. [59] applied thresholding, Sobel filter, and wavelet transform before data usage in CNN training. Ref. [62] performed noise removal, reshaping, and resizing to improve the performance of the proposed CNN. Refs. [17,63] employed Gaussian blurring before filtering. Ref. [64] evaluated the impact of preprocessing before fault detection using image preprocessing. The results showed an improvement in accuracy when using a bilateral filter combined with histogram equalization. Ref. [65] used a Laplacian filter for image sharpening and discontinuity removal. After contour detection using traditional computer vision, some studies adopted morphological opening and closing to remove noise from the detected mask [63,66]. Pixel value normalization is also added to machine and deep learning to speed up the convergence of the model during training [48,59] and to enhance image features [60]. Normalization was also adopted in [67] to reduce the variance in the temperature values in the images.
3.2. Image Geolocation
Some studies have focused on the geolocation of the detected PV anomalies; therefore, the preprocessing of these images includes photogrammetric processing to generate orthorectified images [29,68,69] and SFM–MVS to rectify the geolocation errors [70]. To keep track of the individual PV modules in each video frame, ref. [71] employed ORB key point detection and RANSAC for outlier removal. Consequently, they linked the ID of each PV module to the previously localized plant ID. Ref. [41] presented a method for the local positioning of modules in the acquired videos. In this context, these methods do not provide the geolocation of the extracted modules and are limited to local positioning. Moreover, photogrammetric processing, which is efficient and precise for geolocation, necessitates extensive computational resources.
3.3. Addressing Data Imbalance and Augmentation
Deep learning algorithms provide enhanced automation for classification. They surpass traditional machine learning methods through automatic feature extraction, which facilitates the characterization of each class. However, this advantage necessitates a large dataset with sufficient samples to represent each class [46]. To address this issue, previous studies have employed data augmentation to expand datasets. Data augmentation is one of the solutions that addresses the problem of insufficient data in machine learning tasks, particularly in multiclass classification. This involves incorporating slightly modified replicas that closely resemble the original data [48]. Additional data are generated using geometric and radiometric operations such as rotation, translation, flip, Gaussian filter, and Fourier transform. The generated images have labels identical to those of the original images because they represent potential variations that could occur under different circumstances of data acquisition for a similar application. For example, refs. [71,72] augmented the dataset using geometric operations to increase the number of images. Ref. [53] improved classifier performance by training the model on an augmented dataset.
Moreover, large datasets acquired for the inspection of photovoltaic installations are generally skewed toward the normal class. This is due to the high number of normal panels compared to faulty ones. Therefore, the trained model can be biased toward a more represented class and performs poorly in classifying classes with a low number of images and in the dataset used for training. The techniques proposed and employed in previous studies to address this issue include weighting, data augmentation, undersampling, and oversampling. Data augmentation was previously employed by [73,74,75,76] to achieve data balance. For instance, ref. [73] applied data augmentation to all 12 classes in the dataset [77], whereas [74,75] applied data augmentation exclusively to anomalous classes in the context of multiclass classification.
An alternative approach to addressing imbalance is to undersample the classes that have more images and potentially cause the model to be biased toward them. In their prior research, refs. [74,75] opted to maintain the number of images in the dominant class. Instead, they chose to exclude the more frequently occurring class from the multiclass classification, focusing on the anomalous classes. One disadvantage of undersampling is that a significant quantity of data must be disregarded to establish the required equilibrium. The scarcity of publicly available datasets for anomaly identification in photovoltaic plant inspection reduces the desirability of this approach.
Conversely, oversampling is another solution for mitigating the impact of imbalance on the dataset. Oversampling algorithms allows users to increase the number of images per class by generating similar images based on the original data. The SMOTE approach [78], also known as the synthetic minority oversampling technique, was employed by [73] to generate new images using the k-nearest neighbor (K-NN) algorithm [78]. The selection of the optimal number of neighbors required to generate a new sample depends on the intended number of images and the number of images in the minority class.
To handle data imbalance, our previous study [79] proposed a model-centric approach combined with data augmentation to improve the multiclass classification of imbalanced datasets. It proposes intermediate classification and leverages lower levels of classification to enhance the final classification decision.
4. Photovoltaic Module Segmentation and Identification
Photovoltaic module segmentation and identification have been introduced in previous studies before diagnosis to establish the region of interest for subsequent analysis [80]. Solar module segmentation facilitates the identification of distributed photovoltaic systems.
Initially, classical computer vision algorithms were employed for this task. These algorithms are based on filtering, thresholding, or a combination of both to segment individual panels. Filtering methods utilize colorimetric and radiometric techniques to delineate the features of individual panels and eliminate background noise. Using geometrical filters, refs. [17,42] segmented photovoltaic modules from thermal videos. Ref. [81] detected PV strings using Sobel and Canny detectors to detect individual modules within strings. Ref. [82] leveraged the rectangular shape of PV modules to filter the segmented modules from RGB images converted to grayscale. Ref. [83] employed edge detection to segment PV modules from RGB images. The utilization of geometrical attributes was overfitted to the datasets in these studies, and filtering based on module shape was dependent on the size of the modules in the image space. This shape varies with the mission altitude and the drone attitude during the mission. This variation affects the accuracy of the approach and increases the false detection rate. Ref. [80] incorporated a post-processing approach to address missing modules. They previously identified these modules by edge detection and geometric properties while adopting SVM to eliminate false positives. Other studies focused on utilizing colorimetric features. Ref. [63] applied thresholding on RGB images converted to HSV color space, and ref. [84] employed MATLAB’s Find peaks function to detect the boundaries of the modules and filtered the results with DBSCAN. Ref. [66] used automatic thresholding to generalize this approach. In this study, the Otsu method was implemented to segment photovoltaic modules.
However, interest in a more autonomous approach for individual solar module segmentation has increased [85]. This approach not only enhances the performance of the operation, but also demonstrates greater potential for generalizability when adequately trained. Ref. [80] demonstrated the performance of mask RCNN compared with classical computer vision in terms of performance metrics and the shape of the generated masks. The same architecture was trained by [71] on thermal images extracted from videos, and by [86] on RGB images. Refs. [87,88] trained YOLOv3 to identify solar modules for inspection while proving the real-time integration ease. Meanwhile, ref. [89] fine-tuned YOLOv5 to segment solar cells from RGB and IR images. Ref. [90] used Faster RCNN on the orthorectified tile to identify the PV modules. Ref. [91] used U-Net for array extraction from thermal images.
On the other hand, some efforts were made to segment individual PV modules and installations for the identification areas equipped with this type of installation. Ref. [92] proposed Solar Mapper based on U-Net to detect Photovoltaics from satellite images. Solar Finder was proposed by [93] for the same application. This solution is based on the combination of ML and DL to improve the detection and identification of panels within the rooftop contours. In ref. [94], the researchers were interested in detecting arrays using Mask R-CNN and ResNet-50 as the backbone. Ref. [95] proposed a GeoAI based on U-NET and VGG16 for the same application. To detect installation boundaries, ref. [86] adopted Mask R-CNN and [96] trained U-NET for the same application.
5. Deep Learning for Anomaly Detection and Classification Using UAV Images
Previous studies have addressed the problem of photovoltaic system inspection using either traditional computer vision or advanced algorithms based on ML or DL. However, deep learning approaches have demonstrated superior performance compared to conventional methods in terms of performance metrics and automation capabilities [47]. For instance, ref. [97] suggested that DL-based methods outperform ML and traditional techniques. The latter methods exhibit lower accuracy and fail to generalize when applied to novel faults. In this regard, previous researchers have investigated anomaly detection using RGB images [72,83], IR images [71], and EL images [76,98]. On the other hand, the combination of multiple data sources remains recommended [12], but has been underexplored in previous studies.
To classify anomalies based on their thermal nature, ref. [68] proposed FPN-DenseNet architecture on orthorectified images. In contrast, the study proposed in [71] classified raw IR images using ResNet-50. Ref. [99] trained a lightweight CNN from scratch on IR images for anomaly classification. Ref. [100] classified thermal images using the proposed and custom CNN. Ref. [101] combined two architectures, U-Net and DenseNet, as U-DenseNet to leverage the advantages of both for classifying thermal images. Ref. [102] employed a Visual Transformer and demonstrated its performance compared to other DL approaches to classify IR images. Ref. [73] proposed a residual block-based CNN to classify a 12-class dataset of thermal images. It also used ensemble model performance by training several models using different strategies. Ref. [59] trained a binary CNN from scratch to classify thermal faults in two datasets acquired by a handheld camera and UAV.
Object detection techniques have been employed in numerous studies to identify and delineate faulty components in photovoltaic (PV) panels. One such investigation [72] adopted a modified Single Shot Detector (SSD) with a VGG16 backbone, effectively reducing classification time through a decrease in model parameters. In a related study, ref. [103] adapted and fine-tuned Yolov3-tiny for the detection of thermal anomalies in solar modules. Additionally, ref. [88] applied Yolov3 to segment hotspots within pre-segmented strings using an identical architectural approach.
Research involving RGB imagery has also yielded significant advancements. The DeepSolarEye system, proposed by [26], was developed to analyze and estimate dirt accumulation and soiling on PV module surfaces. Another study, [83], focused on training an encoder–decoder framework specifically for bird dropping detection. In contrast, ref. [104] employed VGG16 solely for feature extraction, followed by SVM classification to identify five distinct anomaly types in RGB images. Furthermore, ref. [105] introduced a stacking ensemble methodology for RGB image classification, aimed at detecting visual anomalies such as discoloration.
In EL images, their application was predominantly associated with manufacturing processes, such as the detection of micro-cracks. Ref. [98] proposed a concatenation model of Xception and ResNet50V2 to classify EL images. This study compared this model with VGG19, DenseNet201, and InceptionResNetV2, which are frequently utilized for image classification in photovoltaics. Vision Transformers were also introduced for the classification of EL panel images into four classes and by technology type [106]. Ref. [76] proposed a light-depth CNN and achieved 98% accuracy for 8-class classifications. Ref. [107] developed an improved Yolov7 with an ELAN block to detect faults in EL cells and monitor the manufacturing processes. Ref. [108] employed knowledge distillation from a pre-trained VGG16 to train a custom CNN to classify EL cell images.
Conversely, the integration of multiple modalities and methods has been addressed in previous research. Ref. [60] developed two Convolutional Neural Networks (CNNs) for the classification of infrared (IR) and RGB images, with decision-making conducted through cross-validation of both models. Ref. [109] proposed a weighted decision approach utilizing three models trained on IR, RGB, and meteorological data to classify anomalies. Ref. [26] combined RGB and environmental factors as inputs to predict power loss, dirt location, and dirt type.
The results reported by [104] suggest that binary classification exhibits superior performance compared to multiclass classification. Additionally, the researchers noted that the model demonstrated a propensity for shadowing due to the prevalence of images in this category.
6. Challenges in Model Generalization and Domain Adaptation
In the context of photovoltaic plant inspection using UAV images, additional factors must be considered when training a DL classifier. Generally, deep learning models are susceptible to generalization issues. Variations in data between training, testing, and real-world deployment can lead to model drift and diminished performance despite satisfactory results during training and testing [90]. Solar panels utilized in power plants exhibit numerous technological, generational, morphological, and dimensional variations [110]. Consequently, the absence of a particular type or representation of solar panel in the training data may result in suboptimal generalization rates.
Ref. [61] proposed contrastive learning to enhance the generalizability of the model and mitigate the impact of domain shift. Furthermore, the visual representation of solar modules in images, particularly in thermal images, is influenced by environmental factors such as irradiance, cloud coverage, mission altitude, and image resolution. These elements alter the thermal response of individual solar modules, which are represented differently in the image domain, resulting in a domain shift and a reduction in the generalization potential of the model if they are absent from the training data. Refs. [80,90] employed a training dataset comprising four distinct sites to address the domain shift. The researchers evaluated the trained model on an unseen site and achieved performance inferior to that of the model trained on a mixed dataset encompassing all sites. Ref. [111] proposed a GenPV model encompassing a range of resolutions and photovoltaic module sizes. The model employed data augmentation and feature pyramid networks to address imbalances in the resolution. The model was structured to accommodate modules of varying sizes through inductive transfer learning, and focal loss was utilized to balance the distribution of classes. Moreover, as indicated by the authors in ref. [91], the proposed model should be evaluated for its generalization capacity when applied to an expanded dataset. Ref. [61] implied that large datasets from different environments are required to achieve better results and mitigate the domain shift. Conversely, GenPV [111] performed poorly on an unaligned dataset, indicating the need for datasets from different environments. Our previous work [112] proposed a data-based domain generalization approach to improve the generalization of the segmentation models toward data from different installations. This approach enhances the performance of the model on unseen data by training it on different photovoltaic models acquired at different locations and environmental conditions. A retraining cycle was proposed in [113] to ensure the continuous adaptation and deployment of the model for future inference.
7. Towards a Holistic Approach for End-to-End UAV-Based PV Inspection Workflow
Prior research has endeavored to establish a comprehensive workflow for detecting and classifying anomalies, encompassing the entire process from data collection to visualization and decision-making. Researchers in [88,114] introduced a workflow that combined the segmentation and classification of thermal and RGB images. Another study proposed SunMap as an unattended maintenance approach for photovoltaic plants, utilizing a photogrammetric-based approach [69]. This method generates an orthophoto map of the inspected sites, facilitating identification of the affected solar modules. Each inspected image underwent thermal analysis. The study in [99] posited that the data were stored in Firebase. The retrieved images were subsequently processed on a Raspberry Pi and either displayed or transmitted to the user as a notification. Our previous work [115] developed a hybrid and scalable approach for monitoring PV plants that manages data acquisition, processing, inspection, storage, and visualization for O&M operations. The authors of [116] proposed a solution for monitoring multiple plants by relying on sensor data processing and AI-based power prediction using five distinct models. Furthermore, in [117], the researchers developed a platform that enables users to upload thermal images. These images underwent a two-step segmentation process for array detection, followed by hotspot identification. The platform subsequently generates a report based on this analysis.
8. Critical Analysis and Future Research Directions
The literature review indicates an increased interest in anomaly detection and classification in photovoltaics. These investigations aimed to preserve the advantages of solar energy and ensure the optimal performance of PV systems throughout their operational lifespan. Regarding the use of UAV images and imaging in general, the technical specifications delineate the protocols for a successful mission to avoid image blurring and unusable data for inspection. When implemented correctly, UAV imaging can reduce operational costs and enhance inspection efficiency.
Recent studies have also demonstrated interest in the utilization of DL algorithms for anomaly detection. The performance of such algorithms facilitates the automation of the process with high-performance metrics compared to classical computer vision and ML. Researchers have attempted to improve performance by proposing custom CNN architectures, pre-trained models, and hybrid approaches. Custom CNNs are based on previously developed blocks in the SOTA architectures, such as residual and attention blocks. Some previous investigations compared pre-trained usage through transfer learning and training models from scratch.
Other studies have incorporated the segmentation of PV installations, arrays, strings, and solar modules. This step enhances anomaly detection by defining the region of interest and reducing the background noise for the classifier’s decision.
While DL algorithms are dependent on data quality and quantity, previous research has introduced solutions for these aspects. Firstly, data scarcity in the field of solar energy, primarily due to confidentiality concerns, necessitates data augmentation to increase the number of images in training, either through geometric and radiometric operations or by adopting Generative Adversarial Networks (GANs) to synthetically expand datasets. Generally, the number of normal panels exceeds that of panels with anomalies in solar fields. Consequently, the photovoltaic panel classification dataset is imbalanced between the normal class and classes with anomalies. Regarding the generalizability of the workflow, it has been suggested that data integration from different installations should enhance the model’s robustness against domain shift.
In addition, the data types utilized for anomaly detection and classification are diverse, depending on the nature of the anomalies studied. However, RGB and thermal images are the primary modalities adopted for large-scale outdoor environments. Previous studies have examined both modalities separately to classify anomalies. More recent research has investigated multimodal approaches, including cross-validation steps and voting decision steps, between classifiers trained on each modality.
Finally, there has been increasing interest in developing a holistic approach that incorporates all essential components required for monitoring photovoltaic installations. This approach optimizes the practical aspects of image analysis for anomaly detection and classification by encompassing data acquisition, storage, anomaly detection, classification, and visualization modules.
However, a critical examination of the literature on anomaly detection and classification revealed several areas for improvement, as shown in Table 2. Firstly, there were sampling deficiencies in the datasets used for training the DL models. Both publicly available and private datasets exhibit class imbalance, low resolution, or insufficient representation for each anomaly type. The performance in most studies exceeded 90% accuracy for binary classifiers and 85% accuracy for multiclass classification. However, these models have not been rigorously tested and deployed in production under varying environmental conditions. To address this issue, our previous study proposed a data collection protocol to create an optimized dataset for anomaly classification and solar module segmentation. This protocol is based on varying module representations, environmental conditions, and factors that impact the images.
Table 2.
Gaps in the SOTA for each component of the holistic approach for the inspection of large-scale installation.
Furthermore, automatic segmentation necessitates a large, labeled dataset for solar module segmentation. Labeling such datasets requires substantial time and effort, particularly for large-scale installations. No significant efforts have been made to automate the labeling process while making it adaptive to changes in the UAV shooting conditions. Moreover, the geolocation of the segmented modules using an optimized inference strategy for raw images should be incorporated into the process. This approach outperforms photogrammetric processing, which is time-intensive and computationally expensive.
Regarding the empirical gaps, multimodality usage for anomaly detection and classification remains largely unexplored. The human interpretation of anomalies via images relies on prior domain knowledge. It considers the difference in patterns between anomaly types and depends on the RGB images for further insights when infrared images alone are insufficient. However, in previous studies, models were developed and studied separately. The combination included a voting stage between both modalities and cross-validation.
Lastly, the interest in a holistic monitoring approach should prioritize real-time inference optimization and streamline the entire execution pipeline to facilitate the deployment of the trained models in production environments.
9. Conclusions
This work provides a comprehensive assessment of the SOTA of photovoltaic inspection through advanced UAV image processing. It focuses on data acquisition, preprocessing, solar module segmentation, and classification to guide future studies in their critical analyses, to propose novel holistic approaches, and to address the issues that affect each component. The components discussed in this review have been demonstrated to be essential for improving the performance of inspection approaches, their adaptability to real-world applications, and their optimization for real-time execution. Integrating the segmentation and classification steps while optimizing the data acquisition workflow enhances the performance of the inspection operations. However, the efficiency of their execution in terms of production and generalization capacity remains a significant challenge. The images used for segmentation and classification are primarily classified separately, encouraging the study of hybrid and data fusion for both applications to assimilate human operators’ logic and analysis for the decision-making process.
In this regard, future research should focus on introducing multimodal inputs to further optimize the decision-making processes of the developed models, in addition to increasing interest in improving the models’ generalization and adaptability to different photovoltaic systems and environmental conditions. In terms of implementation, proposing a holistic approach from data acquisition to inference in real-world settings would provide more tangible benefits to the field. Finally, the trend toward unattended monitoring motivates the optimization of real-time inferences for expeditious and streamlined inspection.
Author Contributions
Conceptualization, Z.B. and I.S.; methodology, Z.B. and I.S.; validation, Z.B. and I.S.; formal analysis, Z.B. and I.S.; investigation, Z.B. and I.S.; resources, I.S., I.A.A. and K.A.E.K.; writing—original draft preparation, Z.B.; writing—review and editing, I.S., I.A.A. and K.A.E.K.; supervision, I.S., I.A.A. and K.A.E.K.; project administration, I.S. and I.A.A. All authors have read and agreed to the published version of the manuscript.
Funding
This research received no external funding.
Acknowledgments
This work was conducted on the Green Energy Park platform as part of the Digitalized PV plant project financed by the OCP group [Reference: Digital and smart photovoltaic power plant].
Conflicts of Interest
The authors declare no conflicts of interest.
Abbreviations
The following abbreviations are used in this manuscript.
| AI | Artificial Intelligence |
| CNN | Convolutional Neural Network |
| DBSCAN | Density-Based Spatial Clustering of Applications with Noise |
| DC | Direct Current |
| DL | Deep Learning |
| EL | Electroluminescence |
| EVA | Ethylene Vinyl Acetate |
| FPN-DensNet | Feature Pyramid Network with DenseNet |
| GSD | Ground Sampling Distance |
| GW | Gigawatt |
| GWp | Gigawatt-peak |
| HSV | Hue, Saturation, Value |
| ID | Identifier |
| IEC | International Electrotechnical Commission |
| IR | Infrared |
| KNN | K-Nearest Neighbors |
| ML | Machine Learning |
| MVS | Multi-View Stereo |
| ORB | Oriented FAST and Rotated BRIEF |
| PV | Photovoltaic |
| RANSAC | Random Sample Consensus |
| RCNN | Region-based Convolutional Neural Network |
| RGB | Red, Green, Blue |
| ROI | Return on Investment |
| SFM | Structure from Motion |
| SMOTE | Synthetic Minority Over-sampling Technique |
| SOTA | State of the Art |
| SSD | Single Shot MultiBox Detector |
| STC | Standard Test Conditions |
| SVM | Support Vector Machine |
| UAV | Unmanned Aerial Vehicle |
| UNET | U-Net Neural Network Architecture |
| UV | Ultraviolet |
| VGG | Visual Geometry Group (Deep Learning Model) |
References
- Masson, G.; de l’Epine, M.; Kaizuka, I. Trends in PV Applications 2024; IEA PVPS: Paris, France, 2024. [Google Scholar] [CrossRef]
- IEA Renewables 2023. Available online: https://www.iea.org/reports/renewables-2023 (accessed on 1 October 2024).
- Dambhare, M.V.; Butey, B.; Moharil, S.V. Solar Photovoltaic Technology: A Review of Different Types of Solar Cells and Its Future Trends. J. Phys. Conf. Ser. 2021, 1913, 012053. [Google Scholar] [CrossRef]
- Osmani, K.; Haddad, A.; Lemenand, T.; Castanier, B.; Alkhedher, M.; Ramadan, M. A Critical Review of PV Systems’ Faults with the Relevant Detection Methods. Energy Nexus 2023, 12, 100257. [Google Scholar] [CrossRef]
- Rahman, T.; Mansur, A.A.; Hossain Lipu, M.S.; Rahman, M.S.; Ashique, R.H.; Houran, M.A.; Elavarasan, R.M.; Hossain, E. Investigation of Degradation of Solar Photovoltaics: A Review of Aging Factors, Impacts, and Future Directions toward Sustainable Energy Management. Energies 2023, 16, 3706. [Google Scholar] [CrossRef]
- Lorenzo, G.D.; Araneo, R.; Mitolo, M.; Niccolai, A.; Grimaccia, F. Review of O&M Practices in PV Plants: Failures, Solutions, Remote Control, and Monitoring Tools. IEEE J. Photovolt. 2020, 10, 914–926. [Google Scholar] [CrossRef]
- Lowin, M.; Kellner, D.; Kohl, T.; Mihale-Wilson, C. From Physical to Virtual: Leveraging Drone Imagery to Automate Photovoltaic System Maintenance; Gesellschaft für Informatik: Bonn, Germany, 2021; Volume 1. [Google Scholar] [CrossRef]
- Aghaei, M.; Fairbrother, A.; Gok, A.; Ahmad, S.; Kazim, S.; Lobato, K.; Oreski, G.; Reinders, A.; Schmitz, J.; Theelen, M.; et al. Review of Degradation and Failure Phenomena in Photovoltaic Modules. Renew. Sustain. Energy Rev. 2022, 159, 112160. [Google Scholar] [CrossRef]
- Sarikh, S.; Raoufi, M.; Bennouna, A.; Benlarabi, A.; Ikken, B. Fault Diagnosis in a Photovoltaic System through I-V Characteristics Analysis. In Proceedings of the 2018 9th International Renewable Energy Congress, IREC 2018, Hammamet, Tunisia, 20–22 March 2018; Institute of Electrical and Electronics Engineers Inc.: Piscataway, NJ, USA, 2018; pp. 1–6. [Google Scholar]
- Haque, A.; Bharath, K.V.S.; Khan, M.A.; Khan, I.; Jaffery, Z.A. Fault Diagnosis of Photovoltaic Modules. Energy Sci. Eng. 2019, 7, 622–644. [Google Scholar] [CrossRef]
- Zhang, Z.; Ma, M.; Wang, H.; Wang, H.; Ma, W.; Zhang, X. A Fault Diagnosis Method for Photovoltaic Module Current Mismatch Based on Numerical Analysis and Statistics. Sol. Energy 2021, 225, 221–236. [Google Scholar] [CrossRef]
- Sepúlveda-Oviedo, E.H.; Travé-Massuyès, L.; Subias, A.; Pavlov, M.; Alonso, C. Fault Diagnosis of Photovoltaic Systems Using Artificial Intelligence: A Bibliometric Approach. Heliyon 2023, 9, e21491. [Google Scholar] [CrossRef]
- Santiago, S.; Aissa, C.; Engin, K. Automatic Fault Detection in Grid Connected PV Systems. Sol. Energy 2013, 94, 119–127. [Google Scholar] [CrossRef]
- Toubal Maamar, A.e.; Ladjouzi, S.; Taleb, R.; Kacemi, Y. Détection et Classification de Défauts Pour Un GPV: Etude Comparative Entre La Méthode de Seuillage et Réseaux de Neurones. Revue Des. Energ. Renouvelables 2018, 21, 45–53. [Google Scholar]
- Iqbal, M.S.; Niazi, Y.A.K.; Amir Khan, U.; Lee, B.W. Real-Time Fault Detection System for Large Scale Grid Integrated Solar Photovoltaic Power Plants. Int. J. Electr. Power Energy Syst. 2021, 130, 106902. [Google Scholar] [CrossRef]
- Hijjawi, U.; Lakshminarayana, S.; Xu, T.; Piero Malfense Fierro, G.; Rahman, M. A Review of Automated Solar Photovoltaic Defect Detection Systems: Approaches, Challenges, and Future Orientations. Sol. Energy 2023, 266, 112186. [Google Scholar] [CrossRef]
- Carletti, V.; Greco, A.; Saggese, A.; Vento, M. An Intelligent Flying System for Automatic Detection of Faults in Photovoltaic Plants. J. Ambient. Intell. Humaniz. Comput. 2020, 11, 2027–2040. [Google Scholar] [CrossRef]
- Liao, K.-C.; Lu, J.-H. Using UAV to Detect Solar Module Fault Conditions of a Solar Power Farm with IR and Visual Image Analysis. Appl. Sci. 2021, 11, 1835. [Google Scholar] [CrossRef]
- Afifah, A.N.N.; Indrabayu; Suyuti, A.; Syafaruddin. A Review on Image Processing Techniques for Damage Detection on Photovoltaic Panels. ICIC Express Lett. 2021, 15, 779–790. [Google Scholar] [CrossRef]
- IEA-PVPS. Qualification of Photovoltaic (PV) Power Plants Using Mobile Test Equipment Report; IEA-PVPS T13-24:2021; IEA-PVPS: Rome, Italy, 2021. [Google Scholar]
- Al-Mashhadani, R.; Alkawsi, G.; Mohamed, Y.; Alkahtani, A.; Nordin, F.H.; Hashim, W.; Kiong, T. Deep Learning Methods for Solar Fault Detection and Classification: A Review. Inf. Sci. Lett. 2021, 10, 323. [Google Scholar] [CrossRef]
- Köntges, M.; Kunze, I.; Kajari-Schrder, S.; Breitenmoser, X.; Bjørneklett, B. The Risk of Power Loss in Crystalline Silicon Based Photovoltaic Modules Due to Micro-Cracks. Sol. Energy Mater. Sol. Cells 2011, 95, 1131–1137. [Google Scholar] [CrossRef]
- Abdulmawjood, K.; Refaat, S.S.; Morsi, W.G. Detection and Prediction of Faults in Photovoltaic Arrays: A Review. In Proceedings of the 2018 IEEE 12th International Conference on Compatibility, Power Electronics and Power Engineering, CPE-POWERENG 2018, Doha, Qatar, 10–12 April 2018; Institute of Electrical and Electronics Engineers Inc.: Piscataway, NJ, USA, 2018; pp. 1–8. [Google Scholar]
- Triki-Lahiani, A.; Bennani-Ben Abdelghani, A.; Slama-Belkhodja, I. Fault Detection and Monitoring Systems for Photovoltaic Installations: A Review. Renew. Sustain. Energy Rev. 2018, 82, 2680–2692. [Google Scholar] [CrossRef]
- Köntges, M.; Kurtz, S.; Packard, C.; Jahn, U.; Berger, K.A.; Kato, K.; Friesen, T.; Liu, H.; Van Iseghem, M. Review of Failures of Photovoltaic Modules; IEA International Energy Agency: Paris, France, 2014. [Google Scholar]
- Mehta, S.; Azad, A.P.; Chemmengath, S.A.; Raykar, V.; Kalyanaraman, S. DeepSolarEye: Power Loss Prediction and Weakly Supervised Soiling Localization via Fully Convolutional Networks for Solar Panels. In Proceedings of the 2018 IEEE Winter Conference on Applications of Computer Vision, WACV 2018, Lake Tahoe, NA, USA, 12–15 March 2018; Institute of Electrical and Electronics Engineers Inc.: Piscataway, NJ, USA, 2018; Volume 2018, pp. 333–342. [Google Scholar]
- Grimaccia, F.; Leva, S.; Dolara, A.; Aghaei, M. Survey on PV Modules’ Common Faults after an O&M Flight Extensive Campaign over Different Plants in Italy. IEEE J. Photovolt. 2017, 7, 810–816. [Google Scholar] [CrossRef]
- Kandeal, A.W.; Elkadeem, M.R.; Kumar Thakur, A.; Abdelaziz, G.B.; Sathyamurthy, R.; Kabeel, A.E.; Yang, N.; Sharshir, S.W. Infrared Thermography-Based Condition Monitoring of Solar Photovoltaic Systems: A Mini Review of Recent Advances. Sol. Energy 2021, 223, 33–43. [Google Scholar] [CrossRef]
- Zefri, Y.; Sebari, I.; Hajji, H.; Aniba, G. Developing a Deep Learning-Based Layer-3 Solution for Thermal Infrared Large-Scale Photovoltaic Module Inspection from Orthorectified Big UAV Imagery Data. Int. J. Appl. Earth Obs. Geoinf. 2022, 106, 102652. [Google Scholar] [CrossRef]
- Tsanakas, J.A.; Chrysostomou, D.; Botsaris, P.N.; Gasteratos, A. Fault Diagnosis of Photovoltaic Modules through Image Processing and Canny Edge Detection on Field Thermographic Measurements. Int. J. Sustain. Energy 2015, 34, 351–372. [Google Scholar] [CrossRef]
- Kirsten Vidal de Oliveira, A.; Aghaei, M.; Rüther, R. Aerial Infrared Thermography for Low-Cost and Fast Fault Detection in Utility-Scale PV Power Plants. Sol. Energy 2020, 211, 712–724. [Google Scholar] [CrossRef]
- Buerhop, C.; Bommes, L.; Schlipf, J.; Pickel, T.; Fladung, A.; Peters, I.M. Infrared Imaging of Photovoltaic Modules: A Review of the State of the Art and Future Challenges Facing Gigawatt Photovoltaic Power Stations. Prog. Energy 2022, 4, 042010. [Google Scholar] [CrossRef]
- Spagnolo, G.S.; Del Vecchio, P.; Makary, G.; Papalillo, D.; Martocchia, A. A Review of IR Thermography Applied to PV Systems. In Proceedings of the 2012 11th International Conference on Environment and Electrical Engineering, EEEIC 2012, Venice, Italy, 18–25 May 2012; pp. 879–884. [Google Scholar]
- Aghaei, M.; Dolara, A.; Leva, S.; Grimaccia, F. Image Resolution and Defects Detection in PV Inspection by Unmanned Technologies. In Proceedings of the IEEE Power and Energy Society General Meeting, Boston, MA, USA, 17–21 July 2016; IEEE: Piscataway, NJ, USA, 2016; Volume 2016. [Google Scholar] [CrossRef]
- FLIR. A Guide to Inspecting Solar Fields with Thermal Imaging Drones; FLIR: Wilsonville, OR, USA, 2019. [Google Scholar]
- Raptor Maps DJI Mavic 2 Enterprise Advanced—Raptor Maps. Available online: https://raptormaps.com/solar-tech-docs/pv-energy-aerial-thermography-mavic-2-enterprise-adv/ (accessed on 26 July 2023).
- IEC. IEC Technical Specification 62446-3. Available online: https://webstore.iec.ch/en/publication/28628 (accessed on 2 October 2024).
- Zefri, Y.; Imane, S.; Hicham, H.; Ghassane, A.; Bouchini-Idrissi Safia, E. Applied Imagery Pattern Recognition for Photovoltaic Modules’ Inspection: A Review on Methods, Challenges and Future Development. Sustain. Energy Technol. Assess. 2022, 52, 102071. [Google Scholar] [CrossRef]
- Olayiwola, O.; Camara, F. Challenges and Opportunities for Autonomous UAV Inspection in Solar Photovoltaics. E3S Web Conf. 2024, 572, 1003–1011. [Google Scholar] [CrossRef]
- Reich, C.; Swanson, D.; Shimpi, T.; Drayton, J.; Munshi, A.; Abbas, A.; Sampath, W. Passivation of a Cd1-XMgxTe Absorber for Application in a Tandem Cell. In Proceedings of the 2017 IEEE 44th Photovoltaic Specialist Conference, PVSC 2017, Washington, DC, USA, 25–30 June 2017; pp. 2789–2793. [Google Scholar] [CrossRef]
- Ying, Y.; Qi, Y.; Rong, L.; Men, H.; Joo, Y.H. Anchor Points Based Accurate Fault Locating in Large-Scale Photovoltaic Plants via Aerial Infrared Videos. IEEE J. Photovolt. 2022, 12, 437–443. [Google Scholar] [CrossRef]
- Arenella, A.; Greco, A.; Saggese, A.; Vento, M. Real Time Fault Detection in Photovoltaic Cells by Cameras on Drones. In Proceedings of the Image Analysis and Recognition, Montreal, QC, Canada, 5–7 July 2017; Karray, F., Campilho, A., Cheriet, F., Eds.; Springer International Publishing: Cham, Switzerland, 2017; pp. 617–625. [Google Scholar]
- Waqar Akram, M.; Li, G.; Jin, Y.; Chen, X. Failures of Photovoltaic Modules and Their Detection: A Review. Appl. Energy 2022, 313, 118822. [Google Scholar] [CrossRef]
- Yılmaz, A.; Bayrak, G. A Real-Time UWT-Based Intelligent Fault Detection Method for PV-Based Microgrids. Electr. Power Syst. Res. 2019, 177, 105984. [Google Scholar] [CrossRef]
- Jalal, M.; Khalil, I.U.; Haq, A. ul Deep Learning Approaches for Visual Faults Diagnosis of Photovoltaic Systems: State-of-the-Art Review. Results Eng. 2024, 23, 102622. [Google Scholar] [CrossRef]
- Ali, M.; Dewan, A.; Sahu, A.K.; Taye, M.M. Understanding of Machine Learning with Deep Learning: Architectures, Workflow, Applications and Future Directions. Computers 2023, 12, 91. [Google Scholar] [CrossRef]
- Liu, H.; Perera, A.; Al-Naji, A.; Boubaker, S.; Kamel, S.; Ghazouani, N.; Mellit, A. Assessment of Machine and Deep Learning Approaches for Fault Diagnosis in Photovoltaic Systems Using Infrared Thermography. Remote Sens. 2023, 15, 1686. [Google Scholar] [CrossRef]
- Aurélien, G. Hands-On Machine Learning with Scikit-Learn, Keras, and TensorFlow, 2nd ed.; O’Reilly Media, Inc.: Sebastopol, CA, USA, 2019. [Google Scholar]
- He, K.; Zhang, X.; Ren, S.; Sun, J. Deep Residual Learning for Image Recognition. Proc. IEEE Comput. Soc. Conf. Comput. Vis. Pattern Recognit. 2015, 2016, 770–778. [Google Scholar] [CrossRef]
- Hinton, G.E.; Srivastava, N.; Krizhevsky, A.; Sutskever, I.; Salakhutdinov, R.R. Improving Neural Networks by Preventing Co-Adaptation of Feature Detectors. Comput. Sci. 2012, 3, 212–223. [Google Scholar]
- Tian, Y.; Zhang, Y. A Comprehensive Survey on Regularization Strategies in Machine Learning. Inf. Fusion 2022, 80, 146–166. [Google Scholar] [CrossRef]
- Anand, K.; Wang, Z.; Loog, M.; van Gemert, J. Black Magic in Deep Learning: How Human Skill Impacts Network Training. In Proceedings of the 31st British Machine Vision Conference, BMVC 2020, Virtual Event, 7–10 September 2020; British Machine Vision Association, BMVA: Durham, UK, 2020. [Google Scholar]
- Ahmed, W.; Hanif, A.; Kallu, K.D.; Kouzani, A.Z.; Ali, M.U.; Zafar, A. Photovoltaic Panels Classification Using Isolated and Transfer Learned Deep Neural Models Using Infrared Thermographic Images. Sensors 2021, 21, 5668. [Google Scholar] [CrossRef]
- Le, M.; Le, D.V.; Ha Thi Vu, H. Thermal Inspection of Photovoltaic Modules with Deep Convolutional Neural Networks on Edge Devices in AUV. Measurement 2023, 218, 113135. [Google Scholar] [CrossRef]
- Tradacete-Ágreda, M.; Santos-Pérez, C.; Hueros-Barrios, P.J.; Rodríguez-Sánchez, F.J.; Pérez-Seguí, R.; Melero-Deza, J.; Campoy, P. Framework for Autonomous Inspection of PV Plants Using IoT Electronics on Each PV Panel and UAV Collaboration. Energy Convers. Manag. X 2025, 26, 100878. [Google Scholar] [CrossRef]
- Polymeropoulos, I.; Bezyrgiannidis, S.; Vrochidou, E.; Papakostas, G.A. Enhancing Solar Plant Efficiency: A Review of Vision-Based Monitoring and Fault Detection Techniques. Technologies 2024, 12, 175. [Google Scholar] [CrossRef]
- de Oliveira, A.K.V.; Aghaei, M.; Rüther, R. Automatic Inspection of Photovoltaic Power Plants Using Aerial Infrared Thermography: A Review. Energies 2022, 15, 2055. [Google Scholar] [CrossRef]
- Salahat, E.; Asselineau, C.-A.; Coventry, J.; Mahony, R. Waypoint Planning for Autonomous Aerial Inspection of Large-Scale Solar Farms. In Proceedings of the IECON 2019—45th Annual Conference of the IEEE Industrial Electronics Society, Lisbon, Portugal, 14–17 October 2019; pp. 763–769. [Google Scholar]
- Manno, D.; Cipriani, G.; Ciulla, G.; Di Dio, V.; Guarino, S.; Lo Brano, V. Deep Learning Strategies for Automatic Fault Diagnosis in Photovoltaic Systems by Thermographic Images. Energy Convers. Manag. 2021, 241, 114315. [Google Scholar] [CrossRef]
- Jeffrey Kuo, C.F.; Chen, S.H.; Huang, C.Y. Automatic Detection, Classification and Localization of Defects in Large Photovoltaic Plants Using Unmanned Aerial Vehicles (UAV) Based Infrared (IR) and RGB Imaging. Energy Convers. Manag. 2023, 276, 116495. [Google Scholar] [CrossRef]
- Bommes, L.; Hoffmann, M.; Buerhop-Lutz, C.; Pickel, T.; Hauch, J.; Brabec, C.; Maier, A.; Marius Peters, I. Anomaly Detection in IR Images of PV Modules Using Supervised Contrastive Learning. Prog. Photovolt. Res. Appl. 2022, 30, 597–614. [Google Scholar] [CrossRef]
- Venkatesh, S.N.; Sugumaran, V. Fault Detection in Aerial Images of Photovoltaic Modules Based on Deep Learning. IOP Conf. Ser. Mater. Sci. Eng. 2021, 1012, 012030. [Google Scholar] [CrossRef]
- Yao, Y.Y.; Hu, Y.T. Recognition and Location of Solar Panels Based on Machine Vision. In Proceedings of the 2017 2nd Asia-Pacific Conference on Intelligent Robot Systems, ACIRS 2017, Wuhan, China, 16–18 June 2017; pp. 7–12. [Google Scholar] [CrossRef]
- Pathak, S.P.; Patil, S.A. Evaluation of Effect of Pre-Processing Techniques in Solar Panel Fault Detection. IEEE Access 2023, 11, 72848–72860. [Google Scholar] [CrossRef]
- Bakır, H.; Kuzhippallil, F.A.; Merabet, A. Automatic Detection of Deteriorated Photovoltaic Modules Using IRT Images and Deep Learning (CNN, LSTM) Strategies. Eng. Fail. Anal. 2023, 146, 107132. [Google Scholar] [CrossRef]
- Montanez, L.E.; Valentin-Coronado, L.M.; Moctezuma, D.; Flores, G. Photovoltaic Module Segmentation and Thermal Analysis Tool from Thermal Images. In Proceedings of the 2020 IEEE International Autumn Meeting on Power, Electronics and Computing, ROPEC 2020, Ixtapa, Mexico, 4–6 November 2020. [Google Scholar] [CrossRef]
- Pierdicca, R.; Paolanti, M.; Felicetti, A.; Piccinini, F.; Zingaretti, P. Automatic Faults Detection of Photovoltaic Farms: SolAIr, a Deep Learning-Based System for Thermal Images. Energies 2020, 13, 6496. [Google Scholar] [CrossRef]
- Zefri, Y.; Sebari, I.; Hajji, H.; Aniba, G.; Aghaei, M. A Layer-2 Solution for Inspecting Large-Scale Photovoltaic Arrays through Aerial LWIR Multiview Photogrammetry and Deep Learning: A Hybrid Data-Centric and Model-Centric Approach. Expert Syst. Appl. 2023, 223, 119950. [Google Scholar] [CrossRef]
- Hernández-López, D.; de Oña, E.R.; Moreno, M.A.; González-Aguilera, D. SunMap: Towards Unattended Maintenance of Photovoltaic Plants Using Drone Photogrammetry. Drones 2023, 7, 129. [Google Scholar] [CrossRef]
- Bommes, L.; Buerhop-Lutz, C.; Pickel, T.; Hauch, J.; Brabec, C.; Marius Peters, I. Georeferencing of Photovoltaic Modules from Aerial Infrared Videos Using Structure-from-Motion. Prog. Photovolt. Res. Appl. 2022, 30, 1122–1135. [Google Scholar] [CrossRef]
- Bommes, L.; Pickel, T.; Buerhop, C.; Hauch, J.; Brabec, C.; Peters, I.M. Computer Vision Tool for Detection, Mapping, and Fault Classification of Photovoltaics Modules in Aerial IR Videos. Prog. Photovolt. Res. Appl. 2021, 29, 1236–1251. [Google Scholar] [CrossRef]
- Ren, Y.; Yu, Y.; Li, J.; Zhang, W. Design of Photovoltaic Hot Spot Detection System Based on Deep Learning. J. Phys. Conf. Ser. 2020, 1693, 12075. [Google Scholar] [CrossRef]
- Le, M.; Luong, V.S.; Nguyen, D.K.; Dao, V.-D.; Vu, N.H.; Vu, H.H.T. Remote Anomaly Detection and Classification of Solar Photovoltaic Modules Based on Deep Neural Network. Sustain. Energy Technol. Assess. 2021, 48, 101545. [Google Scholar] [CrossRef]
- Korkmaz, D.; Acikgoz, H. An Efficient Fault Classification Method in Solar Photovoltaic Modules Using Transfer Learning and Multi-Scale Convolutional Neural Network. Eng. Appl. Artif. Intell. 2022, 113, 104959. [Google Scholar] [CrossRef]
- Alves, R.H.F.; de Deus Júnior, G.A.; Marra, E.G.; Lemos, R.P. Automatic Fault Classification in Photovoltaic Modules Using Convolutional Neural Networks. Renew. Energy 2021, 179, 502–516. [Google Scholar] [CrossRef]
- Munawer Al-Otum, H. Deep Learning-Based Automated Defect Classification in Electroluminescence Images of Solar Panels. Adv. Eng. Inform. 2023, 58, 102147. [Google Scholar] [CrossRef]
- Matthew, M.; Edward, O.; Nikhil, V. Infrared Solar Module Dataset for Anomaly Detection. Int. Conf. Learn. Represent. 2020, 48, 101545. [Google Scholar]
- Chawla, N.V.; Bowyer, K.W.; Hall, L.O.; Kegelmeyer, W.P. SMOTE: Synthetic Minority over-Sampling Technique. J. Artif. Intell. Res. 2002, 16, 321–357. [Google Scholar] [CrossRef]
- Barraz, Z.; Sebari, I.; Lamrini, N.; Ait El Kadi, K.; Ait Abdelmoula, I. A Cascading Decision System for Enhanced Anomaly Classification of Large-Scale Photovoltaic Systems Using Drone’s Thermal Data with Class-Imbalance Problem. Results Eng. 2025, 25, 103876. [Google Scholar] [CrossRef]
- Díaz, J.J.V.; Vlaminck, M.; Lefkaditis, D.; Vargas, S.A.O.; Luong, H. Solar Panel Detection within Complex Backgrounds Using Thermal Images Acquired by UAVs. Sensors 2020, 20, 6219. [Google Scholar] [CrossRef]
- Xie, X.; Wei, X.; Wang, X.; Guo, X.; Li, J.; Cheng, Z. Photovoltaic Panel Anomaly Detection System Based on Unmanned Aerial Vehicle Platform. IOP Conf. Ser. Mater. Sci. Eng. 2020, 768, 072061. [Google Scholar] [CrossRef]
- Lee, S.W.; An, K.E.; Jeon, B.D.; Cho, K.Y.; Lee, S.J.; Seo, D. Detecting Faulty Solar Panels Based on Thermal Image Processing. In Proceedings of the 2018 IEEE International Conference on Consumer Electronics, ICCE 2018, Baltimore, MD, USA, 30 July–3 August 2018; Institute of Electrical and Electronics Engineers Inc.: Piscataway, NJ, USA, 2018; Volume 2018, pp. 1–2. [Google Scholar] [CrossRef]
- Moradi Sizkouhi, A.; Aghaei, M.; Esmailifar, S. A Deep Convolutional Encoder-Decoder Architecture for Autonomous Fault Detection of PV Plants Using Multi-Copters. Sol. Energy 2021, 223, 217–228. [Google Scholar] [CrossRef]
- Xu, Z.; Shen, Y.; Zhang, K.; Wei, H. A Segmentation Method for PV Modules in Infrared Thermography Images. In Proceedings of the Asia-Pacific Power and Energy Engineering Conference, APPEEC, Kerala, India, 21–23 November 2021; IEEE Computer Society: Washington, DC, USA, 2021; Volume 2021. [Google Scholar]
- Souffer, I.; Sghiouar, M.; Sebari, I.; Zefri, Y.; Hajji, H.; Aniba, G. Automatic Extraction of Photovoltaic Panels from UAV Imagery with Object-Based Image Analysis and Machine Learning. Lect. Notes Electr. Eng. 2022, 745, 699–709. [Google Scholar] [CrossRef]
- Sizkouhi, A.M.M.; Aghaei, M.; Esmailifar, S.M.; Mohammadi, M.R.; Grimaccia, F. Automatic Boundary Extraction of Large-Scale Photovoltaic Plants Using a Fully Convolutional Network on Aerial Imagery. IEEE J. Photovolt. 2020, 10, 1061–1067. [Google Scholar] [CrossRef]
- Greco, A.; Pironti, C.; Saggese, A.; Vento, M.; Vigilante, V. A Deep Learning Based Approach for Detecting Panels in Photovoltaic Plants. In Proceedings of the 3rd International Conference on Applications of Intelligent Systems, Las Palmas de Gran Canaria, Spain, 7–9 January 2020; pp. 1–7. [Google Scholar] [CrossRef]
- Di Tommaso, A.; Betti, A.; Fontanelli, G.; Michelozzi, B. A Multi-Stage Model Based on YOLOv3 for Defect Detection in PV Panels Based on IR and Visible Imaging by Unmanned Aerial Vehicle. Renew. Energy 2022, 193, 941–962. [Google Scholar] [CrossRef]
- Hong, F.; Song, J.; Meng, H.; Rui, W.; Fang, F.; Guangming, Z. A Novel Framework on Intelligent Detection for Module Defects of PV Plant Combining the Visible and Infrared Images. Sol. Energy 2022, 236, 406–416. [Google Scholar] [CrossRef]
- Vlaminck, M.; Heidbuchel, R.; Philips, W.; Luong, H. Region-Based CNN for Anomaly Detection in PV Power Plants Using Aerial Imagery. Sensors 2022, 22, 1244. [Google Scholar] [CrossRef]
- Shen, Y.; Fan, T.; Lai, G.; Na, Z.; Liu, H.; Wang, Z.; Wang, Y.; Jiao, Y.; Chen, X.; Lou, Z.; et al. Modified U-Net Based Photovoltaic Array Extraction from Complex Scene in Aerial Infrared Thermal Imagery. Sol. Energy 2022, 240, 90–103. [Google Scholar] [CrossRef]
- Hu, W.; Bradbury, K.; Malof, J.M.; Li, B.; Huang, B.; Streltsov, A.; Fujita, K.S.; Hoen, B. What You Get Is Not Always What You See: Pitfalls solar Array Assess; Using Overhead Imagery; Elsevier: Amsterdam, The Netherlands, 2019. [Google Scholar]
- Li, Q.; Feng, Y.; Leng, Y.; Chen, D. SolarFinder: Automatic Detection of Solar Photovoltaic Arrays. In Proceedings of the 2020 19th ACM/IEEE International Conference on Information Processing in Sensor Networks (IPSN), Sydney, Australia, 21–24 April 2020; IEEE: Piscataway, NJ, USA, 2020; pp. 193–204. [Google Scholar]
- He, K.; Zhang, L. Automatic Detection and Mapping of Solar Photovoltaic Arrays with Deep Convolutional Neural Networks in High Resolution Satellite Images. In Proceedings of the 2020 IEEE 4th Conference on Energy Internet and Energy System Integration: Connecting the Grids Towards a Low-Carbon High-Efficiency Energy System, EI2 2020, Wuhan, China, 30 October–1 November 2020; pp. 3068–3073. [Google Scholar] [CrossRef]
- Kausika, B.B.; Nijmeijer, D.; Reimerink, I.; Brouwer, P.; Liem, V. GeoAI for Detection of Solar Photovoltaic Installations in the Netherlands. Energy AI 2021, 6, 100111. [Google Scholar] [CrossRef]
- Pérez-González, A.; Jaramillo-Duque, Á.; Cano-Quintero, J.B.; García, C.A.; Saavedra, S.G. Automatic Boundary Extraction for Photovoltaic Plants Using the Deep Learning U-Net Model. Appl. Sci. 2021, 11, 6524. [Google Scholar] [CrossRef]
- Prabhakaran, S.; Annie Uthra, R.; Preetharoselyn, J. Comprehensive Analysis of Defect Detection Through Image Processing and Machine Learning for Photovoltaic Panels. Lect. Notes Electr. Eng. 2023, 967, 245–261. [Google Scholar] [CrossRef]
- Vo, H.Q.N. Realization and Verification of Deep Learning Models for Fault Detection and Diagnosis of Photovoltaic Modules. Master’s Thesis, Aalto University School of Electrical Engineering, Espoo, Finland, 2021. [Google Scholar]
- Mellit, A. An Embedded Solution for Fault Detection and Diagnosis of Photovoltaic Modules Using Thermographic Images and Deep Convolutional Neural Networks. Eng. Appl. Artif. Intell. 2022, 116, 105459. [Google Scholar] [CrossRef]
- Qureshi, U.R.; Rashid, A.; Altini, N.; Bevilacqua, V.; Scala, M. La Radiometric Infrared Thermography of Solar Photovoltaic Systems: An Explainable Predictive Maintenance Approach for Remote Aerial Diagnostic Monitoring. Smart Cities 2024, 7, 1261–1288. [Google Scholar] [CrossRef]
- Pamungkas, R.F.; Utama, I.B.K.Y.; Jang, Y.M. A Novel Approach for Efficient Solar Panel Fault Classification Using Coupled UDenseNet. Sensors 2023, 23, 4918. [Google Scholar] [CrossRef]
- Ramadan, E.A.; Moawad, N.M.; Abouzalm, B.A.; Sakr, A.A.; Abouzaid, W.F.; El-Banby, G.M. An Innovative Transformer Neural Network for Fault Detection and Classification for Photovoltaic Modules. Energy Convers. Manag. 2024, 314, 118718. [Google Scholar] [CrossRef]
- Han, S.H.; Rahim, T.; Shin, S.Y. Detection of Faults in Solar Panels Using Deep Learning. In Proceedings of the 2021 International Conference on Electronics, Information, and Communication, ICEIC 2021, Jeju, Republic of Korea, 31 January–3 February 2021; Institute of Electrical and Electronics Engineers Inc.: Piscataway, NJ, USA, 2021. [Google Scholar]
- Li, X.; Yang, Q.; Yan, W. Intelligent Fault Pattern Recognition of Aerial Photovoltaic Module Images Based on Deep Learning Technique. In Proceedings of the 9th International Multi-Conference on Complexity, Informatics and Cybernetics, Orlando, FL, USA, 13–16 March 2018; pp. 22–27. [Google Scholar]
- Venkatesh, S.N.; Sripada, D.; Sugumaran, V.; Aghaei, M. Detection of Visual Faults in Photovoltaic Modules Using a Stacking Ensemble Approach. Heliyon 2024, 10, e27894. [Google Scholar] [CrossRef]
- Bounabi, M.; Azmi, R.; Chenal, J.; Diop, E.B.; Abdellahi, S.; Abdem, E.; Adraoui, M.; Hlal, M.; Serbouti, I. Smart PV Monitoring and Maintenance: A Vision Transformer Approach within Urban 4.0. Technologies 2024, 12, 192. [Google Scholar] [CrossRef]
- Zhang, J.; Yang, W.; Chen, Y.; Ding, M.; Huang, H.; Wang, B.; Gao, K.; Chen, S.; Du, R. Fast Object Detection of Anomaly Photovoltaic (PV) Cells Using Deep Neural Networks. Appl. Energy 2024, 372, 123759. [Google Scholar] [CrossRef]
- Zhang, J.; Chen, X.; Wei, H.; Zhang, K. A Lightweight Network for Photovoltaic Cell Defect Detection in Electroluminescence Images Based on Neural Architecture Search and Knowledge Distillation. Appl. Energy 2024, 355, 122184. [Google Scholar] [CrossRef]
- Oufadel, A.; Azouzoute, A.; Ghennioui, H.; Soubai, C.; Taabane, I. Data-Driven Digital Inspection of Photovoltaic Panels Using a Portable Hybrid Model Combining Meteorological Data and Image Processing. IEEE J. Photovolt. 2024, 14, 937–950. [Google Scholar] [CrossRef]
- Parida, B.; Iniyan, S.; Goic, R. A Review of Solar Photovoltaic Technologies. Renew. Sustain. Energy Rev. 2011, 15, 1625–1636. [Google Scholar] [CrossRef]
- Guo, Z.; Zhuang, Z.; Tan, H.; Liu, Z.; Li, P.; Lin, Z.; Shang, W.L.; Zhang, H.; Yan, J. Accurate and Generalizable Photovoltaic Panel Segmentation Using Deep Learning for Imbalanced Datasets. Renew. Energy 2023, 219, 119471. [Google Scholar] [CrossRef]
- Barraz, Z.; Sebari, I.; Ait El Kadi, K.; Lamrini, N.; Ait Abdelmoula, I. One to Segment Them All: A Data-Based Domain Generalization Approach for Solar Module Segmentation Using Thermal UAV Images. In Proceedings of the 2024 10th International Conference on Control, Decision and Information Technologies (CoDIT), Vallette, Malta, 1–4 July 2024; pp. 1751–1755. [Google Scholar] [CrossRef]
- Barraz, Z.; Abdelmoula, I.A.; Lamrini, N.; Sebari, I. Production-Ready Deep Learning Model Optimization for Anomaly Detection in Photovoltaic Systems. In Proceedings of the 2023 10th International Conference on Electrical and Electronics Engineering, ICEEE 2023, Istanbul, Turkey, 8–10 May 2023; pp. 255–260. [Google Scholar] [CrossRef]
- Pruthviraj, U.; Kashyap, Y.; Baxevanaki, E.; Kosmopoulos, P. Solar Photovoltaic Hotspot Inspection Using Unmanned Aerial Vehicle Thermal Images at a Solar Field in South India. Remote Sens. 2023, 15, 1914. [Google Scholar] [CrossRef]
- Lamrini, N.; Barraz, Z.; Abdelmoula, I.A.; Ouachakradi, Z.; El Mehdi, A.; Sebari, I. A Hybrid and Scalable Architecture of a Monitoring System for Photovoltaic Installations. In Proceedings of the 2023 IEEE 11th International Conference on Smart Energy Grid Engineering, SEGE 2023, Oshawa, ON, Canada, 13–15 August 2023; pp. 153–159. [Google Scholar] [CrossRef]
- Utama, I.B.K.Y.; Pamungkas, R.F.; Faridh, M.M.; Jang, Y.M. Intelligent IoT Platform for Multiple PV Plant Monitoring. Sensors 2023, 23, 6674. [Google Scholar] [CrossRef]
- Segovia Ramírez, I.; García Márquez, F.P.; Parra Chaparro, J. Convolutional Neural Networks and Internet of Things for Fault Detection by Aerial Monitoring of Photovoltaic Solar Plants. Measurement 2024, 234, 114861. [Google Scholar] [CrossRef]
- Zhao, Y.; Liu, Q.; Li, D.; Kang, D.; Lv, Q.; Shang, L. Hierarchical Anomaly Detection and Multimodal Classification in Large-Scale Photovoltaic Systems. IEEE Trans. Sustain. Energy 2019, 10, 1351–1361. [Google Scholar] [CrossRef]
- Jin, L.; Shi, L.; Liu, K.; Zhong, M.; Pang, Y. Real-Time Fault Diagnosis of Photovoltaic Modules for Integrated Energy Systems Based on YOLOv7. In Proceedings of the 6th International Conference on Computer Information Science and Application Technology, Hangzhou, China, 26–28 May 2023; SPIE: Bellingham, WA, USA, 2023; Volume 12800, pp. 1462–1470. [Google Scholar] [CrossRef]
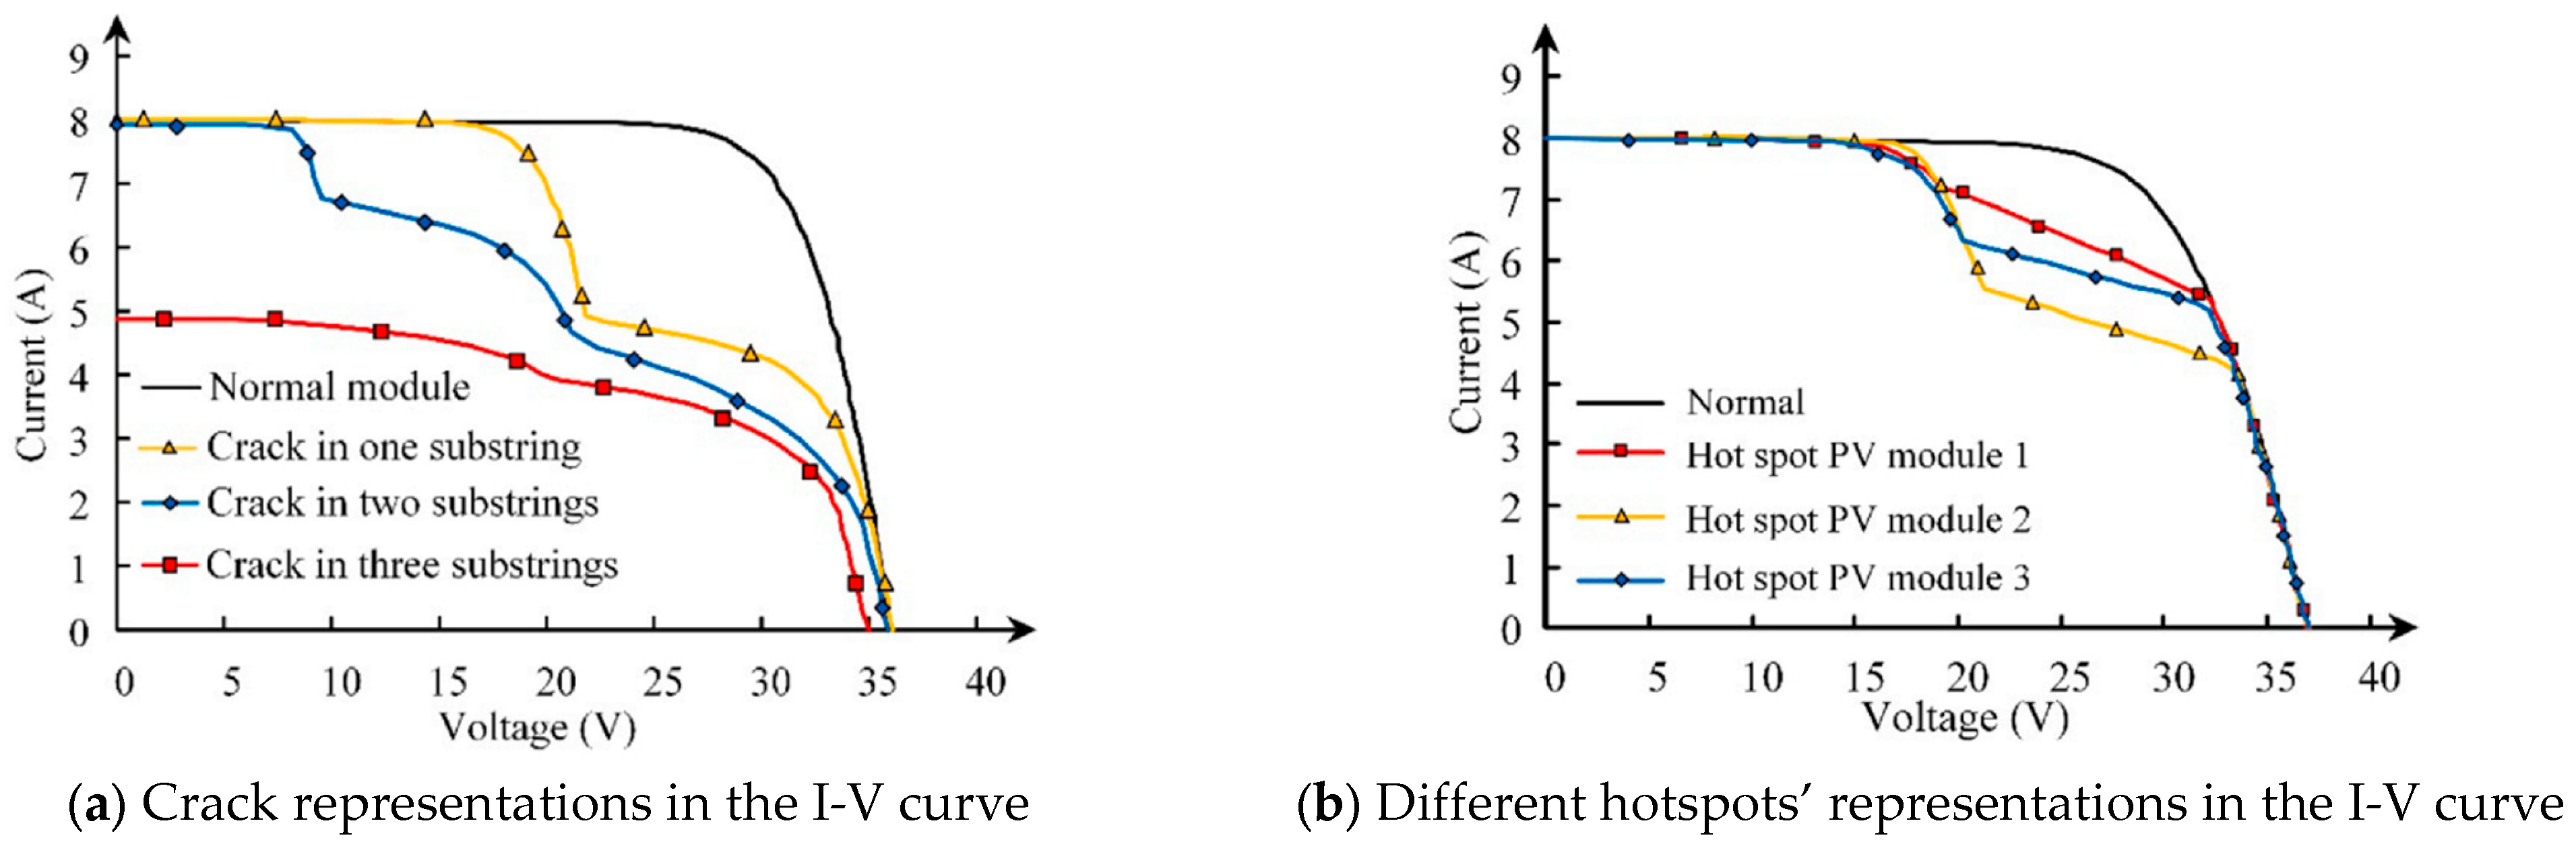
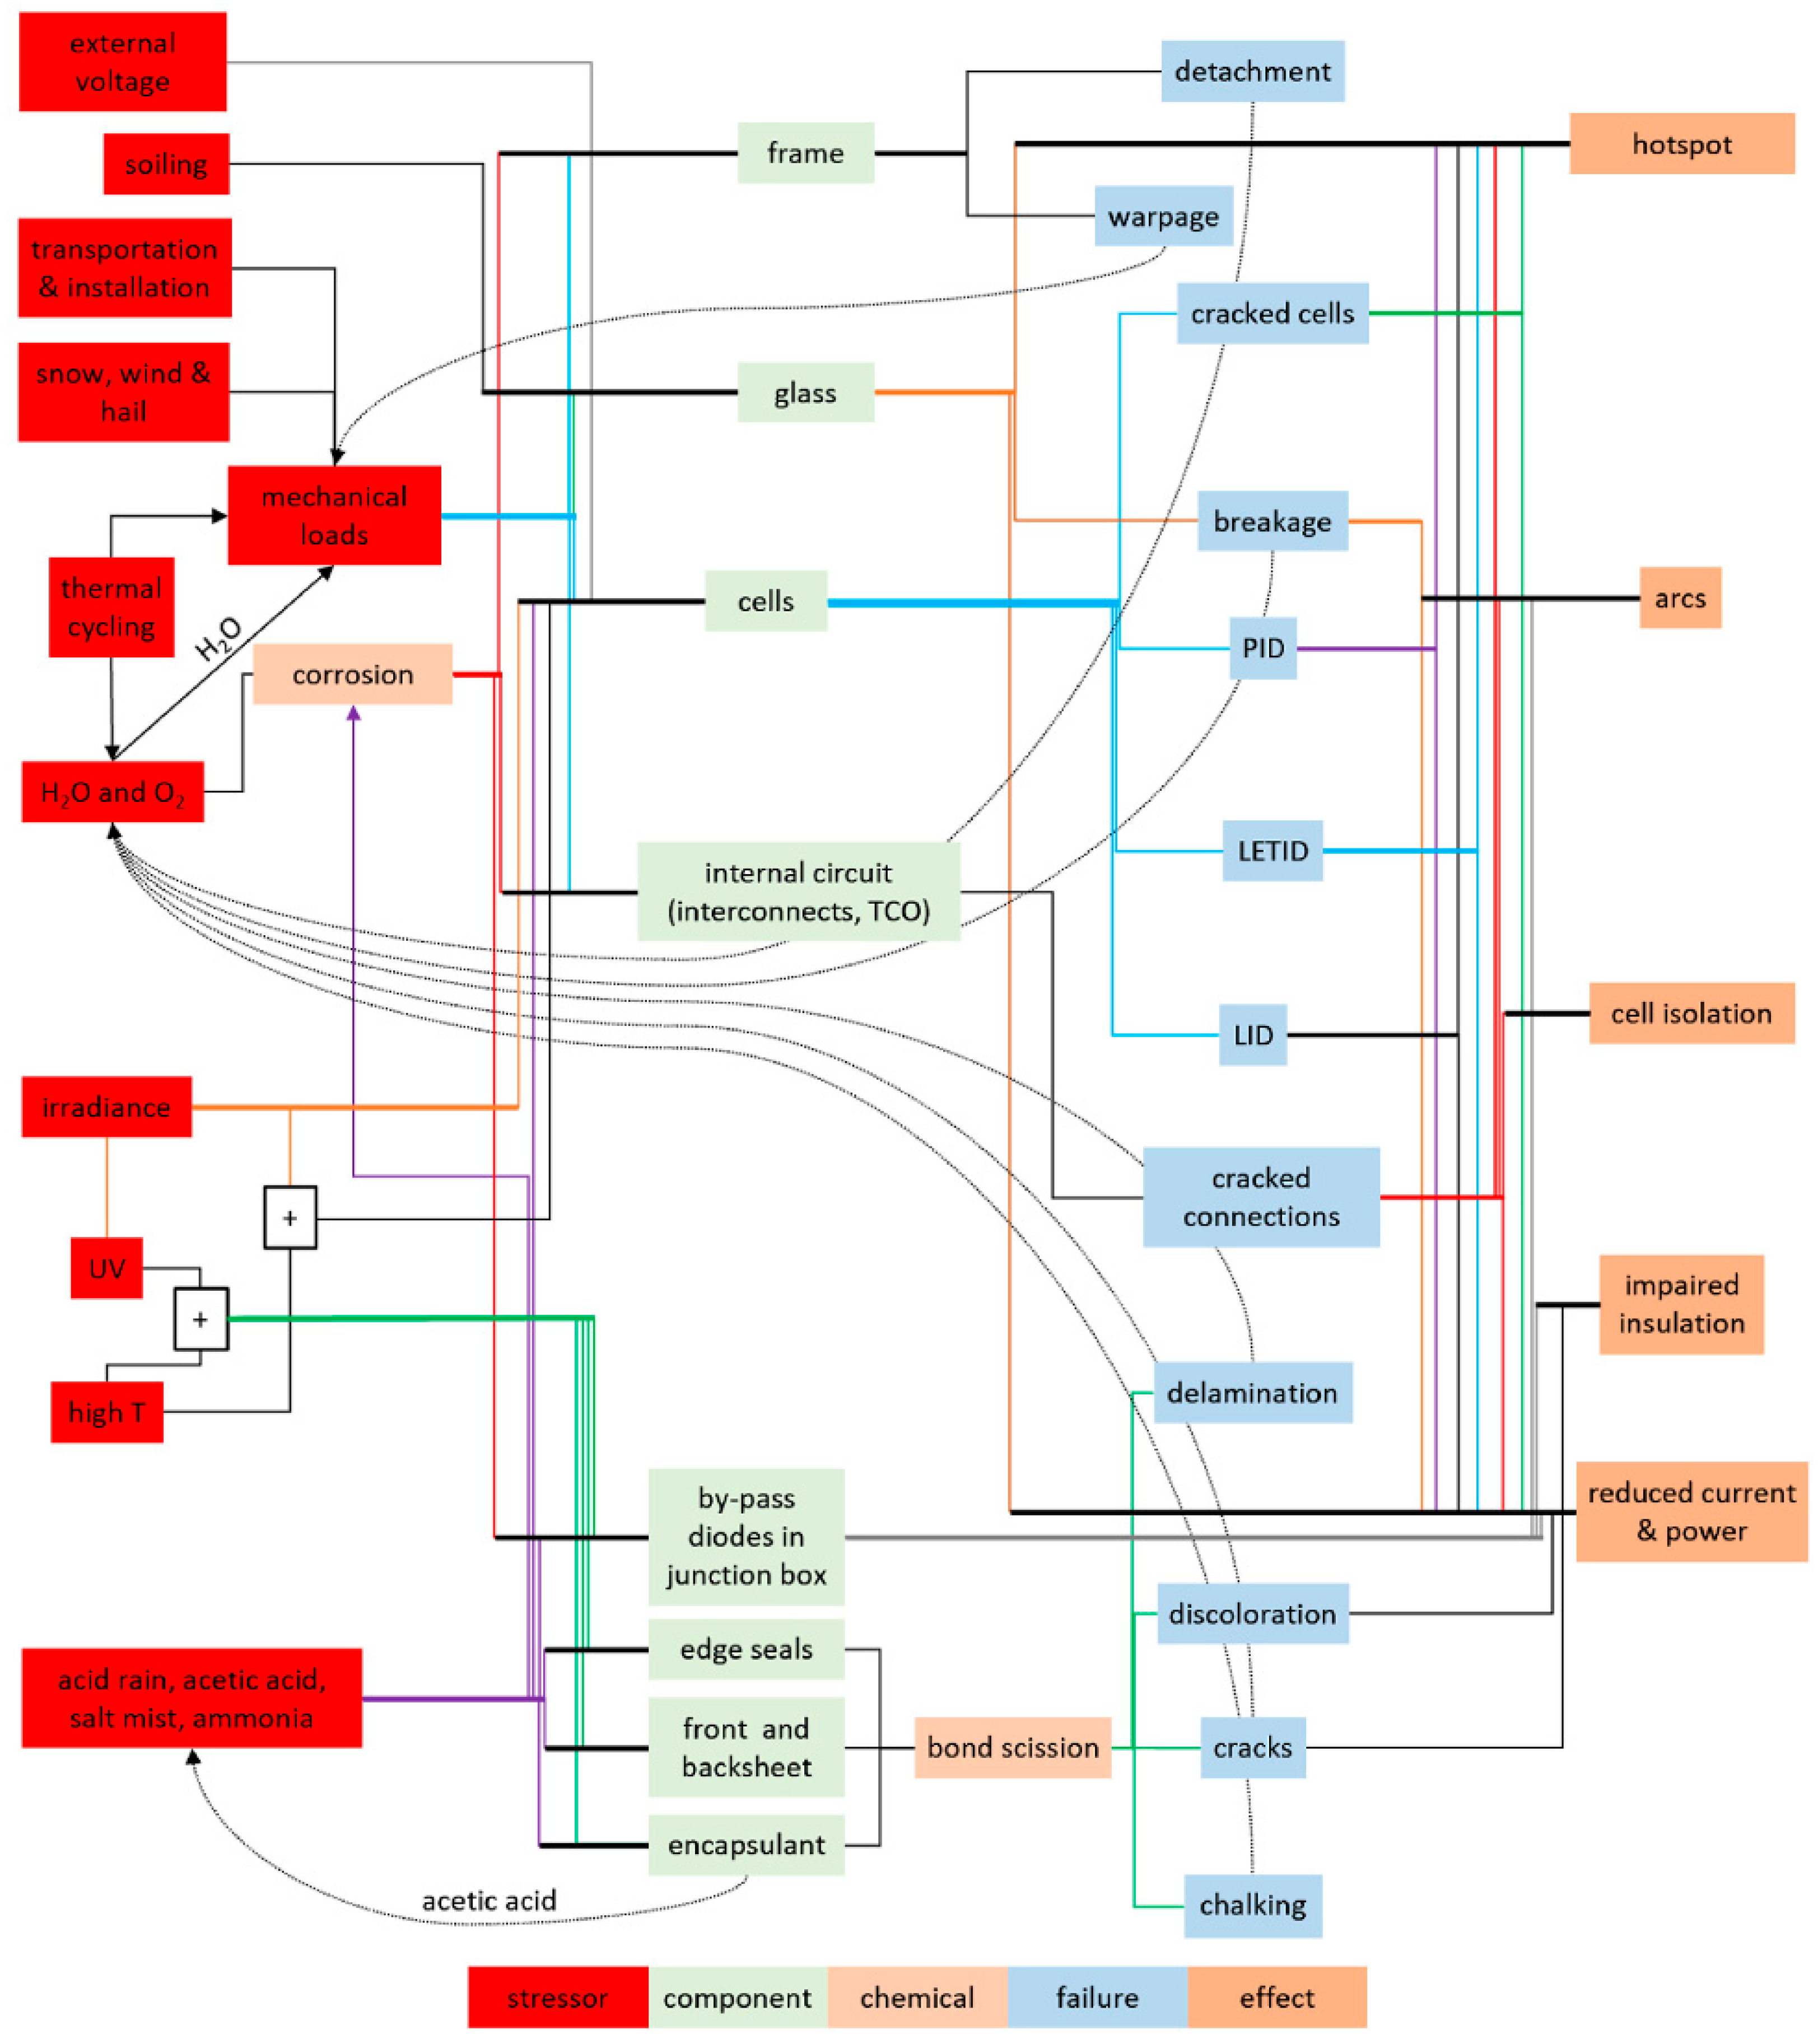
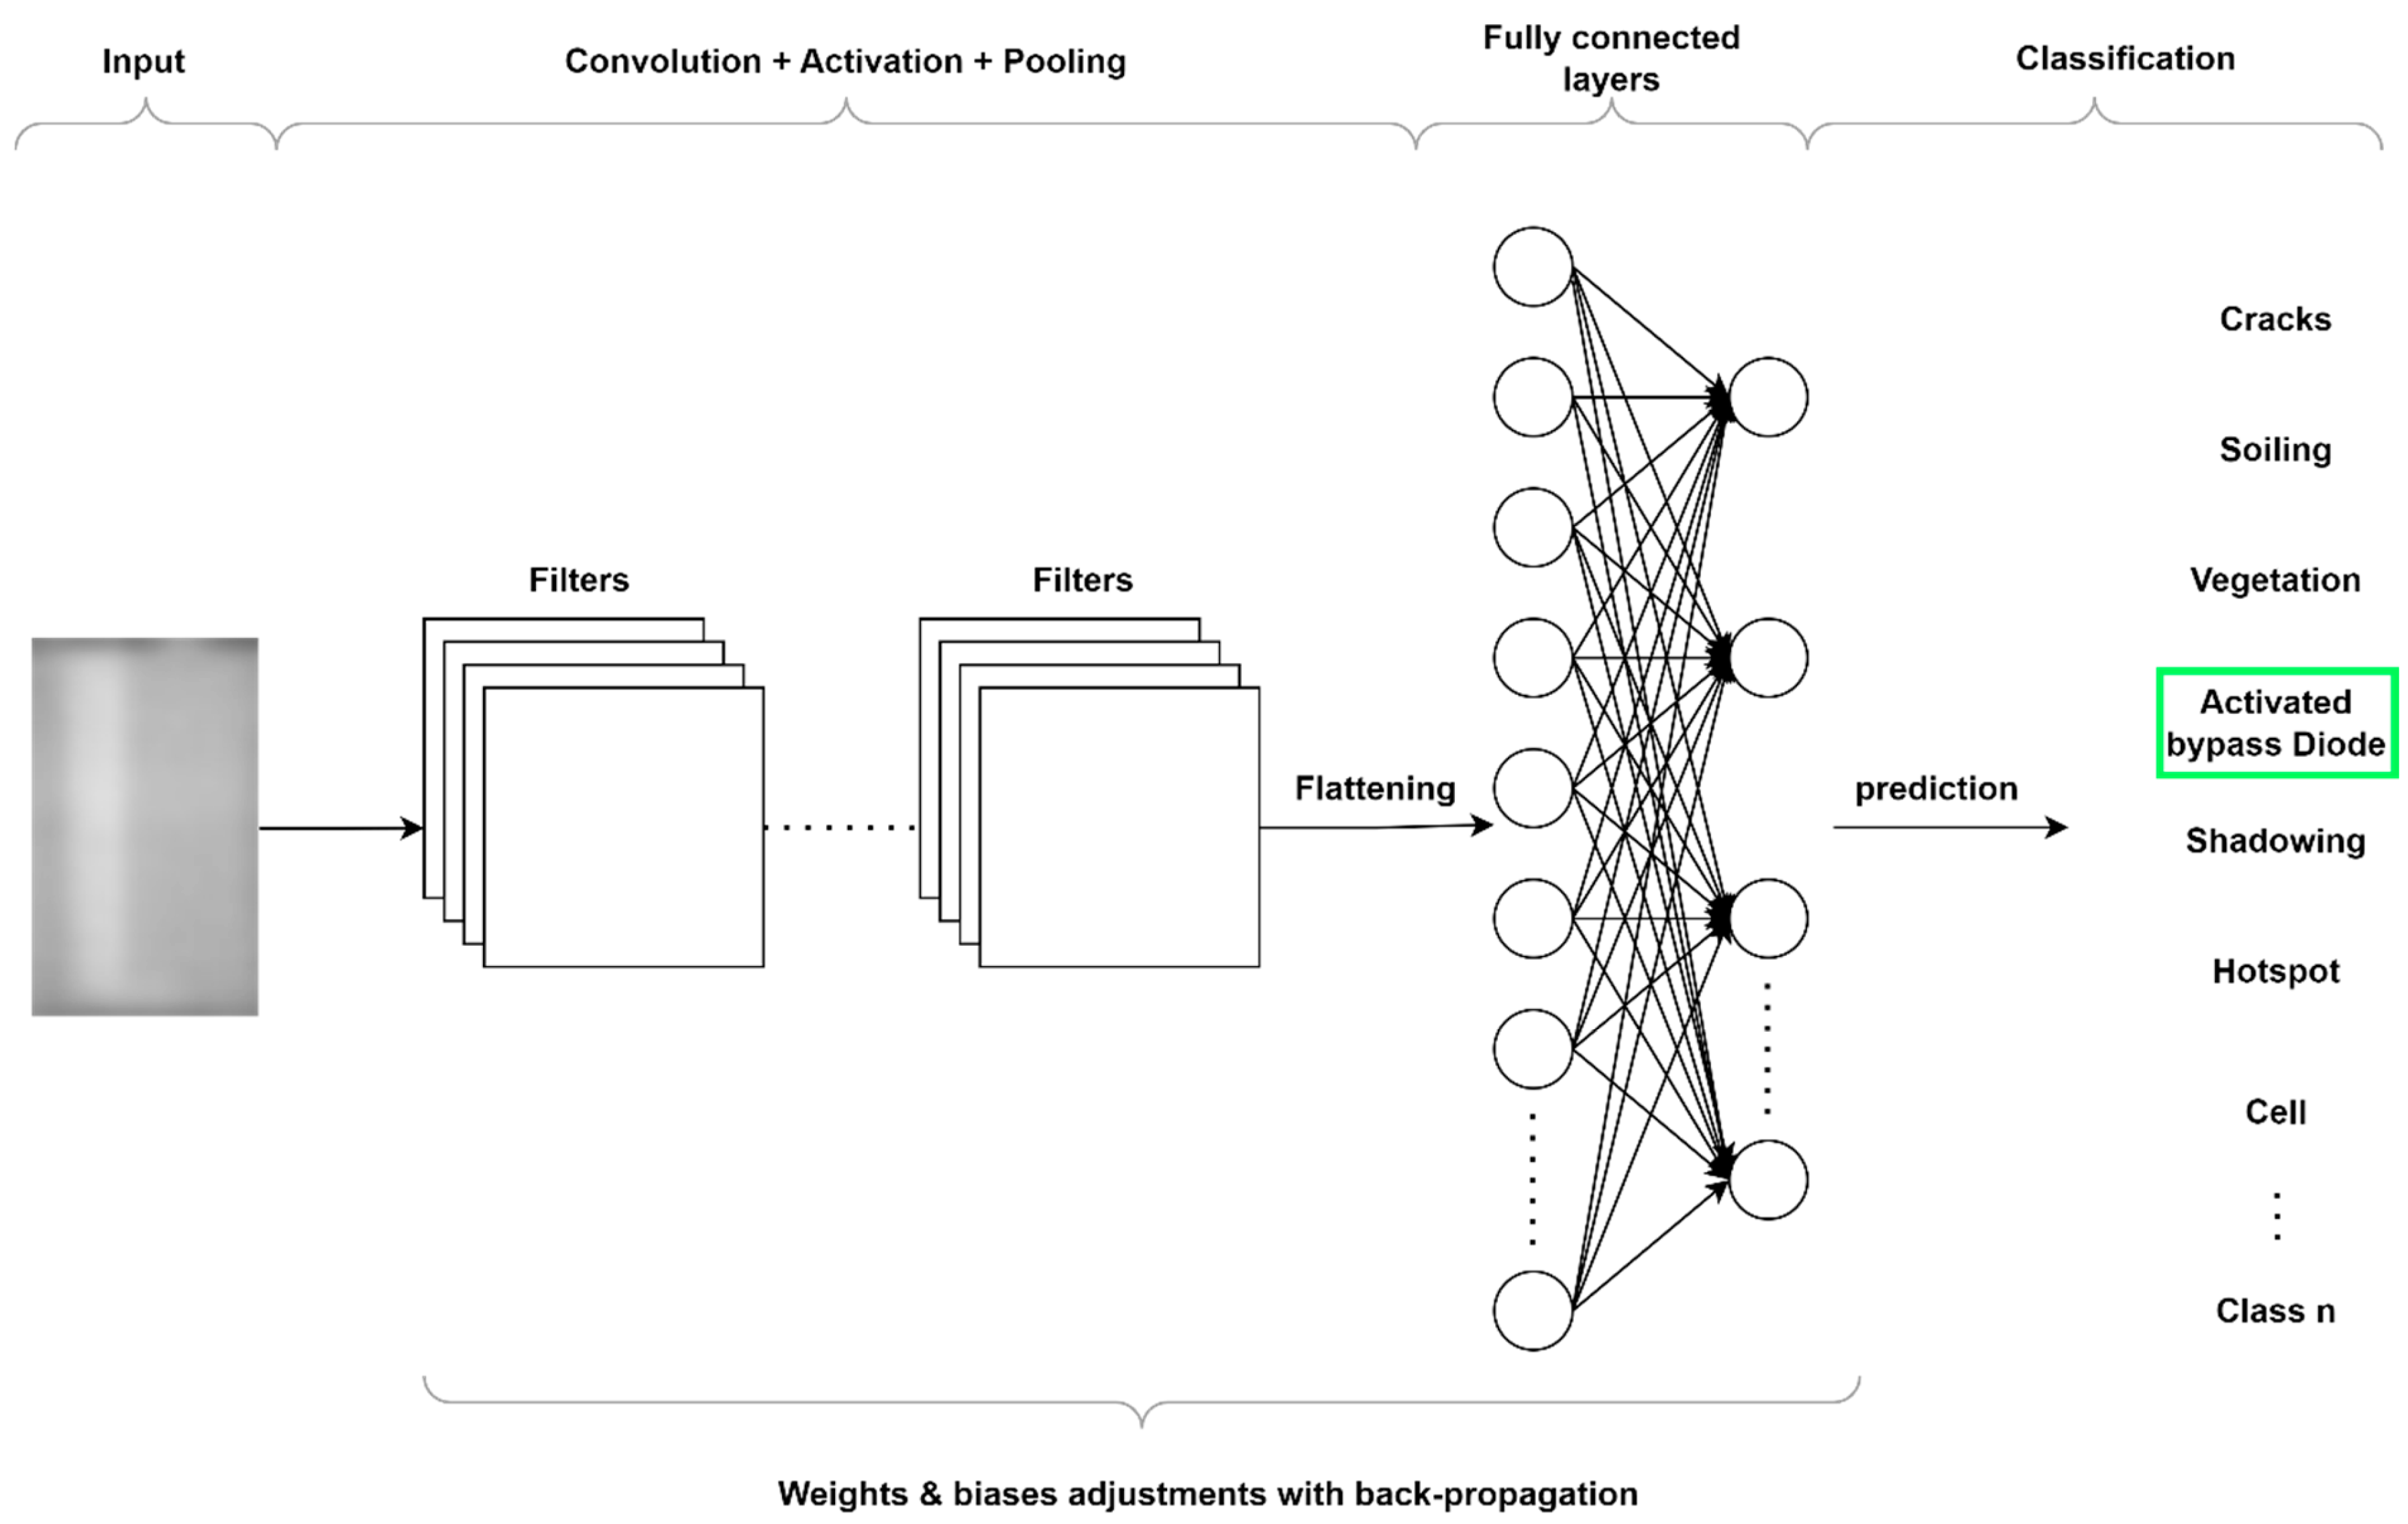
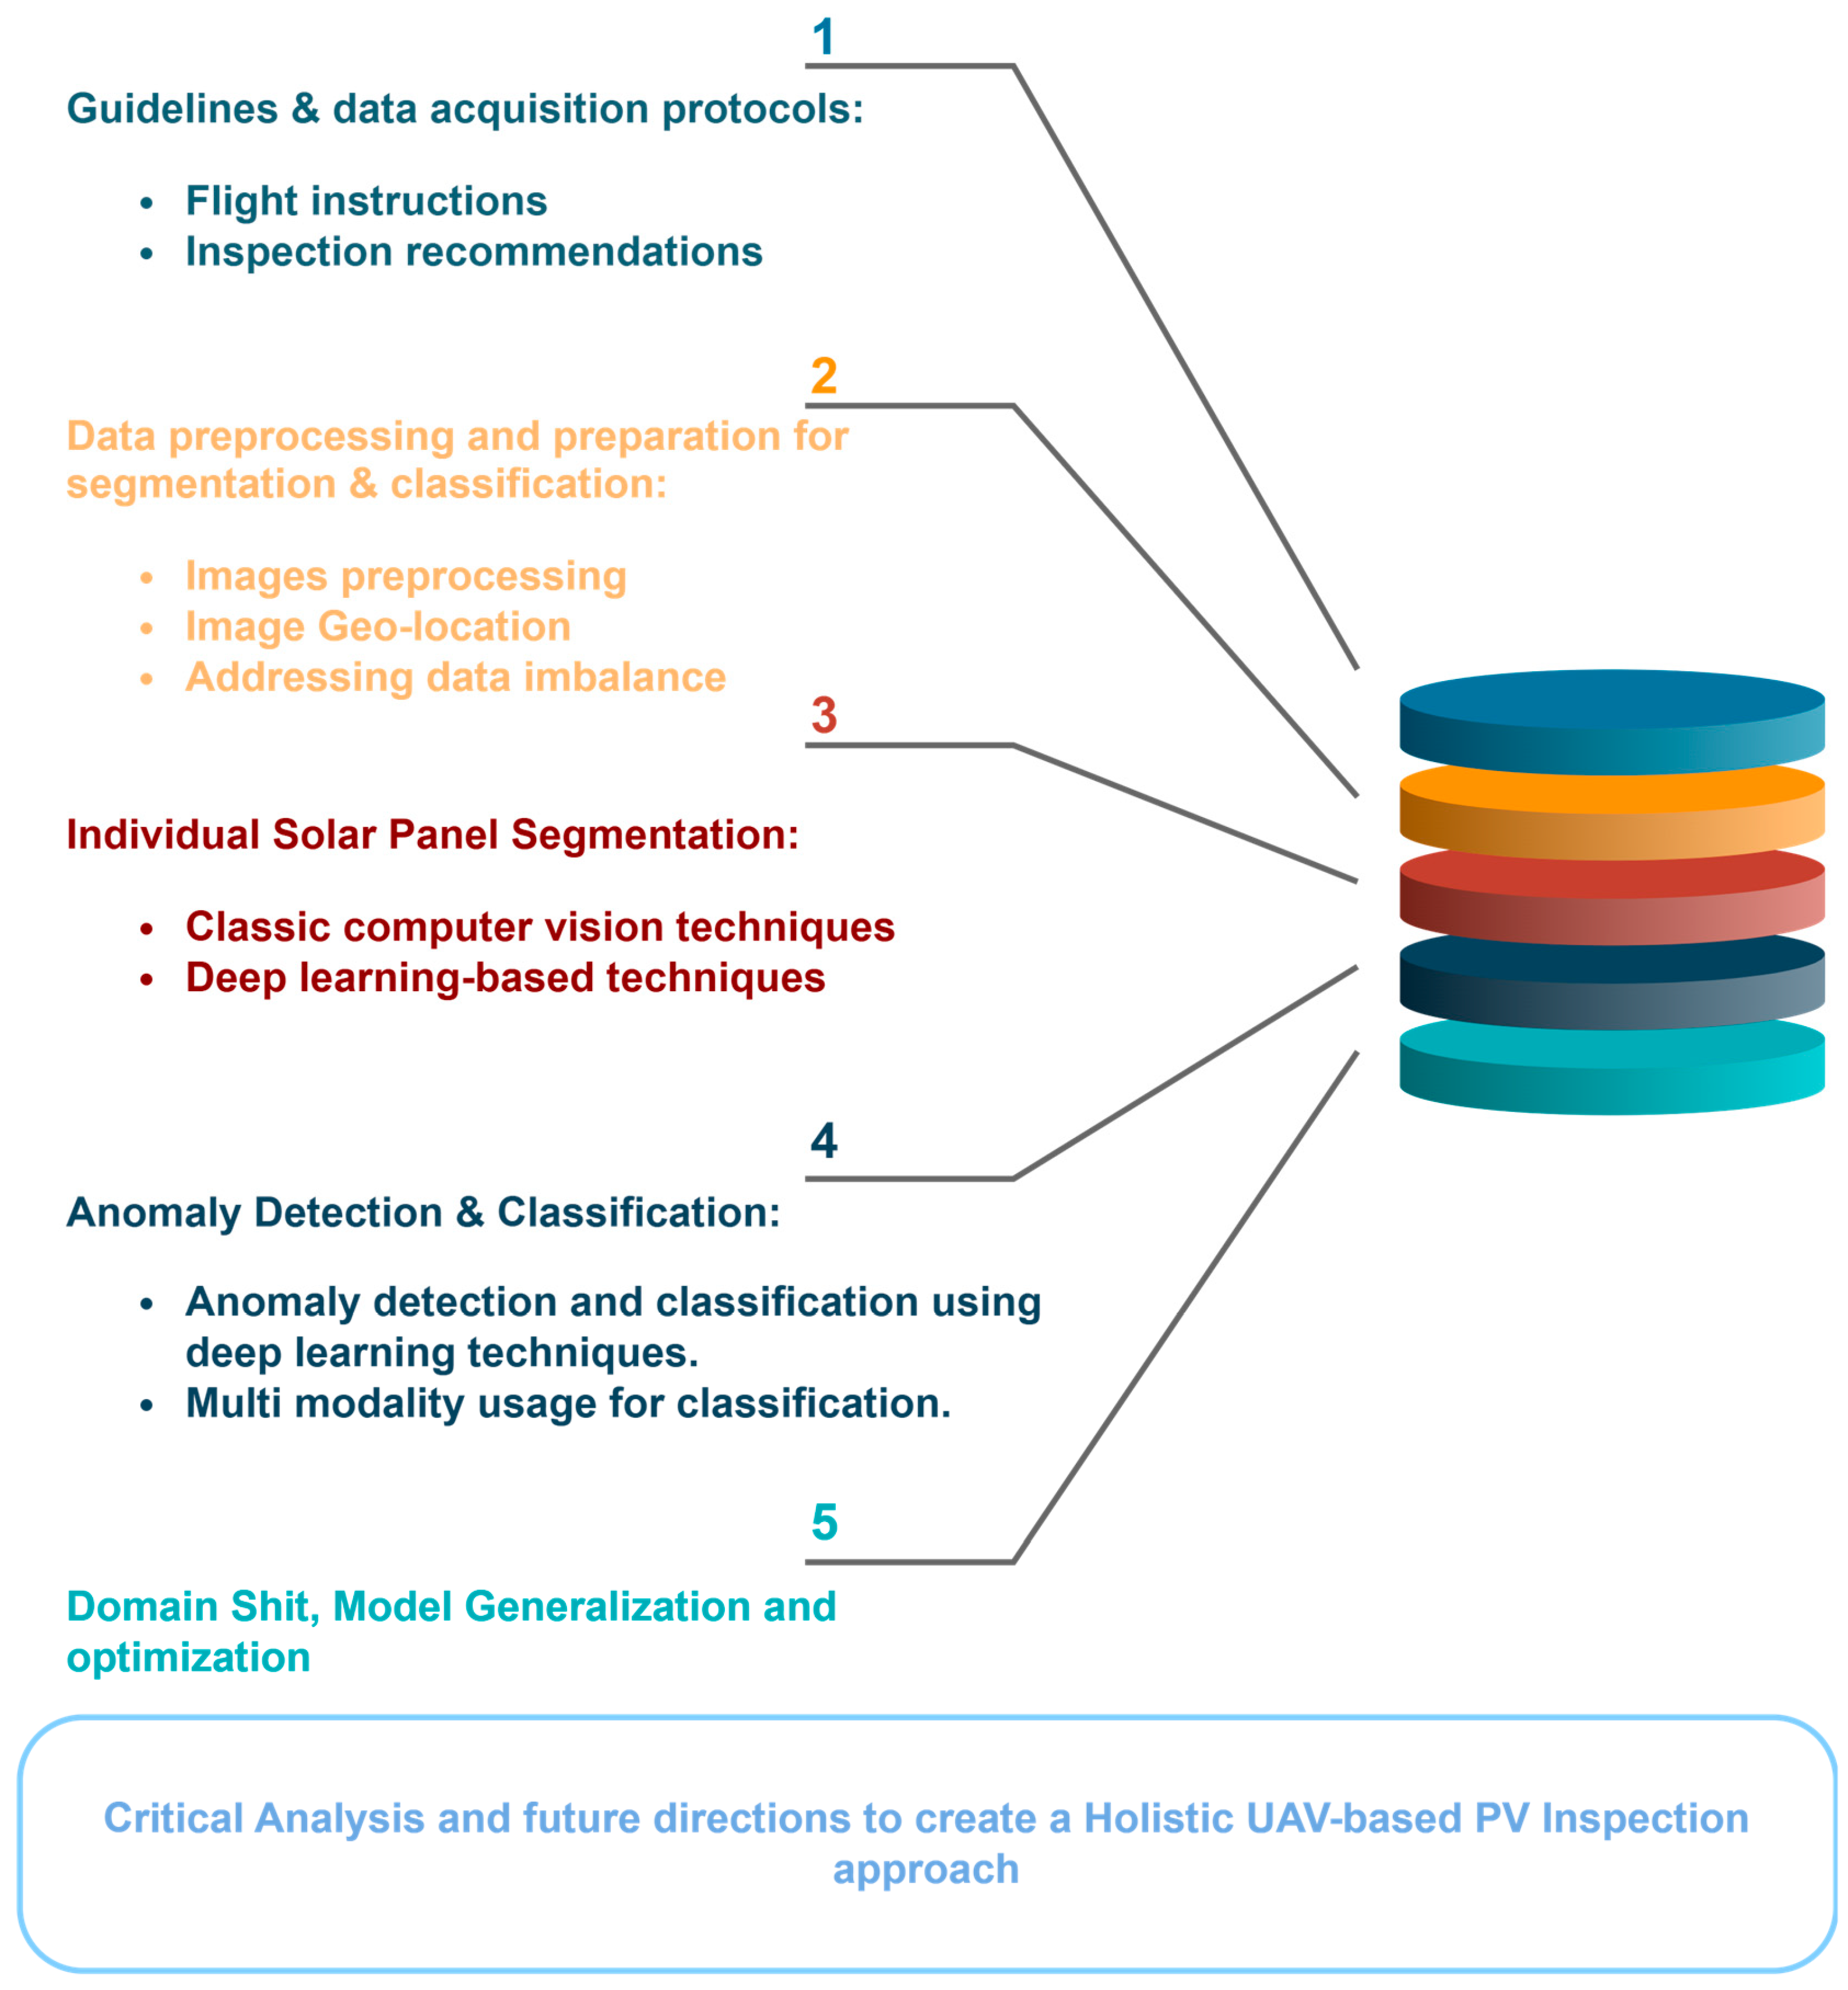
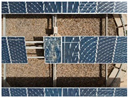
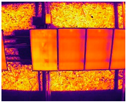
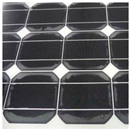
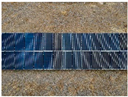
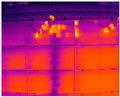
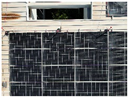
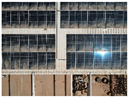
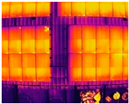
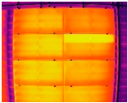
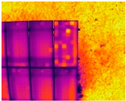
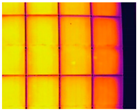
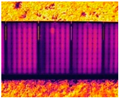
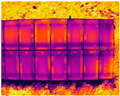
Disclaimer/Publisher’s Note: The statements, opinions and data contained in all publications are solely those of the individual author(s) and contributor(s) and not of MDPI and/or the editor(s). MDPI and/or the editor(s) disclaim responsibility for any injury to people or property resulting from any ideas, methods, instructions or products referred to in the content. |
© 2025 by the authors. Licensee MDPI, Basel, Switzerland. This article is an open access article distributed under the terms and conditions of the Creative Commons Attribution (CC BY) license (https://creativecommons.org/licenses/by/4.0/).