Article

Implementation of Machine Vision Methods for Cattle Detection and Activity Monitoring

by
Roman Bumbálek
1,
Tomáš Zoubek
1,
Jean de Dieu Marcel Ufitikirezi
1,
Sandra Nicole Umurungi
1,
Radim Stehlík
1,
Zbyněk Havelka
1,
Radim Kuneš
1,* and
Petr Bartoš
1,2
1
Department of Technology and Cybernetics, Faculty of Agriculture and Technology, University of South Bohemia in Ceske Budejovice, Studentska 1668, 37005 Ceske Budejovice, Czech Republic
2
Department of Applied Physics and Technology, Faculty of Education, University of South Bohemia in Ceske Budejovice, Jeronymova 10, 37115 Ceske Budejovice, Czech Republic
*
Author to whom correspondence should be addressed.
Technologies 2025, 13(3), 116; https://doi.org/10.3390/technologies13030116
Submission received: 24 January 2025 / Revised: 23 February 2025 / Accepted: 27 February 2025 / Published: 12 March 2025
(This article belongs to the Section Information and Communication Technologies)

Abstract

:
The goal of this research was to implement machine vision algorithms in a cattle stable to detect cattle in stalls and determine their activities. It also focused on finding the optimal hyperparameter settings for training the model, as balancing prediction accuracy, training time, and computational demands is crucial for real-world implementation. The investigation of suitable parameters was carried out on the YOLOv5 convolutional neural network (CNN). The types of the YOLOv5 network (v5x, v5l, v5m, v5s, and v5n), the effect of the learning rate (0.1, 0.01, and 0.001), the batch size (4, 8, 16, and 32), and the effect of the optimizer used (SGD and Adam) were compared in a step-by-step process. The main focus was on mAP 0.5 and mAP 0.5:0.95 metrics and total training time, and we came to the following conclusions: In terms of optimization between time and accuracy, the YOLOv5m performed the best, with a mAP 0.5:0.95 of 0.8969 (compared to 0.9070 for YOLOv5x). The training time for YOLOv5m was 7:48:19, while YOLOv5x took 16:53:27. When comparing learning rates, the variations in accuracy and training time were minimal. The highest accuracy (0.9028) occurred with a learning rate of 0.001, and the lowest (0.8897) with a learning rate of 0.1. For training time, the fastest was 7:47:17, with a difference of 1:02:00 between the fastest and slowest times. When comparing the effect of batch size, model accuracy showed only minimal differences (in tenths of a percentage), but there were significant time savings. When using a batch size of 8, the training time was 12:50:48, while increasing the batch size to 32 reduced the training time to 6:07:13, thus speeding up the training process by 6:43:35. The last parameter compared was the optimizer. SGD and Adam optimizers were compared. The choice of optimizer had a minimal impact on the training time, with differences only in seconds. However, the accuracy of the trained model was 6 per cent higher (0.8969) when using the SGD optimizer.

1. Introduction

Livestock production is a key component of global agriculture, ensuring food security and economic sustainability [1]. The well-being and productivity of dairy cows are closely linked to their behavior, with factors such as lying and standing time, feeding, and movement serving as indicators of health and welfare [2,3]. For this reason, cattle behavior classification is becoming an increasingly important tool for farmers.
Traditional methods of monitoring cattle behavior based on direct observation or sensor-based tracking, while effective, can be labor-intensive, costly, stressful, or prone to data inaccuracies [4,5,6]. The increasing availability of advanced image processing techniques, particularly deep learning-based approaches, has created new opportunities for automated behavior analysis in livestock farming [7,8,9]. Among deep learning techniques used for behavior recognition, convolutional neural networks (CNNs) have shown strong performance in object detection and classification tasks [10]. Previous research has explored CNN-based methods for animal behavior monitoring, including Gu et al. (2022), who applied YOLOv5 to analyze the distressing behavior of cage-reared ducks [11]; Cheng et al. (2022), who used CNNs to classify sheep behaviors, distinguishing between standing, lying down, feeding, and drinking [12]; and Jiang et al. (2020), who applied YOLOv3 and YOLOv4 to detect individual goats in a small group [13]. In cattle farming, Yin et al. (2020) used EfficientNet-LSTM to recognize cow motion behaviors in a complex farm environment, achieving a behavior recognition accuracy of 97.87% [14]. Wang et al. (2023) also proposed an efficient 3D CNN algorithm to recognize the cow basic behaviors. The proposed algorithm achieved an outstanding result [15]. Wu et al. (2021) proposed a CNN-LSTM (fusion of convolutional neural network and long short-term memory) algorithm for recognizing five cow behaviors, resulting in outstanding accuracies (95.8−99.5%) [16]. Shang et al. (2022) also proposed an algorithm for identifying standing and walking cattle cow behaviors [17]. Similarly, several other researchers, including Fuentes et al. (2020), Zong et al. (2025), Wang et al. (2023), Yu et al. (2024), Tong et al. (2024), Jia et al. (2024), Tian et al. (2022), Li et al. (2024), Mu et al. (2024), and many more, also proposed significant methods for different cattle behavior recognition, achieving remarkable results [18,19,20,21,22,23,24,25,26]. However, many existing studies either focus on individual animal detection or use small-scale datasets that limit real-world applicability. Moreover, the optimization of hyperparameters for efficient model training remains an area requiring further research to balance detection accuracy with computational efficiency. This study addresses these gaps by evaluating and optimizing machine vision algorithms for detecting and classifying cattle activity in a stall-based environment. The main objective of this study is to evaluate and optimize deep learning-based object detection models for the automated classification of cattle activity. To achieve this, we compare different YOLOv5 network variants (v5x, v5l, v5m, v5s, and v5n) to identify the most suitable model in terms of accuracy and computational efficiency. Additionally, we evaluate the impact of key hyperparameters, including learning rate, batch size, and optimizer selection, on model performance. By systematically analyzing these factors, we aim to suggest an optimized machine vision-based monitoring approach that balances detection accuracy with practical feasibility, ensuring effective application in precision livestock farming.

2. Materials and Methods

A convolutional neural network, YOLOv5, was chosen for classifying the activity of dairy cows in a stall-based environment, mainly based on its well-documented balance between detection accuracy and computational efficiency [27]. This advantage makes it well-suited for real-time livestock monitoring, where computational efficiency is critical. To evaluate the most suitable YOLOv5 variant for this study, we compared YOLOv5n, YOLOv5s, YOLOv5m, YOLOv5l, and YOLOv5x, considering detection accuracy, training efficiency, and inference speed.

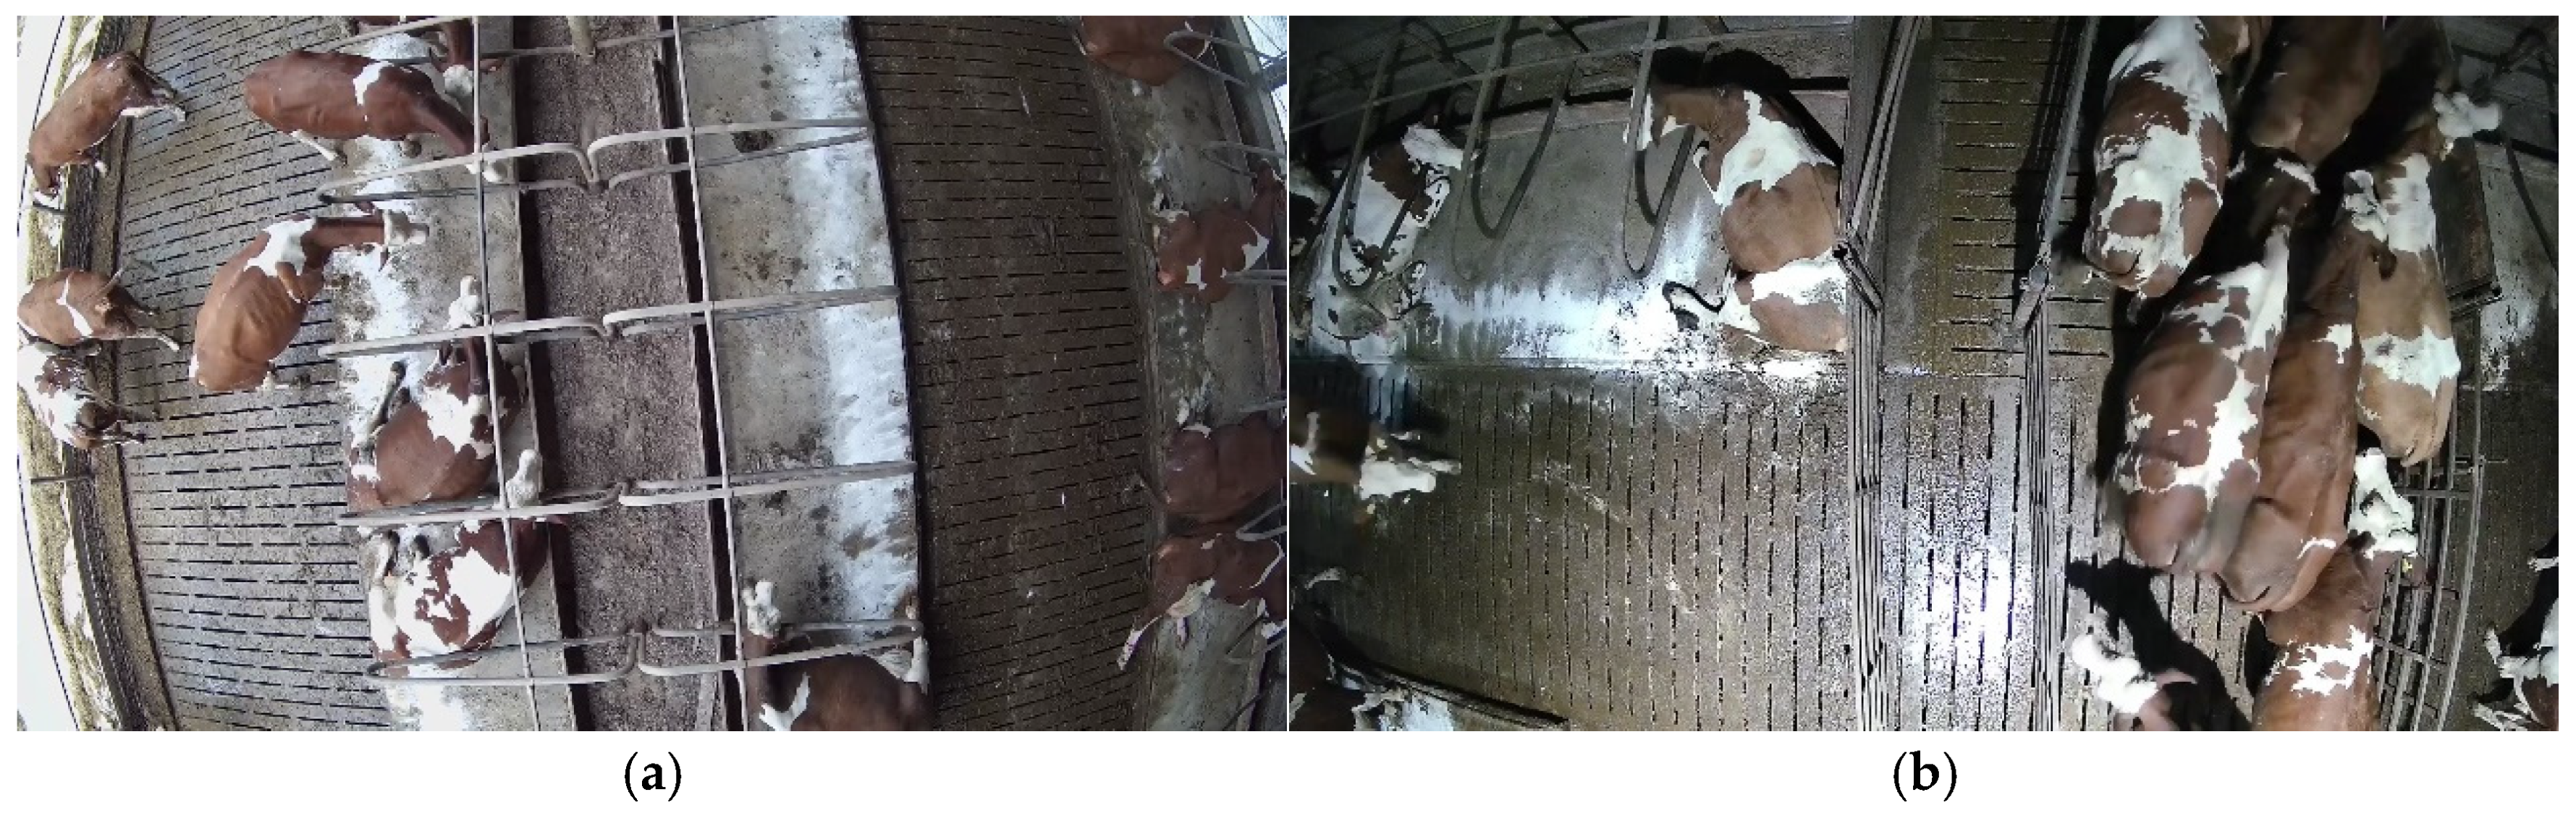
2.1. Experimental Environment and Data Collection

The experiment was carried out at the Agricultural Cooperative Opařany on a dairy cow farm. The whole experiment was designed to comply with the welfare principles. One hundred animals were kept in the observation box. The barn is divided into two halves by a feeding and service aisle. On each half, there is a feeding and lying area, including drinking troughs and scratchers. The aisle for the transition to the milking parlor is situated on the left side of the stall. To move cattle from the right side of the stall to the milking parlor, it is therefore necessary to block the feeding and service aisle. The experiment was carried out in only part of the stall. The selected part was equipped with a camera system for data collection, specifically two RGB cameras (HIKVISION DS-2CD2T46G2-2I and DS-2CD1023G0-I), sourced from Hikvision, headquartered in Hangzhou, China, were placed here. Camera No. 1 was installed above the left half of the stall to cover both the feeding aisle and the lying area. The camera covered 1/8 of the left stall. Camera 2 was installed perpendicular to the aisle where the cows are led to the milking parlor. The entire aisle is covered with a slight overlap into the surrounding lying area. The views of both cameras are captured in Figure 1.

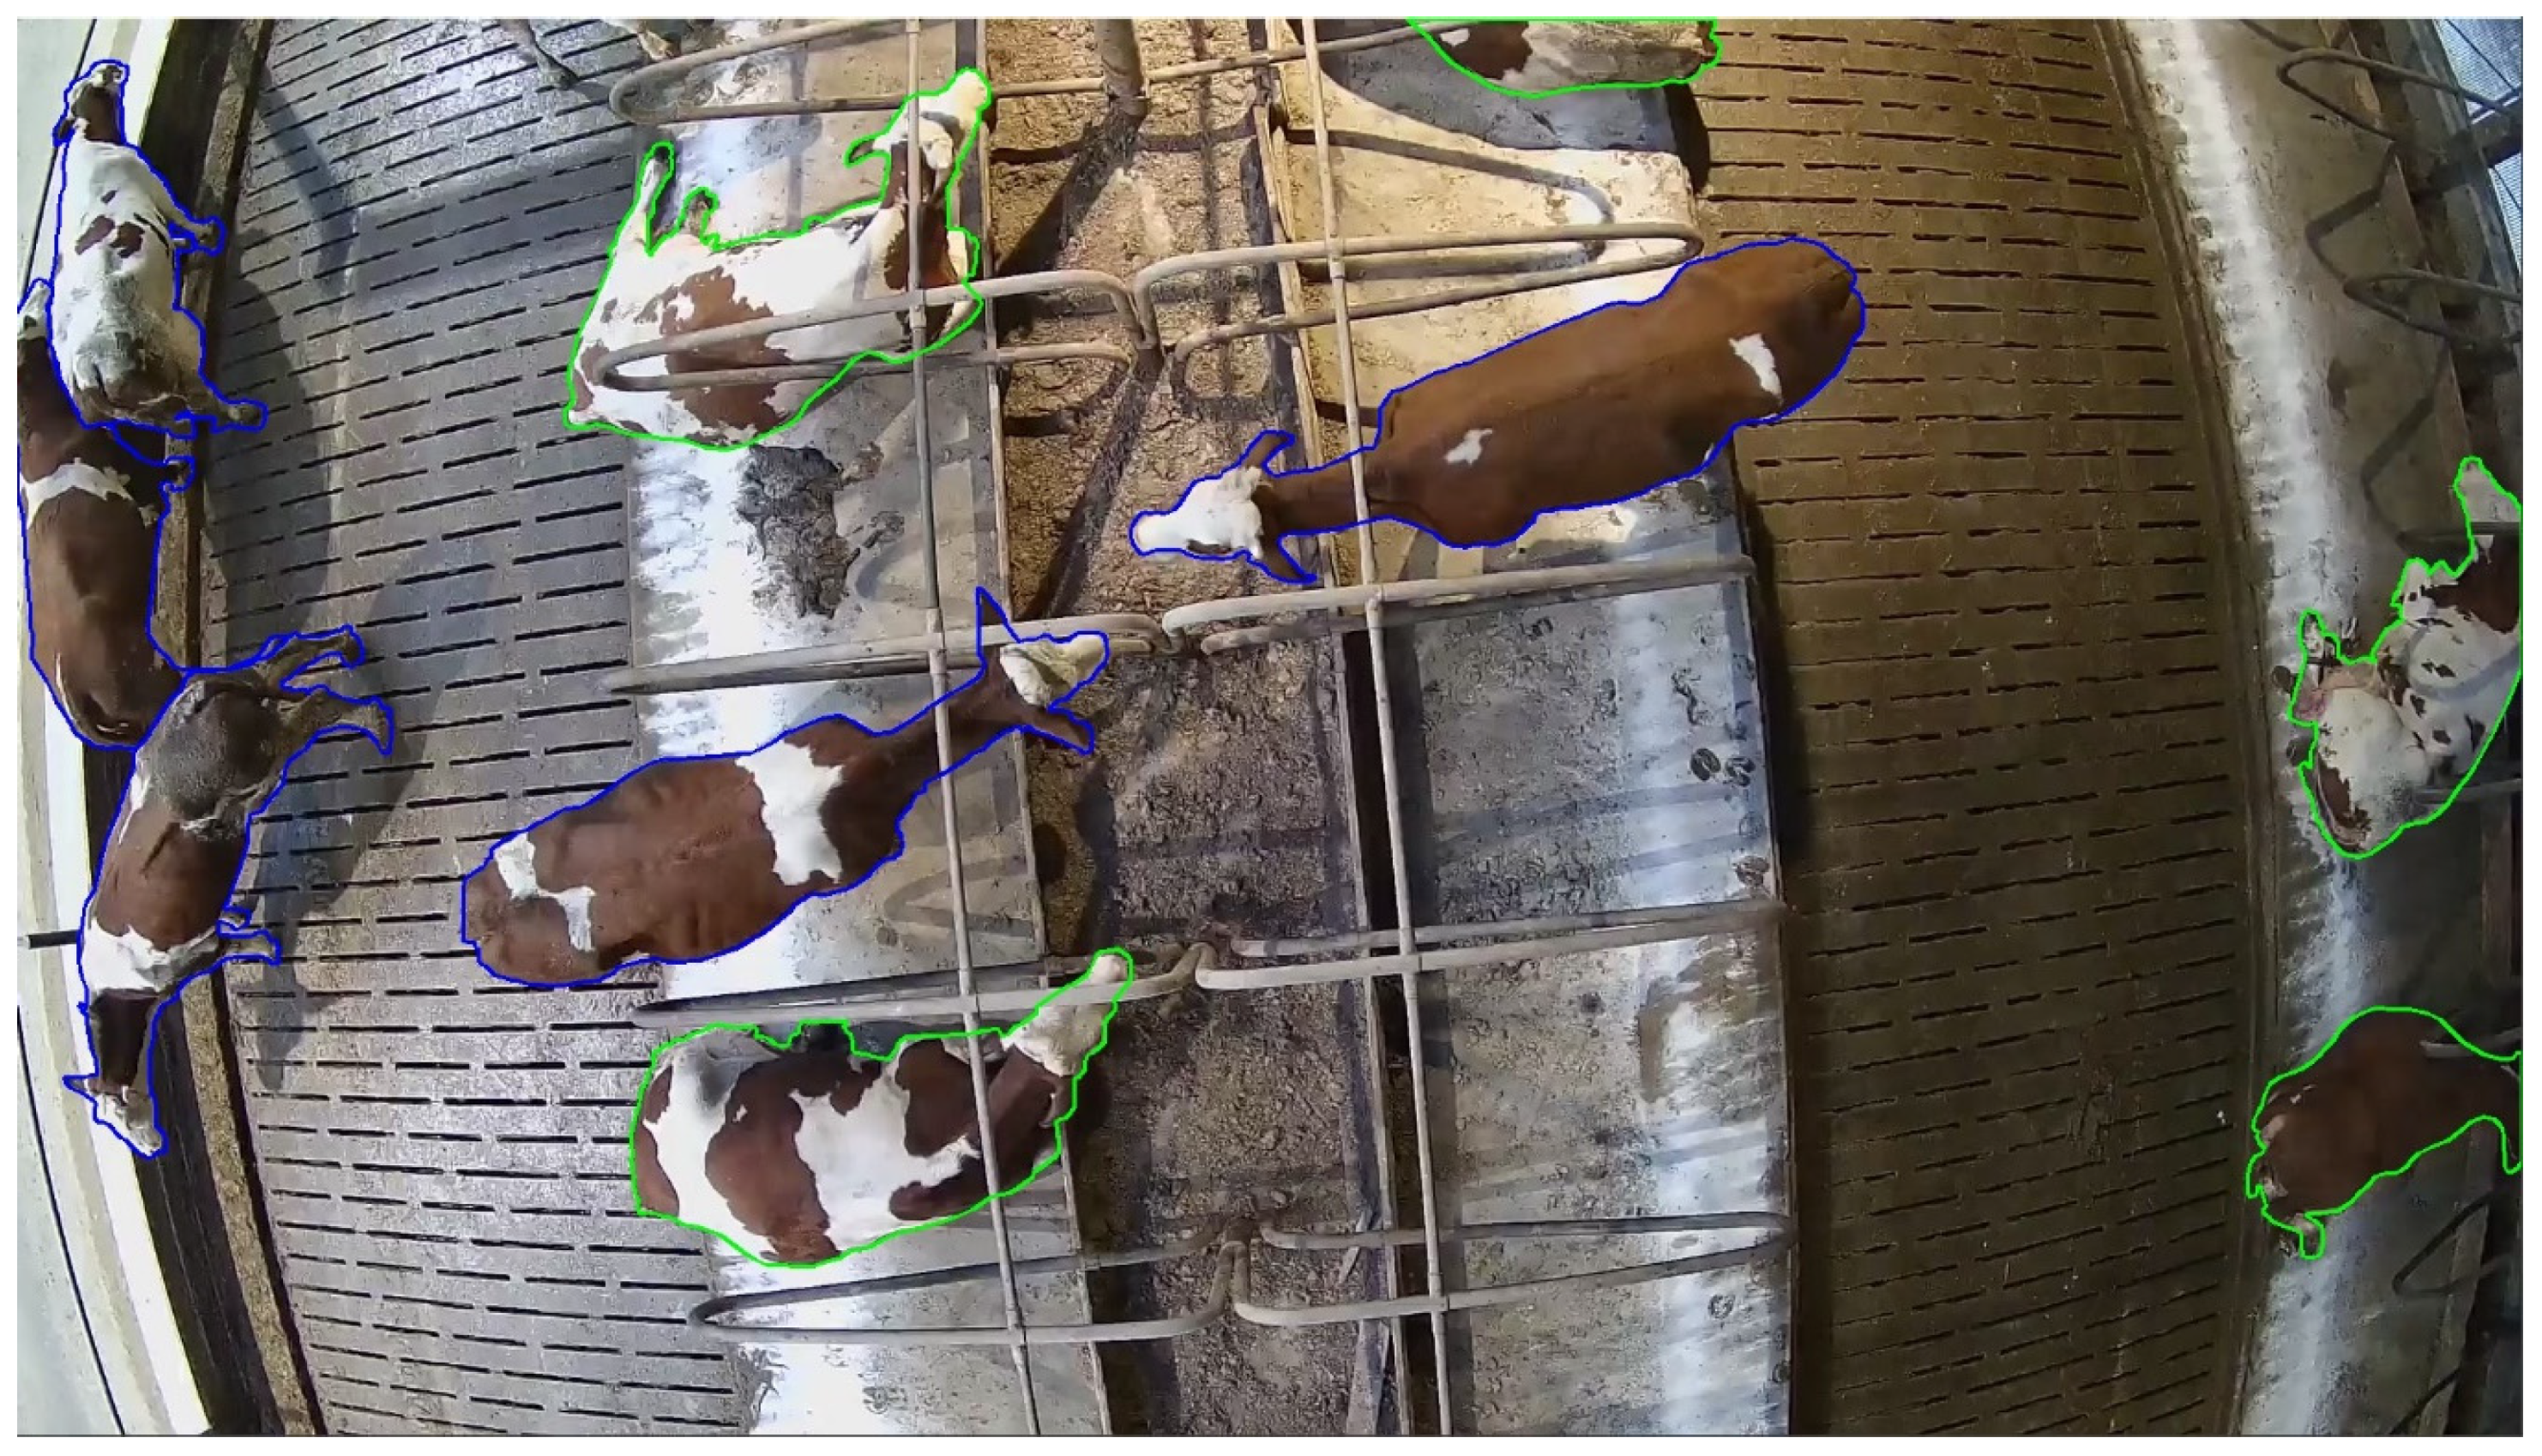
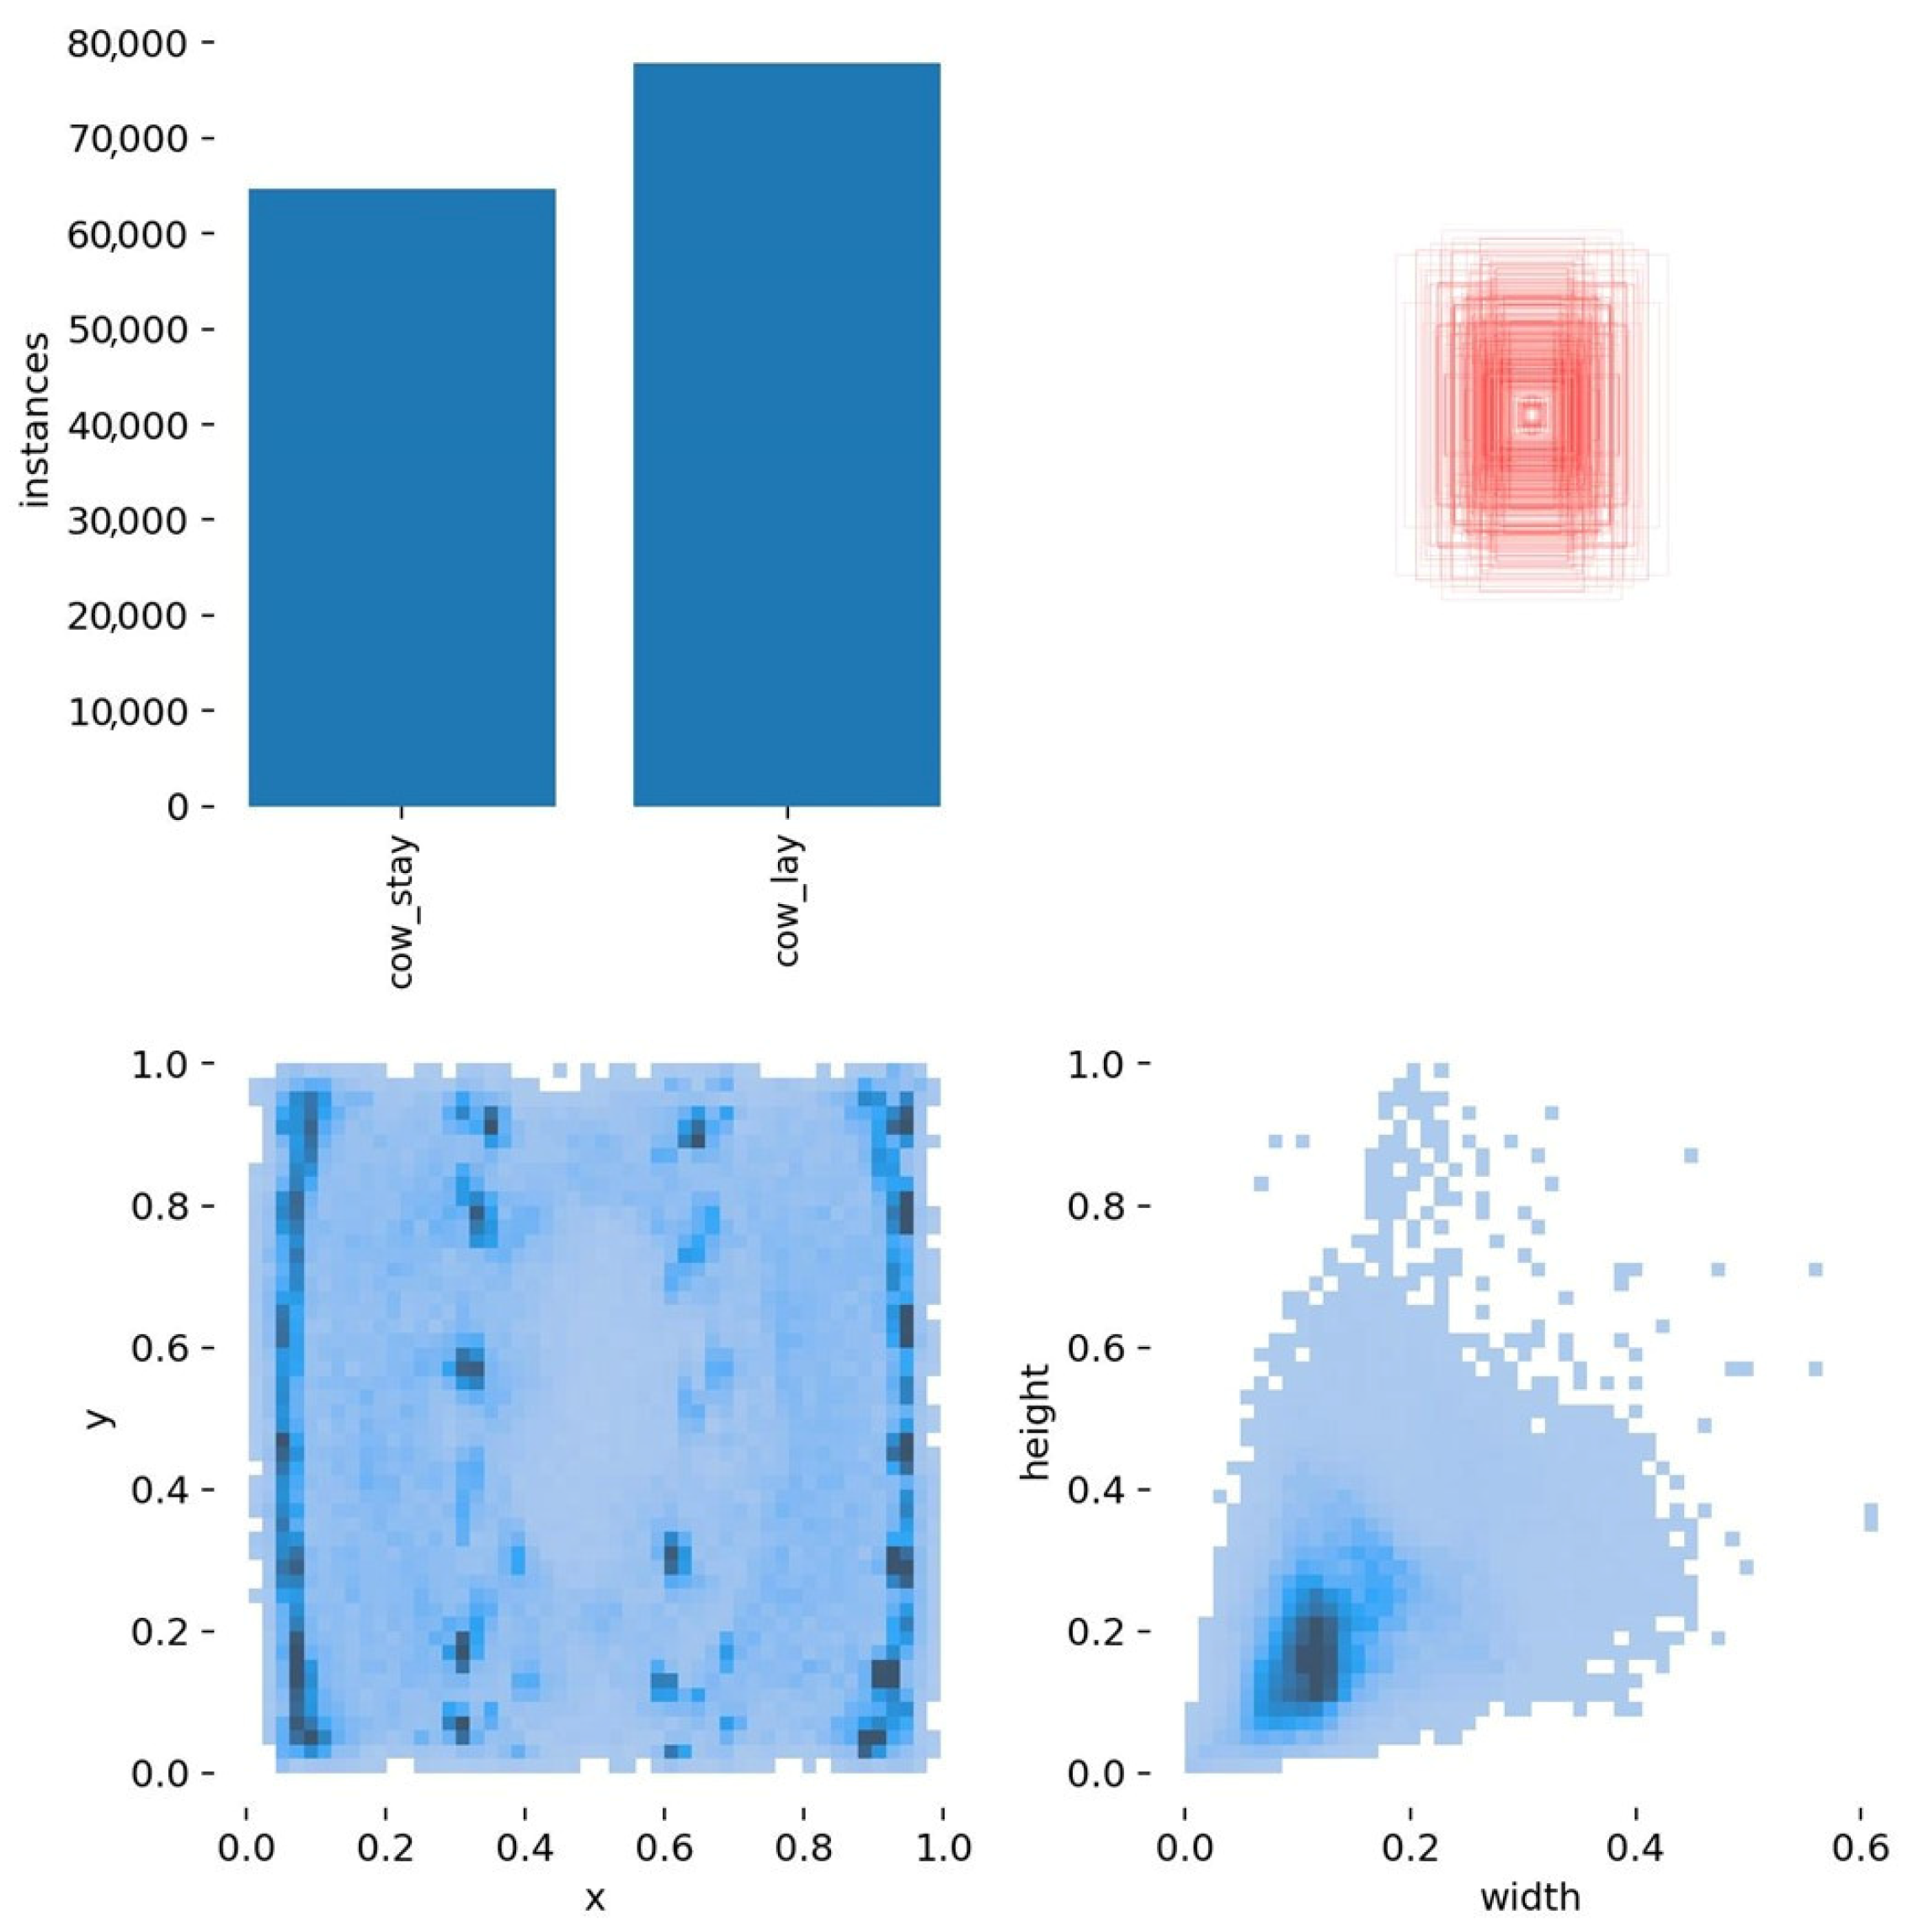
2.2. Dataset Creation

The acquired image material (1920 × 1080 resolution) was processed and subsequently used as a dataset to train the neural network. In the first editing step, single frames were created from the acquired video footage using a custom script based on the FFmpeg library, where an image was captured every 3 min from the selected video frames and then saved in jpg format. Unused video frames were left for later verification of the reliability of the trained network. To make the dataset as diverse as possible, video recordings with different lighting conditions were processed to obtain images. Variability was also ensured by using images from different phases of the daily routine of the reared animals. During feed loading, the majority of animals were always aligned at the feeding aisle, and after the feeding was completed, the animals rested in the bedding area, as illustrated in Figure 2. This diversity helps prevent overfitting and improves real-world generalization.
From the video footage collected over a period of 5 months, 30,000 images were created, from which 2000 were selected for further processing. Subsequently, these images were annotated in COCO format using the free, open-source annotation tool CVAT. The images were annotated using polygonal masks, and all labeled objects were classified into two classes (cow_stay and cow_lay), which can be seen in Figure 3.
Such annotated images were augmented using a proprietary algorithm. The specific adjustments made by the algorithm are described in Table 1. After all these adjustments, the resulting dataset consisted of 28,000 images, of which 25,000 were used to train the network, 1000 to validate the learning, and 2000 to test the trained network. The properties of the observed objects in the input dataset are shown in Figure 4.

2.3. Model Selection

The selection of YOLOv5 for this study was driven by a balance between accuracy, computational efficiency, and practical deployment considerations, particularly in agricultural applications. While newer YOLO versions (YOLOv6–YOLOv11) introduce various refinements and architectural advancements, the decision to adopt a specific model must go beyond performance metrics alone. Practical considerations such as hardware compatibility, inference speed, deployment feasibility, and accessibility play a crucial role, especially in real-world agricultural environments where computational resources are often limited and affordability is a key concern.
Newer YOLO versions tend to be more complex, requiring higher computational power and memory, which can be a limiting factor for edge devices, embedded systems, and small-scale farms that lack access to high-end GPUs. In contrast, YOLOv5 offers a well-established, lightweight yet robust framework that ensures real-time performance on a wider range of hardware, making it more suitable for practical, on-site implementation. Its stability, extensive community support, and proven track record across various domains further reinforce its reliability in field applications.
Additionally, real-world agricultural AI applications prioritize efficiency, scalability, and ease of integration over marginal gains in accuracy. While newer YOLO versions may provide enhancements in certain scenarios, these benefits often come at the cost of increased deployment complexity and greater computational expense. In contrast, YOLOv5 remains a widely adopted and field-tested solution that meets the performance and efficiency requirements needed for practical applications.
Given these considerations, YOLOv5 was selected as a well-founded and effective choice for this study, ensuring a practical, scalable, and computationally efficient solution that aligns with the needs of real-world agricultural applications. Rather than solely prioritizing newer architectures, this research emphasizes accessibility, deployability, and sustainability, which are key factors in practical AI implementation beyond controlled experimental conditions.

2.4. Examined Hyperparameters

To optimize the performance of YOLOv5 for cattle activity detection, we carefully tuned key hyperparameters, including learning rate (LR), batch size (BS), and optimizer selection. These hyperparameters directly impact model convergence, accuracy, and computational efficiency, making their selection critical for real-world deployment.

2.4.1. Learning Rate (LR)

The learning rate controls how much model weights are adjusted during training. If too high, the model may converge too quickly, leading to suboptimal performance or overfitting. If too low, training may be excessively slow and may not reach an optimal solution [28]. We evaluated the LR values of 0.1, 0.01, and 0.001 to determine an appropriate balance between convergence stability and training efficiency.

2.4.2. Batch Size (BS)

The batch size affects the stability, training speed, and memory usage of the model. Smaller batch sizes (e.g., 4) improve convergence stability but slow down training, while larger batch sizes (e.g., 16) speed up processing but require more GPU memory and may reduce generalization ability [29]. To evaluate the impact of batch size on performance, we tested values of 4, 8, 12, and 16.

2.4.3. Optimizer

In general, an optimizer is a procedure that tells how to adjust the weights in the model during backpropagation. For the theoretical analysis of suitable optimizers, we relied on a comparative study of optimizers for convolutional neural networks [30]. Based on this, we selected two suitable candidates, namely SGD (Mini-batch Stochastic Gradient Decent) and Adam (Adaptive Moment Estimation). From a practical point of view, the selection of a suitable optimizer affects both the quality of the resulting solution found (convergence) and the training time. SGD is a classical version of the gradient decent optimizer, and due to updates via mini-batches, it has a low memory footprint and higher robustness. On the other hand, the disadvantage is a higher sensitivity to the choice of the default LR [30]. The main practical advantages of the Adam optimizer in machine vision include its very fast convergence and its ability to avoid the vanishing gradients problem [31].

2.5. The Training Process and Model Evaluation

The learning process was performed on a virtual server with an NVIDIA A30 graphics card and Debian 10 operating system. For the training, 100 epochs were chosen for all parameter settings. The selected models were trained under conditions where the batch value was set to 8, the learning rate value was 0.01, and SGD was chosen as the optimizer. Next, the v5m model was trained with batch values of 4, 8, 12, and 16 at LR 0.01. At batch 8, LR was further changed to 0.1 and 0.001. The v5m model was trained with the SDG optimizer and Adam at batch 8 and LR 0.01. The metrics Precision (P—Equation (1)), Recall (R—Equation (2)), and Mean Average Precision (mAP—Equation (3)) were used to evaluate the trained model. The P value indicates the proportion of true positive objects among all positively detected objects, while the R-value indicates the proportion of all correctly identified objects to the number of all correct cases [32]. The area enclosed by the curve in the coordinate system, where P denotes the vertical and R the horizontal axis, is called the Average Precision. The mean of the average precision of all target categories is mAP [33].
P = 1 n i = 1 n T P i F P i + T P i
R = 1 n i = 1 n T P i F N i + T P i
m A P = i = 1 n 0 1 P i R i d R i n
where TP is true positive (correctly labeled objects), FP is false positive, and FN is false negative.

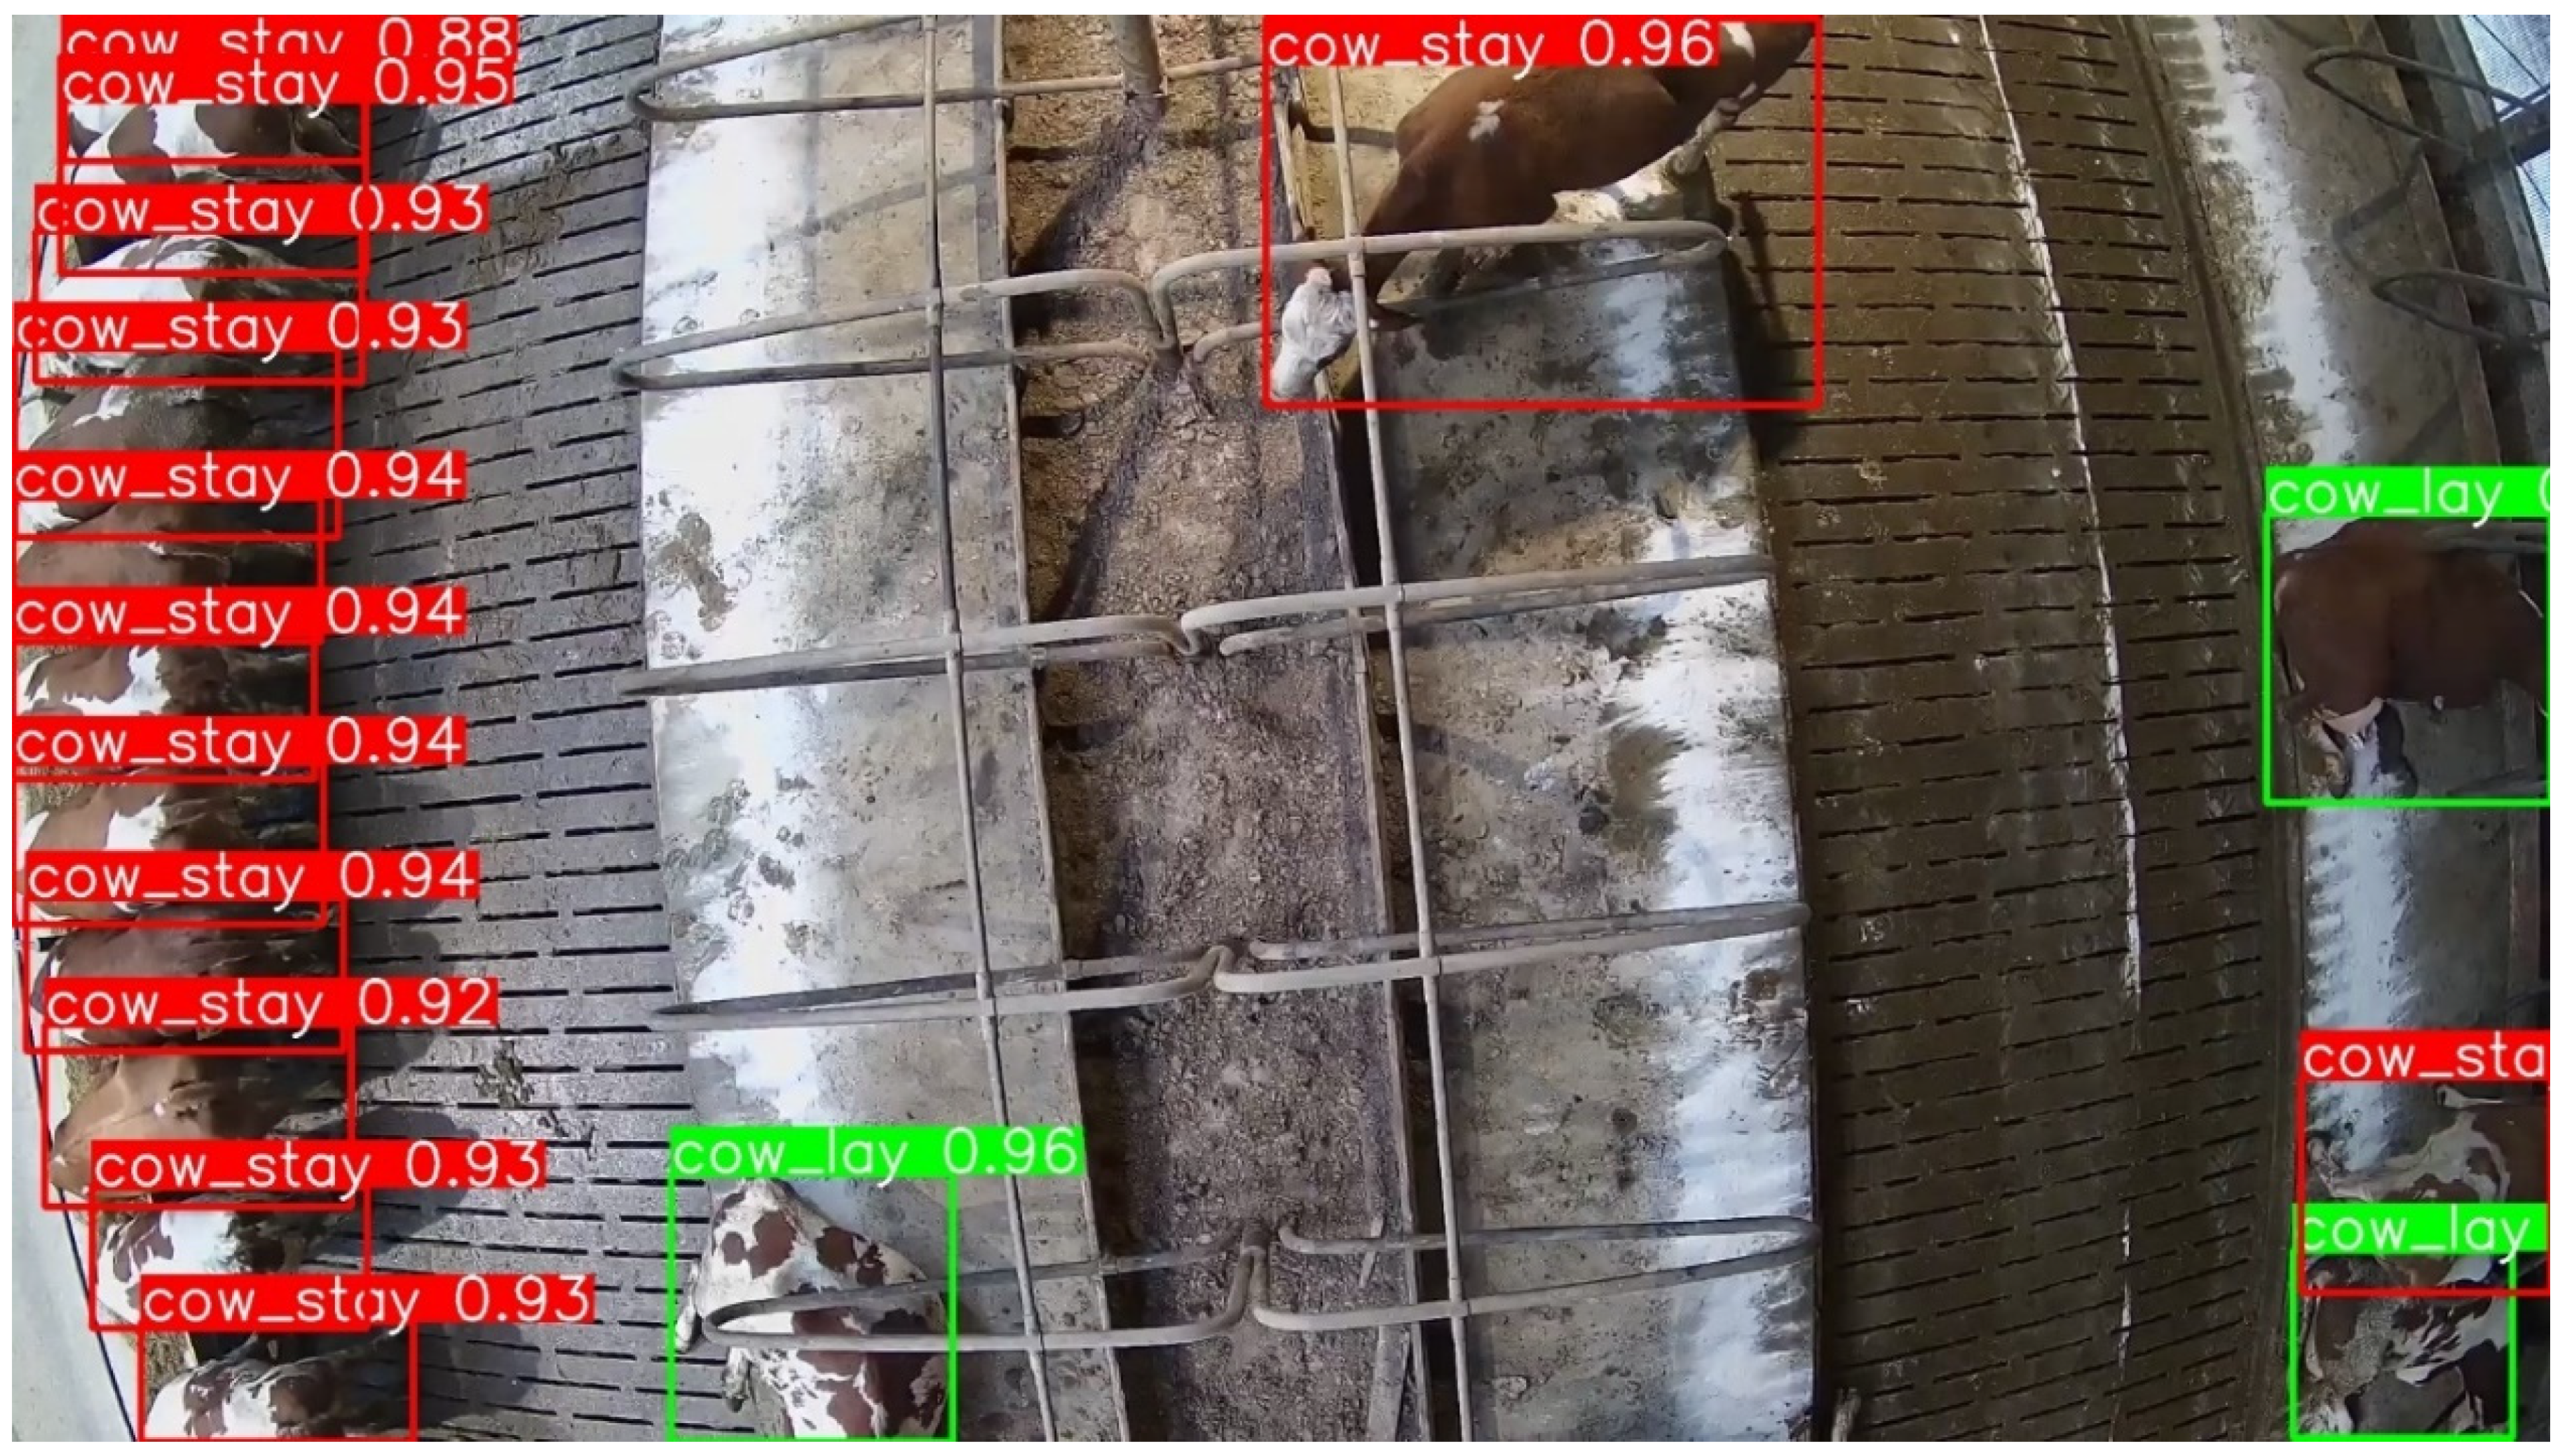
3. Results and Discussion

The trained YOLOv5m model demonstrated strong detection accuracy across various stall conditions. For this application, it was trained using a batch size of 8, a learning rate of 0.01, and the SGD optimizer for 100 epochs. As shown in Figure 5, Figure 6 and Figure 7, the model effectively identified individual cattle, even in challenging scenarios such as crowded stalls and low-light environments. Notably, detection performance remained stable at night, as illustrated in Figure 7. However, despite this high overall performance, some misclassifications were observed, particularly in distinguishing between cow_stay and cow_lay. The classification ability of the trained model is shown by the confusion matrix in Figure 8. The cow_stay class was correctly classified 97% of the time; 2% of the time, it was determined to be the cow_lay class; and 1% of the time, it was not observed by the model. For the cow_lay class, the classification accuracy was 96%; it was mistaken for the cow_stay class in 2% of the predictions and was also not detected by the model in 2%. The majority of the cases where the class was not detected by the model were for the cow_lay class, namely 57%. A comparison of selected metrics of the applied retrained YOLOv5m model is presented in Table 2.

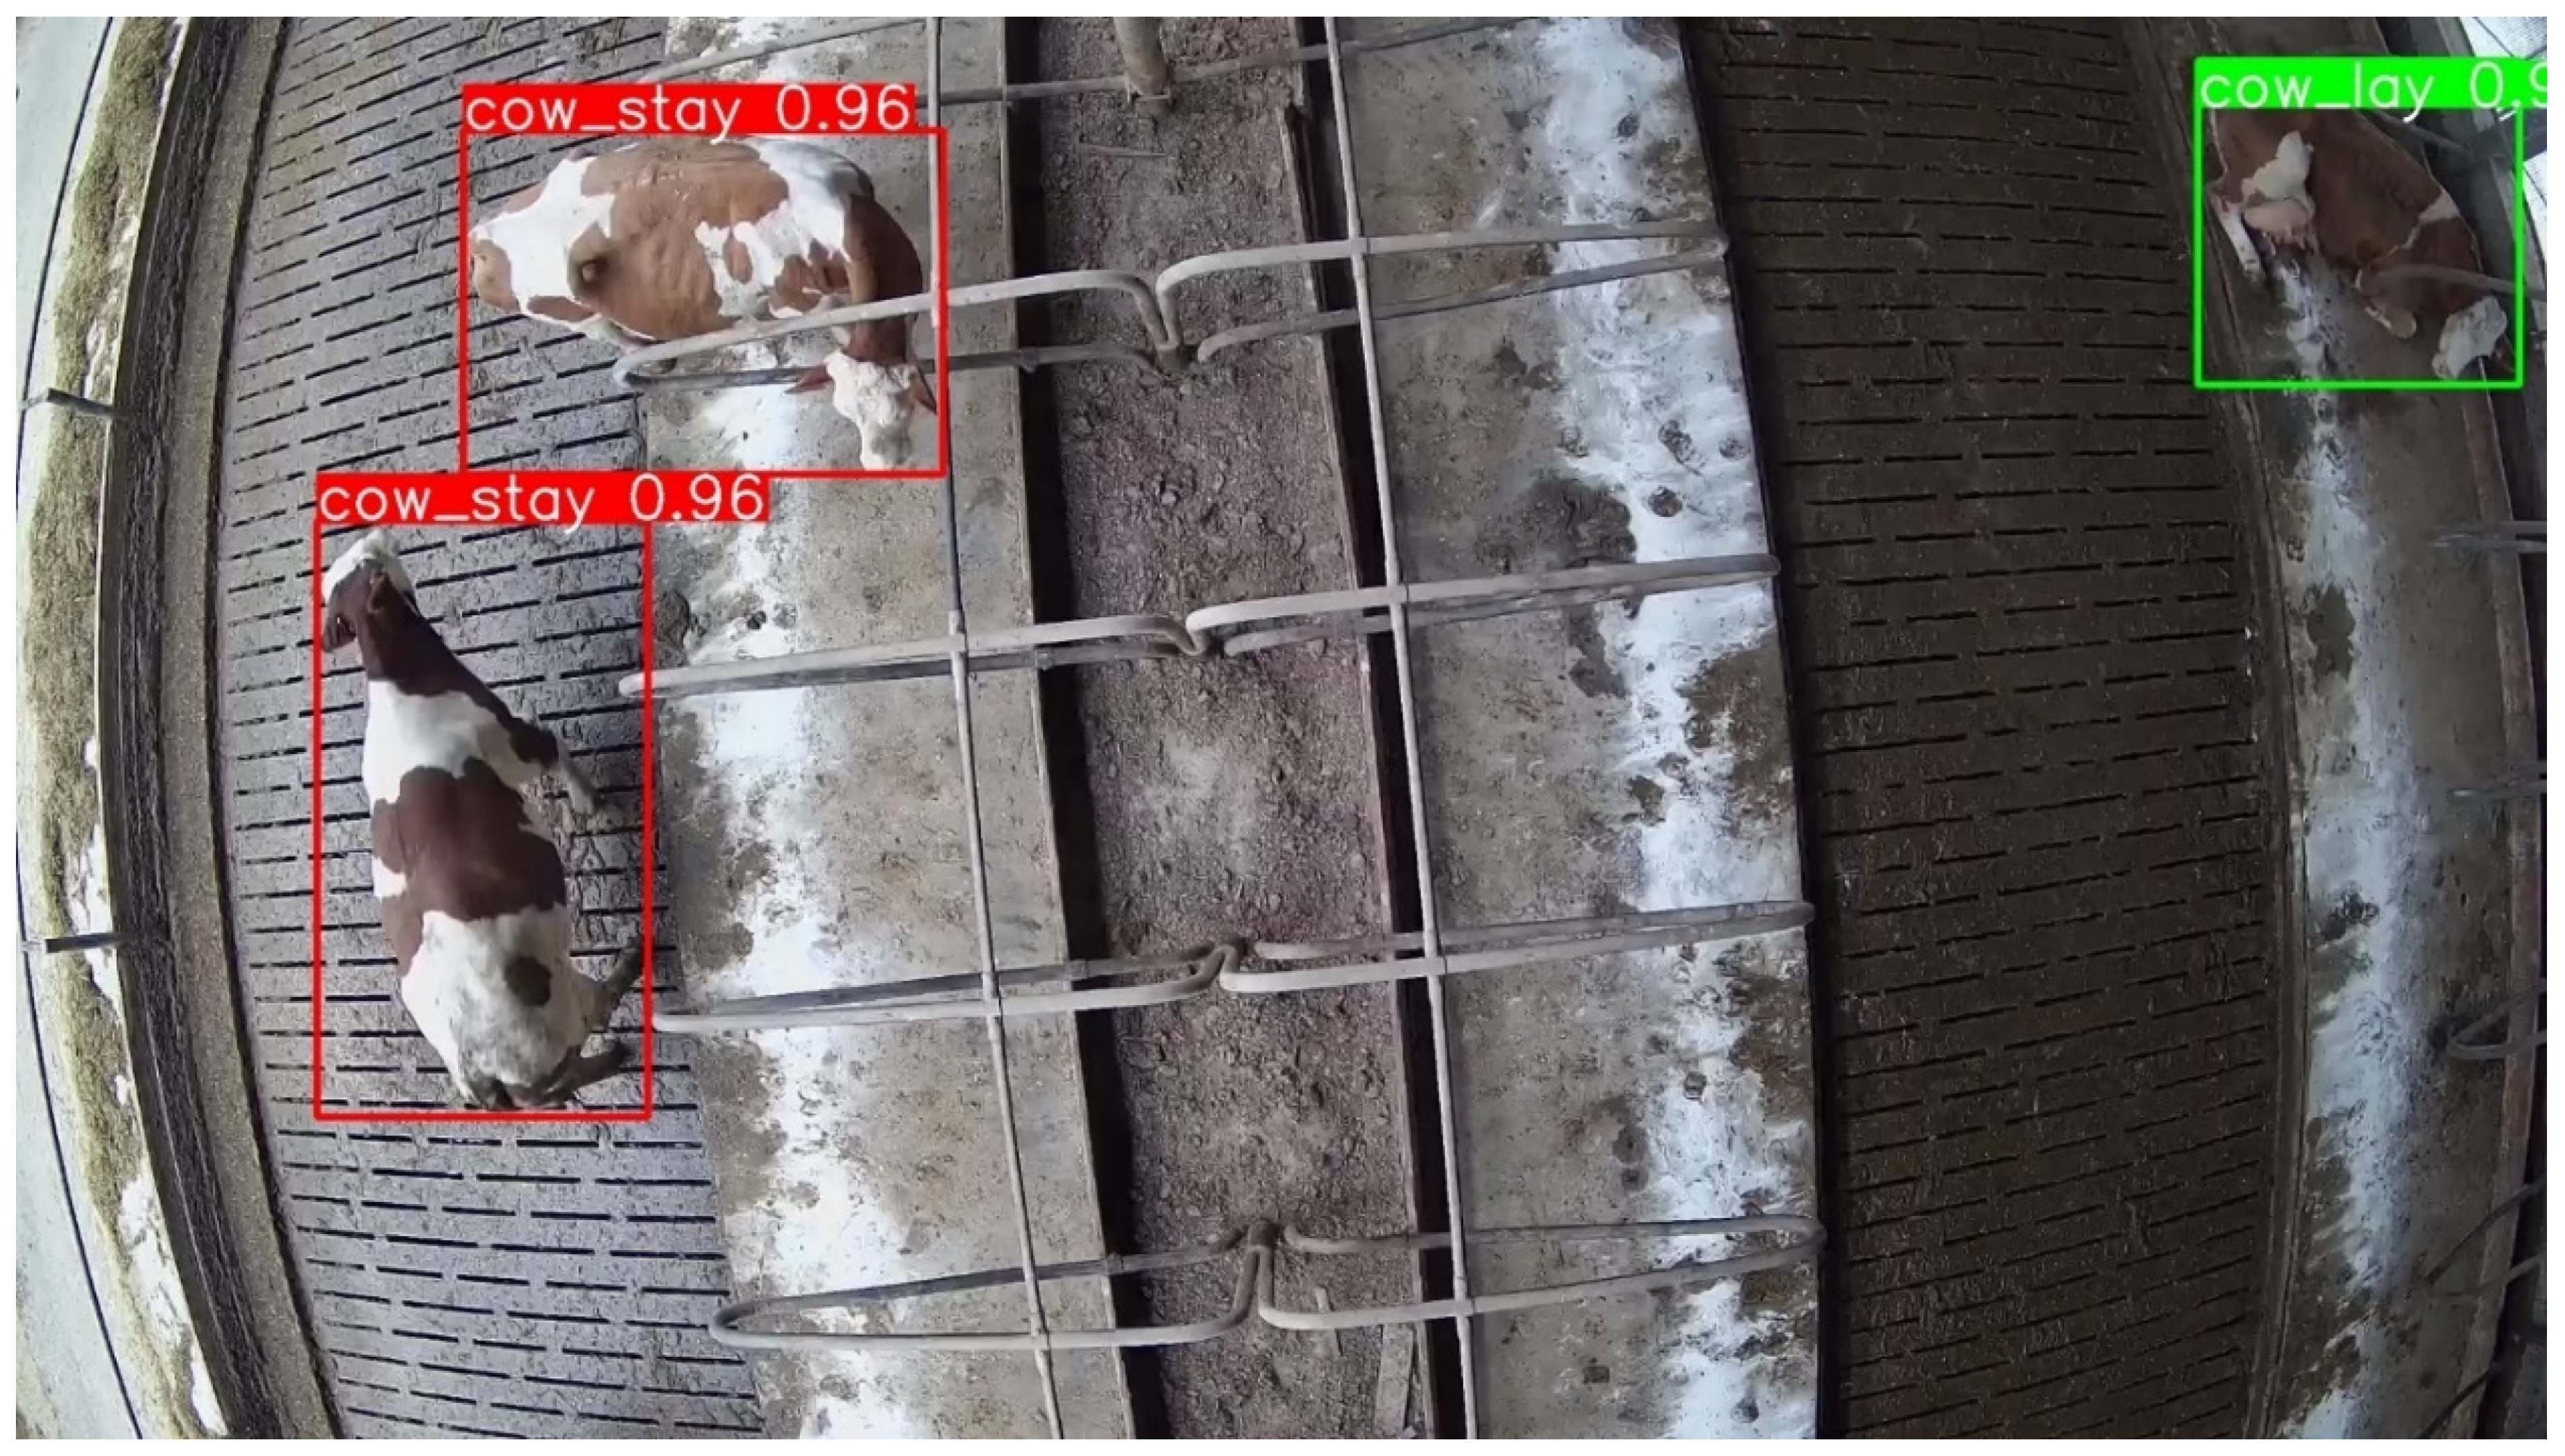
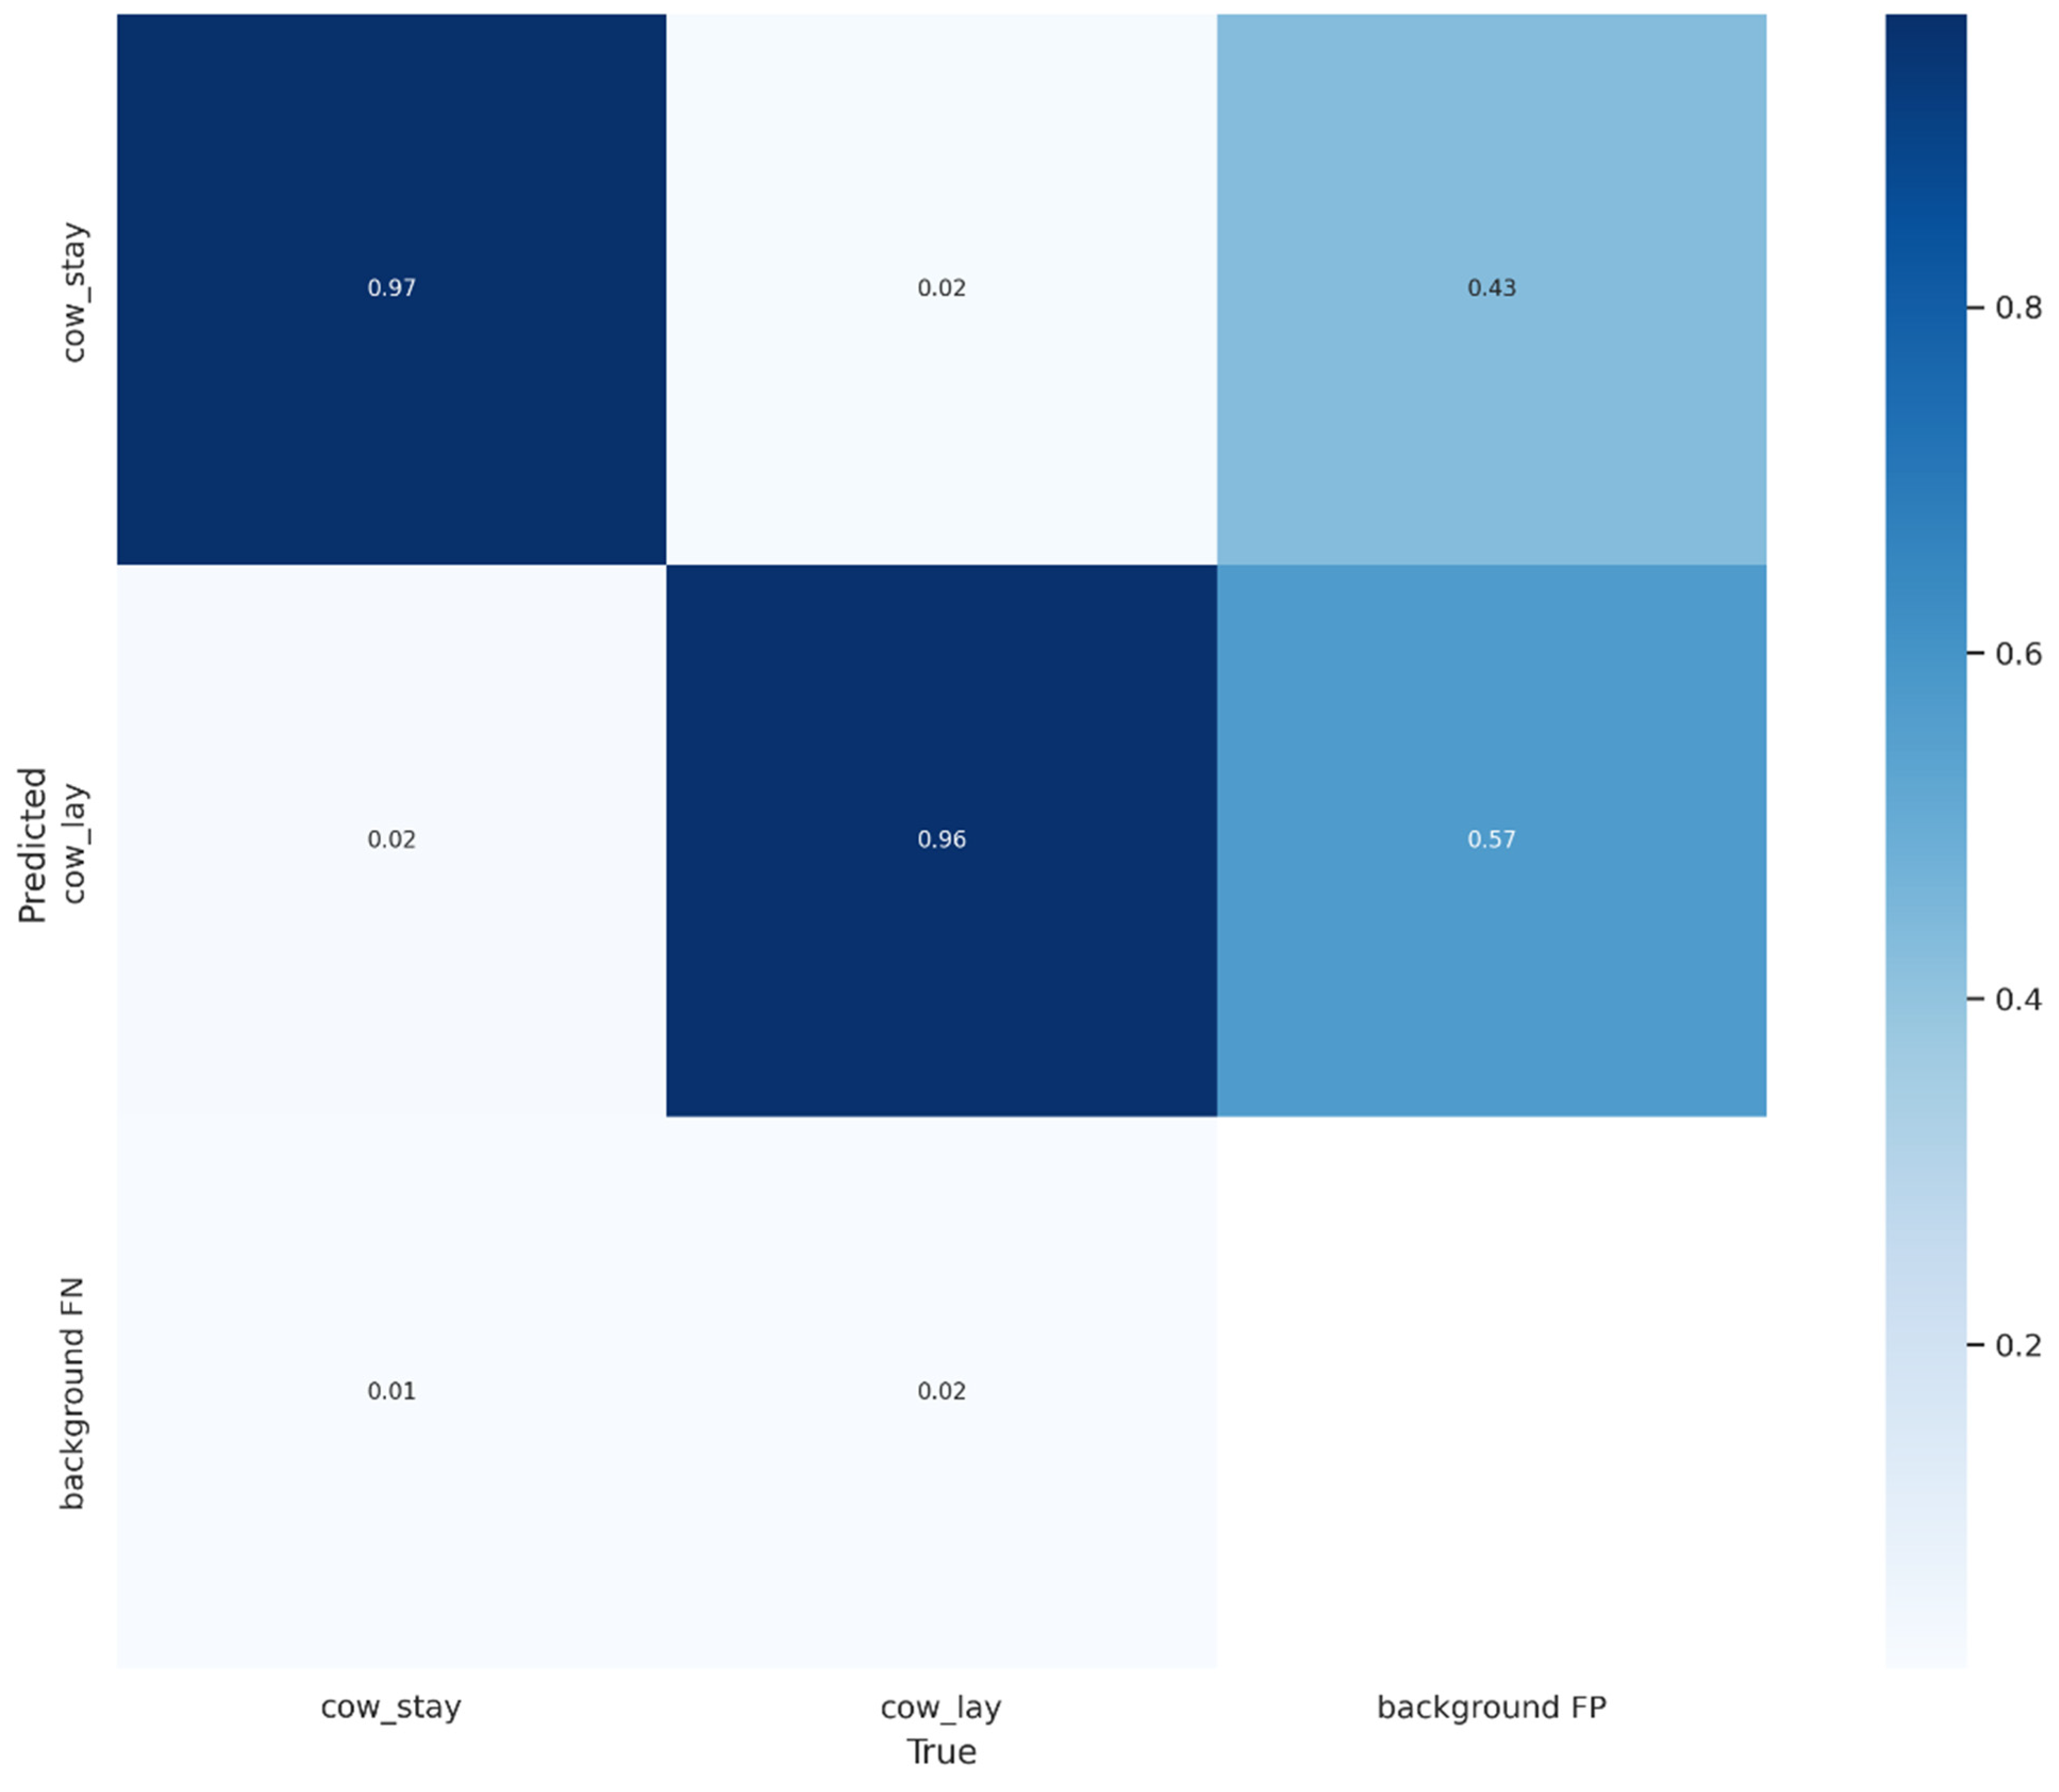
3.1. Error Analysis and Model Limitations

While the YOLOv5m model performed with high accuracy (mAP_0.5: 0.981 for cow_stay and 0.989 for cow_lay), the confusion matrix (Figure 8) and Table 2 indicate that some misclassifications occurred, particularly in distinguishing between “cow_stay” and “cow_lay”. False positives (incorrectly detected cows) occurred in approximately 2% of cases, where the model classified a cow as standing when it was actually lying down. The most common causes were overlapping cattle in crowded stalls, where parts of one cow were misinterpreted as separate cows. Motion blur from cows transitioning between standing and lying positions was another case leading to incorrect detections.
The confusion matrix (Figure 8) also indicates that 2% of “cow_lay” instances were missed entirely (false negatives). This happened primarily in low-contrast scenarios, where, for example, if a cow was lying down in a dark stall, the model sometimes failed to recognize it, partial occlusion, when a lying cow’s body was partially hidden behind another cow, or crowded environments where many cows were clustered in the same region, leading to some of them being missed.
In a real-world farm setting, false positives could lead to unnecessary alerts, while false negatives might mean missed behavioral insights, such as detecting a cow that has remained lying down for too long (potential illness).

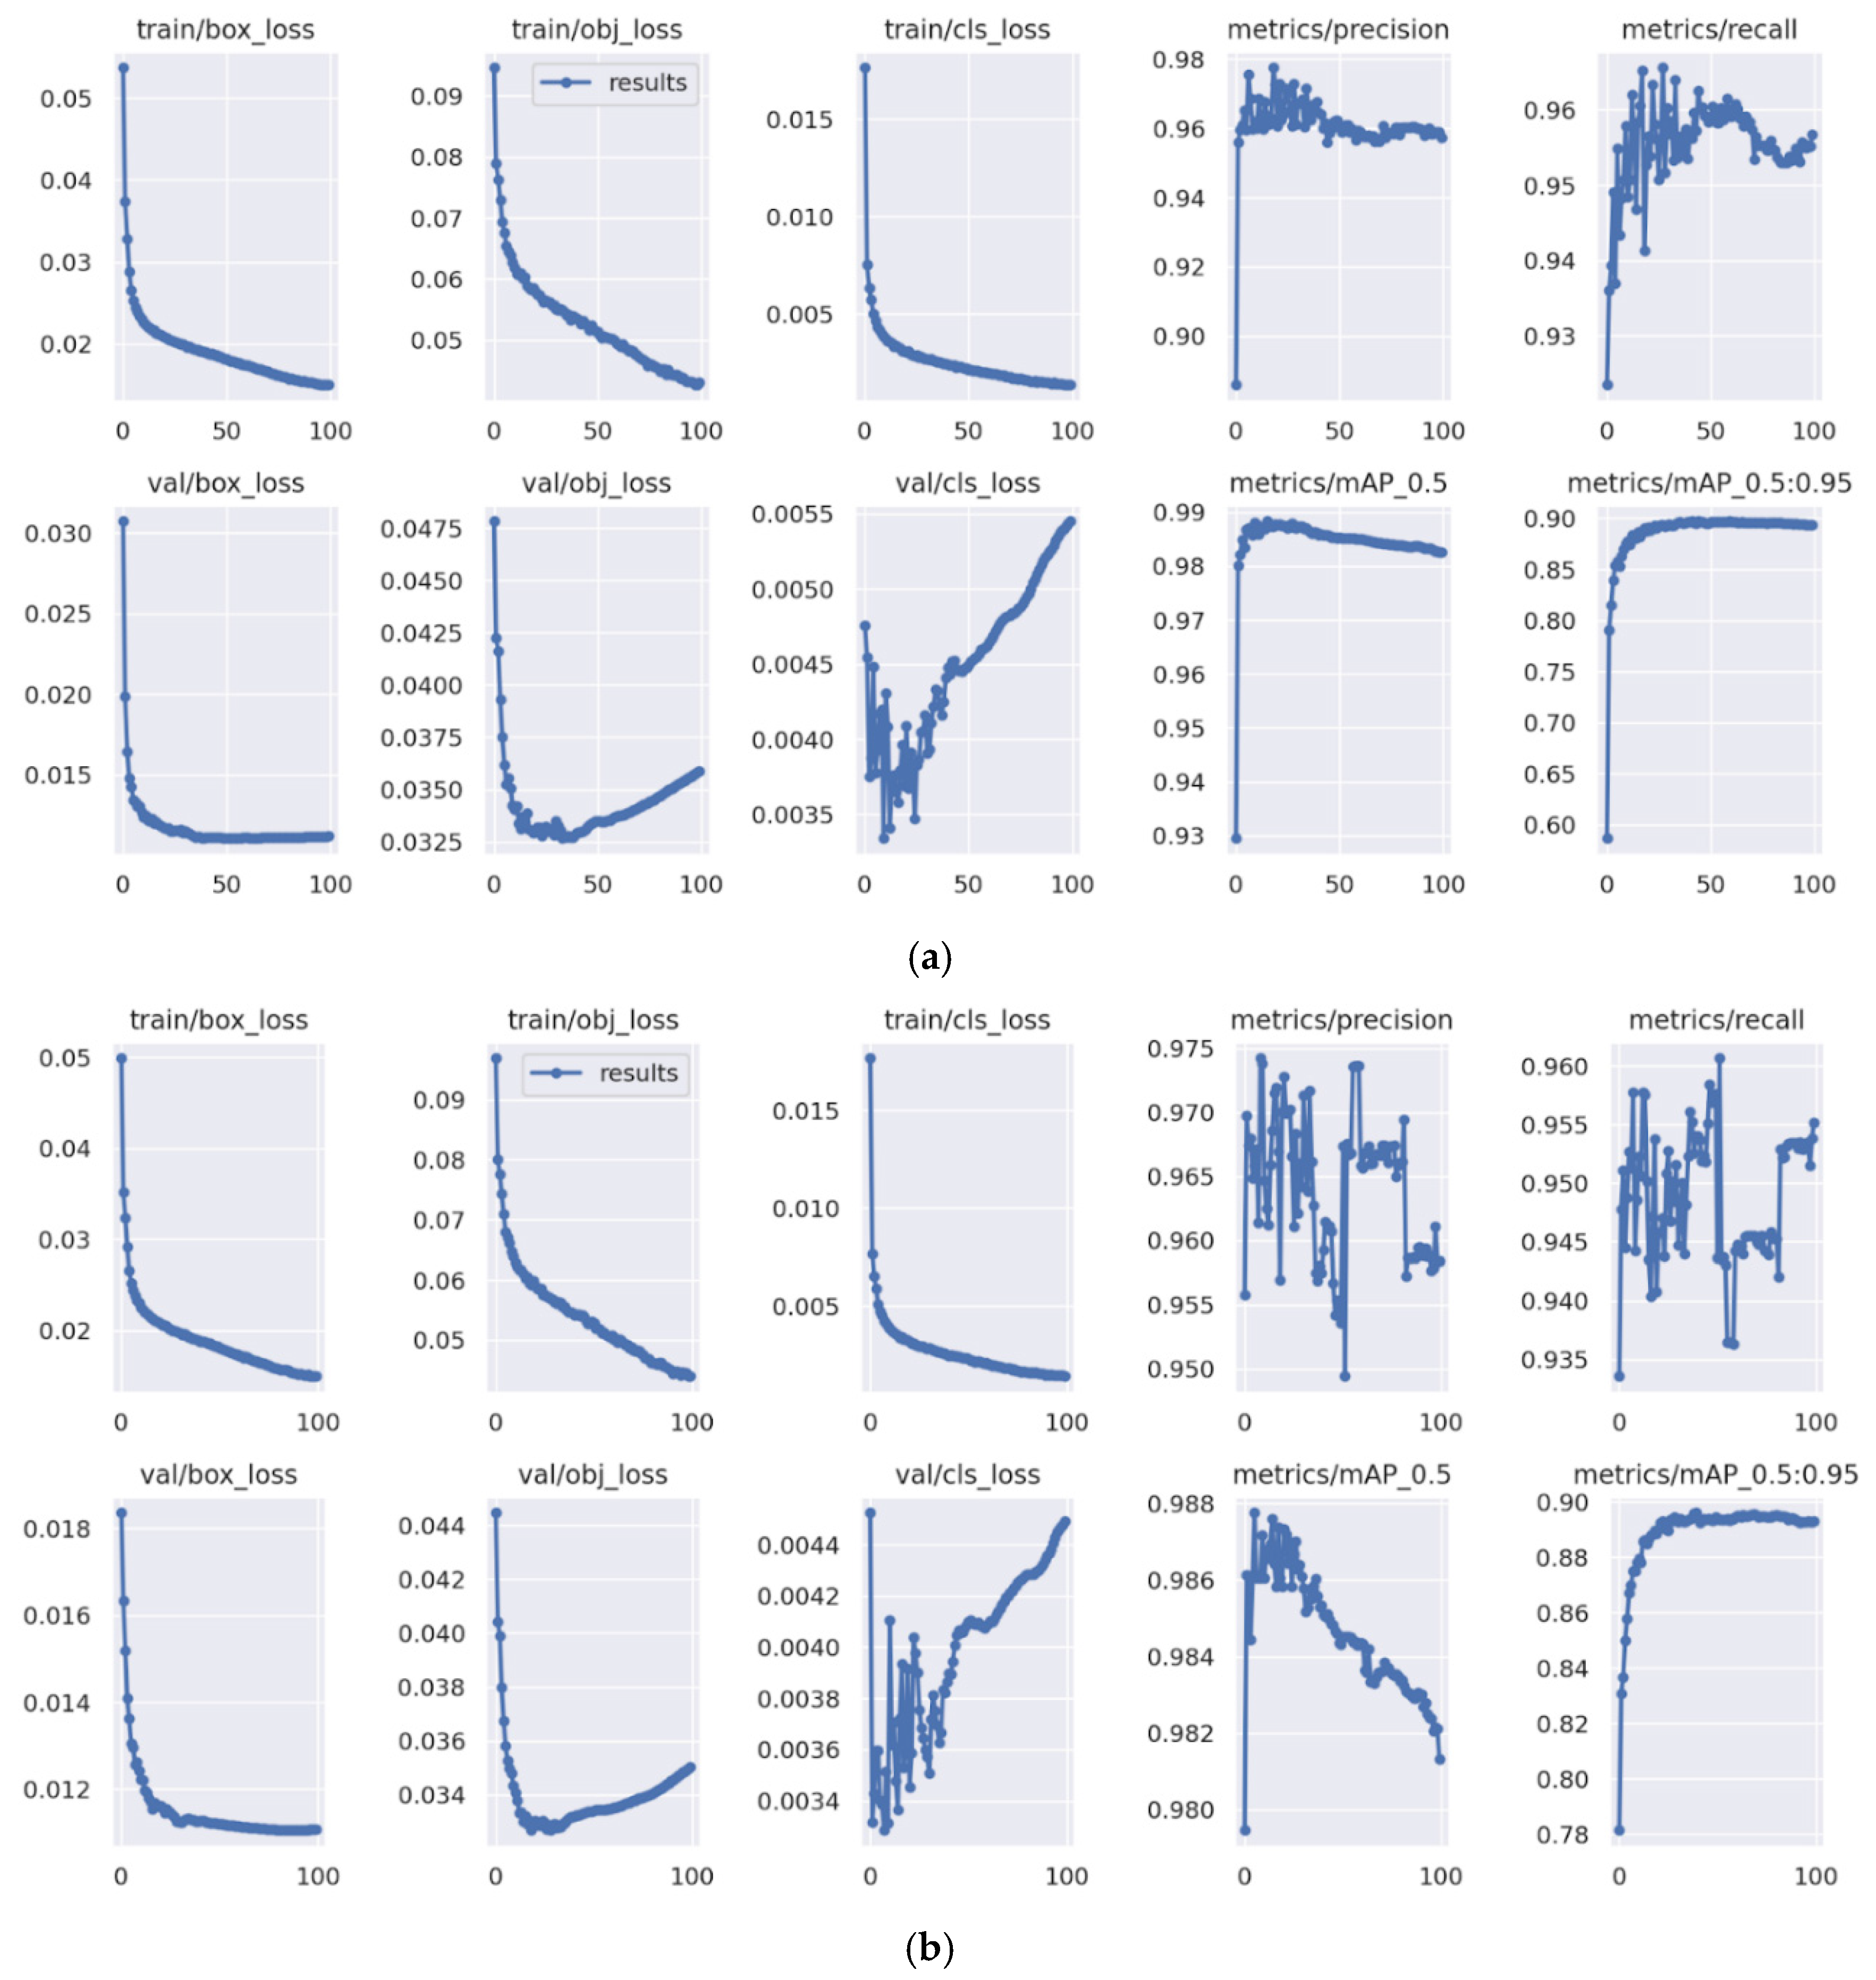
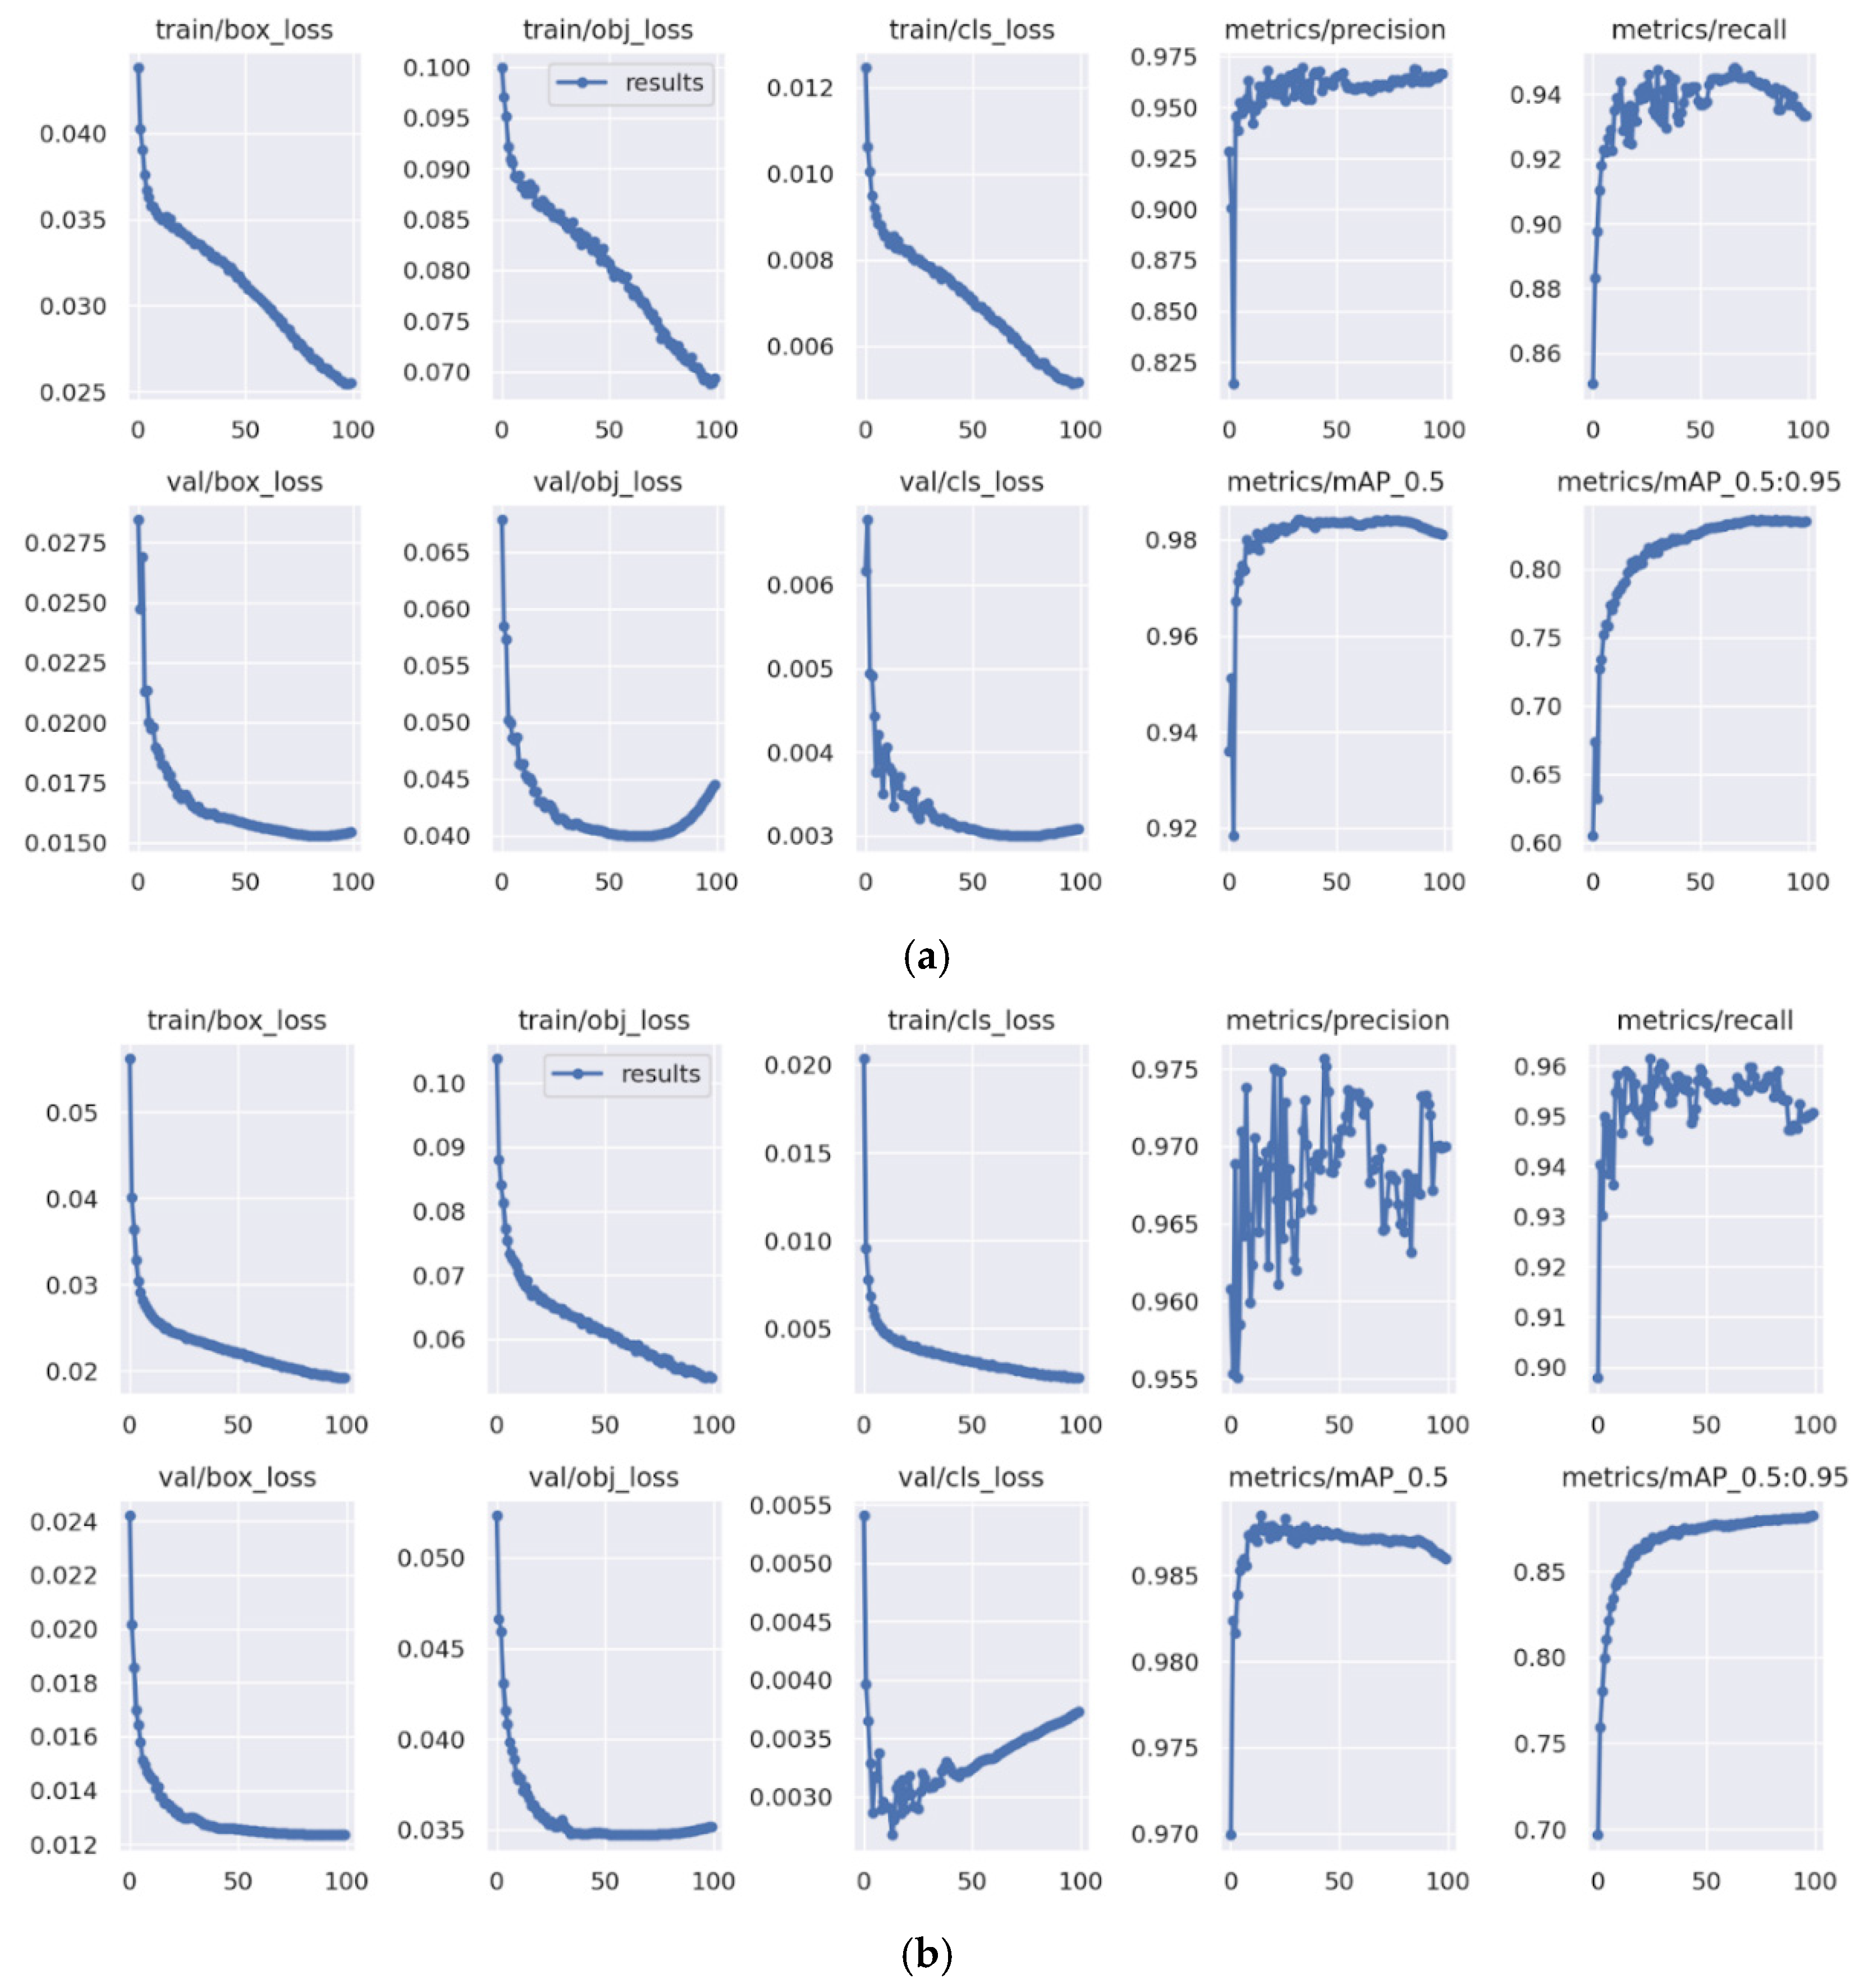
3.2. Comparison of YOLOv5 Network Types

The most notable differences in training results were seen in the mAP_0.5:0.95 metric and the total training time per 100 epochs. YOLOv5x achieved the highest accuracy, reaching a value of 0.9 by epoch 15 and peaking at 0.9070 by epoch 37. In contrast, YOLOv5n, the smallest network type, reached a value of 0.9 only by epoch 99. YOLOv5m, the mid-sized network, achieved this value by epoch 43. The difference in the maximum mAP_0.5:0.95 value between YOLOv5x (0.9070) and YOLOv5m (0.8969) was minimal, at just 0.0101. However, the training time differed significantly: YOLOv5x took more than twice as long as YOLOv5m for 100 epochs (16:53:27 vs. 7:48:19), and more than three times longer than YOLOv5n (5:29:17). A comparison of the YOLOv5 network types including selected metrics and training times is presented in Table 3, with their learning progress shown in Figure 9.

3.3. The Impact of Learning Rate

For the dataset used, an LR value of 0.001 appeared to be optimal as it resulted in a higher mAP_0.5:0.95. The training time did not vary much with changes in LR, but differences were evident in the training process, where better results were achieved earlier in the epochs with smaller LR. For example, the maximum mAP_0.5 was reached by epoch 20 with an LR of 0.001, compared to epoch 26 for an LR of 0.1. A higher difference was observed for the metric mAP_0.5:0.95, where the maximum value was achieved 30 epochs earlier with an LR of 0.001 (epoch 50 to 80) compared to LR 0.1. A value of 0.875 was reached already at epoch 6 for LR 0.001, while it was reached at epoch 33 with LR 0.1 (See Figure 10). The comparison of the effect of learning rate on selected metrics and training time is also shown in Table 4.

3.4. The Impact of Batch Size

The training progress did not differ significantly when batch size was varied, as can be seen in Figure 11. All observed metrics were in very similar ranges, with the maximum mAP_0.5 exceeding 0.987 in all cases. The best results were already achieved between epochs 10 and 20, after which there was a gradual decrease in mAP_0.5. In contrast, mAP_0.5:0.95 reached its highest value after epoch 40 and then oscillated around this value. Batch size had a significant effect on the training time, with this time decreasing with increasing size (see Table 5). The longest training time was 100 epochs for batch size 4, where the total time reached almost 13 h, and the least time-consuming was for batch size 32, where training was completed in 6 h and 7 min.

3.5. Comparison of Optimizers

SGD outperformed Adam in the comparison of the selected optimizers. In terms of the total training time over 100 epochs and the maximum value of the mAP_0.5 metric, the two optimizers were comparable. However, the maximum value of mAP_0.5:0.95 was higher for SGD (0.8969) compared to 0.8361 for Adam. The main difference was in the training process, where SGD reached the maximum values noticeably earlier than Adam. For mAP_0.5, SGD peaked at epoch 11, while Adam peaked at epoch 33. For the mAP_0.5:0.95 metric, the maximum value was reached by the SGD optimizer at epoch 43 and by the Adam optimizer at epoch 74. The training progress of both optimizers is illustrated in Figure 12, and the comparison of their metrics results is shown in Table 6.

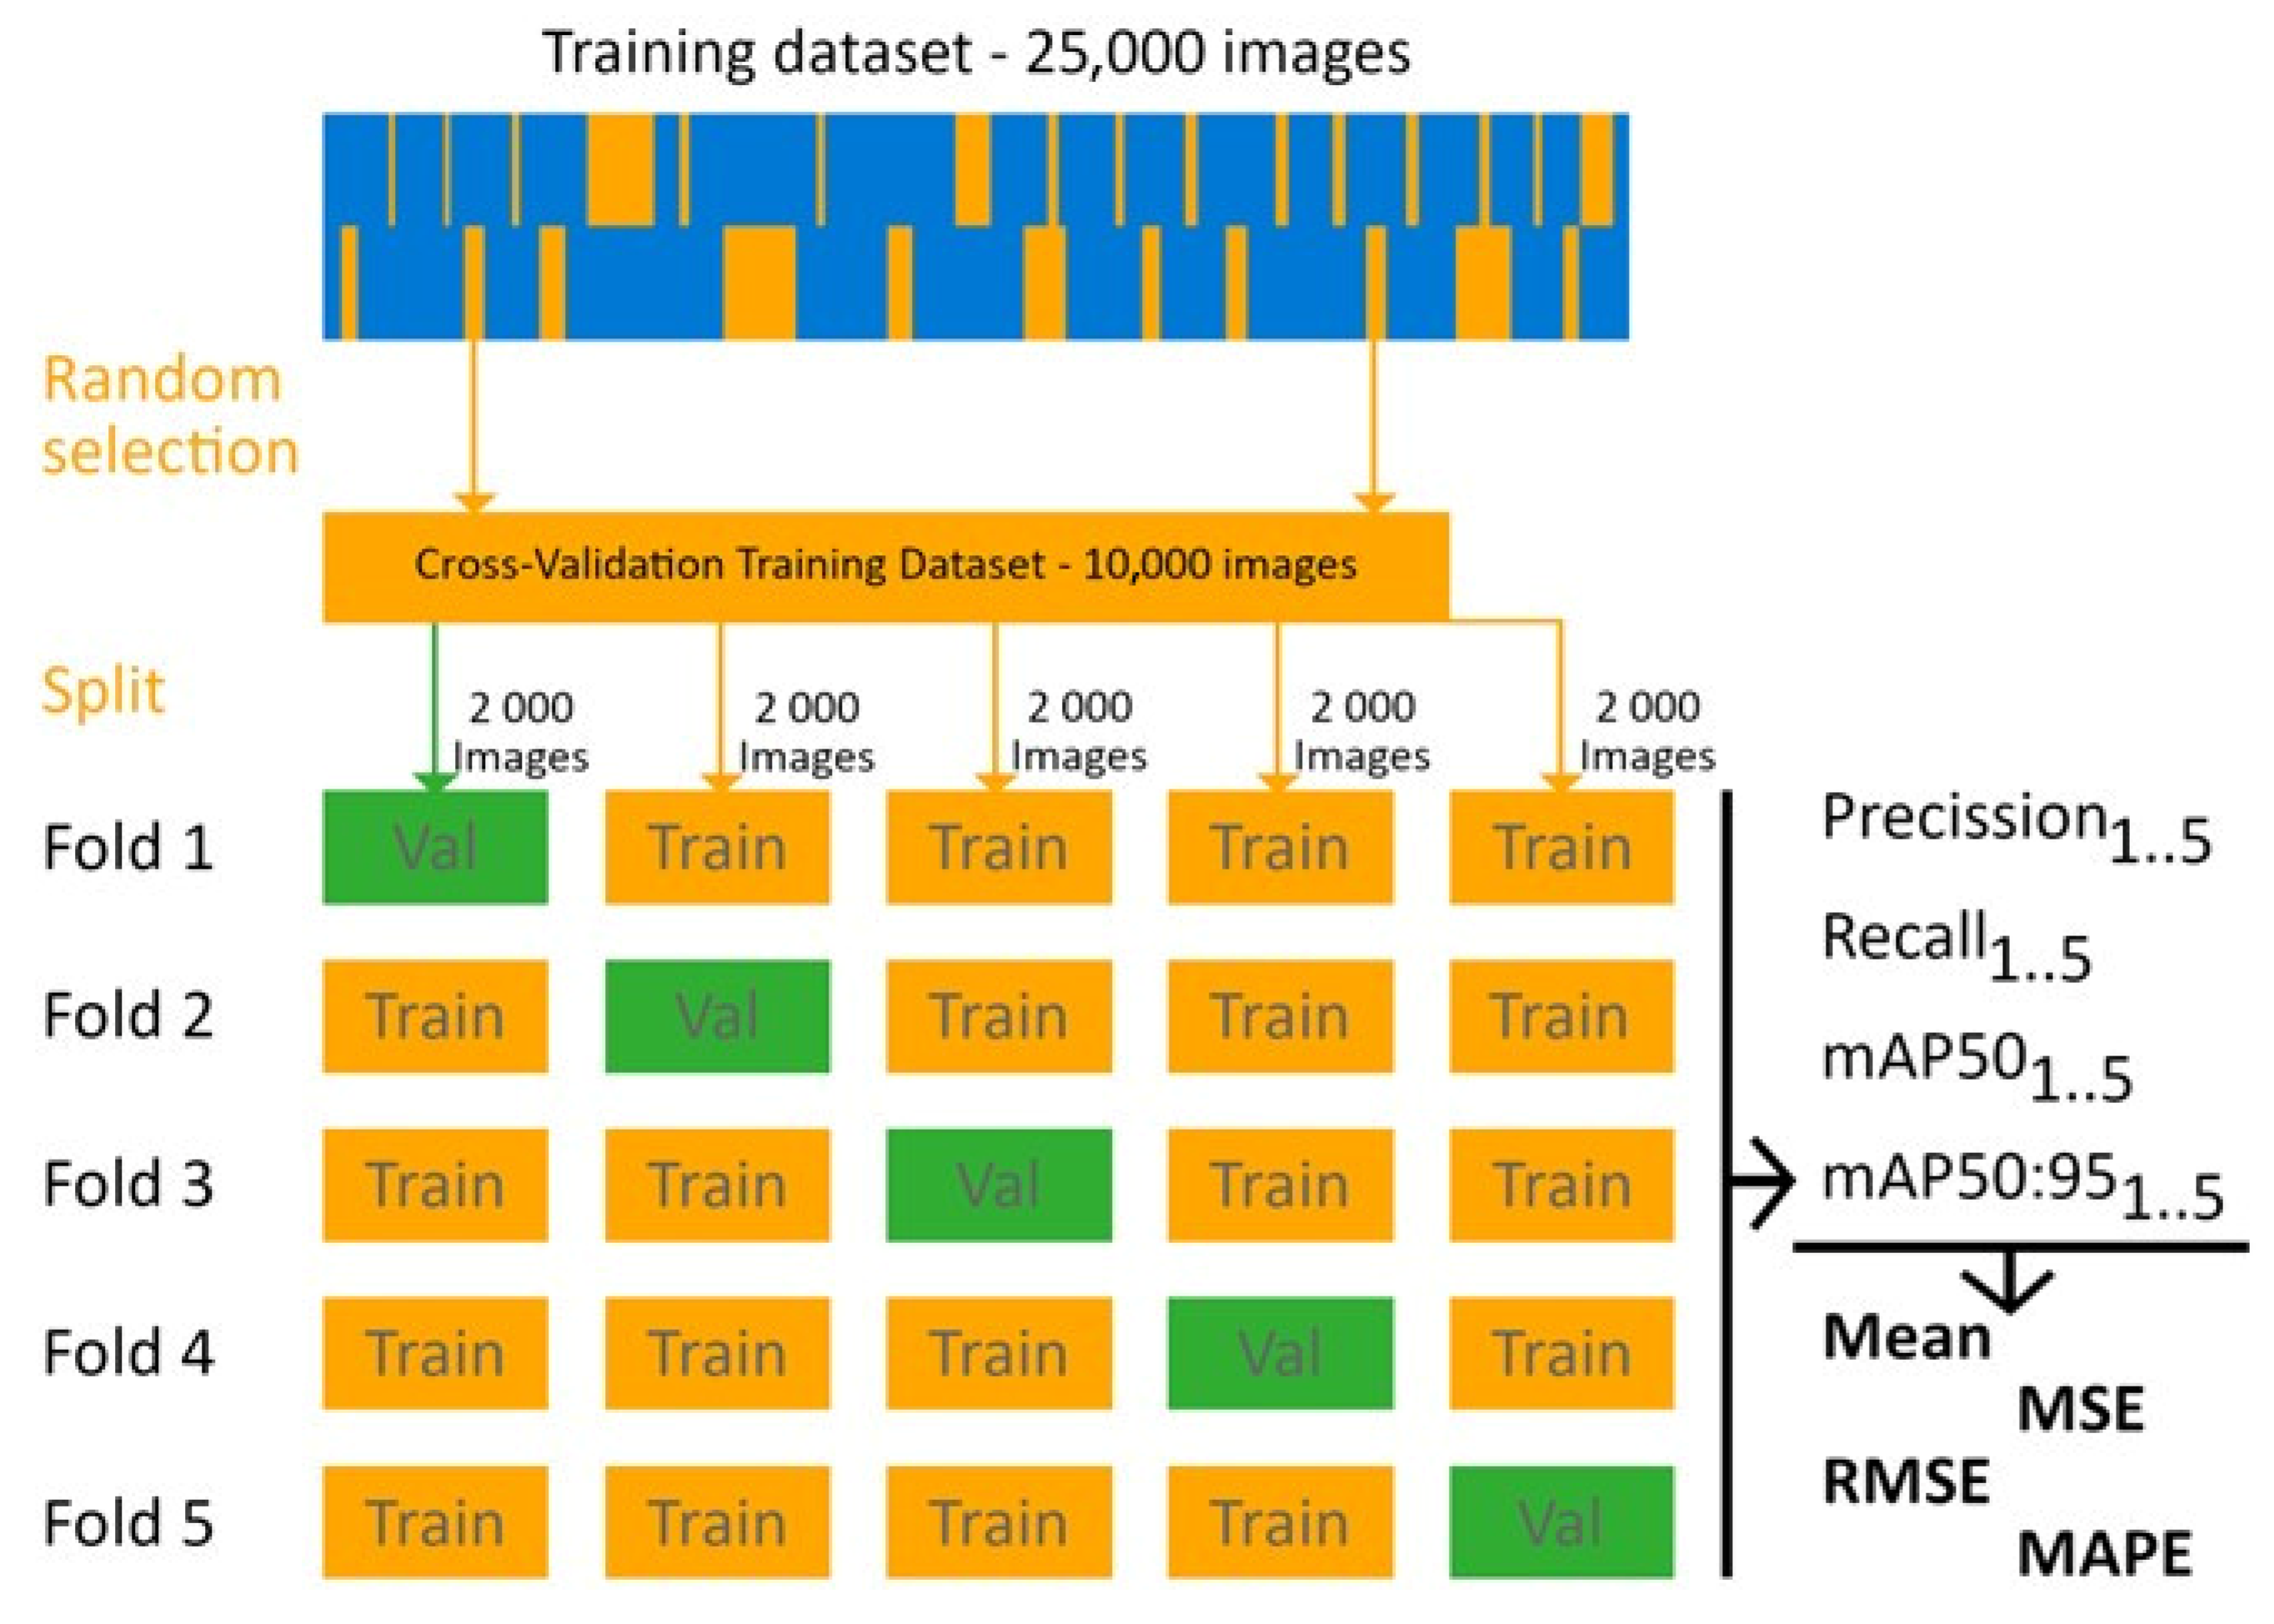
3.6. Evaluation of Model Generalization Using 5-Fold Cross-Validation

To further assess the generalization ability of the trained models, a 5-fold cross-validation was performed. A subset of 10,000 images was randomly selected from the main dataset, which originally contained 25,000 images. The selected subset was then split into five equal folds, each containing 8000 training images and 2000 validation images. Each fold was used as a validation set once, while the remaining four folds served as training data (see Figure 13). The selected YOLOv5 variants (YOLOv5n, YOLOv5s, YOLOv5m, YOLOv5l, YOLOv5x) were trained on each fold independently. After training, key performance metrics were computed for each fold, including Precision, Recall, mAP 0.5, and mAP 0.5:0.95. The final reported performance was obtained by averaging results across all five folds, reducing the likelihood of overfitting and ensuring model robustness. Additional statistical measures such as Mean Squared Error (MSE), Root Mean Squared Error (RMSE), and Mean Absolute Percentage Error (MAPE) were also computed to evaluate performance variability across folds and further assess model stability.
From Table 7 and Figure 14, it is clear that the dataset and model settings are good, and the models have very good generalization ability on the proposed dataset. Figure 14 shows that the mean values of observed metrics are high for all model types, so our dataset is optimal for training all chosen models. The MAPE implies that the heterogeneity of results across all folds is minimal, so very good results were obtained by each fold.

4. Comparison with Other Studies

The results of this study demonstrate that deep learning-based object detection models, particularly YOLOv5, can effectively classify cattle activity in a stall-based environment. Among the tested models, YOLOv5m provided the best balance between detection accuracy and computational efficiency, achieving a mAP_0.5:0.95 of 0.8969 with a training time of 7:48:19. These findings align with previous research on machine vision applications for cattle behavior monitoring while also highlighting some unique contributions of this study.
Several studies have leveraged YOLO-based models for cattle behavior analysis, obtaining results that align with or differ from our findings. Zong et al. (2025) [19] developed an improved YOLOv5 model for multi-scale dairy cow behavior recognition, achieving a mAP of 97.7%, which is significantly higher than the accuracy obtained in our study. However, while their approach focused on multi-scale feature extraction and attention mechanisms (DyHead, DCNv3, and SA modules) to improve detection performance, our research provides a systematic evaluation of YOLOv5 hyperparameters, optimizing detection efficiency for real-world dairy farm applications. Similarly, Wang et al. (2023) [20] proposed a lightweight YOLOv5s-based model for cow mounting behavior recognition, achieving an mAP of 87.7% while significantly reducing the computational cost. While their approach is optimized for a specific behavior (mounting), our study provides a broader evaluation across multiple activity types (standing vs. lying), making it more adaptable to general farm monitoring applications. Li et al. (2024) [25] also introduced Cow-YOLO, an optimized YOLOv5s-based model for automatic cow mounting detection, designed to work well in occluded environments and drastic scale changes. While their model achieved high precision in detecting mounting behaviors, it is not generalizable to broader activity classifications like our study.
While YOLOv5 remains a strong choice, studies comparing it to YOLOv6 and YOLOv7 highlight trade-offs in accuracy, speed, and computational demands. Sim et al. (2024) [34] optimized YOLOv7-E6E for precision livestock farming, integrating AutoAugment and GridMask to enhance detection accuracy. Their enhanced augmentation strategies could potentially improve our system’s ability to handle variations in cattle posture and lighting conditions. With the release of newer YOLO models, multiple studies have tested their performance for cattle behavior recognition. Jia et al. (2024) [23] developed CAMLLA-YOLOv8n, which outperformed YOLOv5 in behavior recognition accuracy but required higher processing power. Mu et al. (2024) [26] developed Cattle Behavior Recognition-YOLO (CBR-YOLO) based on YOLOv8, improving multi-scene weather adaptability and making it robust across diverse farm conditions. Similarly, Ahmad et al. (2024) [35] also proposed IYOLO-FAM, an improved YOLOv8 model with a Feature Attention Mechanism, significantly improving behavior detection accuracy. Guarnido-Lopez et al. (2024) [36] compared YOLOv8 and YOLOv10 for detecting feeding behaviors in beef cattle and found that YOLOv10 outperformed YOLOv8 in precision and recall, making it a stronger candidate for large-scale cattle monitoring. Similarly, Li et al. (2024) [37] introduced a new method for multi-object behavior tracking in beef cattle based on an improved YOLOv8n algorithm, demonstrating improved real-time tracking performance. Additionally, Yu et al. (2024) developed an automatic dairy cow behavior recognition system, showing that YOLOv10 significantly reduces false positives compared to previous models. These findings suggest that newer YOLO versions introduce advancements in detection performance but often at the cost of increased computational demand. Beyond YOLO-based approaches, other researchers have explored different CNN architectures for cattle behavior monitoring. Wu et al. (2021) [16] combined CNNs with LSTMs to detect basic dairy cow behaviors, obtaining an average recognition accuracy of 0.976 in complex barn environments. Their method benefits from temporal analysis, which our YOLO-based approach lacks, but it also comes with higher computational costs. Similarly, Wang et al. (2023) [15] developed an Efficient 3D CNN (E3D) for dairy cow behavior recognition, achieving a recognition accuracy of 98.17%. While their accuracy surpasses our best-performing model, their method is computationally more demanding, making real-time deployment in large farms more challenging. This supports our conclusion that YOLO-based models provide a better trade-off between accuracy and computational cost, making them more suitable for practical farm applications.
Another key contribution of this study is the systematic evaluation of hyperparameters, particularly learning rate, batch size, and optimizer choice. Our findings indicate that lower learning rates (0.001) result in more stable training and better accuracy, whereas larger batch sizes significantly reduce training time without compromising performance. SGD outperformed Adam, which contradicts some previous findings where Adam was preferred for rapid convergence [29]. However, Zheng and Qin (2023) [2] also found that fine-tuning learning rates and batch sizes played a crucial role in optimizing YOLO-based trackers, further validating our results.

5. Limitations and Future Directions

Despite these promising results, certain limitations must be acknowledged.

5.1. Dataset Limitations and Generalization Challenges

Our dataset was collected in a single barn environment, which may limit the model’s generalizability to different farm conditions. Variations in barn layouts, lighting conditions, and infrastructure differences could affect detection accuracy. Future studies should validate model performance across multiple farm environments to assess its robustness and adaptability.

5.2. Occlusions and Crowding Effects

Occlusions and overlapping cattle in crowded areas present challenges for accurate individual identification, as convolutional neural networks may struggle with distinguishing animals in close proximity. Shang et al. (2022) [17] also noted similar challenges when using attention mechanisms to improve cattle behavior recognition, suggesting that feature fusion techniques could be explored to mitigate this problem.

5.3. Scalability and Computational Constraints

While our study focused on small- to medium-sized cattle groups, real-world applications require monitoring larger herds. The scalability of our approach must be further evaluated, particularly in terms of real-time performance and computational efficiency. Additionally, the feasibility of deploying the model on farm-grade hardware, such as edge computing devices, remains an open question. Future research could explore lightweight neural network architectures or model compression techniques to optimize performance without sacrificing accuracy.

5.4. Extension to a Broader Range of Behaviors

This study focuses on detecting standing and lying behaviors. However, other works [18,26] have explored multi-class activity recognition, including feeding, walking, and social interactions. Expanding the model to recognize a broader range of behaviors would enhance its utility in precision livestock farming, enabling more comprehensive monitoring of animal welfare.

5.5. Validation Through Cross-Validation and Independent Testing

Another important consideration for future research is model validation using cross-validation techniques and independent datasets. While this study focused on dataset diversity and augmentation strategies to improve generalization, k-fold cross-validation could further assess model performance across multiple data splits, helping to identify potential overfitting. Additionally, testing the model on independent datasets collected from different farms or under varying environmental conditions would provide a stronger evaluation of its real-world applicability.

5.6. Advancements in YOLO Architectures

The rapid evolution of YOLO architectures offers opportunities for improvement. While we utilized YOLOv5, recent versions, such as YOLOv7 [38] and YOLOv8 [39], have demonstrated improved detection accuracy and computational efficiency in various object detection tasks. However, their effectiveness in cattle behavior monitoring remains largely unexplored. Moreover, the latest YOLO versions, including YOLOv9 [40], YOLOv10 [41], and YOLOv11 [42], are still relatively new, and their potential advantages in livestock monitoring need to be further explored. Given these advancements, future research should systematically benchmark these newer models against YOLOv5, assessing factors such as detection accuracy, real-time feasibility, model efficiency, and adaptability to real farm conditions.

5.7. Deployment Feasibility and Cost Considerations

Implementing AI-driven livestock monitoring systems requires assessing the economic feasibility. The deployment of deep learning models involves hardware expenses (e.g., high-resolution cameras, edge computing devices), software development costs, and maintenance requirements. Future studies should include a cost-benefit analysis to determine whether improvements in cattle monitoring efficiency justify the financial investment for farmers.

6. Conclusions

This study demonstrates the effectiveness of YOLOv5-based deep learning models for automated cattle activity classification in a stall-based environment. Our findings indicate that YOLOv5m provides an optimal balance between detection accuracy (mAP_0.5:0.95 of 0.8969) and computational efficiency, making it a practical choice for real-time livestock monitoring. The systematic evaluation of hyperparameters, including learning rate, batch size, and optimizer selection, highlights the importance of fine-tuning object detection models to enhance their applicability in real-world agricultural settings.
The implementation of AI-driven cattle monitoring has the potential to significantly improve farm productivity and animal welfare. By enabling real-time behavioral analysis, such systems can support the early detection of health issues, optimize resource management, and reduce the reliance on labor-intensive manual observation. These advancements could contribute to more efficient, sustainable, and economically viable livestock management, ensuring better care for animals while enhancing overall farm operations. However, the adoption of such systems depends on several factors, including cost-effectiveness, ease of integration, and adaptability to different farm environments. Future research should focus on conducting a comprehensive cost-benefit analysis to evaluate whether the increased monitoring accuracy and efficiency justify the financial investment required for AI deployment.
While YOLOv5 has demonstrated strong performance, the rapid advancements in YOLO architectures necessitate further research to assess the feasibility of newer models for livestock monitoring applications. Expanding the scope of detection to include multi-class behavior recognition, real-time processing techniques, and diverse farm conditions would further strengthen the role of deep learning in precision livestock farming.
In conclusion, this study demonstrates that YOLOv5 remains a robust, practical solution for cattle activity detection, providing a strong foundation for future advancements in automated livestock monitoring. As deep learning continues to evolve, further optimizations and integrations with farm management systems will be crucial for fully realizing AI-powered precision livestock farming.

Author Contributions

Conceptualization, R.B., T.Z. and P.B.; Data curation, J.d.D.M.U., S.N.U., R.S., Z.H. and R.K.; Funding acquisition, P.B.; Methodology, R.B. and T.Z.; Project administration, P.B.; Resources, P.B.; Software, R.B. and T.Z.; Supervision, P.B.; Visualization, J.d.D.M.U., S.N.U., R.S., Z.H. and R.K.; Writing—original draft, R.B., T.Z., J.d.D.M.U., S.N.U., R.S., Z.H. and R.K.; Writing—review & editing, J.d.D.M.U., S.N.U., R.S., Z.H. and R.K. All authors have read and agreed to the published version of the manuscript.

Funding

This work is based on the results achieved within the project TAČR TREND FW03010447 “Development of an intelligent system for increasing the productivity of dairy cattle using artificial intelligence methods’’, financially supported by the Technology Agency of the Czech Republic.

Institutional Review Board Statement

Not applicable.

Informed Consent Statement

Not applicable.

Data Availability Statement

The data presented in this study are available upon request from the corresponding author.

Conflicts of Interest

The authors declare that they have no known competing financial interests or personal relationships that could have appeared to influence the work reported in this paper.

References

  1. Wanapat, M.; Suriyapha, C.; Dagaew, G.; Matra, M.; Phupaboon, S.; Sommai, S.; Pongsub, S.; Muslykhah, U. Sustainable Livestock Production Systems Are Key to Ensuring Food Security Resilience in Response to Climate Change. Agric. Nat. Resources 2024, 58, 537–546. [Google Scholar] [CrossRef]
  2. Zheng, Z.; Qin, L. PrunedYOLO-Tracker: An Efficient Multi-Cows Basic Behavior Recognition and Tracking Technique. Comput. Electron. Agric. 2023, 213, 108172. [Google Scholar] [CrossRef]
  3. Linstädt, J.; Thöne-Reineke, C.; Merle, R. Animal-Based Welfare Indicators for Dairy Cows and Their Validity and Practicality: A Systematic Review of the Existing Literature. Front. Vet. Sci. 2024, 11, 1429097. [Google Scholar] [CrossRef] [PubMed]
  4. Wu, D.; Han, M.; Song, H.; Song, L.; Duan, Y. Monitoring the Respiratory Behavior of Multiple Cows Based on Computer Vision and Deep Learning. J. Dairy. Sci. 2023, 106, 2963–2979. [Google Scholar] [CrossRef]
  5. Shu, H.; Bindelle, J.; Guo, L.; Gu, X. Determining the Onset of Heat Stress in a Dairy Herd Based on Automated Behaviour Recognition. Biosyst. Eng. 2023, 226, 238–251. [Google Scholar] [CrossRef]
  6. Arablouei, R.; Currie, L.; Kusy, B.; Ingham, A.; Greenwood, P.L.; Bishop-Hurley, G. In-Situ Classification of Cattle Behavior Using Accelerometry Data. Comput. Electron. Agric. 2021, 183, 106045. [Google Scholar] [CrossRef]
  7. Rohan, A.; Rafaq, M.S.; Md Hasan, J.; Asghar, F.; Bashir, A.K.; Dottorini, T. Application of Deep Learning for Livestock Behaviour Recognition: A Systematic Literature Review. Comput. Electron. Agric. 2024, 224, 109115. [Google Scholar] [CrossRef]
  8. Chen, C.; Zhu, W.; Norton, T. Behaviour Recognition of Pigs and Cattle: Journey from Computer Vision to Deep Learning. Comput. Electron. Agric. 2021, 187, 106255. [Google Scholar] [CrossRef]
  9. Kříž, P.; Horčičková, M.; Bumbálek, R.; Bartoš, P.; Smutný, L.; Stehlík, R.; Zoubek, T.; Černý, P.; Vochozka, V.; Kuneš, R. Application of the Machine Vision Technology and Infrared Thermography to the Detection of Hoof Diseases in Dairy Cows: A Review. Appl. Sci. 2021, 11, 11045. [Google Scholar] [CrossRef]
  10. Ufitikirezi, M.J.D.; Bumbalek, R.; Zoubek, T.; Bartos, P.; Havelka, Z.; Kresan, J.; Stehlik, R.; Kunes, R.; Olsan, P.; Strob, M.; et al. Enhancing Cattle Production and Management through Convolutional Neural Networks. A Review. Czech J. Anim. Sci. 2024, 69, 75–88. [Google Scholar] [CrossRef]
  11. Gu, Y.; Wang, S.; Yan, Y.; Tang, S.; Zhao, S. Identification and Analysis of Emergency Behavior of Cage-Reared Laying Ducks Based on YoloV5. Agriculture 2022, 12, 485. [Google Scholar] [CrossRef]
  12. Cheng, M.; Yuan, H.; Wang, Q.; Cai, Z.; Liu, Y.; Zhang, Y. Application of Deep Learning in Sheep Behaviors Recognition and Influence Analysis of Training Data Characteristics on the Recognition Effect. Comput. Electron. Agric. 2022, 198, 107010. [Google Scholar] [CrossRef]
  13. Jiang, M.; Rao, Y.; Zhang, J.; Shen, Y. Automatic Behavior Recognition of Group-Housed Goats Using Deep Learning. Comput. Electron. Agric. 2020, 177, 105706. [Google Scholar] [CrossRef]
  14. Yin, X.; Wu, D.; Shang, Y.; Jiang, B.; Song, H. Using an EfficientNet-LSTM for the Recognition of Single Cow’s Motion Behaviours in a Complicated Environment. Comput. Electron. Agric. 2020, 177, 105707. [Google Scholar] [CrossRef]
  15. Wang, Y.; Li, R.; Wang, Z.; Hua, Z.; Jiao, Y.; Duan, Y.; Song, H. E3D: An Efficient 3D CNN for the Recognition of Dairy Cow’s Basic Motion Behavior. Comput. Electron. Agric. 2023, 205, 107607. [Google Scholar] [CrossRef]
  16. Wu, D.; Wang, Y.; Han, M.; Song, L.; Shang, Y.; Zhang, X.; Song, H. Using a CNN-LSTM for Basic Behaviors Detection of a Single Dairy Cow in a Complex Environment. Comput. Electron. Agric. 2021, 182, 106016. [Google Scholar] [CrossRef]
  17. Shang, C.; Wu, F.; Wang, M.; Gao, Q. Cattle Behavior Recognition Based on Feature Fusion under a Dual Attention Mechanism. J. Vis. Commun. Image Represent. 2022, 85, 103524. [Google Scholar] [CrossRef]
  18. Fuentes, A.; Yoon, S.; Park, J.; Park, D.S. Deep Learning-Based Hierarchical Cattle Behavior Recognition with Spatio-Temporal Information. Comput. Electron. Agric. 2020, 177, 105627. [Google Scholar] [CrossRef]
  19. Zong, Z.; Ban, Z.; Wang, C.; Wang, S.; Yuan, W.; Zhang, C.; Su, L.; Yuan, Z. A Study on Multi-Scale Behavior Recognition of Dairy Cows in Complex Background Based on Improved YOLOv5. Agriculture 2025, 15, 213. [Google Scholar] [CrossRef]
  20. Wang, R.; Gao, R.; Li, Q.; Zhao, C.; Ma, W.; Yu, L.; Ding, L. A Lightweight Cow Mounting Behavior Recognition System Based on Improved YOLOv5s. Sci. Rep. 2023, 13, 17418. [Google Scholar] [CrossRef]
  21. Yu, R.; Wei, X.; Liu, Y.; Yang, F.; Shen, W.; Gu, Z. Research on Automatic Recognition of Dairy Cow Daily Behaviors Based on Deep Learning. Animals 2024, 14, 458. [Google Scholar] [CrossRef] [PubMed]
  22. Tong, L.; Fang, J.; Wang, X.; Zhao, Y. Research on Cattle Behavior Recognition and Multi-Object Tracking Algorithm Based on YOLO-BoT. Animals 2024, 14, 2993. [Google Scholar] [CrossRef] [PubMed]
  23. Jia, Q.; Yang, J.; Han, S.; Du, Z.; Liu, J. CAMLLA-YOLOv8n: Cow Behavior Recognition Based on Improved YOLOv8n. Animals 2024, 14, 3033. [Google Scholar] [CrossRef]
  24. Tian, X.; Li, B.; Cheng, X.; Shi, X. Target Detection and Cow Standing Behavior Recognition Based on YOLOv5 Algorithm. In Proceedings of the 2022 3rd International Conference on Information Science, Parallel and Distributed Systems (ISPDS), Guangzhou, China, 22–24 July 2022; pp. 206–210. [Google Scholar]
  25. Li, D.; Wang, J.; Zhang, Z.; Dai, B.; Zhao, K.; Shen, W.; Yin, Y.; Li, Y. Cow-YOLO: Automatic Cow Mounting Detection Based on Non-Local CSPDarknet53 and Multiscale Neck. Int. J. Agric. Biol. Eng. 2024, 17, 193–202. [Google Scholar] [CrossRef]
  26. Mu, Y.; Hu, J.; Wang, H.; Li, S.; Zhu, H.; Luo, L.; Wei, J.; Ni, L.; Chao, H.; Hu, T.; et al. Research on the Behavior Recognition of Beef Cattle Based on the Improved Lightweight CBR-YOLO Model Based on YOLOv8 in Multi-Scene Weather. Animals 2024, 14, 2800. [Google Scholar] [CrossRef]
  27. Jocher, G.; Stoken, A.; Borovec, J.; NanoCode012; Stan, C.; Changyu, L.; Laughing; Tkianai; Nong, Y.X.; Hogan, A.; et al. Ul-tralytics/Yolov5: V4.0—Nn.SiLU() Activations, Weights & Biases Logging, PyTorch Hub Integration; Zenodo: Geneva, Switzerland, 2021. [Google Scholar]
  28. Hammel, B. What Learning Rate Should I Use. Bdhammel. com, 23 March. 2019. Available online: http://www.bdhammel.com/learning-rates/ (accessed on 1 January 2025).
  29. Luo, L.; Xiong, Y.; Liu, Y.; Sun, X. Adaptive Gradient Methods with Dynamic Bound of Learning Rate. arXiv 2019, arXiv:1902.09843. [Google Scholar]
  30. Ruder, S. An Overview of Gradient Descent Optimization Algorithms. arXiv 2016, arXiv:1609.04747. [Google Scholar]
  31. Kingma, D.P.; Ba, J. Adam: A Method for Stochastic Optimization. arXiv 2014, arXiv:1412.6980. [Google Scholar]
  32. Padilla, R.; Netto, S.L.; Da Silva, E.A. A Survey on Performance Metrics for Object-Detection Algorithms. In Proceedings of the 2020 International Conference on Systems, Signals and Image Processing (IWSSIP), Niterói, Brazil, 1–3 July 2020; pp. 237–242. [Google Scholar]
  33. Henderson, P.; Ferrari, V. End-to-End Training of Object Class Detectors for Mean Average Precision. In Proceedings of the Computer Vision–ACCV 2016: 13th Asian Conference on Computer Vision, Taipei, Taiwan, 20–24 November 2016; Revised Selected Papers, Part V. Lai, S.-H., Lepetit, V., Nishino, K., Sato, Y., Eds.; Springer International Publishing: Cham, Switherland, 2017; pp. 198–213. [Google Scholar]
  34. Sim, H.; Kim, T.; Lee, C.; Choi, C.; Kim, J.S.; Cho, H. Optimizing Cattle Behavior Analysis in Precision Livestock Farming: Integrating YOLOv7-E6E with AutoAugment and GridMask to Enhance Detection Accuracy. Appl. Sci. 2024, 14, 3667. [Google Scholar] [CrossRef]
  35. Ahmad, M.; Zhang, W.; Smith, M.; Brilot, B.; Bell, M. IYOLO-FAM: Improved YOLOv8 with Feature Attention Mechanism for Cow Behaviour Detection. In Proceedings of the 2024 IEEE 15th Annual Ubiquitous Computing, Electronics & Mobile Communication Conference (UEMCON), New York, NY, USA, 17–19 October 2024; pp. 0210–0219. [Google Scholar]
  36. Guarnido-Lopez, P.; Ramirez-Agudelo, J.-F.; Denimal, E.; Benaouda, M. Programming and Setting Up the Object Detection Algorithm YOLO to Determine Feeding Activities of Beef Cattle: A Comparison between YOLOv8m and YOLOv10m. Animals 2024, 14, 2821. [Google Scholar] [CrossRef]
  37. Li, G.; Sun, J.; Guan, M.; Sun, S.; Shi, G.; Zhu, C. A New Method for Non-Destructive Identification and Tracking of Multi-Object Behaviors in Beef Cattle Based on Deep Learning. Animals 2024, 14, 2464. [Google Scholar] [CrossRef] [PubMed]
  38. Wang, C.Y.; Bochkovskiy, A.; Liao, H.Y.M. YOLOv7: Trainable Bag-of-Freebies Sets New State-of-the-Art for Real-Time Object Detectors. In Proceedings of the 2023 IEEE/CVF Conference on Computer Vision and Pattern Recognition (CVPR), Vancouver, BC, Canada, 18–22 June 2023; pp. 7464–7475. [Google Scholar]
  39. Varghese, R.; Sambath, M. YOLOv8: A Novel Object Detection Algorithm with Enhanced Performance and Robustness. In Proceedings of the 2024 International Conference on Advances in Data Engineering and Intelligent Computing Systems (ADICS), Chennai, India, 17–18 April 2024; pp. 1–6. [Google Scholar]
  40. Wang, C.-Y.; Yeh, I.-H.; Liao, H. YOLOv9: Learning What You Want to Learn Using Programmable Gradient Information. arXiv 2024, arXiv:2402.13616. [Google Scholar]
  41. Wang, A.; Chen, H.; Liu, L.; Chen, K.; Lin, Z.; Han, J.; Ding, G. YOLOv10: Real-Time End-to-End Object Detection. arXiv 2024, arXiv:2405.14458. [Google Scholar]
  42. Khanam, R.; Hussain, M. YOLOv11: An Overview of the Key Architectural Enhancements. arXiv 2024, arXiv:2410.17725. [Google Scholar]
Figure 1. View from the cameras used to collect image data: (a) camera view no. 1, (b) camera view no. 2.
Technologies 13 00116 g001
Figure 2. Examples of the variability of the acquired dataset: (a) good lighting conditions, (b) image obtained under poor lighting and use of additional illumination, (c) animals gathered at the feeding alley, (d) animals spread out in the lying area.
Technologies 13 00116 g002
Figure 3. Example of annotation by polygonal masks with the assignment of a specific class (cow lay marked with green, and cow stay marked with blue).
Technologies 13 00116 g003
Figure 4. Representation of the properties of the observed objects in the input dataset. Top left corner—number of instances of each class, top right corner—visualization of bounding box shapes, bottom left corner—visualization of occurrence of observed objects, bottom right corner—representation of relative sizes of bounding boxes to the image.
Technologies 13 00116 g004
Figure 5. Detection of the cow activity in the stall with a small amount of followed objects.
Technologies 13 00116 g005
Figure 6. Detection of the cow activity in the stall with a large amount of tracked objects.
Technologies 13 00116 g006
Figure 7. Detection of the cow activity in the stall while in low light conditions at night.
Technologies 13 00116 g007
Figure 8. Confusion matrix for the YOLOv5m model trained on the input dataset.
Technologies 13 00116 g008
Figure 9. Comparison of learning progress of selected network types YOLOv5, (a) YOLOv5x, (b) YOLOv5m, (c) YOLOv5n.
Technologies 13 00116 g009
Figure 10. Comparison of training progress for selected learning rate values, (a) 0.001, (b) 0.1.
Technologies 13 00116 g010
Figure 11. Training progress comparison for selected Batch size values, (a) 32, (b) 4.
Technologies 13 00116 g011
Figure 12. Comparison of training progress for selected optimizers, (a) Adam, (b) SGD.
Technologies 13 00116 g012
Figure 13. Representation of the used 5-fold cross-validation process. The dataset is visually represented as a long horizontal bar, with blue and orange segments indicating random image selection. The green cells (labeled “Val”) represent the validation set for each fold, while the orange cells (labeled “Train”) indicate the training data.
Technologies 13 00116 g013
Figure 14. Comparison of the results obtained by 5-fold cross-validation (Mean of observed metrics and MAPE).
Technologies 13 00116 g014
Table 1. Selected steps of data augmentation.
StepAdjustmentDescription
01Creation of
cut-outs
Based on the random position, 3 cuts of pre-selected size of 720 × 720 pixels are created from the original image.
02ResizingThe original image is resized to match the size of the cut-outs (720 × 720 pixels). At the same time, the coordinates of the individual points of the polygonal masks are changed according to the corresponding image operation.
03Image rotationThe images are rotated by a random angle from three pre-selected intervals.
04image flippingThe images are flipped according to the vertical and horizontal axis.
05Change of perspectiveThe perspective of the image is adjusted three times. The coordinates of the corner points are randomly selected. The coordinates of the left corner are from the intervals x 0 ; 1 4 · w ,   y 0 ; 1 4 · h , the coordinates of the right-hand corner are from the intervals x 3 4 · w ; w ,   y 0 ; 1 4 · h , the coordinates of the bottom left corner are from the intervals x 0 ; 1 4 · w ,   y 3 4 · h ; h , and the coordinates of the bottom right corner are from the intervals x 3 4 · w ; w ,   y 3 4 · h ; h , where w is the width and h is the height.
06Image blurringThe image is blurred using the Gaussian Blur type where the blur radius is 7.
07Histogram equalizationFunctions from the openCV library are used, which allow us to select standard equalization or the CLAHE method. First, the color image is converted to HSV color space and then the Value channel is equalized.
08Contrast changeThe value of 128 is subtracted from all pixel values of the images, the result is multiplied by a selected coefficient from the range of 0.5 to 1.5 and then the value of 128 is added again. The contrast is reduced if the coefficient is less than 1 and increased if the coefficient is greater than 1.
09Brightness changeThe product of 255 and a constant from the interval 〈−0.5; 0.5〉 was added to the value of all pixels. After performing this summation, a new value is assigned to each pixel. If the value is greater than 255, it is automatically set to 255, and similarly, if the value obtained is less than 0. the value is set to 0.
10Noise additionChanging randomly selected RGB channel pixels, where the original pixel value is rapidly increased.
11Color scale shiftAfter converting the image to HSV, a randomly selected value from the interval −20 to 20 is added to the H-channel values resulting in a color shift.
Table 2. Comparison of selected metrics of the applied retrained YOLOv5m model.
ClassPrecisionRecallmAP_0.5mAP_0.5:0.95
cow_stay0.9540.9580.9810.883
cow_lay0.9670.9490.9890.910
Table 3. Comparison of YOLOv5 network types by selected metrics and training time.
Model Type—Number of
Parameters
mAP 0.5mAP 0.5:0.95Training Time
A30_v5x_e100_b8_lr01_SGDv5x—86.7 mil.0.98800.907016:53:27
A30_v5l_e100_b8_lr01_SGDv5l—46.5 mil.0.98850.906011:07:17
A30_v5m_e100_b8_lr01_SGDv5m—21.2 mil.0.98870.89697:48:19
A30_v5s_e100_b8_lr01_SGDv5s—7.2 mil.0.98850.88245:31:42
A30_v5n_e100_b8_lr01_SGDv5n—1.9 mil.0.98770.85365:29:17
Table 4. Comparison of the effect of learning rate size by selected metrics and training time.
Learning RatemAP 0.5mAP 0.5:0.95Time
A30_v5m_e100_b8_lr1_SGD0.10.98840.88977:47:17
A30_v5m_e100_b8_lr01_SGD0.010.98870.89697:48:19
A30_v5m_e100_b8_lr001_SGD0.0010.98870.90287:47:43
Table 5. Comparison of the impact of batch size according to selected metrics and training time.
Batch SizemAP 0.5mAP 0.5:0.95Time
A30_v5m_e100_b4_lr01_SGD40.98780.896112:50:48
A30_v5m_e100_b8_lr01_SGD80.98870.89697:48:19
A30_v5m_e100_b16_lr01_SGD160.98820.89856:36:25
A30_v5m_e100_b32_lr01_SGD320.98840.89736:07:13
Table 6. Comparison of optimizer impact by selected metrics and training time.
OptimizermAP 0.5mAP 0.5:0.95Time
A30_v5m_e100_b8_lr01_SGDSGD0.98870.89697:48:19
A30_v5m_e100_b8_lr01_AdamAdam0.98420.83617:48:05
Table 7. 5-Fold Cross-Validation Performance Metrics for YOLOv5 Variants.
ModelMetricPrecisionRecallmAP_0.5mAP_0.5:0.95
YOLOv5xMean0.98790.98460.99340.9611
MSE3.82 × 10−77.28 × 10−71.78 × 10−85.48 × 10⁻⁷
RMSE0.00060.00090.00010.0007
MAPE0.0578%0.0777%0.0097%0.0669%
YOLOv5lMean0.98730.98410.99330.9585
MSE2.05 × 10−79.57 × 10−74.89 × 10−81.45× 10⁻⁷
RMSE0.00050.00100.00020.0004
MAPE0.0378%0.0876%0.0168%0.0370%
YOLOv5mMean0.98550.98110.99300.9469
MSE2.34 × 10−66.15 × 10−76.05 × 10−83.07 × 10⁻⁷
RMSE0.00150.00080.00020.0006
MAPE0.1276%0.0736%0.0184%0.0541%
YOLOv5sMean0.98320.97780.99250.9339
MSE1.84 × 10−62.11 × 10−62.27 × 10−82.70 × 10⁻⁷
RMSE0.00140.00150.00020.0005
MAPE0.1042%0.1141%0.0140%0.0466%
YOLOv5nMean0.97640.96780.99060.8957
MSE9.50 × 10−69.92 × 10−71.88 × 10−73.03 × 10⁻⁷
RMSE0.00310.00100.00040.0006
MAPE0.2979%0.0813%0.0380%0.0469%
Disclaimer/Publisher’s Note: The statements, opinions and data contained in all publications are solely those of the individual author(s) and contributor(s) and not of MDPI and/or the editor(s). MDPI and/or the editor(s) disclaim responsibility for any injury to people or property resulting from any ideas, methods, instructions or products referred to in the content.

