1. Introduction
Logistics is a sector that has been gradually increasing to reach the high levels of growth where we are now. This delivery volume is becoming an ever great logistical challenge, and one of the key issues is the last-mile deliveries, the final stage of the logistics process [
1,
2]. Specifically, parcel logistics encompasses several key phases: receiving and warehousing, where packages are efficiently inventoried and stored; sorting and order processing, which ensures the selection and preparation of packages according to destination and priority; transportation and distribution, optimizing routes and modes of transport to ensure fast deliveries; the last mile, the most costly and complex final leg, which requires advanced strategies to meet high customer expectations; and customer service, which includes package tracking, returns management, and problem resolution, fundamental to maintaining customer satisfaction and loyalty [
1,
3].
One of the biggest problems is the availability of the customer, since, in an ideal world, the delivery routes are punctual and all the packages scheduled for delivery are delivered, but in the real world, individuals are not always at home, and, even with the established measures, there are still packages that cannot be delivered and return to the warehouse to be delivered at another time [
4,
5], assuming a significant economic cost for the company in charge of it, generating additional costs of up to 15 euros per occurrence [
6].
This research seeks to optimize the delivery route to maximize the number of packages delivered without inconvenience, resulting in better customer experience and a lower operating cost for the company. Our specific aim is to explore how optimizing last-mile delivery processes can mitigate frequent customer no-shows.
Develop and implement a genetic algorithm to simultaneously optimize route cost and customer time preferences.
Significantly reduce operational costs associated with delivery rescheduling.
Increase customer satisfaction while respecting their delivery preferences [
7].
To achieve these goals, we have developed a genetic algorithm, detailed in
Section 4, that optimizes both routing cost and customer time preferences. This approach is compared to a traditional Simulated Annealing (SA) algorithm, which focuses solely on the routing cost.
In our approach, the optimization of the delivery route considers both cost and time as key factors, but their relationship is managed through a weighted evaluation. The cost function integrates both aspects by summing the total distance traveled and a penalty component associated with delivery time preferences. Whilst minimizing total distance will generally lead to cost efficiency, it may not be consistent with optimal delivery times due to customer preferences and time window constraints. To address this, our criterion function introduces penalty values for deliveries outside the preferred time windows, ensuring that the algorithm does not prioritize cost reduction at the expense of excessive deviations from customer time preferences. A key aspect of this penalty system is that it is not static but proportional to the degree of deviation from the preferred time window. If delivery is only slightly outside the window, the penalty is relatively small. However, as the deviation increases, the penalty increases accordingly. This mechanism ensures that the optimization process naturally favors solutions that are close to customer preferences, rather than treating all violations equally severely. This setup allows the optimization process to balance these competing objectives. In practical terms, if a route significantly reduces distance but results in multiple late or early deliveries, the associated penalties will progressively increase, making the solution less favorable. Conversely, strict adherence to time preferences at the expense of an excessively long route would also lead to higher costs. By structuring the evaluation function in this way, we ensure that the genetic algorithm naturally searches for solutions that achieve a compromise between cost efficiency and on-time deliveries, rather than prioritizing one objective over the other.
Initial results, presented in
Section 5.2, show that the genetic algorithm, although requiring more computational time, can generate routes of equal or lower cost than the SA algorithm, satisfying the time preferences of 4–7 more customers per route. This translates into a potential savings of EUR 105 per day in redelivery costs, or approximately EUR 35,280 per year, discounting the costs of running the algorithm.
This research has significant implications for last-mile optimization in parcel logistics. By directly addressing the problem of missed deliveries due to customer absence, our approach promises not only to reduce operational costs but also to improve customer satisfaction [
8,
9]. Future work will focus on further optimizing the algorithm parameters and exploring its potential with improved hardware resources [
10].
2. Related Work
This section reviews relevant research papers that address last-mile logistics optimization, particularly those that employ genetic algorithms and consider factors such as customer preferences, time windows, and specific last-mile delivery challenges. Genetic algorithms are presented as a powerful tool for solving variants of the vehicle-routing problem (VRP), while additional research exploits complementary approaches and considers the specific factors that impact the efficiency and sustainability of last-mile delivery.
2.1. Last-Mile Optimization
Optimizing the last mile involves more than simply finding the shortest or fastest route. It highlights the importance of considering the risk preferences of the decision maker, particularly in situations with uncertain demand [
11]. Incorporating this element can lead to more robust and adaptable solutions to changing real-world conditions. Other works delve into providing an overview of last-mile solutions, including the use of packet-rail pigeonholes [
12,
13,
14]. In particular, the work of Ranjbari et al. presents field evidence demonstrating that parcel lockers can significantly reduce delivery times and the time couriers spend inside buildings [
13].
Another approach explores the use of route optimization algorithms in conjunction with OpenStreetMap data [
15] to improve the planning and delivery of community health services [
16]. This study highlights the importance of integrating real-world data into optimization models for more accurate and effective solutions. There are also lines of work exploring the use of drones for data delivery and data collection, respectively [
17,
18]. As drones become more common, their integration into last-mile logistics presents new opportunities and challenges for route optimization.
No less important is the analysis of the impact of the growth of e-commerce on urban logistics, as reported in the work of Settey et al., where the use of electric vehicles is advocated for more sustainable distribution [
19]. Incorporating sustainability into route optimization is crucial to reducing the environmental impact of last-mile deliveries. The importance of considering the health and safety of delivery workers is also not neglected, especially in the context of global events such as the COVID-19 pandemic [
20]. This paper highlights the need to incorporate human factors into optimization models to guarantee the welfare of workers involved in the last-mile delivery.
These works highlight the importance of incorporating customer preferences and sustainability into delivery planning. Innovations such as parcel lockers and electric vehicles have shown potential to reduce delivery times and environmental impact. However, these approaches often focus on large infrastructure changes rather than algorithmic improvements, leaving a gap in the problems inherent to dynamic customer constraints during route optimization, unlike our work.
2.2. Genetic Algorithms
Genetic algorithms are optimization techniques based on principles of genetics and natural selection, being especially useful for solving complex problems, such as route planning [
21,
22]. These algorithms are ideal for environments where delivery directions and conditions change daily, as they can adapt and find optimal solutions under varying circumstances [
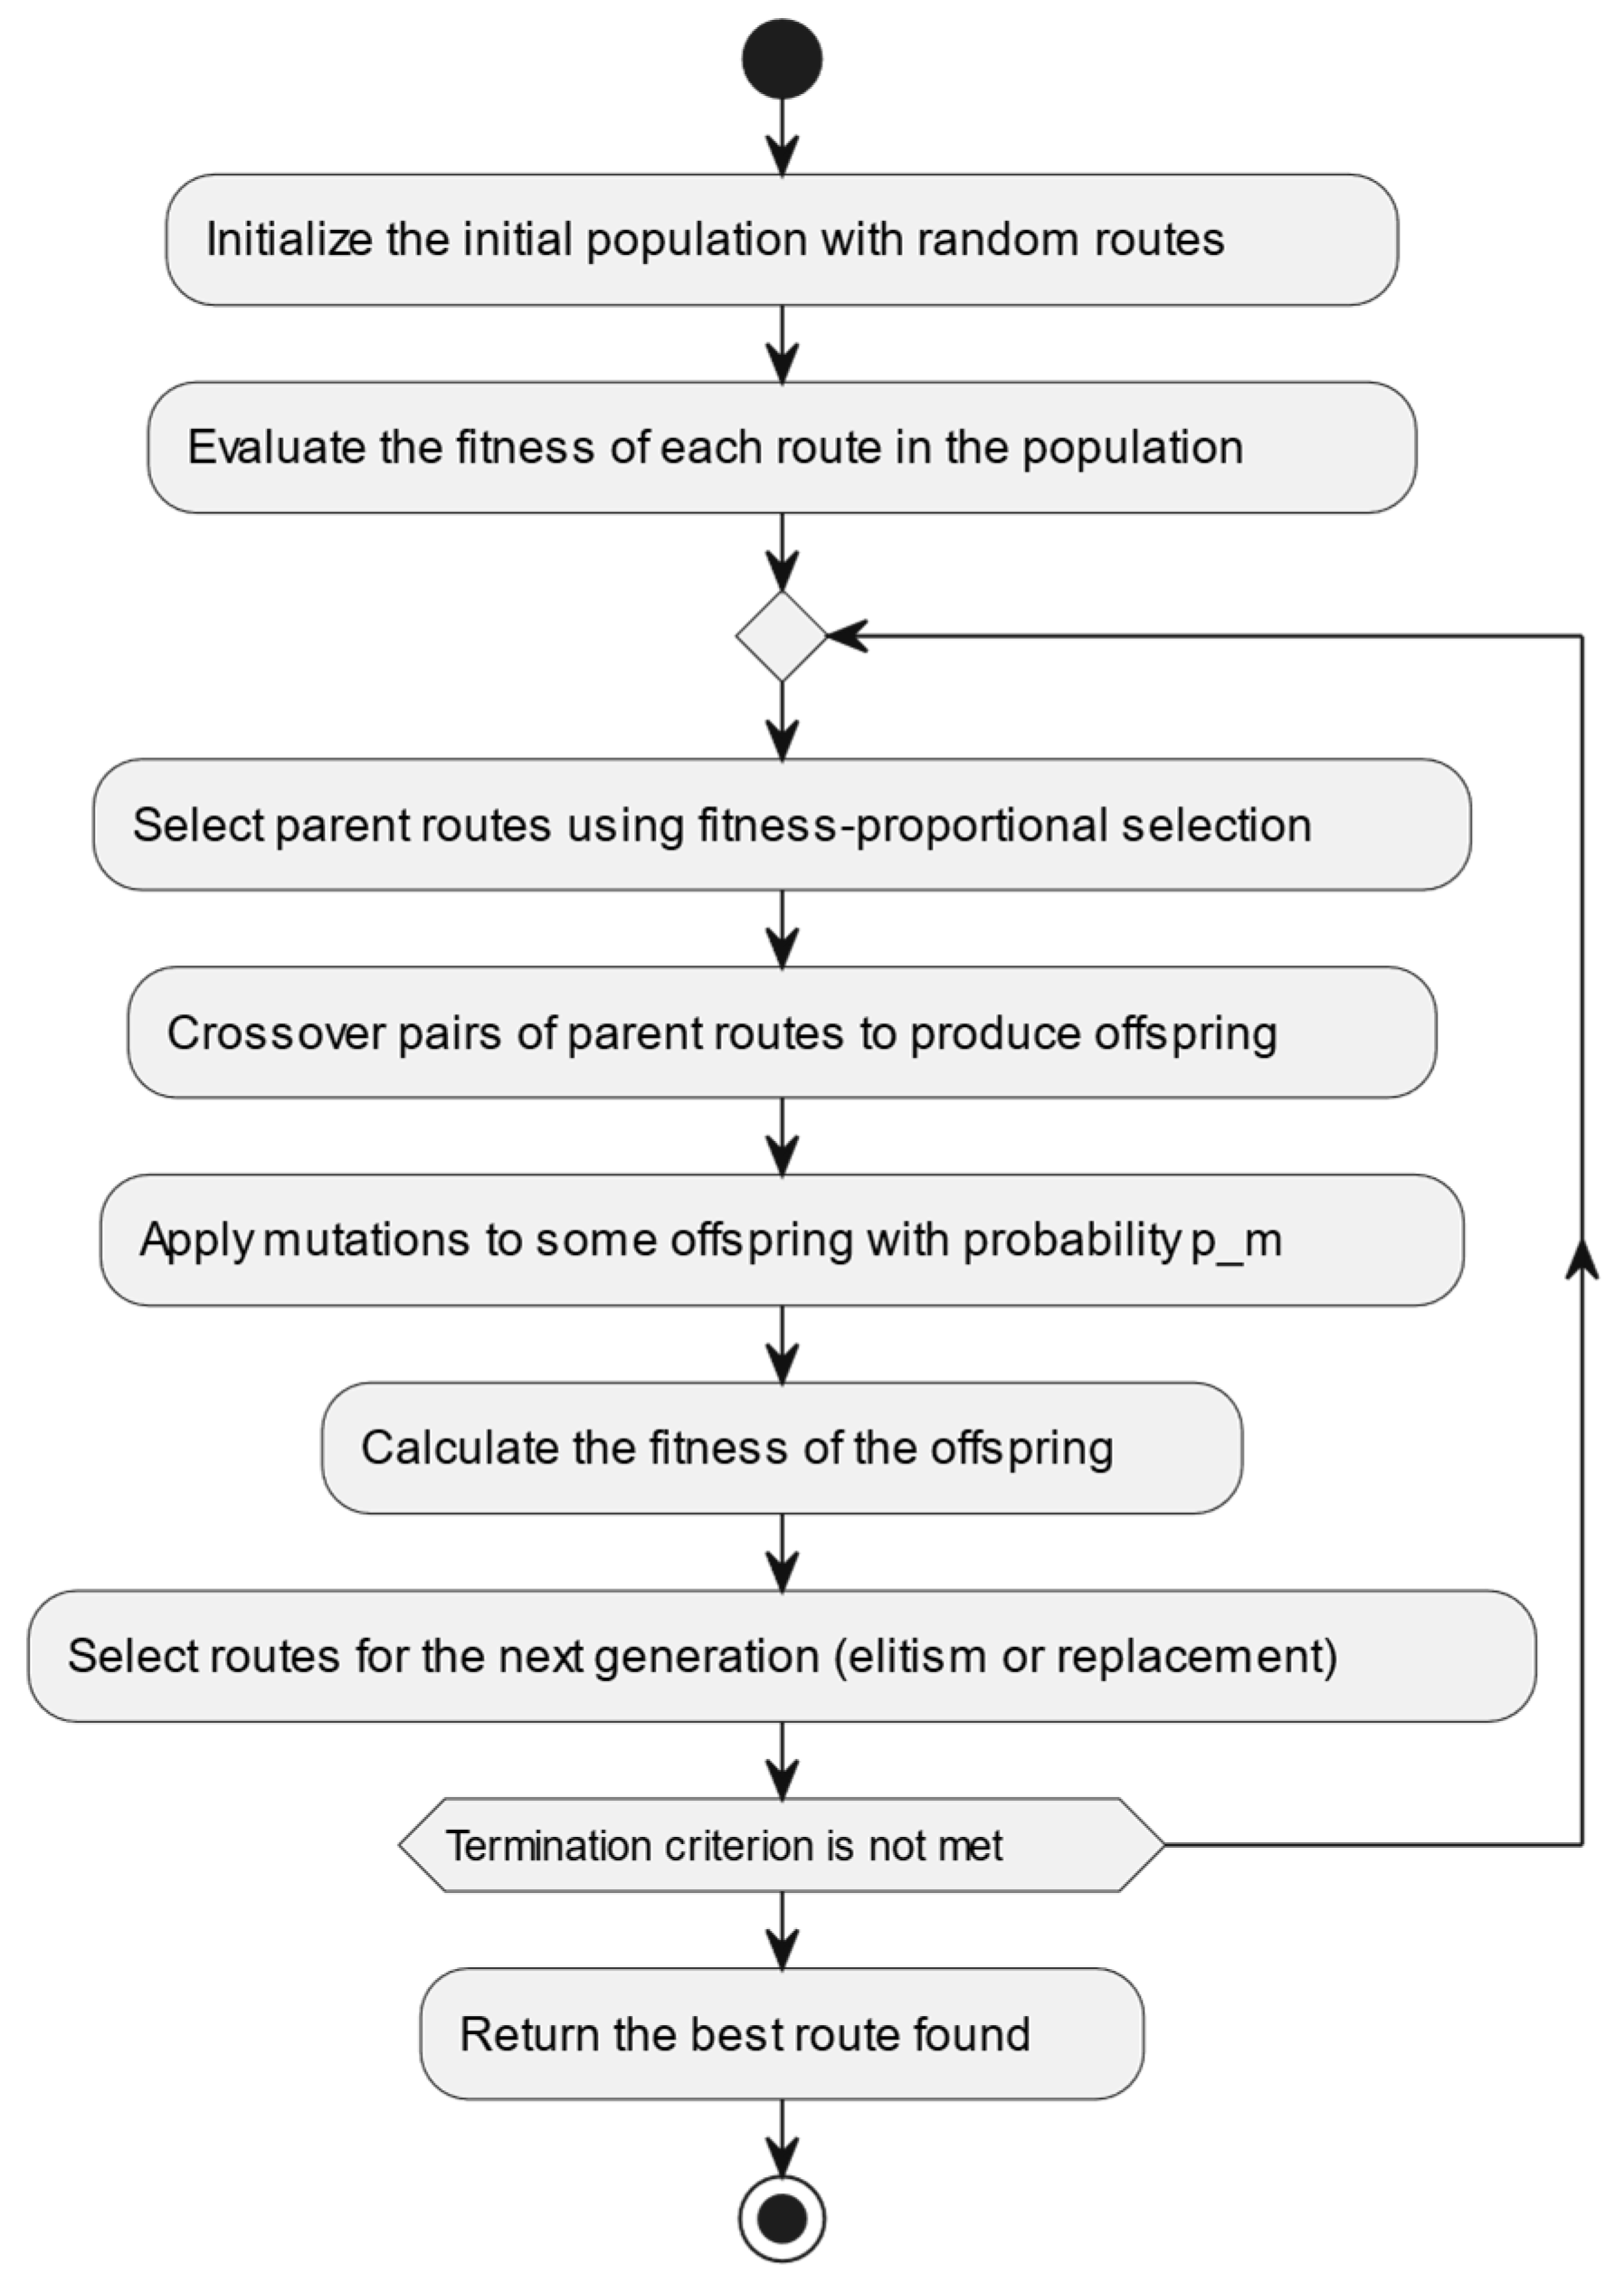
23]. This is crucial for last-mile logistics, where each day can present a unique set of delivery challenges. The generic application of the basic scheme of a genetic algorithm to the problem of route exploration (without going into further detail) would be as presented in
Figure 1.
One of the main advantages of genetic algorithms is their ability to optimize multiple conditions simultaneously [
24]. For example, they can design routes that not only minimize time and distance but also consider other variables such as specific time slots for delivery, which allows for penalizing routes that do not meet these additional requirements. The process begins with an initial population of candidate solutions, which evolves through geometric operations such as selection, crossover, and mutation. During selection, the best solutions are chosen based on their “fitness” to pass to the next generation. Crossover combines characteristics of two parental solutions to produce offspring that may have better characteristics than either of their predecessors. Mutation introduces variability to the process, randomly altering parts of the solution to explore new areas of the search space and avoid stagnation at local optima [
25].
Genetic algorithms (GAs) stand out for their adaptability and multi-objective optimization capabilities. These features make them particularly suitable for addressing the complexities of the vehicle-routing problem (VRP) in last-mile logistics. However, many studies present generic applications without specific adaptations for challenges such as time windows and customer satisfaction metrics, as we propose in our work.
2.3. Genetic Algorithms for Vehicle-Routing Problem (VRP)
Several studies have demonstrated the effectiveness of genetic algorithms for re-solving VRP variants in the context of last-mile logistics [
12,
22,
26]. Jiang et al. introduce the Multi-Objective Evolutionary Algorithm with Neighborhood Detection (MOEAND), a multi-objective evolutionary algorithm that improves efficiency by reducing the search space and avoiding local optima. This approach is particularly relevant for real-time route optimization, where computational speed is crucial [
27]. The work of Li et al. focuses on an improved multi-objective genetic algorithm for the time-dependent vehicle-routing problem with time windows (TDVRPTW), considering travel time minimization and customer satisfaction maximization [
21]. Addressing customer preferences, such as preferred time windows, is essential to improve customer experience and reduce failed deliveries due to customer absence. Su et al. propose a somewhat-rhythmic particle swarm optimization (PSO) combined with the genetic algorithm for vehicle-routing problems with time windows (VRPTW) [
28]. While this work does not focus specifically on the last mile, it provides valuable information on alternative optimization algorithms that could be applied to this domain. Ibrahim et al. present an improved genetic algorithm for the vehicle-routing problem pick-up and delivery with time windows (VRPPDTW), which involves both pick-up and delivery within specific time windows [
29]. This problem is particularly relevant for logistics companies that handle multiple customer requests with different time constraints.
In addition to these applications of the basic VRP, the literature explores variants that reflect the specific challenges of last-mile logistics. Different papers address the capacitated vehicle-routing problem with pick-up and alternative delivery (CVRPPAD), which introduces the possibility of alternate delivery points, such as parcel lockers or pick-up points. This flexibility can improve delivery efficiency by reducing instances of failed deliveries due to customer absence [
30,
31]. In Ruiz et al.’s study, the open vehicle-routing problem is explored, where vehicles do not return to the depot after completing their routes [
32]. This variant is relevant for delivery scenarios where vehicles may complete their routes at different locations, requiring a different optimization approach.
All these works explore the application of GAs in variants of VRP. Techniques such as Multi-Objective Evolutionary Algorithm with Neighborhood Detection (MOEAND) and hybrid approaches combining GAs with Particle Swarm Optimization (PSO) have demonstrated success in improving efficiency and minimizing lead time. However, few studies explicitly integrate customers’ time preferences into the optimization process, which is a key aspect of our methodology.
2.4. Other Related Approaches
In the previous sections, several works related to route optimization using genetic algorithms and considering last-mile-specific factors were explored. However, it is crucial to broaden the analysis to include other perspectives that address complementary issues to improve the understanding of the overall logistics optimization landscape.
One approach would be time-dependent routing problems and emergency logistics. Gendreau et al. provides a comprehensive review of time-dependent routing problems, a fundamental aspect in last-mile logistics, where travel times can vary significantly due to factors such as traffic or weather conditions. This work classifies problems according to route type and information availability, providing a valuable framework for understanding the complexities of dynamic routing [
33]. Gong et al. addresses a specific problem within weather-dependent routing: optimizing the distribution of emergency materials during floods. An improved adaptive large neighborhood search (IALNS) algorithm is proposed to coordinate trucks, boats, and drones, highlighting the importance of adaptability and responsiveness in emergency situations, where route optimization must consider changing conditions and urgency of delivery [
34].
Vallas S. and Schor J. examine the platform economy and its influence on the nature of work and employment, a crucial issue in the context of last-mile logistics, where digital platforms play an increasingly important role in connecting customers, businesses, and delivery workers. It is argued that platform-platforms act as “permissive potentates”, outsourcing responsibility and control over economic transactions, which poses unique challenges for re-regulation and worker protection [
35].
One cannot forget the multiple applications of machine learning in logistics. An example of the multitude of works in this regard is provided in the work of Tsolaki et al. This work provides a review of the use of machine learning in freight transportation and logistics, highlighting its potential to improve efficiency and decision making in several areas, such as arrival time prediction, demand forecasting, and anomaly detection. This work provides valuable insight into how emerging technologies can transform logistics optimization, complementing traditional approaches such as GA [
36]. In addition to machine learning applications, innovations in computer vision and unmanned aerial vehicles (UAVs) are opening new possibilities for last-mile logistics optimization. Bemposta et al. present an edge-computing-based computer vision system implemented on UAVs for intelligent traffic management [
37]. This approach could significantly improve the navigation of autonomous vehicles in complex urban environments, which is crucial for the efficiency of last-mile deliveries. In another paper, they propose an optimization algorithm to reduce the training time of deep learning computer vision algorithms using large image datasets with small objects [
38]. This technique could accelerate the development and deployment of advanced vision systems for logistics, enabling faster adaptation to new environments and challenges. Both papers demonstrate the potential of combining emerging technologies such as UAVs, computer vision and optimization techniques to address complex last-mile logistics challenges.
As reviewed, there are complementary approaches to the problem raised in this work, such as machine learning and unmanned aerial vehicles (UAVs), which enrich the last-mile logistics landscape. These technologies are promising for improving decision making and operational efficiency. However, their integration into route optimization frameworks remains limited, often focusing on specific use cases such as emergency logistics or anomaly detection.
3. Materials and Methods
Although the studies reviewed in
Section 2 provide a solid foundation, they often lack comprehensive frameworks that balance cost, efficiency, and customer satisfaction in dynamic environments. Our research addresses this gap by proposing a GA specifically designed to optimize delivery routes while respecting customers’ time preferences. This approach not only builds on the strengths of previous work but also introduces a practical solution to improve operational efficiency and user experience in last-mile logistics.
The main objective of this study is to evaluate the effectiveness of GA to optimize last-mile deliveries, comparing it with an approach based on simulated annealing. The research focuses on reducing operational costs and increasing customer satisfaction by improving compliance with time preferences.
The validation of the algorithm was carried out through experiments during the year 2024, covering delivery routes in various regions of Spain (including the Community of Madrid, Zaragoza, Barcelona, and Palma de Mallorca) and Los Angeles, California. The tests simulated different logistics scenarios, such as dense urban routes, deliveries in dispersed suburban areas, and cases with high variability in customer preferences. In total, 17 representative test cases were evaluated to compare both algorithms.
The GA was implemented using standard combinatorial optimization tools, employing selection, crossover, and mutation operators to generate optimal solutions in terms of cost and time preferences. The statistical analysis included the evaluation of key metrics such as route costs, the number of fulfilled/unfulfilled preferences, and execution times. In addition, a statistical comparison was made using hypothesis tests to determine the significance of the results obtained by both algorithms.
The following subsections describe in detail the geographic information services used, the base algorithm for comparisons, the execution environment, the proposed GA, and the application developed as a proof of concept to validate the algorithm.
3.1. Geographic Information Processing
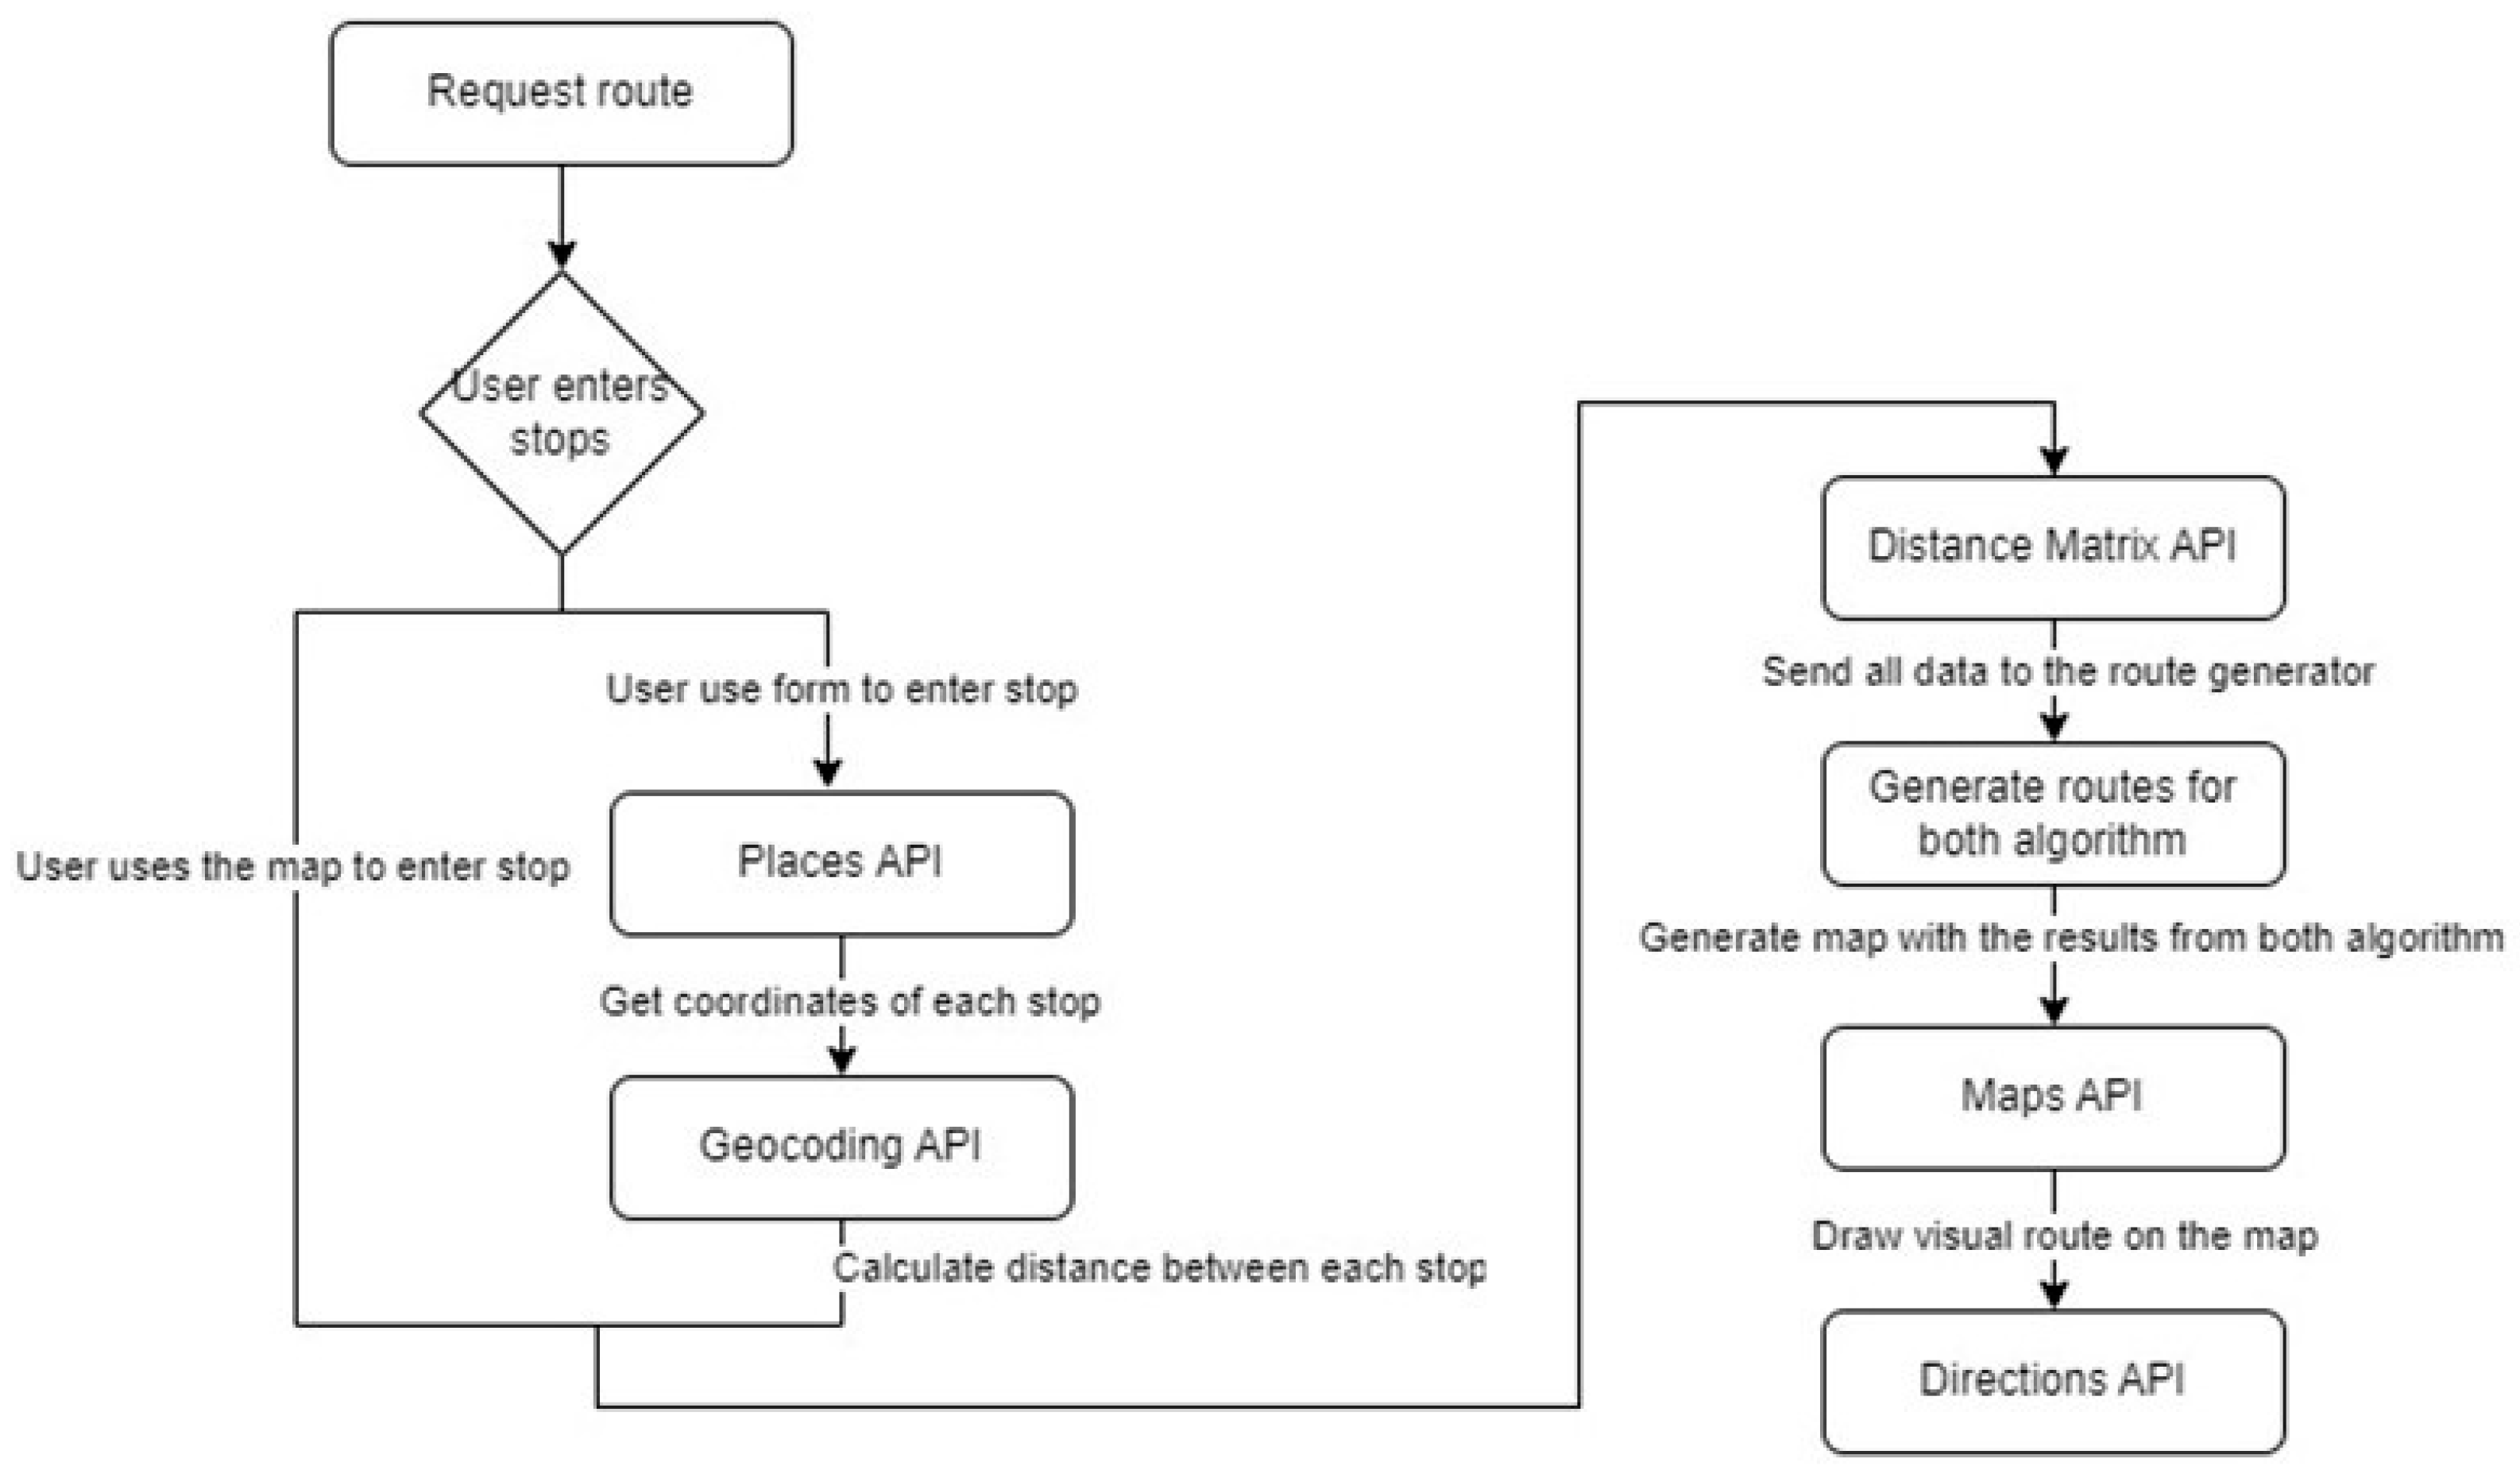
Several APIs from the Google Maps Platform [
39] ecosystem have been used for information pre- and post-processing to simplify development, as can be seen in
Figure 2. Other open and low-cost alternatives could have been used (such as OpenStreetMap [
15], Leaflet [
40], or Mapbox [
41]), but simplicity and interoperability have prevailed in this case to focus all efforts on the development of the genetic algorithm and a Demonstrative System. Specifically, the following APIS were used:
Maps API: Allows the integration of customizable maps directly into the web application. It also provides the visual functionality to add stops by simply clicking on the map or seeing the markings on a single map of all the stops.
Places API: Facilitates the search for information about specific locations, additionally allowing us to guarantee a homogeneity of address format, to ensure that the stop has all the necessary data and ensure the uniqueness of this.
Geocoding API: Converts addresses into geographic coordinates (latitude and longitude), and vice versa. Thanks to the use of Maps API and Places API, it has been optimized, and it is almost not necessary to use it; it is only used as a contingency system.
Distance Matrix API: This is the fundamental API, since it oversees calculating the distances and travel times between a set of origin and destination points. It is vital to create the distance matrix necessary to feed both the main route optimization algorithm (GA) and the “simple” comparison algorithm.
Directions API: Allows us to generate the detailed route, displayed on the map, between the different points generated by the algorithms.
3.2. Baseline Algorithm
For the research of this project, two algorithms have been developed, the GA (fully described at
Section 4), which is the one whose effectiveness we want to show against multi-objective optimization (cost and time preferences). To verify the usefulness of this algorithm, the Simulated Annealing (SA) algorithm has been developed, which is widely used in similar problems of searching for the best route.
This algorithm is an optimization technique based on metal cooling. An initial solution (route) is generated randomly, and the same matrix of distances and lead times generated for the GA is used. Parameters such as initial temperature, cooling rate, and number of iterations are defined. At each iteration, a new solution (a given order of stops) is generated by slightly modifying the current solution. The new solution is accepted based on a probability that it depends on the cost difference between the current solution and the new solution and the current temperature. The temperature is gradually reduced according to the defined cooling rate, repeating the process until the final temperature or the maximum number of iterations is reached. Finally, the best path found during the cooling process is obtained, and a JSON file like that of the GA is generated. The algorithm configuration was set at an initial temperature of 2000 was set for cases below 20 stops and 4000 for higher cases. The cooling rate was set to 0.997 for all cases. Increasing the initial population provides more exploration for a larger number of stops.
It should be noted that, initially, the A* algorithm was chosen to make comparisons with the genGA, but during the development and testing of this one, an exponential increase was discovered in its complexity when increasing beyond the 15 stops, making it ineffective for the needs of the project, so Simulated Annealing was chosen instead.
3.3. Execution Environment
To facilitate the research process and allow accessibility to it, the entire project was published on a website to be accessible from any device and thus facilitate the research; for this purpose, three technologies are used:
GitHub Pages is a hosting service offered by GitHub that allows for publishing websites directly from a repository on GitHub. Since all the code is installed on that service, it is very convenient, as it allows for easy and dynamic deployment as new versions of the application are being developed.
A Heroku Dyno (Heroku -22 stack, based on Ubuntu 22.04) is a lightweight virtualized unit used to run application processes on the Heroku platform. Each Dyno operates in an isolated environment and can run any specified process type 24 h a day, 7 days a week. In this case, it allows us to operate the application back end and the processing of both algorithms in a specific machine for these, optimizing the time needed to process a route with intermediate stops.
Heroku Postgres (version 15.8) is a managed SQL database service, which offers PostgreSQL as a cloud service. This service is deeply integrated with the Heroku platform; this is ideal for this project since the back end of the application is hosted on the same platform, so the integration is complete, greatly facilitating the development of this.
3.4. Genetic Algorithm (GA)
The Genetic Algorithm (GA) process starts with the generation of an initial population, with a random order of the stops to be made. Subsequently, the quality of everyone is evaluated based on the total distance, time, and customer preference penalties. This preference penalty is made in proportion to the delay with respect to the requested range; in this way, even if the route does not meet 100% of the preferences (which is statistically impossible), it will obtain a route that minimizes the error of these preferences. The best routes are selected for breeding, combined with new routes, and random changes are introduced in some routes to maintain genetic diversity. After a certain number of generations, the best route is obtained, and a JSON file is generated with the information of the best route, including estimated arrival times and total cost.
To adapt the general algorithm to the specific situation we are dealing with in this work, where the priority is to match the time preference of the recipients to avoid absences, its parameters and operations have been fine-tuned. For the correct optimization of the algorithms during the development of the tests, the different parameters have been adapted to improve the efficiency of both. In the case of the GA for cases with less than 20 stops, the crossover probability (CXPB) was set at 0.8, the mutation probability (MUTPB) at 0.01, the number of generations (NGENs) at 150, and the number of the initial population at 150. For cases with larger stops, CXPB has been set, MUTPB identical, but NGEN has been modified to 500 and the initial population to 500. These changes have been made to broaden the population to encourage more diversity, and increasing the NGEN allows for finding optimal solutions within an exceptionally large population.
Algorithm 1 shows the concrete details of the algorithm steps, whose input information is the following series of configurable parameters:
: Set of deliveries to be made, e.g., , where each represents a delivery point (geographic coordinates of the locations).
: Matrix of distances between all locations (including origin and destination). It is a square matrix of size , where represents the distance between points and . It may include additional costs, such as transit time or penalties for restrictions.
: Number of routes randomly generated at the beginning of the algorithm. Each route is a permutation of the deliveries in .
: Generations. The maximum number of iterations of the GA. In each generation, we seek to improve the routes by means of the selection, crossover, and mutation operators.
mutation_rate: mutation in each path probability.
crossover_rate: crossover between two paths probability.
Fitness: A measure that evaluates how good a solution is. In this case, fitness could be calculated as the total cost of the route:
.
: The best route found after generations. It is the result of the algorithm.
| Algorithm 1: Genetic Optimization for Delivery Routes |
Initialize population: Generate population_size random delivery routes (permutations of deliveries). Calculate initial fitness: For each route r, compute the total cost as: Cost(r) = Distance(r) + Penalties(r)Cost(r) = Distance(r) + Penalties(r)
|
3.5. Proof of Concept
To build the proof of concept, we have prioritized a system that can meet the requests of the researcher quickly and intuitively, for this purpose the project has been separated into frontend, backend, and database. The system to speed up the testing is deployed in the cloud (detailed in
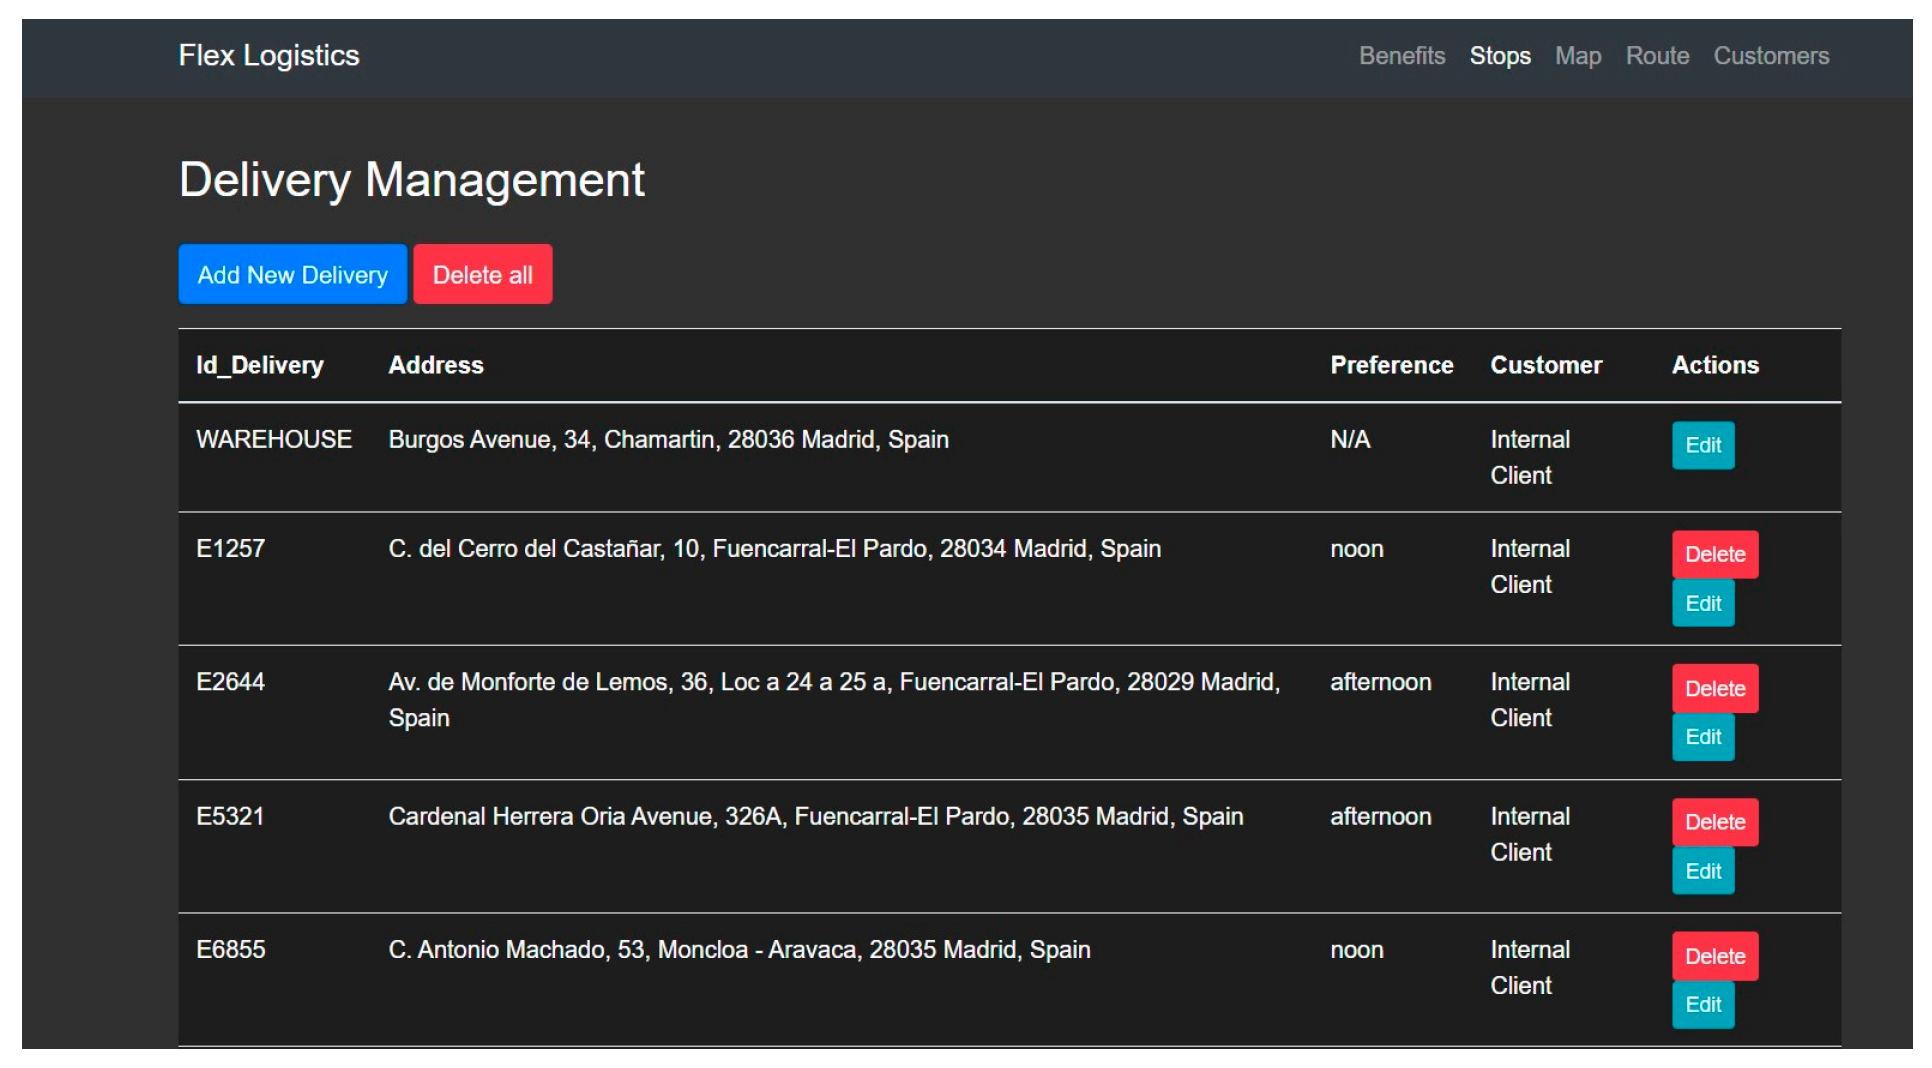
Section 3.3); to favor accessibility and make the system intuitive, an interface has been developed to control the different test configurations (stops, clients, and routes). As shown in
Figure 3, researchers can see the complete list of stops and edit or delete the selected one. Additionally, a new delivery can be added to the system, thanks to a modal connected to Google Maps that will help the researcher to find the address to add. For faster assessment, an interactive map is also available to the researcher where they can add stops by simply clicking on the map and clicking on the button to add them all at once to the system.
This allows for rapid test modifications to verify the results in this case. There will also be a section to check the results of the algorithms with the previously configured stops, where it will be possible to see the order chosen by the algorithms, the estimated time of the same, and whether the assigned preference has been fulfilled (
Figure 4a). In addition, a map and the resulting metrics for each of the algorithms are displayed in
Figure 4b.
With this system, several tests will be carried out, varying the conditions of the stops to simulate different possible scenarios in normal situations. These scenarios will be evaluated using specific metrics and a map with the established order of stops, allowing for verification of the accuracy and efficiency of the results obtained.
4. Results
To check the effectiveness of the GA, the Simulated Annealing algorithm has been implemented to verify its performance. To perform this comparison, some metrics common to both algorithms have been established, which will be evaluated for each of the cases; these metrics are shown in
Table 1:
In addition to the metrics shown in
Table 1, other relevant information is shown for each case, such as departure and arrival time and total route time. To correctly compare both algorithms, it has been established that the defined warehouse is the starting point of both algorithms, and both use the same matrix of distances and speeds. In this way, it is possible to compare the results of both and to legitimize the conclusions following the analysis of their results. To evaluate the algorithms in different situations, the following tests have been designed, where the stops to be made and the customers’ preferences will vary:
Case 1. This test is set for 11 stops (not including the warehouse), all of them located within the almond of Madrid (inside the M-30 road), i.e., all stops are close to each other. In this test, we put the time preference in the morning; with this, we ensure that all preferences are met, and we can compare only the cost calculation of all.
Case 2. Two stops located on the outskirts of Madrid have been added to the stops in case 1; the timetable preferences are still in the morning.
Case 3. For this test, 33 stops (not including the warehouse) are made, all located nearby, with randomly selected time slots.
Case 4. For this test, 29 stops are made (not including the warehouse), this time with scattered addresses outside the center of Madrid; the time slots have been randomized.
Case 5. For this test, a full working day with 44 stops (not including the warehouse) is simulated in both algorithms; the time slots are randomized.
Case 6. The same stops are simulated as in case 6, but the warehouse address is changed to Alcobendas.
Case 7: With the warehouse in Hortaleza (Madrid) and a late delivery starting at 12:00, the GA outperforms the SA by tracing a shorter route in distance, similar in time, but satisfying more time preferences: genetic 5/16, SA 1/16.
Case 8: Warehouse in Las Rozas, with a distribution of 18 stops distributed between the center of Madrid and the vicinity of the warehouse. The genetic algorithm reduces the duration of the route by 20 min and fulfills 13/18 preferences, compared to 5/18 for the SA algorithm.
Case 9: In a route through the outskirts of Madrid with 15 dispersed stops (simulating deliveries to pharmacies or bars), the genetic algorithm stands out with a shorter total distance and meets 9/15 preferences, compared to 4/15 for the SA algorithm.
Case 10: Another suburban case with 12 stops farther apart: the genetic algorithm stands out by fulfilling 3/12 preferences, compared to 1/12 for the SA algorithm.
Case 11: In Zaragoza, with 16 stops very close to each other, the genetic algorithm reduces the total distance, takes 30 min less, and fulfills 6/16 preferences, compared to 5/16 for the SA algorithm.
Case 12: In Barcelona, with 18 stops mostly centrally located and 3 farther away, the genetic algorithm fulfills 9/18 preferences, compared to 7/18 for the SA algorithm.
Case 13: In Barcelona again, but with 15 stops more dispersed, the genetic algorithm matches the total distance but meets 5/15 preferences, compared to 3/15 for the SA algorithm.
Case 14: In Palma, with 16 centrally located stops and a distant store, the genetic algorithm outperforms the SA algorithm by reducing the distance, cutting 20 min off the route, and meeting 8/16 preferences.
Case 15: In the northern part of Palma, with 12 distant stops, the genetic algorithm improves preference fulfillment: 7/12 vs. 4/12 for the SA algorithm.
Case 16: In Los Angeles, with 17 centrally located stops, the genetic algorithm traces a shorter route, saving 20 min and fulfilling 5/17 preferences, compared to 2/17 for the SA algorithm.
Case 17: In Madrid, with 15 stops, the genetic algorithm fulfills 8/15 preferences, compared to 6/15 for the SA algorithm, maintaining a route practically equal in time and distance.
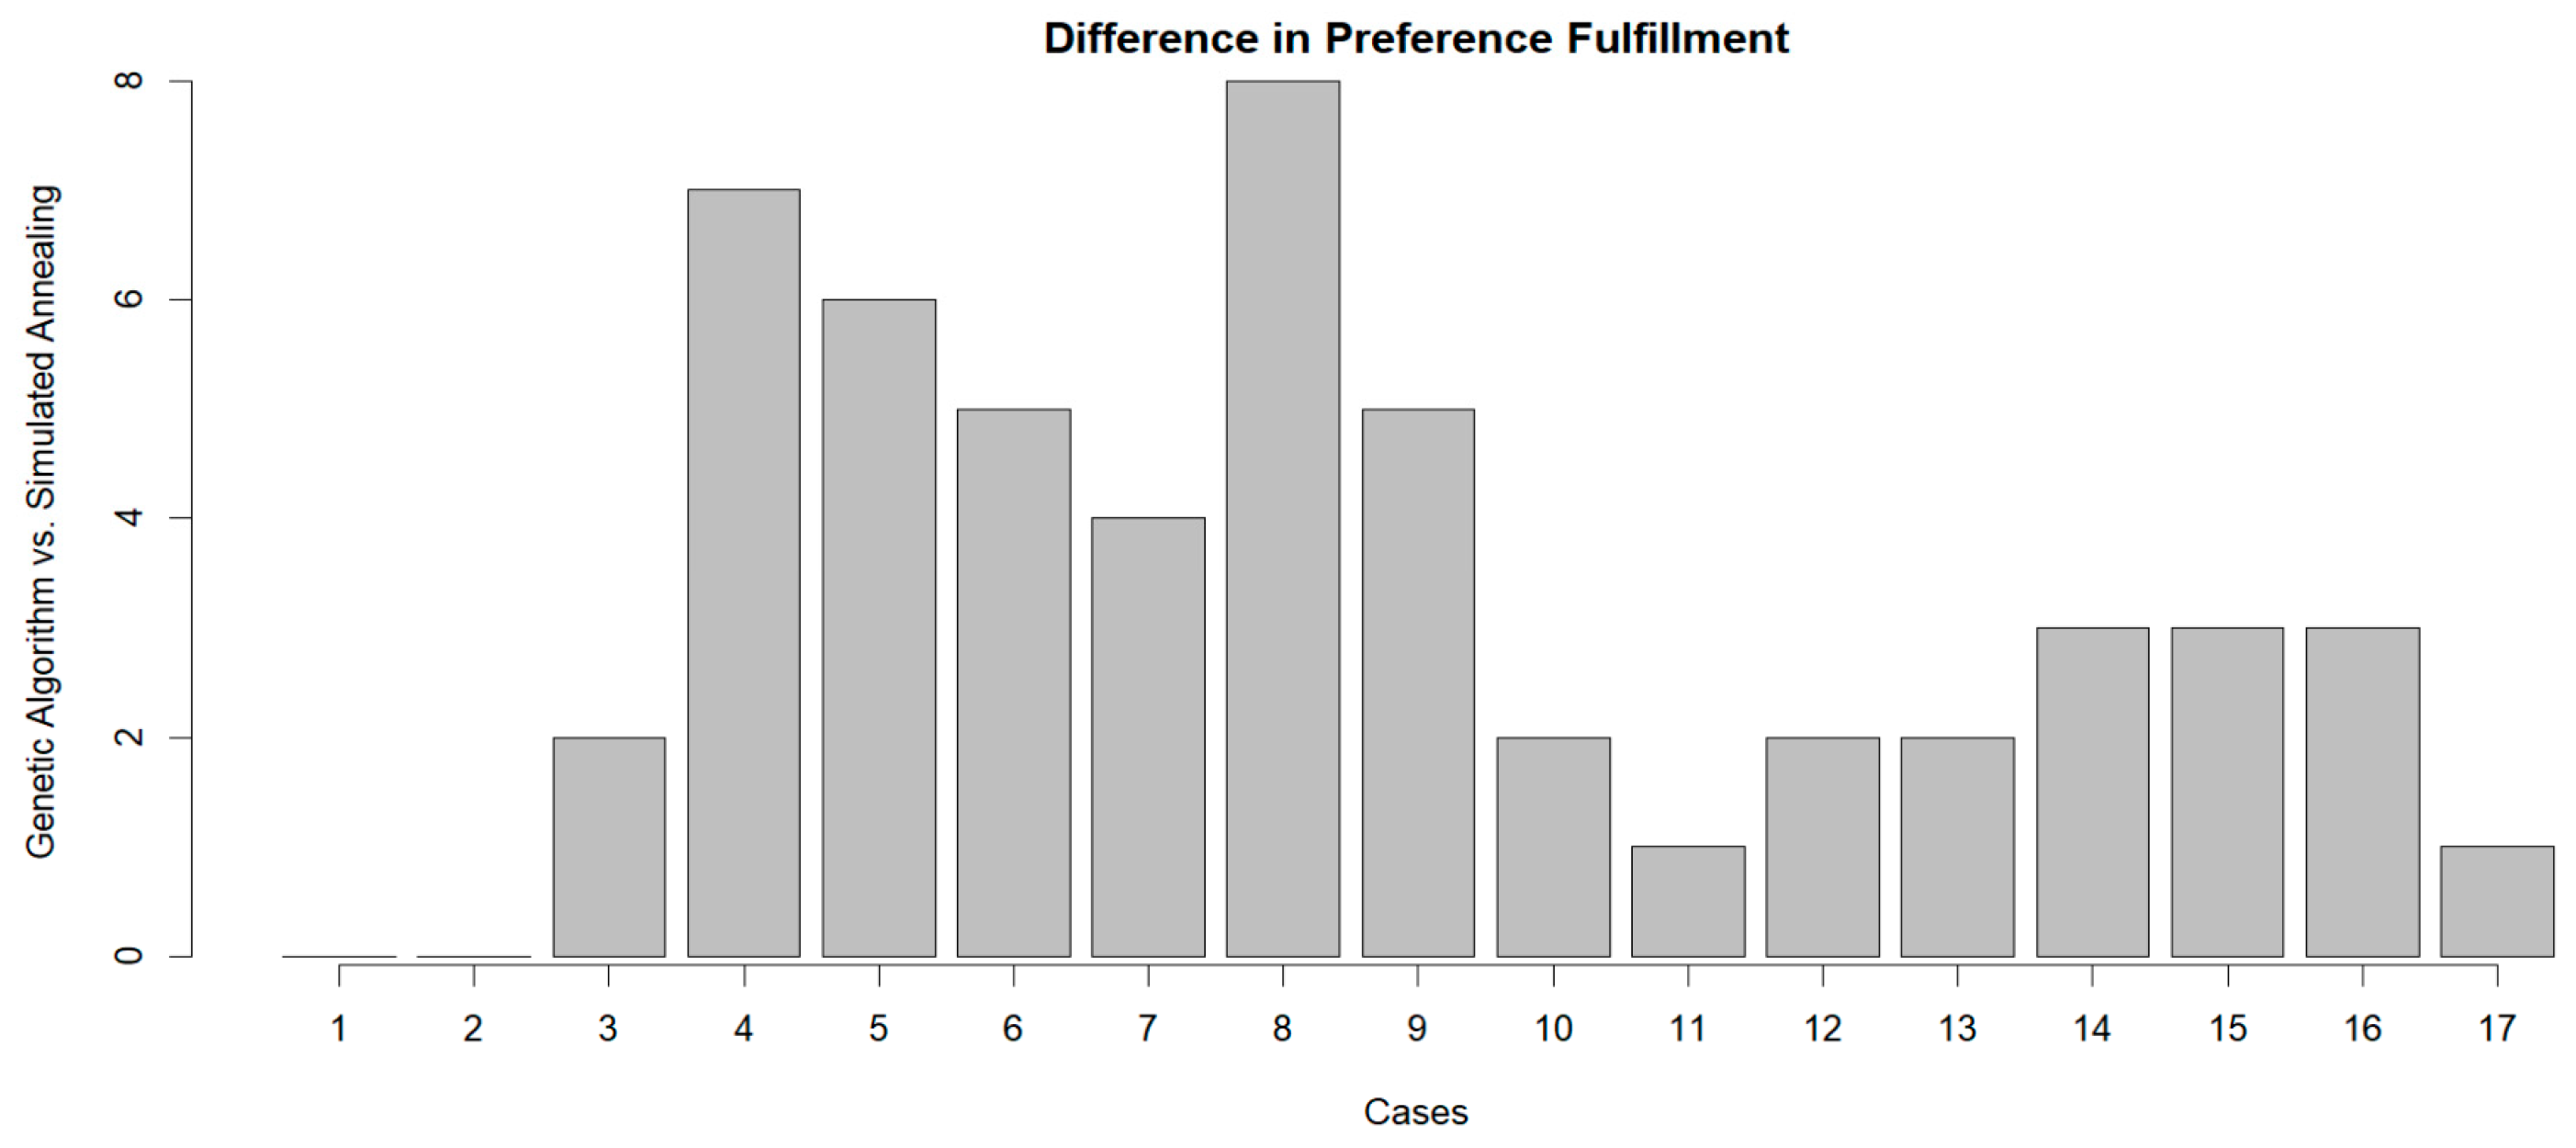
Table 2 and
Table 3 show the complete results of running the 17 cases described in this section. The first one shows the results of the GA, while the second one contains those of the Simulated Annealing algorithm. In
Figure 5, it can be seen, for each test case, the difference in the number of preferences satisfies between the GA and the SA.
5. Discussion
5.1. Analysis of the Results Obtained
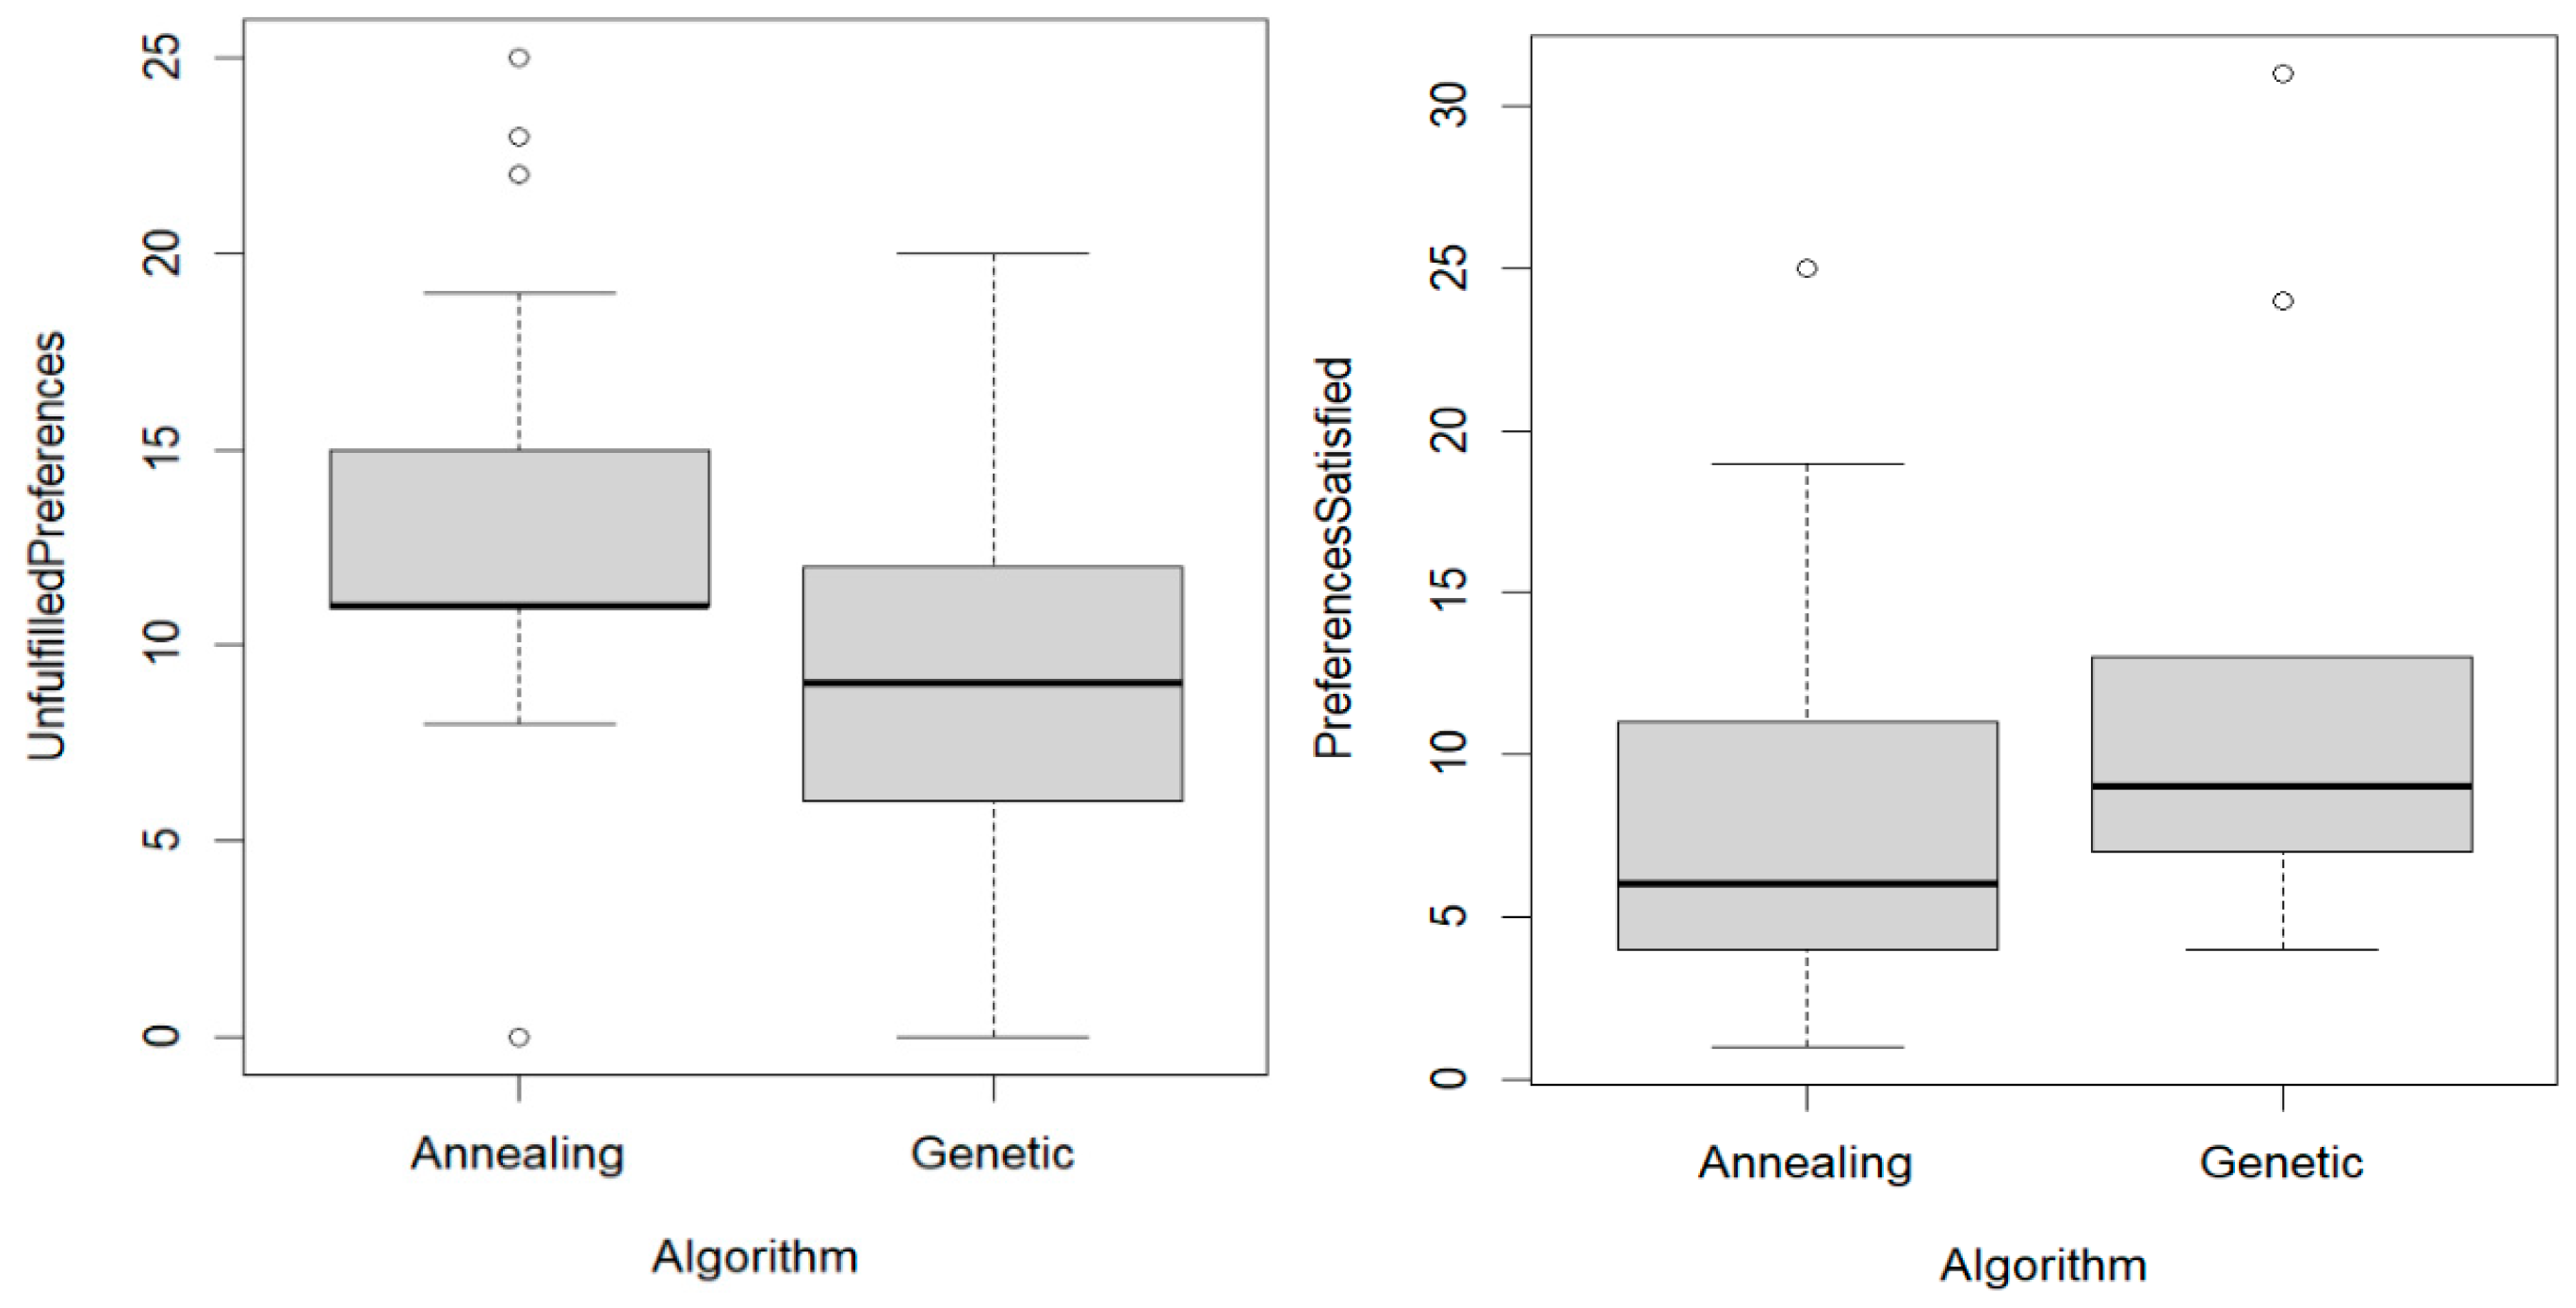
This research aims to determine if the GA can generate routes of equal or lower cost compared to traditional optimization algorithms, which only consider cost as a criterion. For this purpose, a statistical study is carried out to evaluate the existence of significant evidence between the effectiveness and efficiency of the proposed methods to solve the last-mile problem. The results obtained in this study highlight the effectiveness of the GA in optimizing last-mile deliveries by meeting a higher number of customer preferences compared to the Simulated Annealing method, as shown in
Figure 6 (the box plots show the distribution of the results for each metric, highlighting the differences in median, interquartile range, and outliers between the two algorithms).
Figure 6 shows that the GA achieves a higher number of preferences fulfilled in the test cases, while, on average, the classical optimization algorithm fails to fulfill a higher number of customer preferences. To analyze the existence of significant evidence in the fulfillment of these preferences, a hypothesis test is performed where it is assumed that, on average, the GA breaches fewer preferences than the Simulated Annealing method.
The hypothesis test yields a p-value of 0.9219, using a significance level of 99% and a t-statistic with 32 degrees of freedom. These results indicate that, on average, the classical algorithm breaches three more preferences per test case than the GA, with mean breaches of 12 and 9, respectively.
Figure 5 illustrates, for each test case, the difference in the number of preferences satisfied between the GA and the SA method. This graph reflects the improvement achieved by the GA in the fulfillment of customer requests for each of the cases analyzed. This finding is particularly relevant given that the fulfillment of specific constraints represents a critical challenge in the last-mile context, where customer experience and operational efficiency are key priorities.
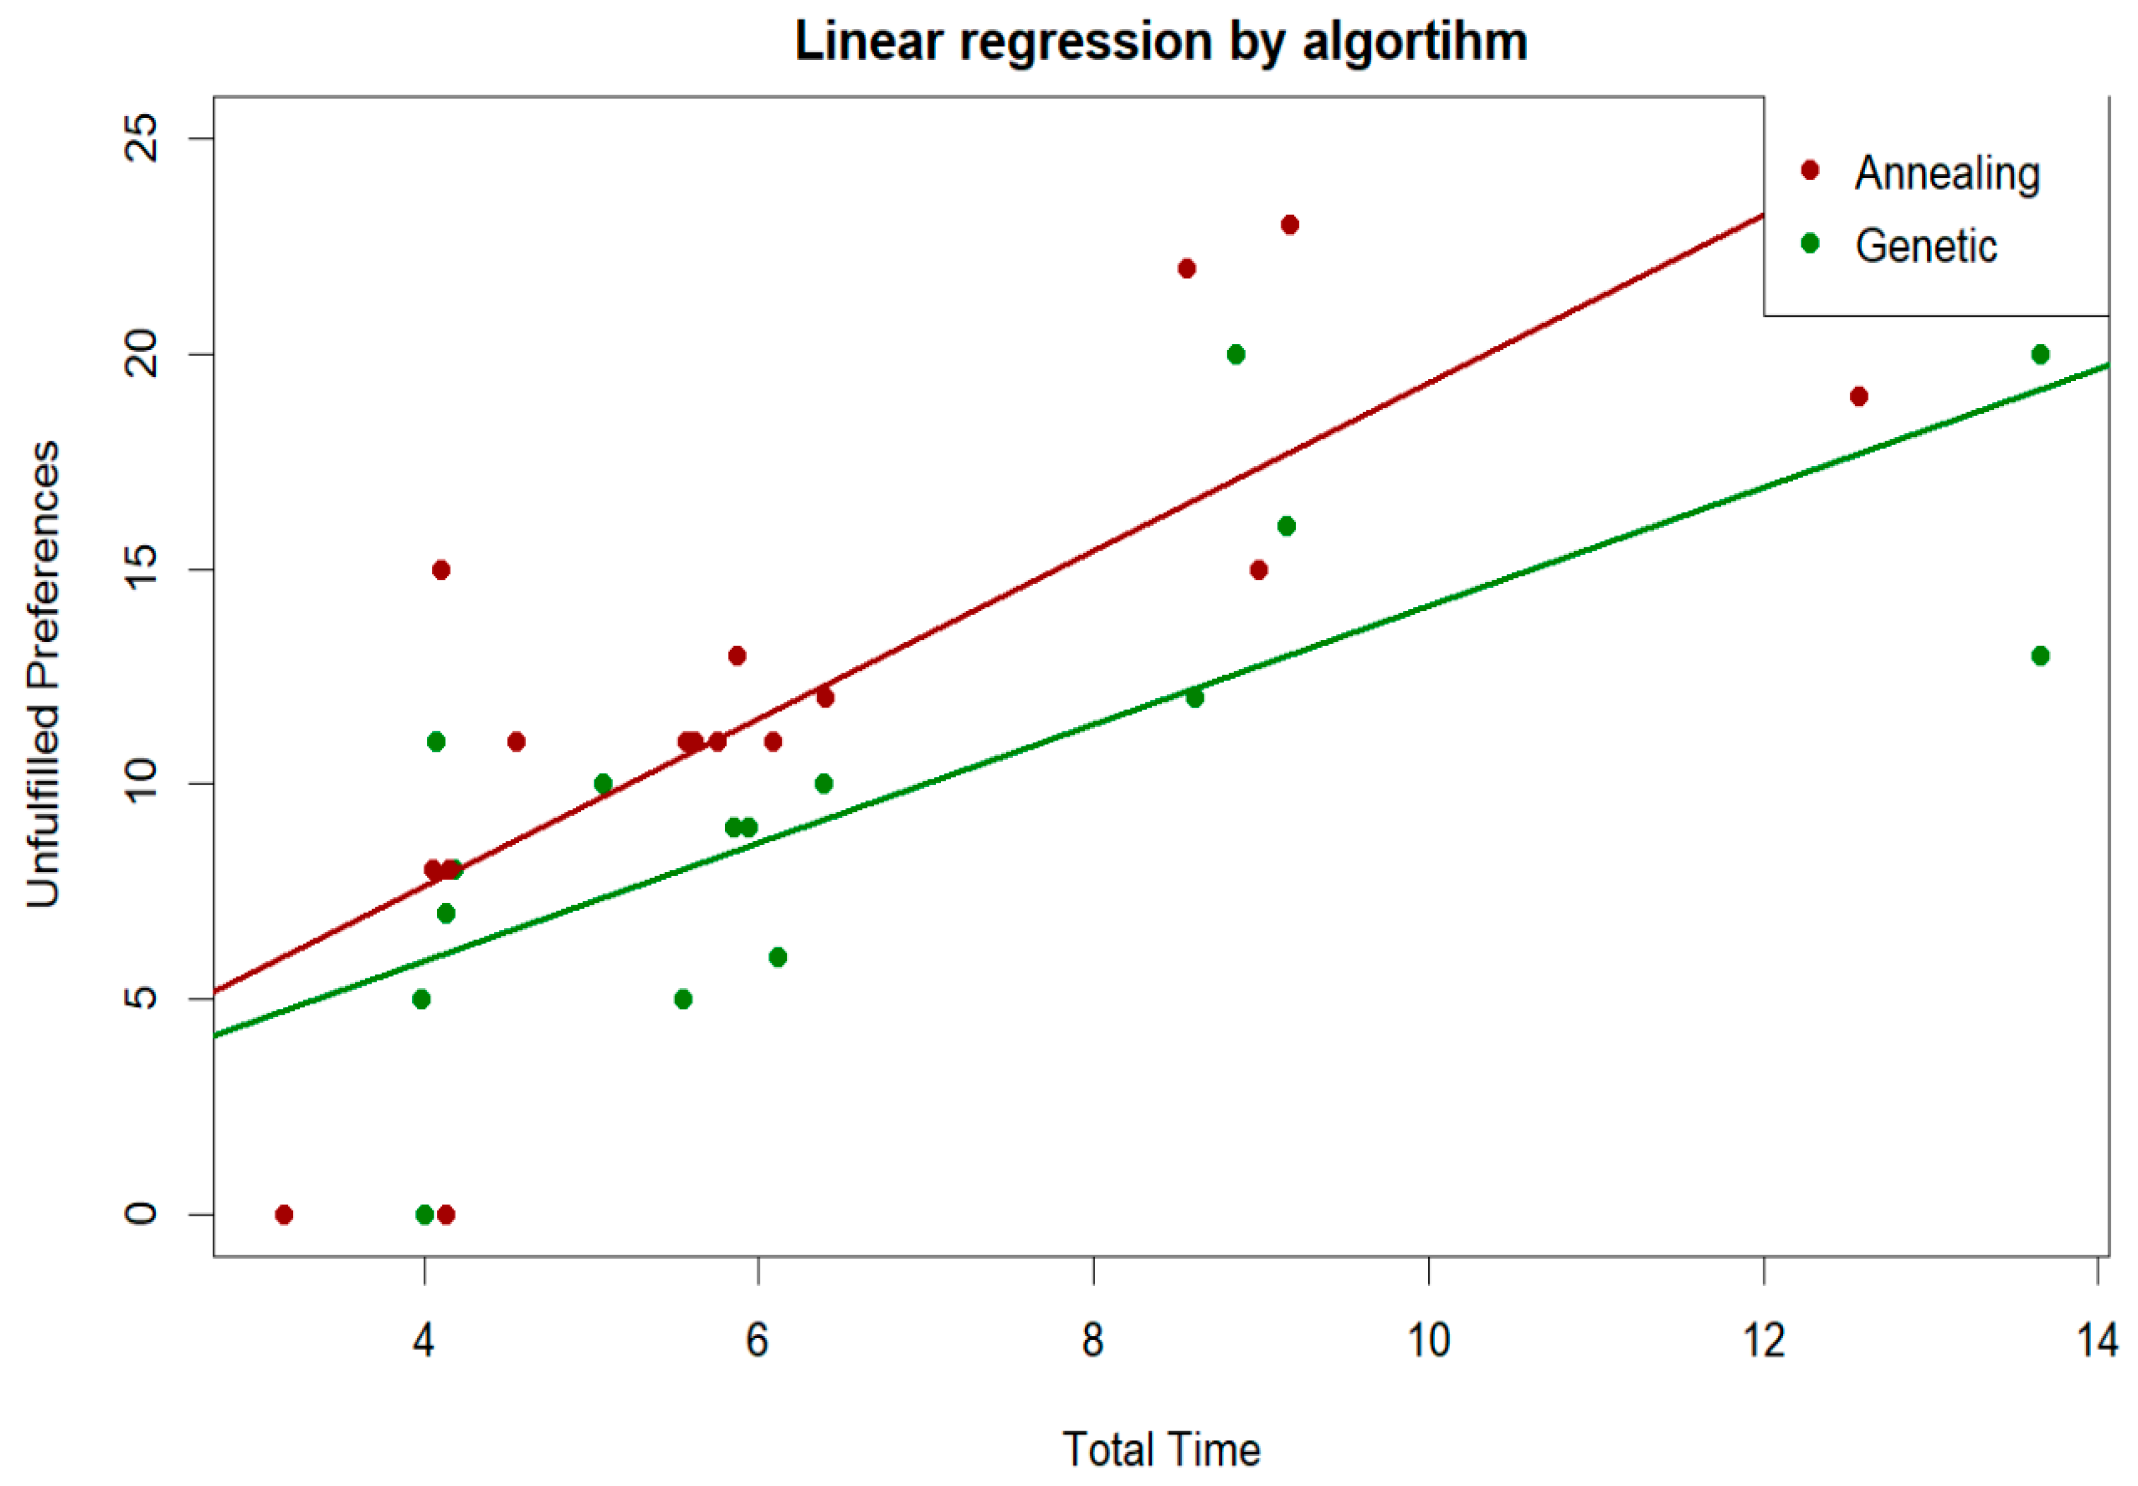
There is a direct relationship between the number of stops and delivery times, with a correlation coefficient of 93%, as well as between non-compliance with preferences and total time required, with a correlation coefficient of 76%. In all cases, a greater number of stops leads to an increase in total time, which is consistent with expectations. As stops increase, so do errors in meeting customer preferences.
Although both methods have similar travel times on average,
Figure 7 illustrates the regression between the number of unfulfilled customer preferences and travel time for each algorithm. It is observed that, at similar re-run times, the Simulated Annealing method presents a worse regression in all cases, suggesting that, under the condition of equivalent lead times, this algorithm defaults significantly more on customer preferences. This finding is crucial, since preference fulfillment is a fundamental criterion for determining which algorithm most efficiently optimizes the process, favoring the GA in terms of customer satisfaction.
5.2. Improvements on Operations Costs
As can be seen in the results, the GA, in all cases, takes considerably longer to optimize the route than the SA algorithm; this is because it analyzes many candidates. In the worst optimization cases, the cost in time is very similar, varying very little the time of completion of the route. But the objective of this research was to check if the GA can generate routes of lower or equal cost compared to traditional optimization algorithms that only consider cost. It also satisfies the time preference of 4–7 more customers per route; as commented in the state of the art, the absence of the customer can generate an over cost of 15 euros per failed delivery, comparing with the best of our cases (six new preferences respected). The company can save daily costs of 105 euros, which would translate into a saving of 35,280 euros, from which we would have to subtract the costs of running the GA. To perform these calculations, we consider that a typical cloud processing instance (e.g., a t3.medium instance on AWS) costs approximately 0.0416 USD per hour. Assuming an exchange rate of 1 USD = 0.92 EUR, this equates to approximately 0.0383 EUR per hour.
If the company needs to perform 1000 runs per day, the total daily run time for the SA algorithm is 0.03 s per run, resulting in 30 s for 1000 runs. This converts to approximately 0.00833 h per day. The daily cost to run the SA algorithm is 0.00034667 USD, which translates to an annual cost of approximately 0.12653 USD. Converted to euros, this would be approximately 0.116 euros per year.
On the other hand, the total daily execution time for the GA is 22 s per run, resulting in 22,000 s for 1000 runs. This is equivalent to approximately 6.11 h per day. The daily cost to run the GA is 0.25422 USD, which translates to an annual cost of approximately 92.79111 USD. Converted to euros, this would be approximately 85.37 euros per year. Discounting this additional computational value to the savings of performing the planning of the delivery routes with the GA, we would obtain savings of 35,194.63 euros per year.
It should also be noted that both algorithms show that, in the routes generated with many stops, there are some specific cases where there is a margin for optimization. First, it must be considered that Google’s system can consider speed limits, road cut-offs, or traffic on the route and adapt to the situation, so that some route “failures” may not be so in reality and be the optimal option. In the tests, it has also been experienced that the optimization of the parameters is able to generate remarkable improvements, so it is considered that, by further optimizing the parameters of both algorithms and expanding the population of the genetic one, even better results can be obtained.
Therefore, the GA has huge potential for last-mile route optimization; with better optimization of its parameters and better hardware resources, the results would certainly improve and make it a very advantageous option to be used in the planning of last-mile delivery routes.
6. Conclusions
This study demonstrates that using a GA for last-mile delivery optimization offers significant advantages, especially in the trade-off between cost efficiency and customer satisfaction. By fulfilling up to 6–7 additional time preferences per route compared to the Simulated Annealing method, the proposed approach directly addresses one of the most critical challenges in last-mile logistics: minimizing failed deliveries due to customer absence. This translates into a potential saving of up to EUR 35,194 annually after accounting for computational costs, highlighting the practical impact of this methodology for logistics companies.
The results also validate the algorithm’s ability to operate effectively in dynamic and multi-constrained environments, showing its adaptability to diverse operational scenarios. This adaptability suggests its potential application not only in last-mile but also in mid-mile logistics, emergency supply distribution, or delivery contexts in highly populated urban areas. The flexibility of the GA to integrate additional constraints, such as vehicle types or environmental factors, further underscores its versatility and relevance across domains.
Through this work, readers gain a clear understanding of the practical integration of customer preferences into route optimization algorithms, the comparative strengths of GA versus traditional methods, and the broader implications for improving operational efficiency and user experience in logistics.
Future workS could explore the behavior of the algorithm in even more complex scenarios, including those with higher delivery density or region-specific constraints and those incorporating new regulatory or infrastructure challenges. Additionally, the integration of emerging technologies, such as drones or machine learning models, could further improve the performance and scalability of the algorithm.
Author Contributions
Conceptualization, J.S.-S. and G.V.-U.; data curation, G.V.-U.; formal analysis, J.S.-S., G.V.-U. and N.G.-H.; investigation, J.S.-S. and G.V.-U.; methodology, J.S.-S. and G.V.-U.; project administration, J.S.-S.; resources, J.S.-S.; software, G.V.-U.; supervision, J.S.-S.; validation, J.S.-S., G.V.-U. and N.G.-H.; visualization, G.V.-U. and N.G.-H.; writing—original draft, J.S.-S., G.V.-U. and N.G.-H.; writing—review and editing, J.S.-S., G.V.-U. and N.G.-H. All authors have read and agreed to the published version of the manuscript.
Funding
This research received no external funding.
Institutional Review Board Statement
Not applicable.
Informed Consent Statement
Not applicable.
Data Availability Statement
The original contributions presented in this study are included in the article. Further inquiries can be directed to the corresponding author.
Acknowledgments
The authors would like to thank Universidad Francisco de Vitoria for their support.
Conflicts of Interest
The authors declare no conflicts of interest.
References
- LogiNext-Blog | Optimizing Last Mile Delivery Costs: Strategies and Solutions. Available online: https://www.loginextsolutions.com/blog/optimizing-last-mile-delivery-costs-strategies-and-solutions/ (accessed on 31 December 2024).
- Gonzalez-R, L.; Leon-Blanco, J.M.; Andrade-Pineda, J.L.; Pourmohammadreza, N.; Reza, M.; Jokar, A. A Novel Two-Phase Approach for Optimization of the Last-Mile Delivery Problem with Service Options. Sustainability 2023, 15, 8098. [Google Scholar] [CrossRef]
- Jazemi, R.; Alidadiani, E.; Ahn, K.; Jang, J. A Review of Literature on Vehicle Routing Problems of Last-Mile Delivery in Urban Areas. Appl. Sci. 2023, 13, 13015. [Google Scholar] [CrossRef]
- Ramingwong, S.; Sopadang, A.; Tippayawong, K.Y.; Jintana, J. Factory Logistics Improvement: A Case Study Analysis of Companies in Northern Thailand, 2022–2024. Logistics 2024, 8, 88. [Google Scholar] [CrossRef]
- Mastering Last Mile Optimization: 10 Strategies | Track-POD. Available online: https://www.track-pod.com/blog/last-mile-optimization-strategies/ (accessed on 31 December 2024).
- Cada Entrega Fallida Del Ecommerce Cuesta 15 Euros | El Canal Marítimo y Logístico. Available online: https://www.diarioelcanal.com/entrega-fallida-ecommerce/ (accessed on 22 November 2024).
- Last-Mile Delivery Optimization: [Key Strategies in 2024]. Available online: https://acropolium.com/blog/last-mile-delivery-solutions-optimize-logistics-for-better-customer-satisfaction/ (accessed on 31 December 2024).
- Poor Delivery Management, Its Impact & Costs | FarEye. Available online: https://fareye.com/resources/blogs/poor-and-bad-delivery-management (accessed on 31 December 2024).
- Vrhovac, V.; Vasić, S.; Milisavljević, S.; Dudić, B.; Štarchoň, P.; Žižakov, M. Measuring E-Commerce User Experience in the Last-Mile Delivery. Mathematics 2023, 11, 1482. [Google Scholar] [CrossRef]
- A Genetic Algorithm Data-Driven Approach for Middle-Mile Delivery Optimization. Available online: https://www.kexuetongbao-csb.com/article/a-genetic-algorithm-data-driven-approach-for-middle-mile-delivery-optimization# (accessed on 31 December 2024).
- Cao, E.; Wang, X.; Yang, Y.; Ge, H. A hybrid heuristic algorithm for the fuzzy open vehicle routing problem with risk preference. J. Ind. Manag. Optim. 2025, 21, 1812–1831. [Google Scholar] [CrossRef]
- Silva, V.; Amaral, A.; Fontes, T. Sustainable Urban Last-Mile Logistics: A Systematic Literature Review. Sustainability 2023, 15, 2285. [Google Scholar] [CrossRef]
- Ranjbari, A.; Diehl, C.; Dalla Chiara, G.; Goodchild, A. Do parcel lockers reduce delivery times? Evidence from the field. Transp. Res. Part E Logist. Transp. Rev. 2023, 172, 103070. [Google Scholar] [CrossRef]
- Olsson, J.; Hellström, D.; Pålsson, H. Framework of Last Mile Logistics Research: A Systematic Review of the Literature. Sustainability 2019, 11, 7131. [Google Scholar] [CrossRef]
- OpenStreetMap Wiki. Available online: https://wiki.openstreetmap.org/wiki/Main_Page (accessed on 23 November 2024).
- Randriamihaja, M.; Ihantamalala, F.A.; Rafenoarimalala, F.H.; Finnegan, K.E.; Rakotonirina, L.; Razafinjato, B.; Bonds, M.H.; Evans, M.V.; Garchitorena, A. Combining OpenStreetMap mapping and route optimization algorithms to inform the delivery of community health interventions at the last mile. PLoS Digit. Health 2024, 3, e0000621. [Google Scholar] [CrossRef]
- Xiao, S.; Tan, X.; Wang, J. A Simulated Annealing Algorithm and Grid Map-Based UAV Coverage Path Planning Method for 3D Reconstruction. Electronics 2021, 10, 853. [Google Scholar] [CrossRef]
- Borges, N.P.; Ghedini, C.G.; Ribeiro, C.H.C. Mitigating Risk in UAV Aid Delivery Missions: A Safe Path Prioritization Approach. IEEE Access 2024, 12, 168765–168778. [Google Scholar] [CrossRef]
- Settey, T.; Gnap, J.; Beňová, D.; Pavličko, M.; Blažeková, O. The growth of e-commerce due to COVID-19 and the need for urban logistics centers using electric vehicles: Bratislava case study. Sustainability 2021, 13, 5357. [Google Scholar] [CrossRef]
- Tran, N.A.T.; Nguyen, H.L.A.; Nguyen, T.B.H.; Nguyen, Q.H.; Huynh, T.N.L.; Pojani, D.; Thi, B.N.; Nguyen, M.H. Health and safety risks faced by delivery riders during the COVID-19 pandemic. J. Transp. Health 2022, 25, 101343. [Google Scholar] [CrossRef] [PubMed]
- Li, J.; Li, J.; Xu, Y. An improved multiobjective evolutionary algorithm for time-dependent vehicle routing problem with time windows. Egypt. Inform. J. 2024, 28, 100574. [Google Scholar] [CrossRef]
- Ochelska-Mierzejewska, J.; Poniszewska-Marańda, A.; Marańda, W. Selected Genetic Algorithms for Vehicle Routing Problem Solving. Electronics 2021, 10, 3147. [Google Scholar] [CrossRef]
- Xin, L.; Xu, P.; Manyi, G. Logistics Distribution Route Optimization Based on Genetic Algorithm. Comput. Intell. Neurosci. 2022, 2022, 8468438. [Google Scholar] [CrossRef]
- Zhang, Y.; Chen, X.D. An Optimization Model for the Vehicle Routing Problem in Multi-product Frozen Food Delivery. J. Appl. Res. Technol. JART 2014, 12, 239–250. [Google Scholar] [CrossRef]
- Trisolvena, M.N.; Wattimena, F.Y.; Untajana, P.P. Logistics Efficiency in Product Distribution with Genetic Algorithms for Optimal Routes. Int. J. Softw. Eng. Comput. Sci. (IJSECS) 2024, 4, 247–262. [Google Scholar] [CrossRef]
- Ning, Y. Research on logistics distribution vehicle route planning problem based on genetic algorithm. In ACM International Conference Proceeding Series, Proceedings of the 2023 8th International Conference on Intelligent Information Processing, Bucharest, Romania, 21–22 November 2023; ACM: New York, NY, USA, 2023; pp. 228–231. [Google Scholar] [CrossRef]
- Jiang, H.; Zhang, Z.; Gao, W.; Feng, Z.; Wang, C.; Xiang, X.; Zhang, X. A Multiobjective Evolutionary Algorithm Incorporating Neighborhood Detection for the Vehicle Routing Problem with Soft Time Windows. 2024. [Google Scholar] [CrossRef]
- Xu, S.H.; Liu, J.P.; Zhang, F.H.; Wang, L.; Sun, L.J. A Combination of Genetic Algorithm and Particle Swarm Optimization for Vehicle Routing Problem with Time Windows. Sensors 2015, 15, 21033–21053. [Google Scholar] [CrossRef]
- Ibrahim, M.F.; Putri, M.M.; Farista, D.; Utama, D.M. An Improved Genetic Algorithm for Vehicle Routing Problem Pick-up and Delivery with Time Windows. J. Tek. Ind. 2021, 22, 1–17. [Google Scholar] [CrossRef]
- Sitek, P.; Wikarek, J. Capacitated vehicle routing problem with pick-up and alternative delivery (CVRPPAD): Model and implementation using hybrid approach. Ann. Oper. Res. 2019, 273, 257–277. [Google Scholar] [CrossRef]
- Sitek, P.; Wikarek, J.; Rutczyńska-Wdowiak, K.; Bocewicz, G.; Banaszak, Z. Optimization of capacitated vehicle routing problem with alternative delivery, pick-up and time windows: A modified hybrid approach. Neurocomputing 2021, 423, 670–678. [Google Scholar] [CrossRef]
- Ruiz, E.; Soto-Mendoza, V.; Ruiz Barbosa, A.E.; Reyes, R. Solving the open vehicle routing problem with capacity and distance constraints with a biased random key genetic algorithm. Comput. Ind. Eng. 2019, 133, 207–219. [Google Scholar] [CrossRef]
- Gendreau, M.; Ghiani, G.; Guerriero, E. Time-dependent routing problems: A review. Comput. Oper. Res. 2015, 64, 189–197. [Google Scholar] [CrossRef]
- Gong, Y.; Wang, W.; Zhou, Y.; Cheng, J. Optimization of emergency material distribution routes in flood disaster with truck-speedboat-drone coordination. J. Flood Risk Manag. 2024, 18, e13045. [Google Scholar] [CrossRef]
- Vallas, S.; Schor, J.B. What do platforms do? Understanding the gig economy. Annu. Rev. Sociol. 2020, 46, 273–294. [Google Scholar] [CrossRef]
- Tsolaki, K.; Vafeiadis, T.; Nizamis, A.; Ioannidis, D.; Tzovaras, D. Utilizing machine learning on freight transportation and logistics applications: A review. ICT Express 2023, 9, 284–295. [Google Scholar] [CrossRef]
- Bemposta Rosende, S.; Ghisler, S.; Fernández-Andrés, J.; Sánchez-Soriano, J. Implementation of an Edge-Computing Vision System on Reduced-Board Computers Embedded in UAVs for Intelligent Traffic Management. Drones 2023, 7, 682. [Google Scholar] [CrossRef]
- Rosende, S.B.; Fernandez-Andres, J.; Sanchez-Soriano, J. Optimization Algorithm to Reduce Training Time for Deep Learning Computer Vision Algorithms Using Large Image Datasets With Tiny Objects. IEEE Access 2023, 11, 104593–104605. [Google Scholar] [CrossRef]
- Google Maps Platform Documentation | Google for Developers. Available online: https://developers.google.com/maps/documentation (accessed on 23 November 2024).
- Documentation—Leaflet—A JavaScript Library for Interactive Maps. Available online: https://leafletjs.com/reference.html (accessed on 23 November 2024).
- Mapbox Docs. Available online: https://docs.mapbox.com/ (accessed on 23 November 2024).
| Disclaimer/Publisher’s Note: The statements, opinions and data contained in all publications are solely those of the individual author(s) and contributor(s) and not of MDPI and/or the editor(s). MDPI and/or the editor(s) disclaim responsibility for any injury to people or property resulting from any ideas, methods, instructions or products referred to in the content. |
© 2025 by the authors. Licensee MDPI, Basel, Switzerland. This article is an open access article distributed under the terms and conditions of the Creative Commons Attribution (CC BY) license (https://creativecommons.org/licenses/by/4.0/).


