1. Introduction
Industry 4.0 is changing the manner in which industrial processes are designed, monitored and optimized [
1]. In this context, the reliability of electromechanical systems and their components, such as electric motors, gearboxes, shafts, pumps, and couplings, among others, has become a relevant concern [
2], since unexpected faults can lead to unplanned downtime, production losses and increased maintenance costs. To face this challenge, modern condition monitoring approaches are developed and based on the use of advanced data acquisition systems [
3] that may include different physical magnitudes such as acoustic [
4,
5], vibration [
6,
7], electrical [
8,
9], thermographic [
10,
11] and/or multi-sensor [
12,
13] information. Moreover, recent advances have proven that these data sources enable more accurate and scalable fault diagnosis when combined with artificial intelligence and machine/deep learning techniques (ML, DL) [
14]. Nevertheless, achieving reliable fault detection and classification in such systems remains a challenging task, mainly due to the complexity of signals, the variability of operating conditions, and the need for robust models capable of generalizing across different scenarios [
15].
The above-mentioned physical magnitudes represent feasible tools to be used in the condition assessment of induction motors (IMs) and gearboxes (GBs). In fact, vibration-based fault diagnosis is the most well-known and widely used strategy for this purpose [
16,
17,
18], even for assessing any rotating machine. However, the installation of accelerometers or vibration sensors is invasive and often impractical in systems with compact or intricate configurations, which complicates the mounting process. Furthermore, vibration sensors are primarily used as sensitive sensors in the monitoring of mechanical faults such as unbalance, misalignment, bearing defects, and broken rotor bars, while incipient gearbox wear or localized issues in complex assemblies may be less evident. Likewise, acoustic-based methods offer a non-invasive alternative [
19,
20,
21], as they use microphones and do not require prior installation; nevertheless, their accuracy is strongly affected by noisy environments. Electric-based methods can also be slightly invasive or non-invasive and are capable of detecting multiple faults [
22,
23,
24], but they are limited to punctual electrical issues or faults that introduce effects in electrical signatures; however, their robustness can decrease when the fault assessment is performed under variable load conditions. These limitations are often addressed by multi-input approaches, which correlate signals obtained from two or more sources [
25,
26,
27]. For instance, the fusion of vibrations and stator current signatures has been accepted as a reliable combination that leads to accurate diagnosis. Thus, such strategies can effectively compensate for the individual disadvantages of each method, leading to more reliable fault detection and diagnosis; however, they also increase implementation costs, computational requirements, and system complexity, which may restrict their practical applicability. Although these data sources are widely used in electromechanical fault detection, each sensing system presents specific limitations related to installation, noise sensitivity, or dependency on operating conditions. In this context, thermographic analysis through image processing has emerged as a valuable alternative, since it provides a non-invasive and global view of the thermal behavior of machines, which is directly linked to fault progression.
Infrared thermography (IRT) offers significant advantages for the early detection of faults, providing a non-invasive and real-time assessment of temperature variations in electromechanical systems. Since IRT is commonly represented through images, deep learning (DL) networks have enabled the development of numerous studies leveraging this type of sensing [
28,
29]. In fact, numerous approaches usually focus on the numerical calculation of statistical features and textural characteristics; for instance, in [
30], statistical and GLCM features are extracted from thermal images, the most relevant ones are selected using SVM-RFE, and faults are classified with SVM and
k-NN; this approach relies exclusively on numerical statistical and GLCM features extracted from the thermal images, without explicitly considering the spatial distribution of heat or visual patterns of thermal anomalies within the image. On the other hand, some studies perform the selection of the region of interest (ROI) through specific coordinates or manual cropping [
31,
32,
33], but this task is a critical issue that complicates end-to-end automation. Some research proposes thermal image-based fault diagnosis for single-phase IMs and transformers using semantic segmentation and CNNs [
34]. Accordingly, fault regions are automatically segmented, and multiple CNN models classify the images, achieving very high accuracy. However, the main disadvantage is the high computational cost and the requirement of large, labeled datasets to train the segmentation and classification models. Despite the advances in thermal image-based fault diagnosis, current approaches still face challenges in real-world applications. Manual or coordinate-based ROI selection complicates end-to-end automation, while statistical feature-based methods may miss subtle spatial patterns of heat. Meanwhile, CNN-based approaches capture complex patterns but require labeled datasets and high computational costs. Additionally, infrared thermography is sensitive to environmental conditions and load variations, which can affect reliability [
35]. These limitations highlight the need for robust, efficient, and interpretable fault detection methods.
Finally, regarding new research areas and recent studies, condition monitoring and fault diagnosis demand developing models capable of generalizing across diverse operating conditions, especially when thermal patterns or machine conditions differ from those observed during training. In this sense, domain adaptation techniques based on maximum classifier discrepancy and deep feature alignment have shown great potential for improving diagnostic robustness in such scenarios by learning domain-invariant and discriminative representations under changing distributions [
36]. Likewise, advances in end-to-end deep learning architectures in other complex real-world applications—such as contextual speech recognition—demonstrate how task-adapted feature extraction and built-in encoder–decoder mechanisms can significantly improve performance even in noisy or resource-constrained environments [
37]. These findings reinforce the need for approaches that directly learn relevant features from raw data, while maintaining generalizability in practical Industry 4.0 scenarios, which motivates the development of the end-to-end CNN framework proposed in this work.
Therefore, to address these challenges, this work proposes a novel end-to-end approach for fault detection and classification in electromechanical systems by means of processing infrared thermography images. The main contributions of the present study include the following:
- i.
A fully automatic preprocessing phase that segments regions containing Relevant Heat Areas (RHA), providing numerical, visual, and geometric descriptors of the heating patterns associated with each fault condition, including random noise reduction filtering.
- ii.
Data augmentation that enhances the realism of the training set, with the main novelty being the inclusion of noisy data augmentation to reinforce robustness under adverse thermographic acquisition conditions.
- iii.
A convolutional neural network focused on extracting local and global features, leveraging both the heat patterns and the geometric distribution of the RHA.
Moreover, this approach bridges the gap between traditional statistical methods and complex DL models, providing an interpretable and scalable solution for reliable fault detection. Test results demonstrated a global accuracy of 99.7%. Robustness tests validated the functionality of the proposed method under different simulated distortion conditions.
2. Materials and Methods
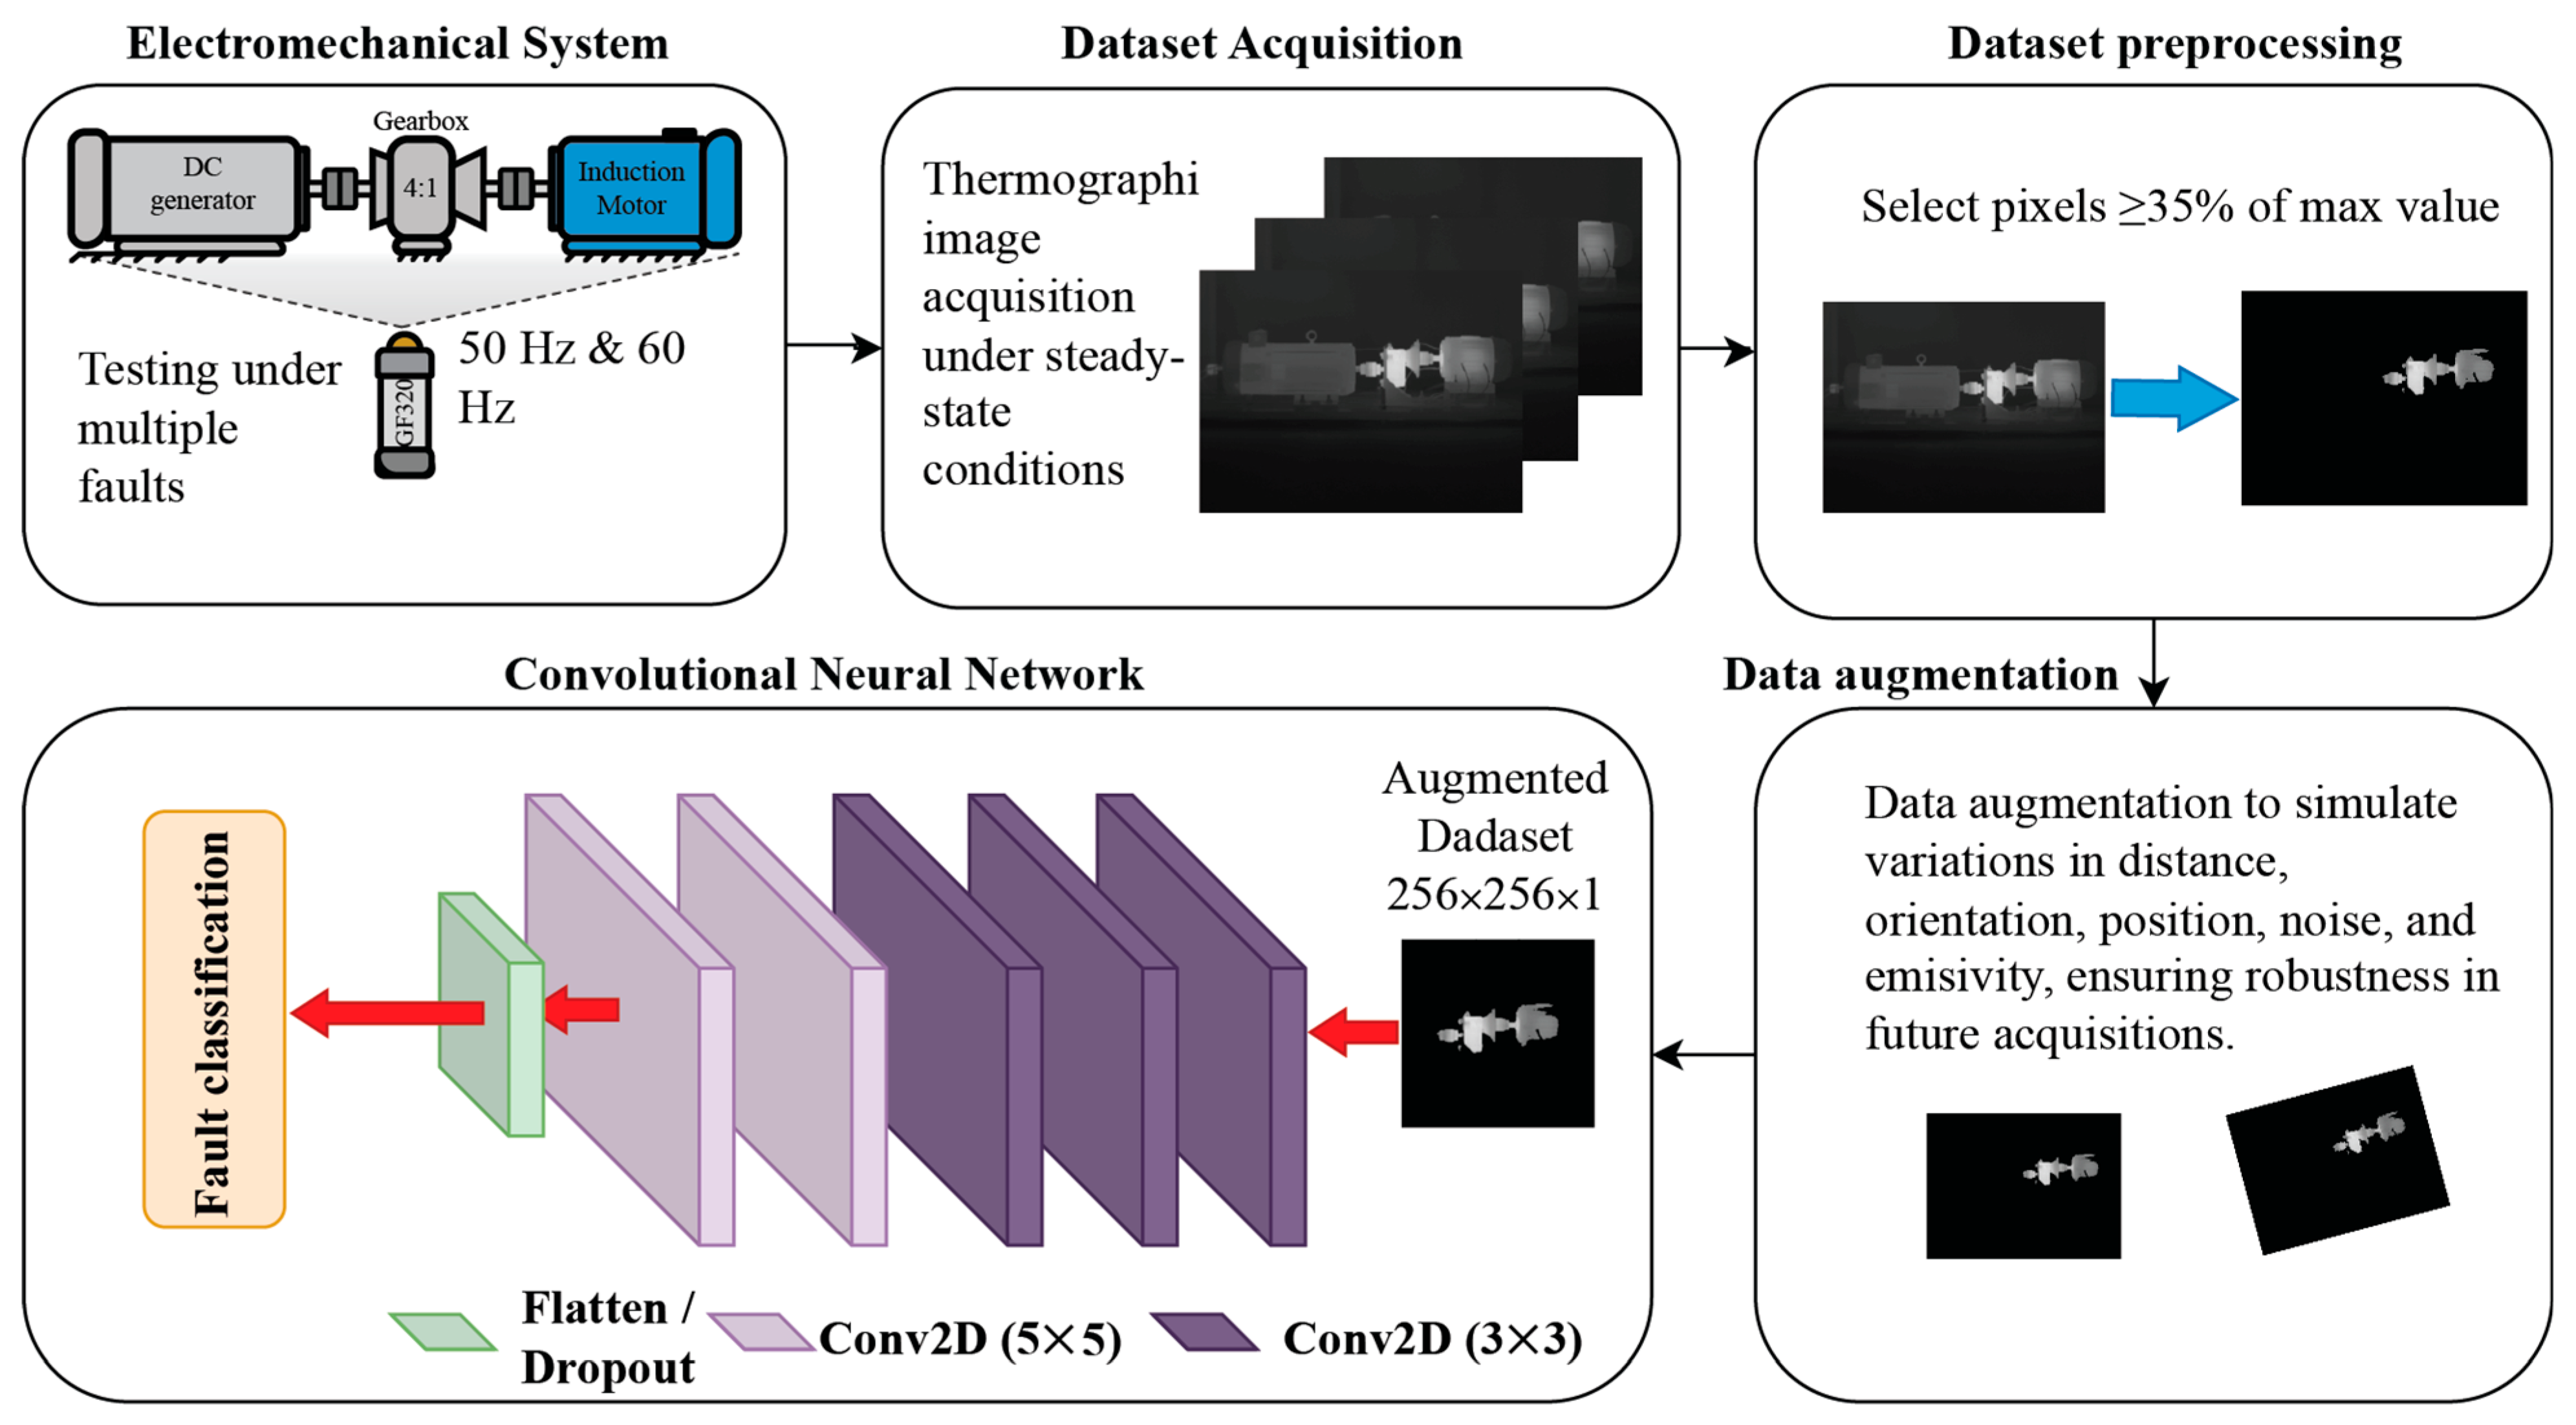
The methodology proposed in this work consists of five main stages that integrate the electromechanical system, dataset acquisition, dataset preprocessing, data augmentation, and DL-based classification.
Figure 1 shows the structure of the present approach.
2.1. Electromechanical System
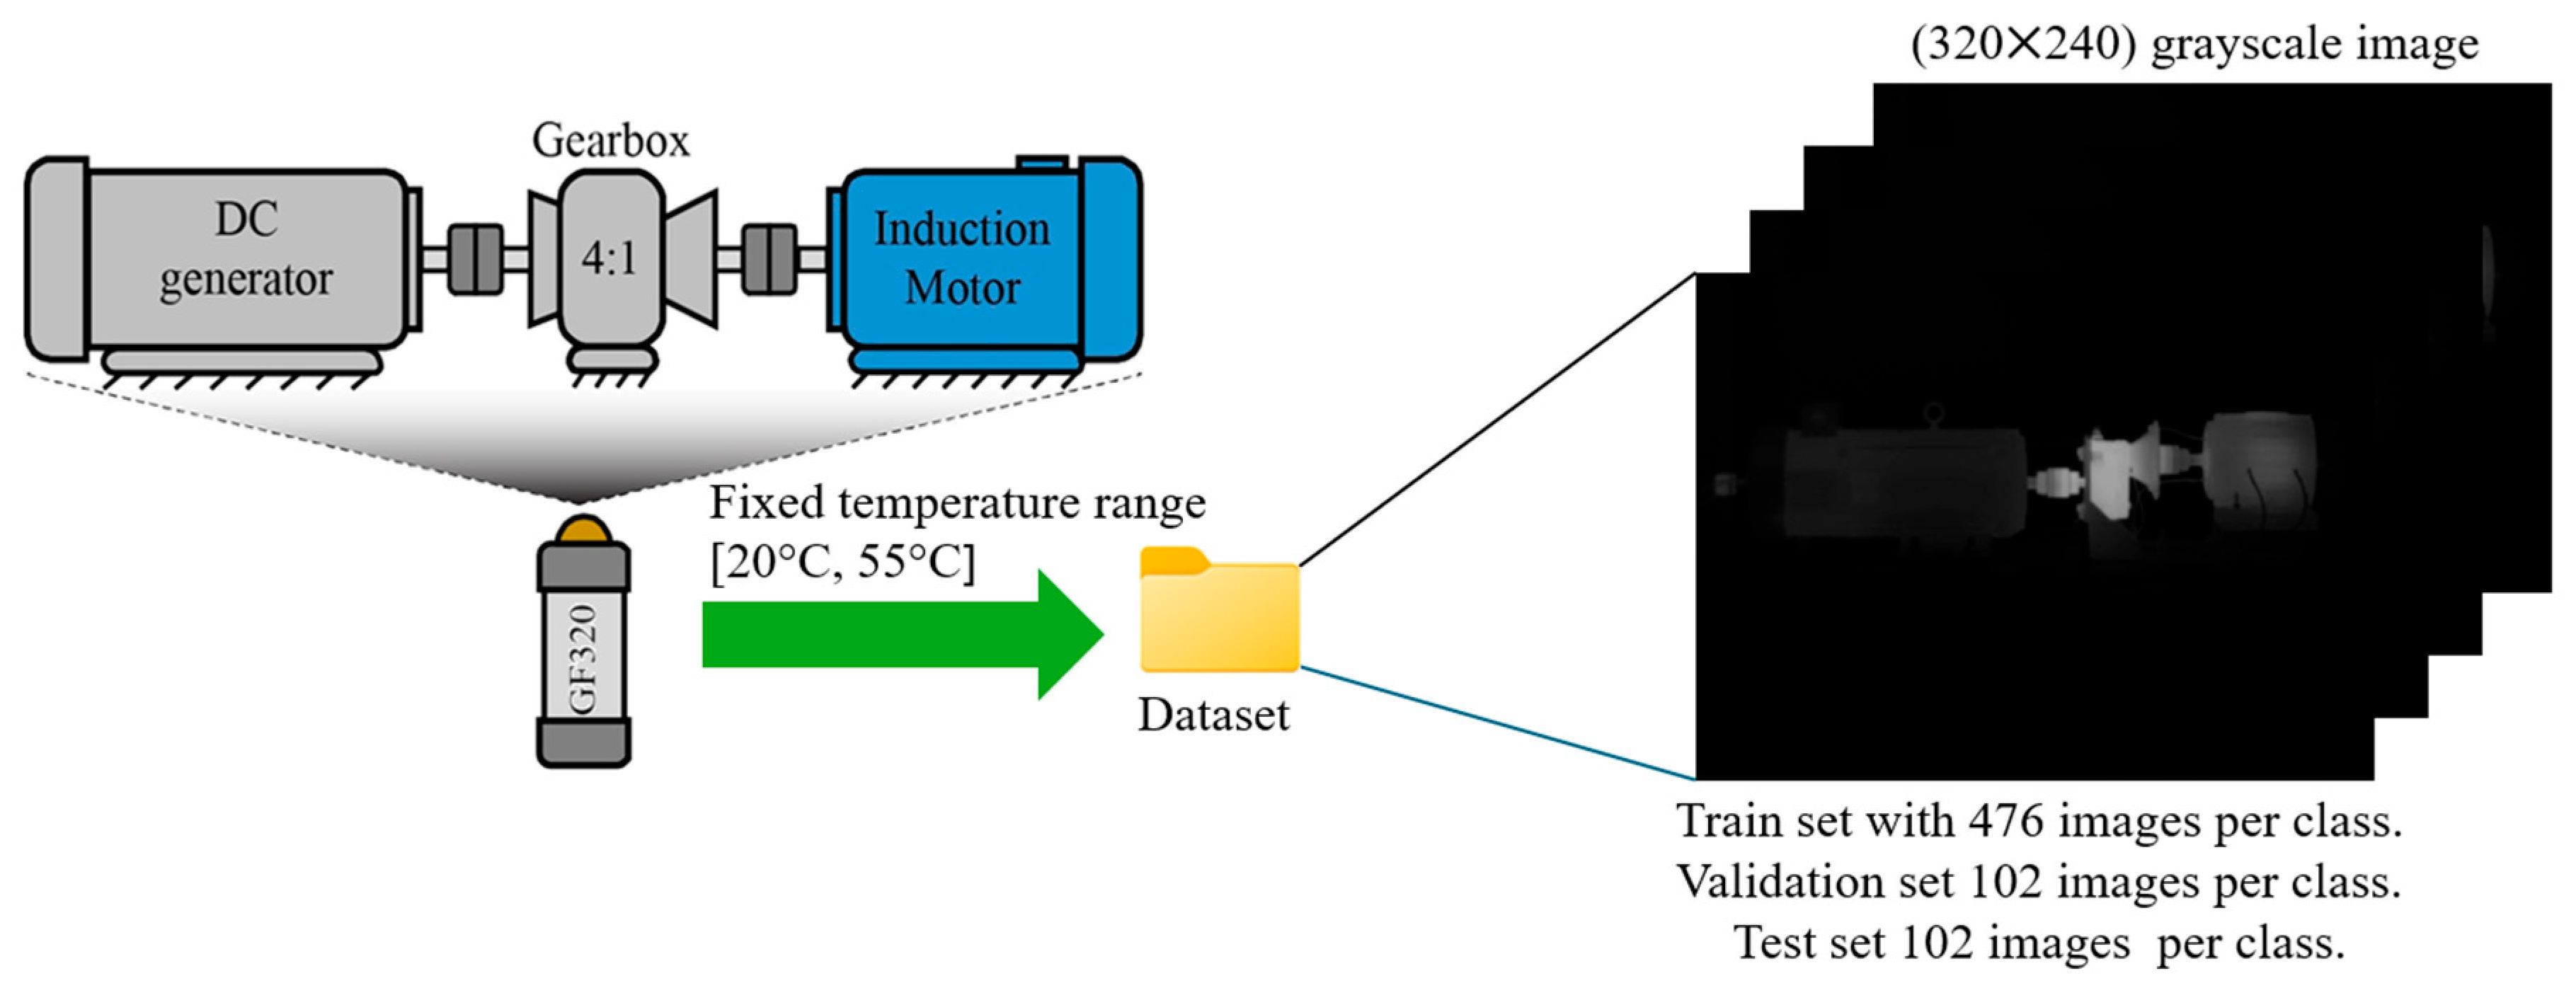
The present work focuses on evaluating and classifying different conditions in an electromechanical system (ES). The ES is a self-designed system used for laboratory tests. It consists of a three-phase 220 VAC 1.49 kW induction motor (IM) manufactured by WEG Electric Corporation, Houston, TX, USA (manufactured part 00236ET3E145T-W22), a 4:1 gearbox (GB), and a DC generator, as shown in
Figure 2. These elements (IM, GB, and DC generator) are shaft-to-shaft linked through rigid couplings. In this regard, two cases are considered: The first case includes different faults induced in the IM, which include bearing defects (BD), half-broken rotor bar (1⁄2BRB), fully (one) broken rotor bars (1BRB), unbalance (UNB), and misalignment (MIS). The second case focuses on detecting four levels of uniform wear in the gearbox: 0%, 25%, 50%, and 75% (HLT, GB25, GB50 and GB75). Each condition is tested individually under two operating frequencies (50 Hz and 60 Hz) provided by a variable frequency drive (VFD) producing average rotating speeds in the IM of about 2985 rpm and 3590 rpm, respectively.
2.2. Dataset Acquisition
Data acquisition is performed using an IR camera (FLIR GF320, FLIR Systems, Inc., Wilsonville, OR, USA) positioned in front of the ES to capture its emitted infrared spectrum; the IR camera is placed at the center of the ES, and the distance between the ES and the camera is approximately 1.5 m. During each experimental test, the camera is configured to record thermal images from start-up to the thermal steady state of the ES, capturing 5 images per minute over 100 min of continuous operation. Although transient thermal images were also collected, this study focuses exclusively on images corresponding to the thermal steady state. After removing unusable data that belonged to the thermal transient state, a total of 340 valid thermal images were obtained for each tested condition and operating frequency. The thermal images are acquired as 8-bit grayscale with a resolution of 320 × 240 pixels, where the pixel intensity scale [0, 255] represents the emitted infrared spectrum. Also, the grayscale acquisition is normalized to measure a temperature range of +20 °C to +50 °C.
Figure 2 also presents a general representation of the data acquisition process.
For dataset construction, images from each condition and frequency were organized into training, validation, and test sets. A split of 70% for training, 15% for validation, and 15% for testing is taken into account; hence, IR images are randomly assigned for training, validation and testing. Afterward, conditions at 50 Hz and 60 Hz are merged into a single class with a total of 680 images (i.e., GB25 at both frequencies combined into one class); this step is performed to prevent frequency bias within individual classes. As a result, the final datasets for each tested condition consist of 476 images for training and 102 images for validation and testing; this data segregation allows us to ensure a balanced distribution across all classes and operating frequencies for robust model evaluation.
2.3. Data Preprocessing
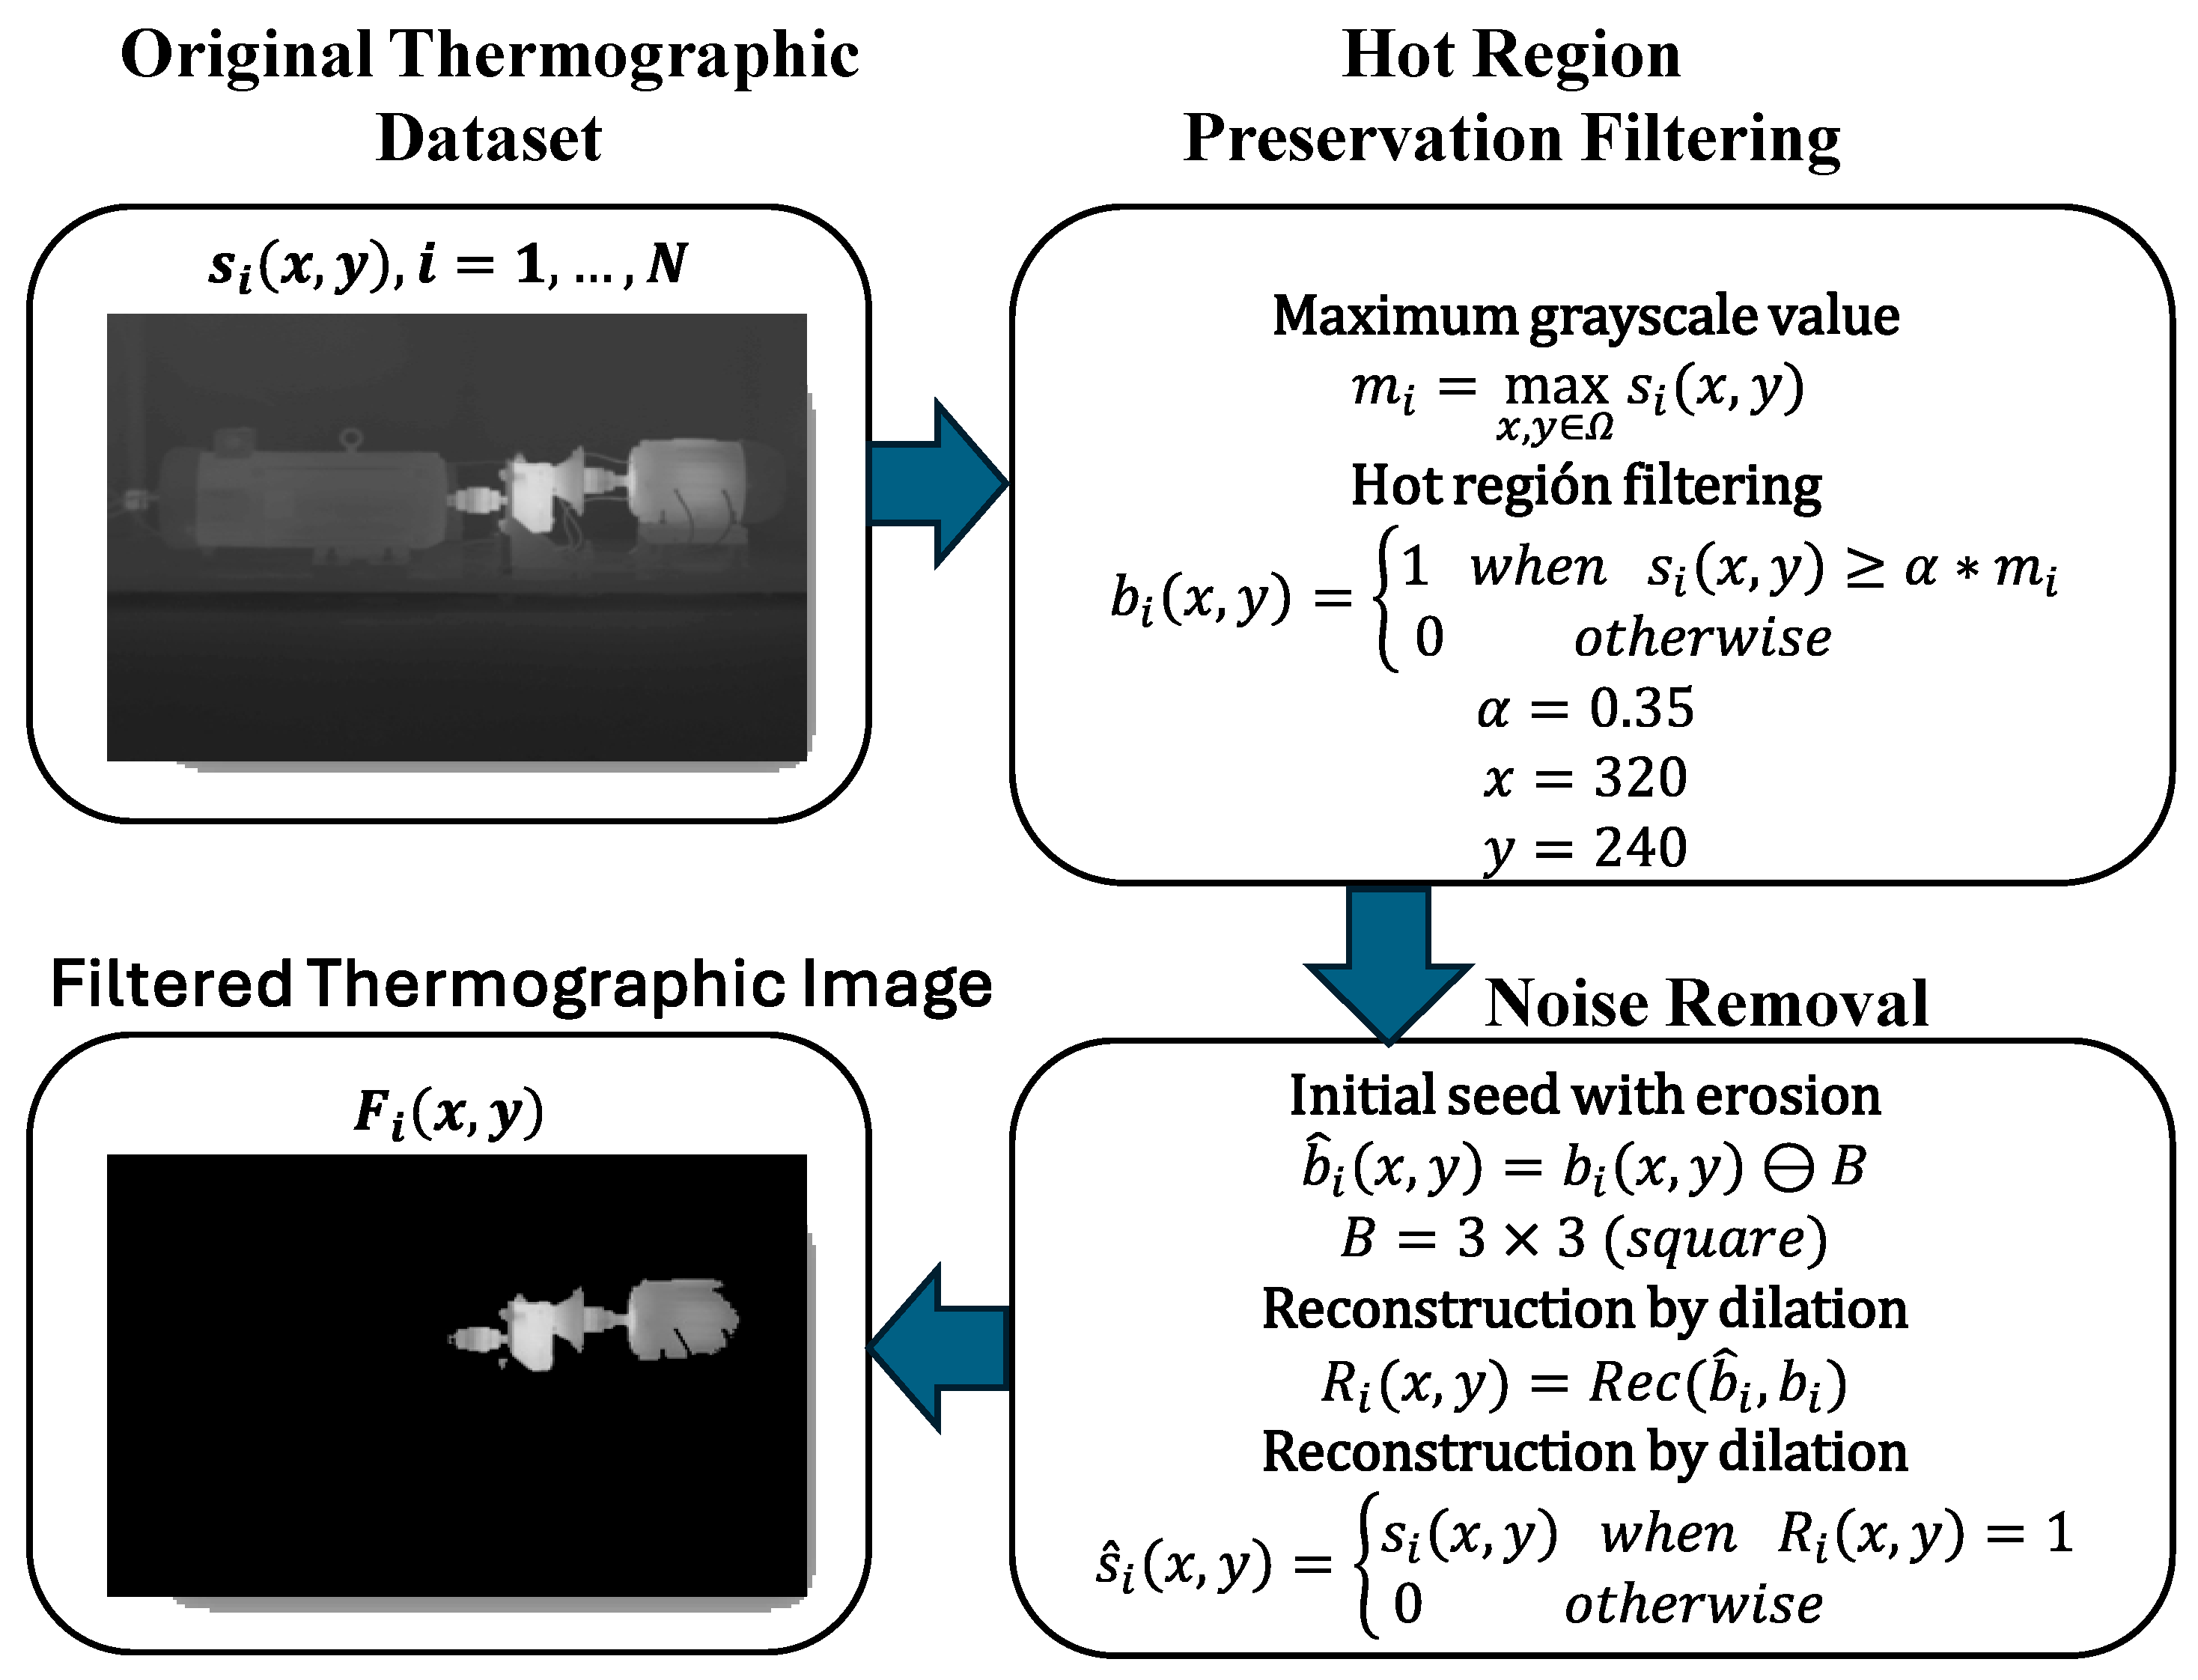
The proposed data preprocessing algorithm aims to generate output images that preserve only relevant heat areas (RHAs). Thus, this step removes low-temperature regions, allowing the training network to filter out irrelevant background information while simultaneously providing a visual representation of the heat distribution. The resulting heating patterns, characterized by their location, size, and shape, constitute novel features that enhance the distinction between classes. The overall preprocessing stage is illustrated in
Figure 3.
The process shown in
Figure 3 is applied to each sample in the dataset for each tested condition, including train, test, and validation folders. Each image is denoted as
, where
is the sample image in the dataset,
represents the image dimensions (
,
), and
indicates the index of the sample within the dataset (
). To each
, the operation defined in Equation (1) is applied. This operation identifies the maximum grayscale value in the image and uses it to normalize or set the reference intensity for each processed image.
where
is the maximum grayscale value of the
-th image, and
represents the set of all pixel coordinates in the image. Each single image contains a unique and specific
value. Based on these results, Equation (2) is applied.
where
is the resulting binary value at pixel
of the
-th image, and
is a threshold factor that determines the minimum fraction of the maximum grayscale value required for a pixel to be set to 1, thus identifying the RHA. As thermographic images are prone to noise, especially when the image acquisition system is of lower quality, a noise reduction phase is applied using binary morphological reconstruction. First, an initial seed is obtained by eroding the binary mask
, as expressed in Equation (3):
where
is the eroded binary mask (this will be used as a seed for the reconstruction), and
is a
square structuring element. Next, the binary mask is reconstructed by dilation, constrained by the original mask; this is expressed in Equation (4).
where
denotes the morphological reconstruction by dilation. This process restores the larger connected regions in the mask while eliminating small noisy components. Finally, the pixels in
that are set to 1 are replaced with the corresponding intensity values from the original image
, resulting in a cleaned image where the RHAs retain their original grayscale values; this operation is shown in Equation (5).
where
is the final output image that contains the original pixels from
. This provides an output that highlights the most relevant areas, which can be differentiated not only by temperature and heating patterns, but also by RHA size, shape, and location, as illustrated in
Figure 4. Specifically,
Figure 4a to
Figure 4f illustrate the outcome of the proposed preprocessing applied to one of the acquired thermal images for the conditions: HLT, ½ BRB, 1 BRB, MIS, UNB, and GB50, respectively. The obtained images show that the method not only segments the RHA effectively but also preserves their original grayscale values, thereby maintaining the thermal information useful for fault classification. Therefore, the final images highlight the spatial distribution, shape, and size of the RHAs, while also retaining their intensity variations, which reflect temperature differences. Each condition exhibits distinct heating patterns that provide discriminative features for fault identification, demonstrating that the preprocessing enhances both the clarity and the relevance of the data. By reducing irrelevant background information and emphasizing informative thermal regions, the proposed approach generates improved inputs that can enhance the training performance. Such enriched spatial and intensity features constitute valuable input parameters for training CNNs.
The proposed data processing is a key stage since it leads to preserving only RHAs; in this sense, the threshold factor was heuristically set to 0.35. This value defines the minimum fraction of the maximum temperature required for a pixel to be considered part of the Relevant Heating Area (RHA). The aim of setting is to discard low-intensity pixels corresponding to background or thermally irrelevant regions while retaining the main temperature gradients associated with heating patterns. A higher α value would cause an excessive reduction in thermal information, eliminating meaningful heating zones that may represent incipient anomalies or relevant local heat conduction patterns. Conversely, lower values would include a larger portion of the background, thereby reducing the discriminative power of the RHA and introducing noise. Although the selection of 0.35 was arbitrary, it was guided by the objective of preserving sufficient information from the heating patterns rather than performing overly aggressive background suppression, ensuring that the preprocessed images capture the essential thermal features relevant for fault classification.
2.4. Data Augmentation
As can be inferred, thermographic images are relatively simple grayscale representations; consequently, models trained on such data are prone to overfitting, which is why state-of-the-art approaches often incorporate data augmentation. In this context, the present work introduces a set of augmentation functions designed not only to replicate realistic data acquisition conditions but also to prevent the model from memorizing the background, which is consistently assumed to be zero across the training, validation, and test images.
To address the limitations of thermographic images and reduce the risk of overfitting, a set of data augmentation strategies was implemented. In addition to geometric transformations such as small rotations (±15°), translations (10% in width and height), and zoom variations (±15%), brightness adjustments within the range of 0.85–1.15 were also applied to replicate changes in illumination that may occur during data acquisition. Furthermore, a custom noise augmentation function was introduced, which combines Gaussian noise () with salt-and-pepper noise affecting approximately 10% of the pixels. This aims to mimic sensor noise and acquisition artifacts commonly present in low-quality thermographic cameras, while also preventing the model from relying solely on a homogeneous background, which is consistently zero in the training, validation, and test datasets. Unlike typical augmentation, the inclusion of controlled noise injection explicitly addresses the characteristics of thermographic acquisition, ensuring robustness under both realistic and non-realistic perturbation scenarios. Together, these augmentations enhance the variability and realism of the training data, promoting better generalization of the model.
2.5. CNN Architecture and Implementation
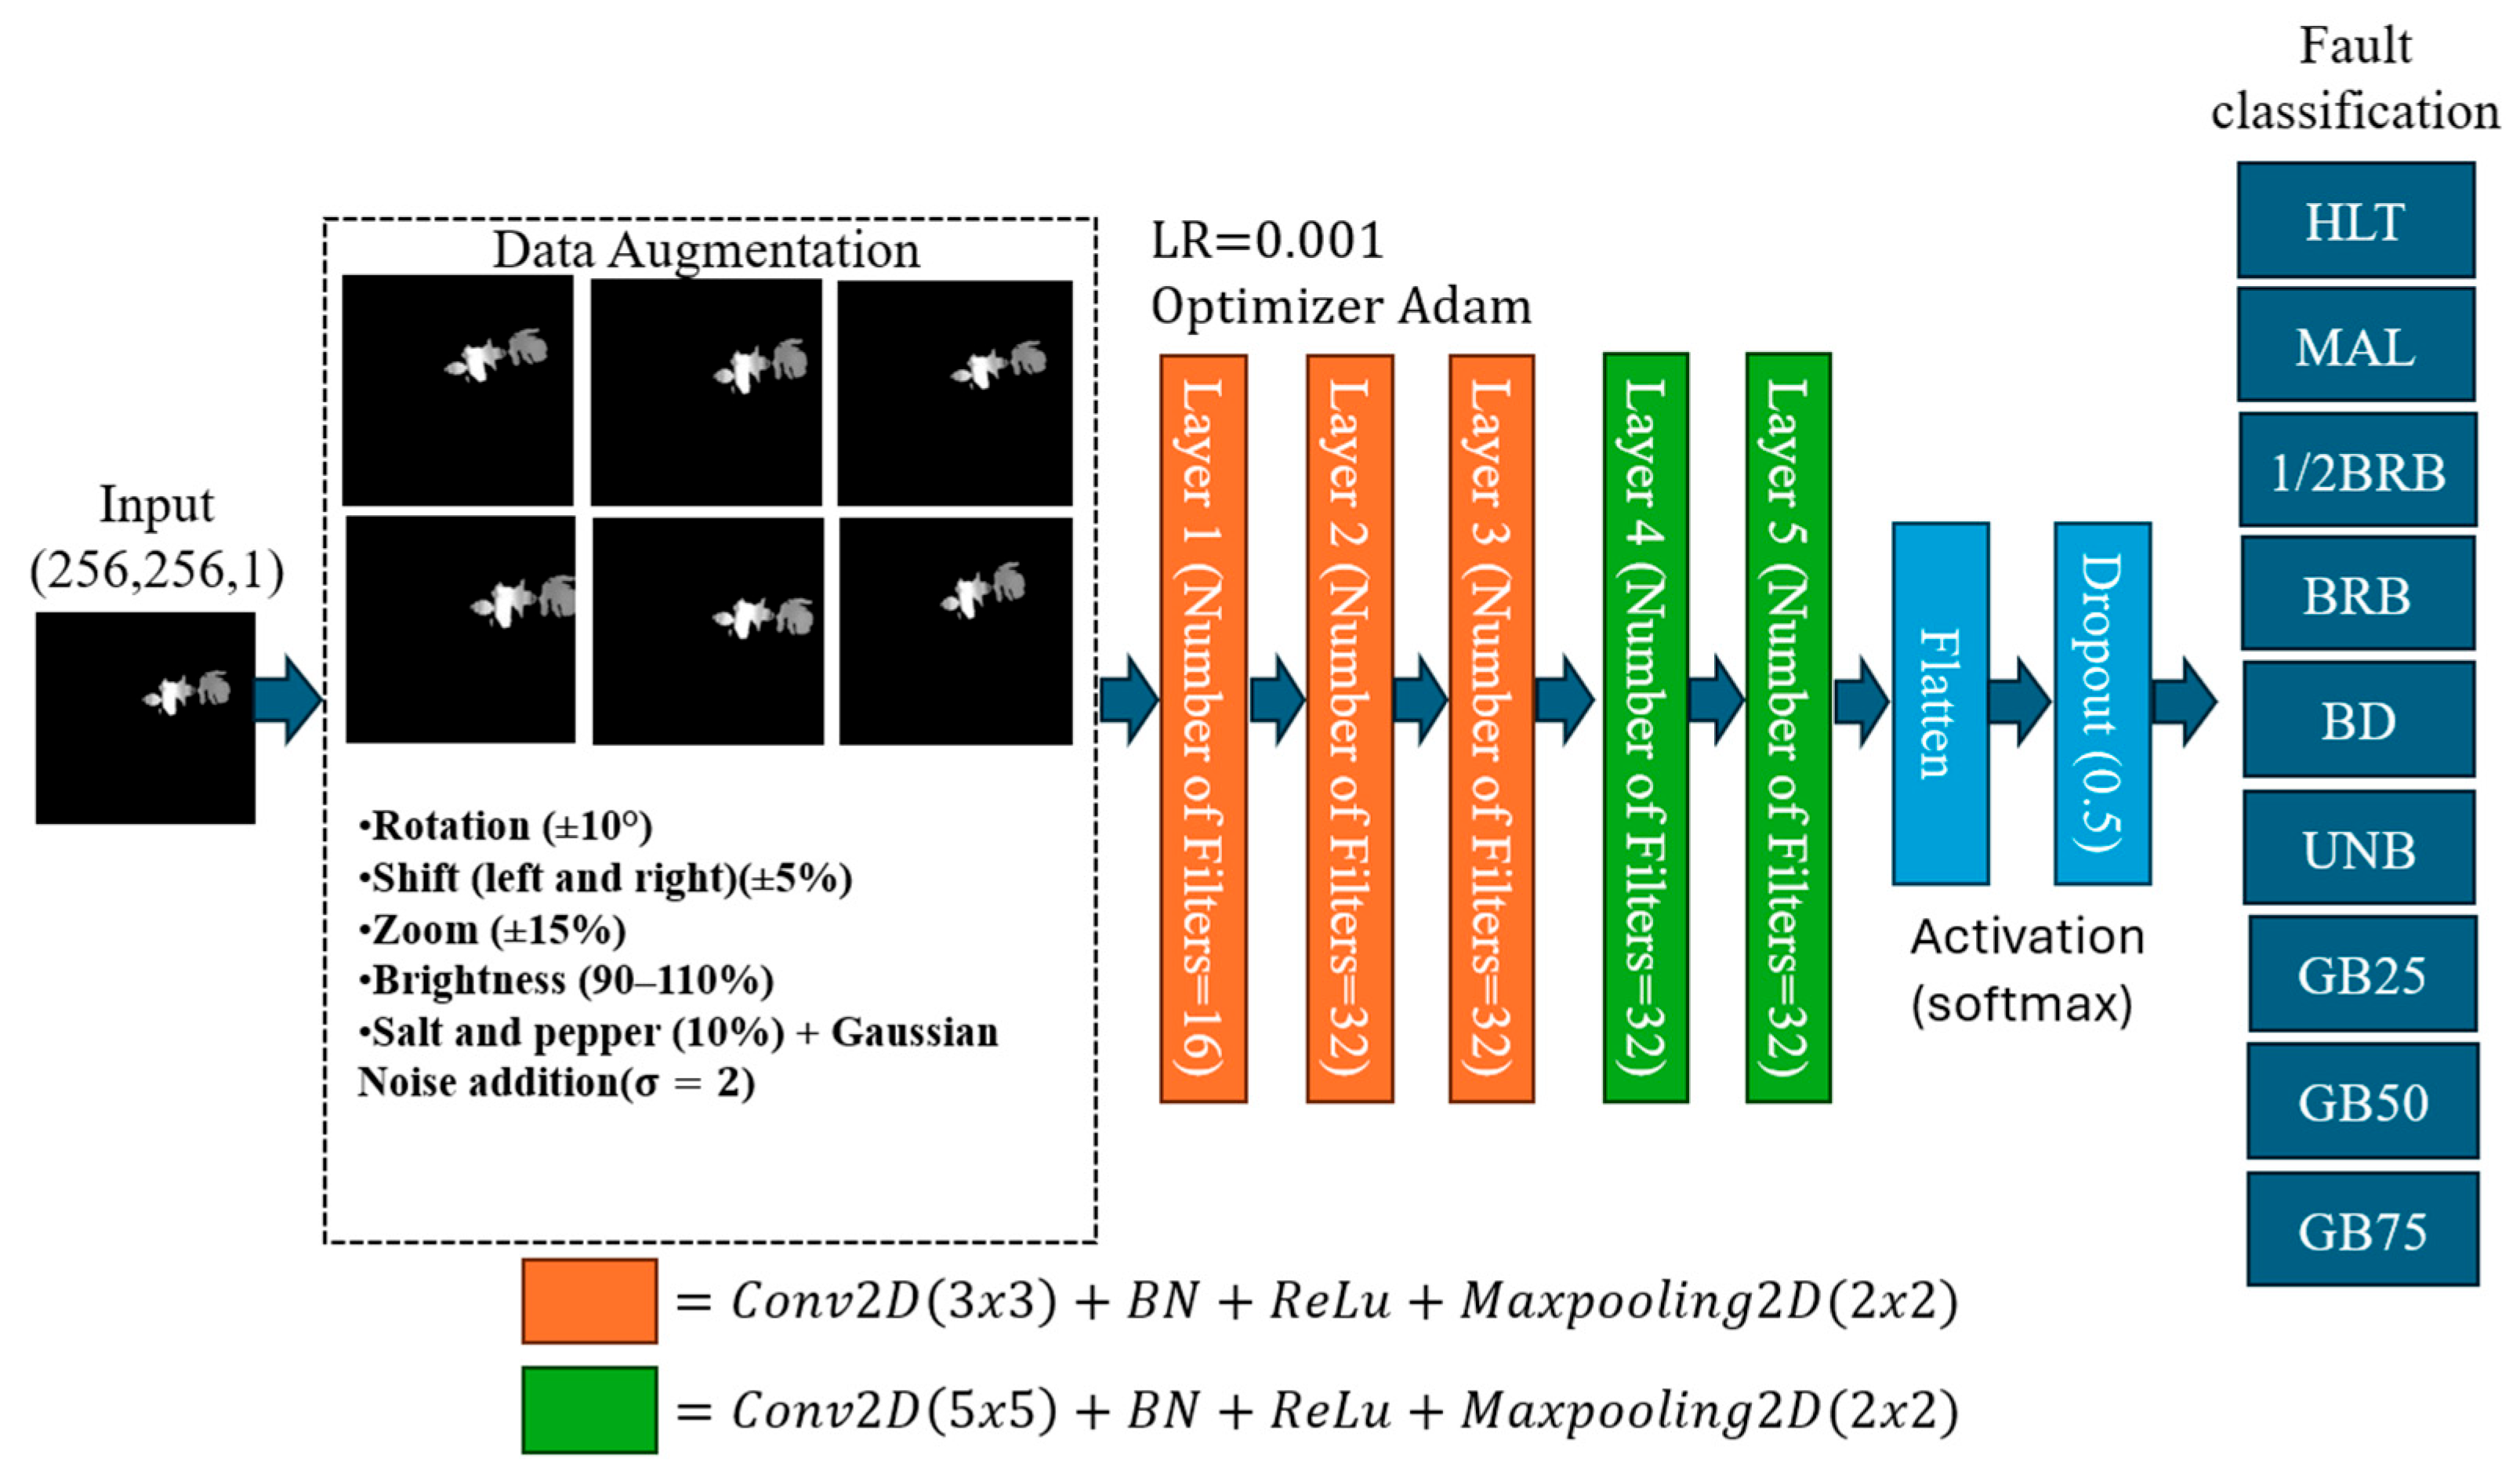
The proposed architecture for the training process is shown in
Figure 5. It is based on a CNN, where the augmented dataset is used as the input for model training; the CNN is designed to progressively learn hierarchical features through a sequence of convolutional layers with 3 × 3 and 5 × 5 kernels, batch normalization, ReLU activation, and max-pooling operations. This progression enables the model to capture pixel-level intensity patterns, fine thermal textures, and the global geometry of hot regions, thereby enhancing fault classification performance.
As observed in
Figure 5, the input data is used without normalization (grayscale kept in [0, 255]), avoiding the loss of contrast between high- and low-temperature regions. The process goes through the augmentation pipeline to prepare the training set. The CNN is then structured in two phases/stages:
Stage 1 (local feature extraction): Three layers configured as , with 16 filters in the first layer and 32 filters in the subsequent ones. This block extracts local, pixel-level intensity features characterizing the distribution of RHAs.
Stage 2 (global feature extraction): Two layers configured as , with 32 filters each. This block captures higher-level information such as the shape, size, and global distribution of RHAs, while reducing sensitivity to pixel-level distortions.
Finally, a Flatten layer vectorizes the feature maps into a 1D array that integrates local and global descriptors. A dropout layer () is applied before the output stage to reduce overfitting caused not only by the limited dataset size but also by the high variability introduced during augmentation. The number of filters is intentionally kept constant to balance representational power with computational efficiency, considering the relatively low complexity of thermographic images.
In regard to its implementation, during the training of the proposed structure, the Adam optimizer is used with a learning rate of 0.001 and a batch size of 12; the training process is run for 30 epochs. All experiments are conducted on a workstation running Windows 11, equipped with an Intel Core i7-12700H 12th gen (4.7 GHz) and an NVIDIA GeForce RTX 4060 GPU, and the image processing is configured to be performed with the GPU using the TensorFlow-GPU 2.10 package.
3. Test and Results
To evaluate the performance of the proposed method, several experiments are conducted using the test dataset described in
Section 2.2. The evaluation focuses on the fault classification accuracy across the nine conditions that are tested in the IM and GB of the ES (HLT, BD, ½ BRB, 1 BRB, MIS, UNB, GB25, GB50, and GB75). Hence, the performance is evaluated through confusion matrices, as well as quantitative metrics such as global accuracy (GA), precision, F1-score and recall. The confusion matrix in
Table 1 summarizes the individual classification ratios obtained without any noise perturbation applied to the test images. As expected, the model demonstrates high discriminative ability, with the majority of samples being correctly classified in their respective categories, obtaining a GA = 99.78%. Although the misclassification between faulty conditions is also achieved, this issue is not critical since it can be considered as a false positive that can be confirmed by technicians through inspection.
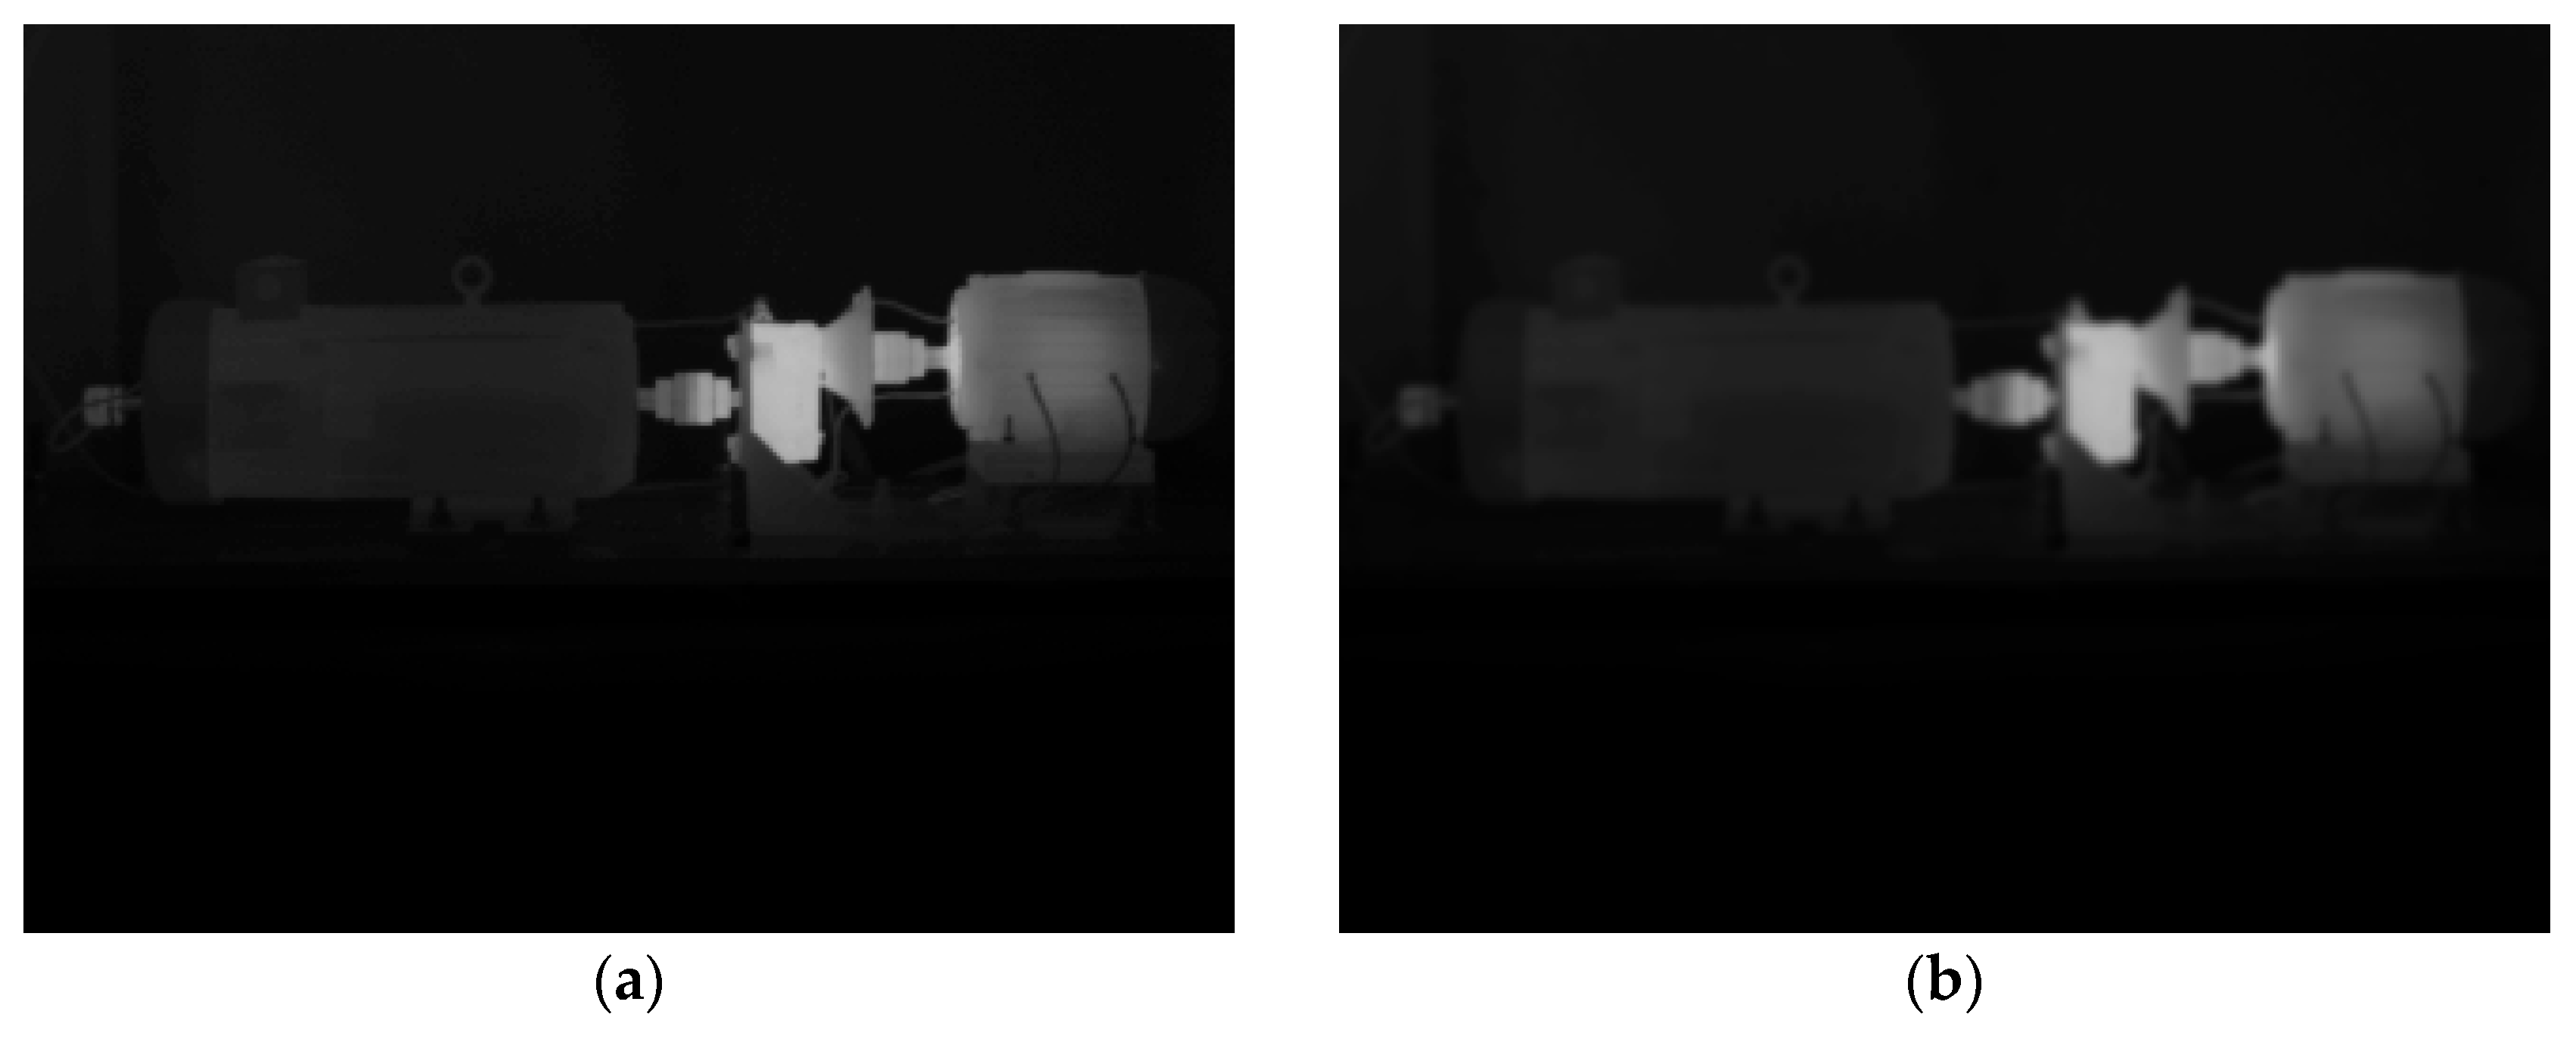
To further analyze robustness, two different noise perturbations are applied to test images, Gaussian blur and additive Gaussian noise, and the performance of the model is evaluated under these conditions. As stated, these filters are chosen because they simulate real-world degradations commonly present in infrared imaging, such as resolution loss, motion blur, and thermal or electronic noise [
38], allowing a more realistic assessment of the model’s ability to handle imperfect or noisy images. The formulas that denote the Gaussian blur are expressed in Equations (6) and (7).
where
denotes the
n-th image from the unprocessed dataset, with spatial coordinates
. The Gaussian kernel
is defined by the standard deviation
, which controls the amount of blur, and the kernel size is determined by the parameter
. In this work,
is not manually tuned; instead, it is set according to the automatic configuration of the Python (version 3.10) implementation used, ensuring reproducibility of the results. Accordingly,
Figure 6a,b show a sample image in its original format and the corresponding filtered image with
, respectively. As observed, the filtered image presents a clear degradation in terms of image quality in contrast with the original image; thus, it can be expected that the addition of noise may affect the performance of the model if it lacks robustness.
Accordingly, once the test images are filtered using the factors
and
, which emulate different levels of defocus during image acquisition, the proposed methodology is then applied to these perturbed datasets; hence, the corresponding results achieved by the proposed model are presented in
Table 2 and
Table 3, respectively. Certainly,
Table 2 shows the confusion matrix with the individual classification for each assessed condition; although the test images are filtered by using
, the classifier achieves near-perfect recognition across all categories with GA = 99.24%. Some samples are also misclassified, but only minor confusion is observed in a single sample between the GB50 and UNB conditions, as well as six samples between BRB and ½ BRB. In contrast, the confusion matrix summarized in
Table 3, with
, reveals a degradation in performance, particularly for the GB25 condition, which exhibits 43 misclassifications as MIS. These results indicate that while the method remains robust under moderate blur, higher levels of filtering reduce the discriminative features of specific classes, especially GB25, yet accurate classification is preserved for the remaining categories, leading to GA = 95.21%.
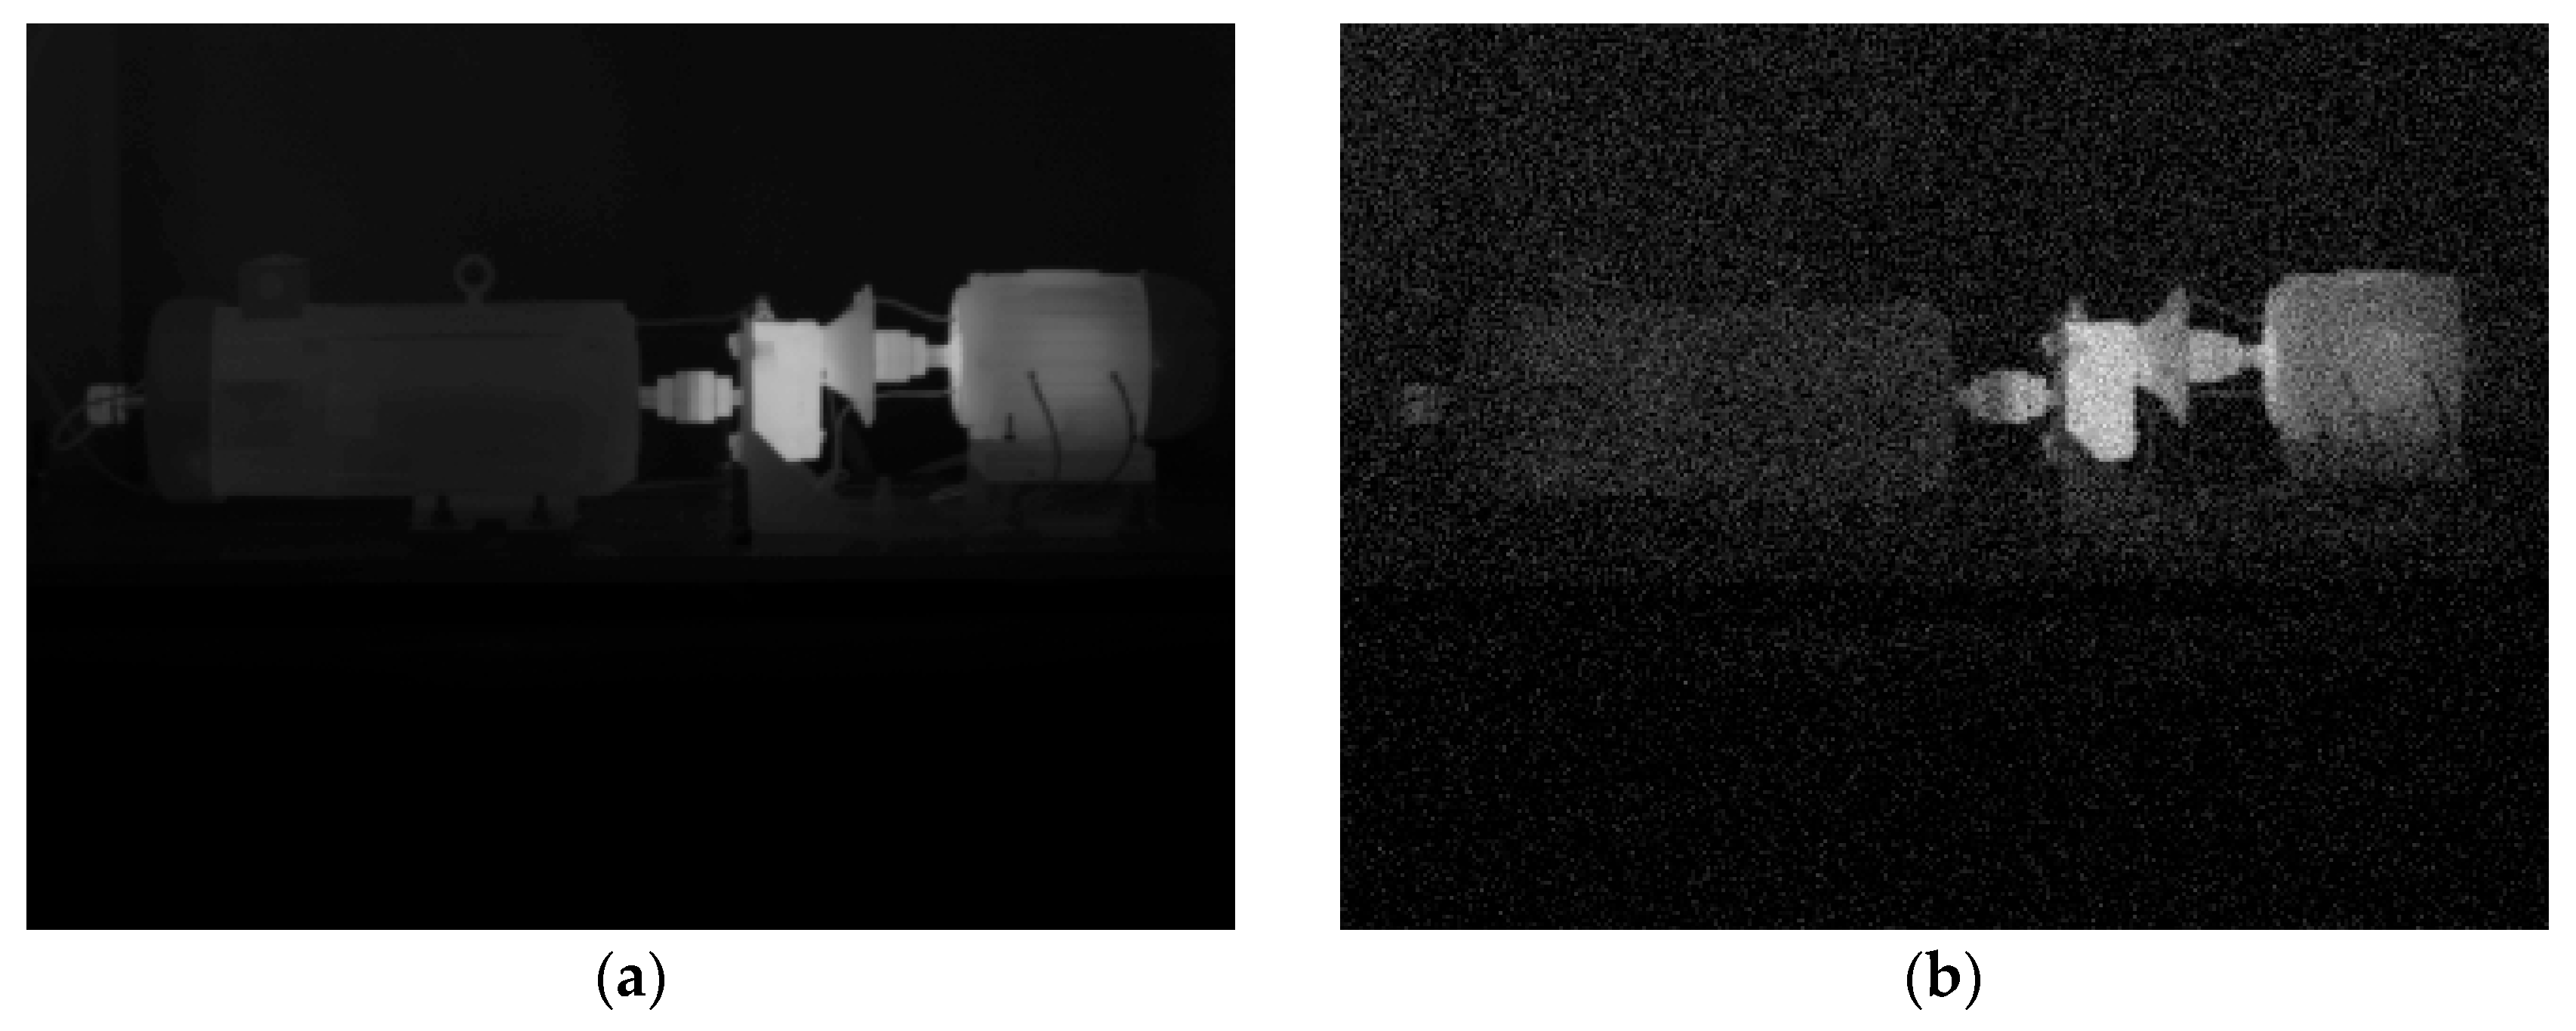
Moreover, to further assess the robustness of the proposed method, additive Gaussian noise is also applied to the test images. Unlike Gaussian blur, which models defocusing, this perturbation represents sensor noise or environmental interference during image acquisition. From a viewpoint of real-world applications in the industry, the acquisition of thermal images is often exposed to multiple factors that affect signal quality, such as the presence of dust, oil vapor, mechanical vibrations, or changes in ambient conditions. These elements introduce random disturbances into the images, manifested as variations in pixel intensity, very similar to the behavior of additive Gaussian noise. These disturbances can originate from infrared camera limitations, electronic interference, or variations in surface emissivity during operation. For this reason, incorporating controlled Gaussian noise leads to a more realistic reproduction of adverse field conditions. From a condition-monitoring perspective, this strategy increases the robustness of the proposed model and ensures reliable performance even when the data comes from noisy and imperfect scenarios typical of Industry 4.0. The mathematical formulation of the additive Gaussian noise is provided in Equations (8) and (9).
where
represents the original image intensity at spatial coordinates
, and
is a random variable drawn from a Gaussian distribution with mean
and variance
. The resulting image
simulates the effect of sensor noise or environmental disturbances, allowing the evaluation of the method’s robustness under realistic acquisition conditions.
Figure 7a,b illustrate an original thermal image from the test data and its corresponding filtered image using
and
, which simulate aggressive noise combined with emissivity variation.
Consequently, the test images are filtered using three conditions:
and
which represent low- to medium-noise conditions;
and
, representing medium- to high-noise conditions; and
and
to simulate aggressive adverse conditions. These conditions reflect typical adverse scenarios encountered during thermal inspections of electromechanical systems in industrial assets. Hence, the proposed method is then applied to these perturbed test data, and the corresponding results are presented in
Table 4,
Table 5 and
Table 6. Certainly,
Table 4 shows the confusion matrix obtained with
and
, where the classifier achieves high recognition accuracy across all assessed conditions with GA = 98.15%, with only minor confusions as observed in a single GB50 sample misclassified as ½ BRB, eight misclassified samples between UNB and 1 BRB, and eight wrongly classified samples between the MIS and UNB conditions. Although misclassified samples are present, there exists a relationship between the involved conditions; that is, the observed confusion between conditions such as ½ BRB, 1BRB, MIS and UNB can be attributed to the fact that these faults tend to generate similar thermal and mechanical phenomena in the ES, specifically in the IM. Both UNB and MIS cause additional mechanical stresses that result in irregular heating patterns in the bearings and stator, while the presence of BRB modifies the current distribution and produces localized temperature increases in the rotor area. Due to this overlap in thermal manifestations, it is expected that the proposed model based on IR images will exhibit some degree of confusion between these categories, which reflects a more physical proximity between the failure mechanisms than a critical limitation of the method.
On the other hand, for
Table 5 with
and
, a notable degradation in performance leads to obtaining GA = 89.76%; specifically, the UNB condition is the most affected condition since twenty-nine samples are misclassified as MAL and nine samples are classified as GB75. The rest of the misclassified samples are between the conditions BD, ½ BRB, 1 BRB and GB50; these issues may be caused by similarities between patterns associated with the studied faults, as previously explained. Finally,
Table 6 with
and
reveals a more severe impact, achieving GA = 90.09%, where the BD and BRB classes present considerable misclassifications into other categories, highlighting a significant reduction in robustness under stronger noise conditions. These results demonstrate that while the proposed method maintains high accuracy under moderate additive Gaussian noise, its discriminative power progressively declines as the noise variance increases, particularly affecting classes with closer thermal patterns such as GB25, BD, and BRB. The results show that the proposed method preserves reliable classification under moderate distortions, while the expected degradation at higher perturbation levels mainly affects classes with closely related thermal patterns, yet overall robustness is maintained.
As a summary,
Table 7 shows the results achieved through different tests that demonstrate the robustness of the proposed method under varying levels of image perturbation. For the unaltered dataset, the model achieved near-perfect performance, with an accuracy of 99.78% and an F1-score of 1.00, confirming its effectiveness under ideal conditions. When additive Gaussian noise was introduced, the performance gradually decreased as the noise intensity increased: with
and
(low to medium noise), the model maintained high accuracy (98.15%) and F1-score (0.98), indicating resilience to minor sensor or environmental disturbances. Higher noise levels,
and
(medium to high) and
and
(aggressive), caused a more pronounced reduction in performance (accuracy ~90%, F1 ~0.90), yet the model still reliably classified most samples. For Gaussian blur, representing defocus effects during acquisition, the method achieved 99.24% accuracy for
and 95.21% for
, illustrating robustness to moderate blur but a sensitivity to stronger defocusing. Overall, these results confirm that the proposed method remains effective across a range of realistic adverse conditions commonly encountered in thermal inspections of electromechanical systems.
Therefore, to ensure the reliability of thermographic images in industrial environments, it is advisable to perform acquisition under controlled conditions that reduce the influence of external factors. These include a constant and known distance between the camera and the assessed machinery, proper calibration of the material’s emissivity, absence of air currents or vapors that alter infrared radiation, stable ambient lighting, and surfaces free of dust, grease, or dirt that could alter thermal reflectivity. These ideal conditions favor obtaining more consistent and representative measurements of the actual machinery conditions.
To further evaluate the efficiency and scalability of the proposed approach, a comparative study was conducted against representative deep learning architectures. The selected architectures include ResNet-18 [
39], VGG-16 [
40], and ResNet-50 [
41], all trained on the same dataset without applying the RHA preprocessing stage, but incorporating a standard data augmentation procedure to prevent overfitting. The applied augmentations consisted of small rotations (±15°), width and height shifts (10%), zoom variations (±15%), and brightness adjustments within the range of 0.85–1.15. The results, summarized in
Table 8, demonstrate that the proposed method achieved the highest accuracy (98.15%) and F1-score (0.98), confirming the discriminative advantage provided by the RHA extraction. In terms of computational efficiency, the training time (10.73 min) and prediction time (≈154 ms per image) remain competitive and suitable for real-time condition monitoring. The main limitation is the increased memory usage (≈2.2 GB), mainly attributed to the preservation of full-scale thermal intensity values and the use of dual-kernel convolutional blocks (3 × 3 and 5 × 5). Nonetheless, this design provides richer spatial and thermal information, justifying the higher memory requirement for industrial applications where diagnostic accuracy and interpretability are prioritized. Therefore, this confirms that the proposed approach is not only accurate and robust but also computationally efficient, supporting its potential deployment in Industry 4.0 scenarios where local, on-device fault evaluation is preferred to reduce latency and cloud dependency.
Additionally, a brief comparison with previous reported works in the state of the art is also performed in order to emphasize the contribution of the proposed end-to-end diagnosis method. Thus, by comparing the proposed method with other approaches in terms of global accuracy (GA), it is considered that studies that incorporate different preprocessing and learning strategies are most effective, specifically, methods that require a preprocessing stage with ROI selection and a CNN for training [
42], the combination of XGBoost and a fuzzy inference system (FIS) [
33] and the end-to-end approach that integrates a semantic segmentation preprocessing phase [
34]. The comparison is based on terms of GA values reported by the respective authors, as summarized in
Table 9.
From the comparison, it can be observed that the proposed method achieves the highest GA among the reviewed approaches. While the other methods report GA values ranging from 95% to 96.49%, the proposed approach demonstrates a significant improvement, reaching 99.7%. This improvement can be attributed to the preprocessing phase, which eliminates irrelevant background from the thermal images while preserving the Relevant Heating Areas (RHAs). This not only highlights the thermal patterns but also retains geometric information such as size, shape, and relative location of the heated zones, enhancing the input data for model training. Additionally, data augmentation, including the introduction of noisy data, prevents the model from memorizing the black background or specific patterns. The use of both 3 × 3 and 5 × 5 kernels further supports robust feature extraction: 3 × 3 kernels capture fine-grained, pixel-level details, while 5 × 5 kernels capture broader, spatial patterns. This combination allows the model to learn both local and global features without depending on a single scale of information.
5. Discussion
The results obtained in this work demonstrate that the proposed methodology achieves a classification performance comparable to or even superior to state-of-the-art approaches in infrared thermography-based fault diagnosis. While several existing studies rely on handcrafted features or manual selection of regions of interest, the present method provides a fully automatic, end-to-end pipeline that reduces preprocessing complexity while enhancing scalability and reproducibility. An important contribution of this study is the introduction of the Relevant Heating Area (RHA) preprocessing step, which not only eliminates irrelevant background information but also provides descriptors of the size, shape, and distribution of heat regions. These descriptors contribute to the interpretability of the model, offering a visual explanation of fault patterns that is often missing in deep learning approaches.
Robustness analysis further validated the applicability of the proposed method under realistic operating conditions. When subjected to Gaussian blur and additive Gaussian noise, the model maintained strong recognition performance under moderate perturbations, although some degradation was observed at higher noise levels, particularly for classes with closely related thermal patterns such as GB25. This behavior is expected, since adverse conditions inevitably reduce discriminative features in thermographic images; nevertheless, the method preserved high accuracy in most categories, confirming its resilience in practical scenarios. Moreover, it should also be considered that different faults tend to produce similar patterns that can be masked between them and produce a performance reduction.
The ablation study provides additional insights into the relative importance of the proposed components. Results revealed that the preprocessing stage plays the most critical role in preserving discriminative thermal patterns, while the combination of 3 × 3 and 5 × 5 kernels enhances the capture of both local and global features. The inclusion of noisy data augmentation proved beneficial in improving generalization, particularly under distorted image conditions. Together, these elements justify the design choices of the proposed architecture and highlight the added value of the integrated methodology.
Despite the promising results, some limitations must be acknowledged. The dataset used in this study was collected under controlled laboratory conditions, which may not fully replicate the variability encountered in industrial environments. Additionally, the fault conditions analyzed in this work represent a specific subset of common failures, and further research is required to extend the methodology to a broader range of fault scenarios, even combined faults in the same ES. Future work may explore the deployment of this approach in real-time monitoring systems and its implementation on edge devices, where the low computational complexity of the model could provide significant advantages. Moreover, combining thermographic data with other sensing modalities, such as vibration, stator currents, stray flux and/or acoustic signals, may enhance diagnostic robustness while preserving the interpretability benefits of the proposed preprocessing strategy.
