Abstract
With the increasing number of patients with Parkinson’s disease, the detection of Parkinson’s disease is crucial for the early intervention and treatment of this condition. The motor characteristics of Parkinson’s disease primarily include typical motor features. Flexible pressure sensor arrays, due to their unique mechanical properties and biocompatibility, have shown great potential for capturing movement characteristics. This research aims to develop a deep learning model based on foot pressure data for the detection of Parkinson’s disease. By collecting the pressure data of patients during walking and analyzing the distribution of foot pressure, the model can capture the unique biomechanical characteristics of Parkinson’s disease patients. To address the core challenges of spatial irregularity and data disorder in footprint data, we propose an innovative approach that leverages the Transformer-based attention mechanism and tensor fusion technique to enable accurate identification of Parkinson’s disease. This attention mechanism has inherent permutation invariance, which is highly suitable for the feature learning of footprint data. The tensor fusion technique can effectively integrate the foot features at different levels. A large-scale dataset of foot pressure data was used for training and validation. The experimental results show that the model achieves a high accuracy of 87.03% and good stability in Parkinson’s disease detection, enabling effective differentiation between patients and healthy individuals. On the one hand, our work is critical for analyzing pressure data and fusion features from large-area flexible force-sensitive sensors, which enables the accurate identification of foot data. On the other hand, it greatly facilitates gait analysis, gait evaluation, and the diagnosis of Parkinson’s disease.
1. Introduction
Parkinson’s disease (PD) was first characterized by James Parkinson in 1817 [1]. This disease impacts both the motor and non-motor systems, profoundly affecting the quality of life for those affected. These specific motor issues include resting tremor, slow movement, stiffness, and postural, which are the key hallmarks of PD [2].
At present, the early detection of PD mainly relies on the assessment of clinical manifestations. The therapeutic strategies are tailored to the symptoms, with medical practitioners frequently utilizing the Unified Parkinson’s Disease Rating Scale and the Hoehn and Yahr scales. These tools, while designed to measure motor function, daily activities, disease advancement, post-therapeutic conditions, and potential side effects, are inherently subjective. Consequently, the accuracy of the diagnosis is heavily influenced by the clinician’s expertise, which can introduce variability and inaccuracy.
In summary, the application of these scales in clinical practice faces two major challenges: (1) The risk of delayed treatment, which may reduce opportunities for early intervention and lead to misinterpretation of clinical signs, especially when gait disturbances are influenced by comorbid conditions. (2) Heavy reliance on subjective scale-based assessments in the current diagnostic process for Parkinson’s disease, which lacks support from objective biomarkers. There is a clear need for an efficient and straightforward method to assist clinicians in accurately diagnosing PD and tailoring treatment strategies based on disease severity.
Individuals with Parkinson’s disease often exhibit distinct walking patterns, which can be quantitatively measured to assess motor function impairment. The use of sensors to capture kinematic gait data provides an objective method to support diagnosis and treatment evaluation. With advances in machine learning, automated detection of PD-based gait abnormalities has progressed rapidly. Researchers have developed various data-driven approaches to classify PD stages, predict symptom progression, and enhance personalized therapeutic strategies.
The flexible force-sensitive sensor array, as an innovative, simple, and repeatable tool for physiological measurement, has attracted increasing attention in recent years. Research indicates that foot pressure is closely associated with the pathophysiological mechanisms of Parkinson’s disease. This study therefore aims to explore identification methods for Parkinson’s disease based on the flexible force-sensitive sensor array, offering new perspectives for its diagnosis. Flexible force sensors have been widely used in clinical-assisted diagnosis [3,4,5], gait analysis [6,7,8], identification [9], and other fields. The flexible force sensor can accurately obtain the plantar pressure data of human gait, and the features can be obtained by calculating the value of plantar pressure to obtain the evaluation of the gait of the subject. The plantar pressure is unique to each subject, which is related to complex biomechanical, physiological, and behavioral processes. There are two popular methods to obtain plantar pressure, one is footwear innovation that uses force-sensitive resistor sensors in its insole, the other is the large-area flexible force sensors array. Some research [10,11,12] has developed the design of insoles to measure plantar pressure. Research [10] entails a wireless sensor system, composed of a primary master unit and an IMU(Inertial Measurement Unit) secondary component. Research [11] developed a cost-effectiveness and smart insole for healthcare, athletic purposes, and extensive research participation involving a large number of individuals. Research [12] presents the device and characterization of insoles composed of 12 capacitive sensors for each foot to measure plantar pressure. However, different people need different sizes of insoles, and it is difficult to obtain the macro characteristics of human gait, such as step length and width. With the technological advancement of the large-area flexible force sensors array, the collection of precise, high-resolution recordings of the plantar pressure becomes possible. In many applications of the flexible force sensor, data segmentation and automatic recognition [13] of footprint data are the key points, which restrict the application of plantar pressure data. Solving these problems will greatly improve the visibility of plantar pressure data and bring convenience to the analysis of plantar pressure data.
To the best of our knowledge, there are very few studies [13,14,15,16] on algorithms for footprint recognition. Several approaches have explored methods for distinguishing left from right by analyzing spatial or pressure peak characteristics within single footstep patterns, such as the number of pixels in different parts of the foot [13], or deep transfer learning of peak pressure images [15,16]. The limitation of these methods is that they do not do much research on the footprint extraction method of the pressure matrix, and most of them are traditional machine learning methods. Deep learning has recently emerged as a dominant force in automated feature extraction, eliminating the requirement for domain-specific expertise while deriving meaningful patterns through multi-layered computational frameworks. Reference [17] proposed a convolutional neural network autoencoder (CNN-AE) architecture for user classification based on plantar pressure gait recognition. We focus on the method of footprint recognition by proposing a deep learning network based on Transformer [18]. Transformer is a deep learning architecture that revolutionizes sequence data processing by relying on self-attention to capture relationships between elements in a sequence.
The pressure data matrix obtained by the flexible force sensor is like the gray image, arranged on a regular pixel grid, but the extracted footprint data is a set embedded in a continuous space. The deep network design criteria for footprint data are different from the previous deep network design criteria of images for the differences between the structure of footprints data and images. In this work, we have developed a deep learning-based approach for footprint data, inspired by the Transformer network’s application in natural language [18], image analysis [19,20] and point cloud [21,22,23]. Our improvements build on previous work across domains and tasks, where we constructed a self-attention mechanism network for footprint data, and we investigated the attention mechanism’s handling of 3D plantar pressure.
The Transformer architecture’s core lies in its self-attention mechanism, which inherently functions as a set operator: it processes input elements without relying on their order, thereby preserving the inherent structure of the data. In our work, plantar pressure data is treated as a set of pressure points embedded in 3D space. To fully leverage this property, we introduce a self-offset attention module specifically designed to process such footprint data. We constructed an improved Transformer network entirely based on self-attention, making it highly suitable for operating on unstructured pressure point sets.
In this paper, we propose a footprint recognition method based on the Transformer architecture. Experimental results demonstrate that our Transformer-based approach is highly effective for deep learning tasks involving footprint data. The detailed model structure will be elaborated in subsequent sections. In summary, our main contributions include the following:
- The newly designed Transformer-based deep learning framework is particularly suitable for processing footprint data, as it effectively handles unstructured, order-independent data within irregular domains. This architecture is well adapted to learn the characteristics of element disorder in footprint pressure point sets and to capture rotation invariance in footprint patterns. Thus, this network extends the application scope of Transformer models.
- Compared to the original self-attention mechanism, our approach incorporates an implicit Laplacian operator and an L1-norm-based offset attention module, which inherently exhibits permutation invariance. Since the structure remains unaffected by the order or arrangement of the input elements, it is particularly suitable for learning from footprint data
- To better capture both local and global information from footprint data, we extracted footprint features by employing max and average modules, followed by fusing the feature maps from two layers using tensor fusion.
- The experimental results on our dataset showcase the advanced capabilities of our network in accurately identifying Parkinson’s disease, confirming its competitive edge over existing methods.
2. Related Work
Footprint extraction techniques research into plantar pressure data has surged due to its clinical and financial significance, leading to numerous segmentation algorithms. For instance, research [24] applies a hidden Markov model-based machine learning approach to segment pressure signals based on gait cycle characteristics. Other works [25,26] delve into footprint segmentation and gait recognition techniques. Alternative methods involve manual assessment or insole-integrated pressure sensors [4].
A flexible force sensor array captures walking pressure distribution data, which is clinically valuable. Research [13] proposes an analysis method involving data preprocessing, footprint identification, segmentation, and stride analysis. Similarly, research [25] uses a flexible force sensor, followed by a custom time-window filter and an 8-neighborhood connected component labeling algorithm for segmentation. However, the existing research has some drawbacks. The manual judgment method is only suitable for the judgment of a small number of footprints. Although the built-in pressure sensor insoles can better obtain single-step sole pressure information and pressure distribution, their versatility is not strong due to size limitations. The existing algorithms for the footprint extraction of array flexible pressure sensors easily cause clustering errors when the subject’s stride length is small. Due to the shortcomings of the above methods, this paper uses the footprints on the pressure plate as input instead of focusing on the extraction of individual footprints.
At present, the algorithm of plantar pressure data segmentation is relatively mature, but there are few methods of footprint recognition. The existing footprint recognition algorithms are mainly focused on medical treatment. In research [3], a study on foot laceration rehabilitation combines feature extraction for assisting diagnosis and treatment. It introduces a method combining wavelet transform and a directional gradient histogram descriptor for image feature extraction. Parameters from plantar pressure images are computed, with detailed steps outlined. Experiments yield pressure waveforms across various rehabilitation stages, enabling patient classification based on fused feature extraction results. These findings illustrate distinct patient progress in different rehabilitation phases, highlighting the clinical utility of force-sensitive sensor arrays in capturing walking pressure distribution data.
A versatile pressure-sensitive sensor grid is capable of capturing the walking individual’s plantar pressure distribution, holding significance in clinical applications. As referenced in research [13], an approach for plantar pressure image analysis grounded in prior knowledge was suggested. This involves utilizing a clustering algorithm for footprint extraction, followed by shape-based footprint recognition. Next, segmentation occurs according to the anatomical characteristics of the feet. Ultimately, a least squares approach facilitates span analysis, proving beneficial for clinical assessment. Along similar lines, in research [25], a flexible force sensor was employed to gather plantar pressure data, which was then filtered through a custom-designed time window filtering algorithm. To segment and cluster these pressure images, an innovative 8-adjacent neighborhood connected component labeling algorithm was proposed.
Finally, according to plantar pressure and plantar shape, the footprints are identified. However, all the methods mentioned in research [13,25,26] need to first straighten the footprints and extract the contour shape features of the footprints after the straightening, which lacks flexibility. Research [4] proposes a subregional plantar pressure analysis method based on the dynamic characteristics of plantar pressure signals of an insole with a built-in pressure sensor and adopts radial basis function neural network (RBFNN) to learn gait changes. An RBFNN classification mechanism based on output error is proposed, and PD diagnosis is carried out by this method. Research [5] describes a device that captures gait patterns with a capacitive floor sensor that detects when and where the foot touches the floor. A recurrent neural network architecture is employed in conjunction with the given sensor configuration to undertake the classification endeavor of identifying distinct walking styles.
Existing footprint recognition methods have some drawbacks. Some left and right foot recognition methods [13,25,26] need to first straighten the footprint and extract the contour shape features of the footprint after the alignment, which lacks flexibility. Furthermore, prior research has put relatively less emphasis on the real-world implementation of footprint identification, necessitating enhancements in its efficiency.
However, most of the existing identification methods on Parkinson’s disease are based on the dynamic characteristics of the sole pressure insole, and there is no direct recognition of the static sole pressure. In view of the above shortcomings, our deep learning method uses the Transformer network for footprint recognition for the first time. Instead of doing too much research on the shape of the footprint, we take the footprints on the pressure plate as the input of the network. Experiments show that the proposed method can accurately and quickly identify Parkinson’s disease, which greatly improves the application ability of data. We treat the footprint as a whole input. The advantage of this is that the overall data takes up less memory, and we can capture the feature of the relationship between footprints through deep networks. However, this method has certain limitations, as it is difficult to focus on the temporal characteristics of footprints.
This method allows us to efficiently extract the features of footprints and achieve better recognition accuracy.
3. Footprint Recognition Method Based on Transformer Network
3.1. Methods
The sampling information of the flexible force sensor can be represented by the matrix shown in Formula (1), where M and N are the number of rows and columns of the flexible force sensor, respectively.
Figure 1 is a visualization of the pressure matrix obtained by an array plantar pressure sensor.
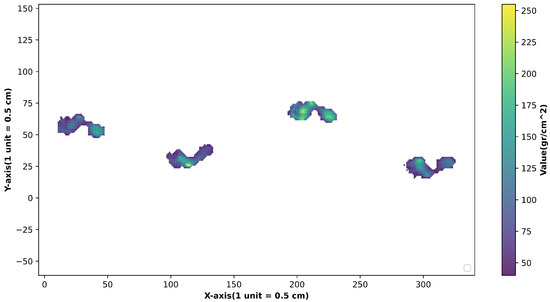
Figure 1.
Visualization of plantar pressure matrix.
The pressure point description vector set , is obtained from the pressure matrix F, which contains the three-dimensional vector set formed by the transverse and longitudinal coordinates of all the N points with pressure values in the matrix. In this step, we convert the pressure matrix into a dataset of pressure points.
Since the footprints data is a set embedded in a continuous space, which makes the data structurally different from the image, the deep network design criteria used for footprints data are different from those previously used for images. Our Transformer design improvements build on previous work across domains and tasks, and we have built frameworks that take advantage of Transformer’s inherent sequential invariance, avoiding the need to define the sequence of pressure point data, and instead extract features via attention mechanisms. As illustrated in Figure 2, our framework includes an input embedding module, improved self-attention mechanism approach, maximum and average module, and fusion module. Our input is a set of pressure points , N is the number of pressure points, each point has d dimensions and here d is 3, including the horizontal and vertical coordinates of the pressure point and the pressure value.
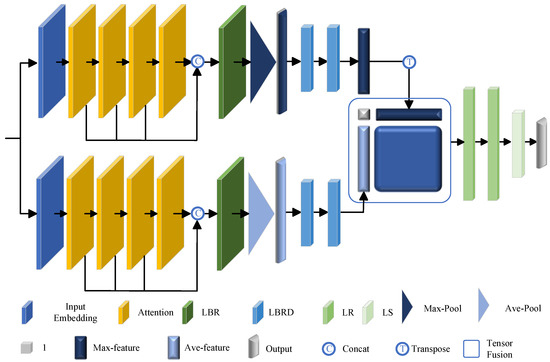
Figure 2.
Overall framework of footprint recognition method based on Transformer network (LBRD: combining the linear, BatchNorm (BN), ReLU layer, and dropout layer; LR:linear and ReLU layers; LS: linear and Softmax layers).
We build a maximum module and an average module to capture features at different levels and build a fusion module to capture global features. The maximum module and average module contain an embedded module and an improved self-attention mechanism module, respectively, and obtain the maximum or average feature by the maximum pooling or average pooling operator.
The maximum pooling module or average module first learns the dimensions embedding feature through the input embedding module. Next, we employ a sequence of four attention layers, merging their outputs in parallel, and establish a linear layer to derive the output feature with dimensions. The process is as follows:
where represents the ith attention layer, the output dimension of each attention layer is the same as its input dimension, and represents the weight of the linear layer. The input embeddings and the attention mechanisms we employ will be described in detail later. The intermediate feature is obtained using the maximum or pooling operator, which is then transmitted to the two cascaded feedforward neural networks LBRD (combining the linear, BatchNorm (BN), ReLU layer, and dropout layer). At this point, we obtain the maximum pooling module output features and average pooling module output features , respectively.
In order to extract the effective global feature vector representing footprints, we use a tensor fusion layer to fuse the output feature of the maximum module and the output feature of the average module and provide the global feature to the classifier. The classifier is composed of two cascaded feedforward neural networks: LR, which integrates linear and ReLU layers, and LS, which integrates linear and Softmax layers, to generate the final classification score. The class label for the footprint data is assigned based on the highest score.
3.2. Input Embedded Module
In Transformer, the input embedding module uses a positional encoding mechanism to capture the word order. Our approach incorporates raw input embeddings into a coordinate input embeddings component, which, by assigning distinct coordinates to each point’s position, enables the differentiation of identical points based on their spatial relationships. This mechanism generates distinctive features, as every pressure point possesses a distinctive coordinate to signify its specific location.
Initially, we examine a pressure point embedding approach for the footprint that disregards the interplay among points. Analogous to word embedding in Natural Language Processing (NLP), this method seeks to position points with analogous semantics closer within the embedding space. In particular, we employ a neural network that integrates two cascaded LBRS to embed the footprint pressure point P into a -dimensional space , each LBR having a de-dimensional output. To improve computational efficiency, we set according to experience. We simply use the horizontal and vertical coordinates of the pressure points and the pressure value as its inputs.
3.3. Improved Self-Attention Mechanism
As shown in Figure 3, we use an improved self-attention mechanism approach. It is different in that it replaces the attention feature with the offset between the self-attention module input and the attention feature. This has two advantages. The absolute coordinates of the same object can be completely different through a rigid transformation, but the relative coordinates are stable. Secondly, Laplacian matrices (the offset matrix between the degree matrix and the adjacency matrix) have been shown to be very efficient in graph convolution learning [22]. Therefore, we treat the footprint as a graph and the floating adjacency matrix as the attention graph. Furthermore, the total of every row in the attention matrix equals 1. The degree matrix can be equated to an identity matrix. Hence, the offset-attention mechanism can be conceptually likened to a Laplacian operation.
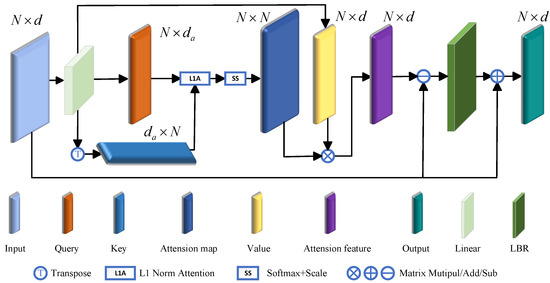
Figure 3.
Improved self-attention method.
Self-attention (SA), as introduced in Transformer [18], is a module for assessing semantic relationships among various elements within a sequence of data. As per the definitions in research [18], let Q, K, and V denote the query matrix, key matrix, and value matrix, which are derived from the linear transformation of the input features , respectively, as follows:
where are shared learnable linear transformation coefficient matrices, represents the dimension of the column vector of and represents the dimension of the column vector of V.
First, we obtain the L1 norm attention weight by calculating the L1 norm between the query matrix Q and the key matrix K:
This weight is then normalized to get :
In contrast to the conventional Transformer that employs softmax for normalization along the second dimension and scales the first, our approach opts for normalizing the first dimension with softmax while scaling the second. This offset attention mechanism enhances the attention weights and mitigates noise influence, thus proving advantageous for subsequent tasks.
The output of self-attention is
The graph convolutional network shows the advantage of using a Laplacian matrix instead of an adjacency matrix. We augment the network with the Offset Attention (OA) module instead of the original self-attention (SA) module when applying Transformer to footprints. As shown in Figure 3, the offset attention layer computes the displacement (deviation) between the self-attention characteristic and the input feature through subtraction, furnishing information to the LBR network. This offset provides information to the LBR network. The operation is as follows:
is like the discrete Laplace operator.
3.4. Maximum and Average Modules
Our self-attention mechanism method finally connects a pooling layer, and different pooling methods can obtain different levels of footprint information, for example, average pooling pays more attention to the average information of footprint pressure, while maximum pooling pays more attention to the area with high footprint pressure. As shown in Figure 2, we set up two cascaded feedforward neural networks LBRD after the pooling layer (combining the linear, BatchNorm (BN), ReLU layer, and dropout layer) to obtain the maximum and average pooling module output characteristics.
3.5. Fusion Module
The maximum and average modules have their respective focuses. To obtain global features, we set up a fusion layer to integrate the maximum feature and average feature through explicit modeling to learn the relationship between them. Research [27] proposes an innovative framework, referred to as Tensor Fusion Network, that encompasses the learning of these dynamics end-to-end in an integrated manner. A 2D tensor fusion layer is employed to uncover the latent relationships between maximum feature and average feature modules, which is represented as the following vector field utilizing 2-fold Cartesian product:
Maximum pooling layer produces the maximum embedding , S is the dimension of the maximum module output. Similarly, we obtain the average embedding . The additional constant dimension, set to 1, facilitates the creation of both unimodal and bimodal dynamics. The coordinate can be interpreted as a 2D point in the 2-fold Cartesian space defined by the embedding’s dimensions . is mathematically analogous to a differentiable outer product between .
In Equation (11), ⊗ indicates the outer product between vectors. is the 2D representation of all possible combinations of two modules. The two subregions are embeddings from two modules in the tensor fusion layer. Subregion captures bimodal interactions within the tensor fusion layer, as illustrated in Figure 4.
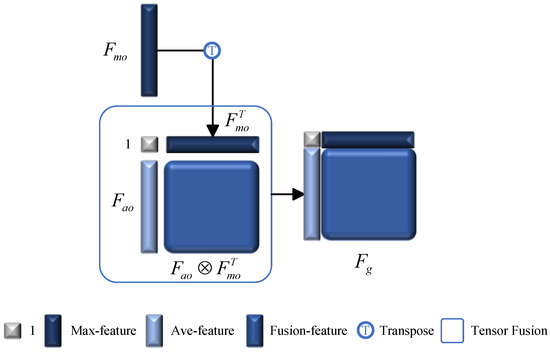
Figure 4.
Tensor fusion layer.
Finally, as shown in Figure 2, the global features are put into the classifier, which is made up of two sequential feedforward neural networks LR (combining linear, ReLU layers) and LS (combining linear, Softmax layers). This setup is used to determine the final classification score. The class that achieves the highest score is then regarded as the footprint’s class label.
4. Experiments and Results
4.1. Implementation Details
We have implemented the proposed method in this paper by using Python 3.9 on Window 10 OS. All the experimental tests are run on a PC with Intel Core i5 CPU i5-12400 at 2.50 GHz and 16.0 GB RAM and NVIDIA GPU GeForce RTX 3060(12 G). The proposed network was implemented using the PyTorch 2.5.1+cu121 deep learning framework. During the experiment, the network was trained using Adagrad, and the categorical cross-entropy was employed as the loss function. The learning rate is set to 1 × 10⁻⁴, with a batch size of 5 (chosen to match the GPU memory capacity). The total number of training epochs is 200. The dropout probability for the fully connected layer is 0.2 (to mitigate overfitting), and the output dimension of the hidden layer is set to 128.
4.2. Data Preprocessing
Presently, the utilization of flexible force sensors in capturing plantar pressure measurements has become prevalent across healthcare, rehabilitation, and gait assessment domains. The efficacy of these applications heavily relies on the accuracy and dependability of the gathered data. Given that walking patterns vary significantly among individuals and can be easily influenced by external factors, establishing a standardized method for plantar pressure acquisition is crucial. This study employs a plantar pressure platform (Figure 5), which incorporates an array plantar pressure sensor. The experimental array pressure sensor measures 180 cm × 50 cm with a spatial resolution of 4/cm2, accommodating 36,000 sensing units.
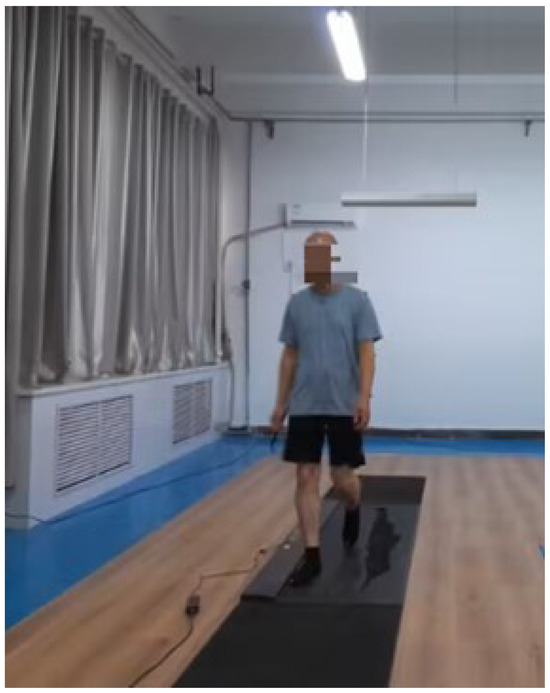
Figure 5.
Plantar pressure platform.
This study was conducted in accordance with the Declaration of Helsinki. The First Affiliated Hospital of Henan University of Science & Technology granted ethical approval to carry out the study within its facilities, and the approval number is 2023-469.
A total of 131 participants, including 66 Parkinson’s disease patients and 65 normal subjects, were enlisted for data collection. The sample size of this study was calculated using G*Power 3.1.9.7 software. With set to 0.05, to 0.2, and effect size f to 0.5, a minimum of 102 participants was required. A total of 131 participants were finally included, which met the requirement of statistical test power, indicating that the sample size of this study falls within a reasonable range.
Demographic characteristics have been shown in Table 1 and Table 2, with detailed supplementary baseline data of all participants, including Gender (64 males, accounting for 48.85%; 67 females, accounting for 51.15%) and Age (range: 45–80 years, mean ± standard deviation: 61.51 ± 12.80 years). The supplemented data will more clearly present the baseline characteristics of the study subjects and provide support for the representativeness and comparability of the results.

Table 1.
Gender distribution of participants.

Table 2.
Age distribution of participants.
A chi-square test of independence was conducted to investigate the association between gender and the status of PD diagnosis. There was no statistically significant difference in gender distribution between the two groups (balanced baseline, with comparability). ( = 0.3767, p = 0.5394 > 0.05).
A chi-square test of independence and the Mann–Whitney U test were conducted to investigate the association between different age groups and PD diagnosis status. There was no statistically significant difference in age groups between the two groups ((2) = 2.2568, p = 0.3236 > 0.05). The U statistic and statistical conclusion also showed no statistically significant difference (p = 0.1397 > 0.05).
All the data is annotated by experienced doctors. They were instructed to traverse the sensor repeatedly. The patients received daily treatment with levodopa-based drugs. Data collection was conducted 12 h after the last dose of levodopa-based drugs; the data collected under this state reflects the patients’ baseline disease status after the drug effect has worn off, rather than the therapeutic effect after drug administration.
The international standardized Hoehn–Yahr Staging Scale and the motor section of the Unified Parkinson’s Disease Rating Scale (UPDRS-III) were used to classify patients’ disease severity. The number and proportion of patients in different Hoehn–Yahr stages (Stage 1–2.5, Stage 3, Stage 4) were calculated. Meanwhile, the scores of the UPDRS-III motor section (range: 4–41) were supplemented with their mean ± standard deviation (23.67 ± 10.68 points), so as to clearly present the distribution of the overall disease severity among patients, as shown in Table 3.

Table 3.
Modified Hoehn–Yahr (H&Y) staging statistical table.
We clearly documented the gait data collection process for each participant. Under the test scenario of level-ground walking at a constant speed, three gait sequences were collected for each individual. After excluding invalid data with gait interruptions or abnormal postures, one valid gait sample per participant was finally retained. This footprint contains at least one complete gait cycle.
The plantar pressure data exported from the pressure plate is in CSV format. These files contain participants’ basic information alongside the pressure plate-generated pressure values. We extracted the pressure values from these CSV files to construct the dataset. Given the fixed size of the pressure plate, the data format for each participant is consistent, uniformly structured as a 360 × 100 matrix. Median filtering was applied to eliminate noise points in some datasets. Its key advantage is that it effectively removes salt-and-pepper noise while maximizing the preservation of detailed information, thus avoiding the edge blurring problem associated with traditional mean filtering. The pressure distribution of footprints depends not only on pressure magnitudes but also on the corresponding foot positions. Therefore, we converted the pressure matrix into a point cloud, where each point is represented as a 3D vector. The first two dimensions denote the horizontal and vertical coordinates of pressure-bearing points in the pressure matrix, respectively, while the third dimension represents the pressure magnitude at that point. This point cloud format eliminates the need to account for pressure-free areas while still retaining the positional information of pressure points. Although these positions refer to absolute coordinates on the pressure plate, our model employs a Transformer network—an architecture capable of learning relative positional information.
4.3. Dataset and Cross-Validation
The procedure of cross-validation, a statistical technique, is utilized to assess the efficacy of a model when confronted with an unknown dataset. The utilization of five-fold cross validation ensures that each sample eventually becomes part of the training as well as testing set. We divide the data into five folds. The partition of the dataset is shown in Table 4. The model undergoes training on four distinct sections (designated as the training set) and subsequently, its effectiveness is assessed on the untouched partitions (referred to as the test set).

Table 4.
The partition of the dataset.
We conducted a series of statistical analyses on the average pressure value of each sample across the five data groups, including descriptive statistics in Table 5, the Shapiro–Wilk normality test in Table 6, Levene’s test for variance homogeneity, and one-way analysis of variance (ANOVA). The results revealed no statistical significance in the overall test (p > 0.05), thus eliminating the need for further post hoc tests. This finding indicates that there is no significant statistical difference in average pressure values among the five groups.

Table 5.
Descriptive statistics.

Table 6.
The Shapiro–Wilk normality test.
Numerically, the mean values of each group cluster between 136.44 and 140.16, with a maximum difference of less than 4, indicating that their overall levels are close.
For the normality test (Shapiro–Wilk method), the data of all groups conforms to a normal distribution, meeting the normality requirement of ANOVA. In the homogeneity of variance test (Levene method), the test statistic is 2.2008 and the p-value is 0.0726, which is greater than 0.05. This shows that the variances of the data across groups are homogeneous with no significant differences, satisfying the homogeneity of variance requirement of ANOVA. Both core prerequisites (normality and homogeneity of variance) for one-way ANOVA are satisfied, ensuring the validity of the test results.
A one-way ANOVA was conducted on the indicators of the five groups. The results show that the test statistic F-value is 0.1604 and the p-value is 0.9579. Since the p-value (0.9579) is much greater than the significance level of 0.05, the overall test result is not significant. Therefore, there is no statistical difference in the overall level of this indicator among the five groups, and no further post hoc multiple comparisons are required.
A comprehensive breakdown of the dataset’s five-fold cross-validation division and the derived outcomes are depicted in Table 7. The mean identification rate achieved through the five-fold cross-validation process stands at 87.03%. This study focuses on a binary classification task, and the confusion matrix in Figure 6 and ROC curve and AUC score (AUROC) in Figure 7 are selected as the core evaluation metrics.

Table 7.
Five-fold cross validation.
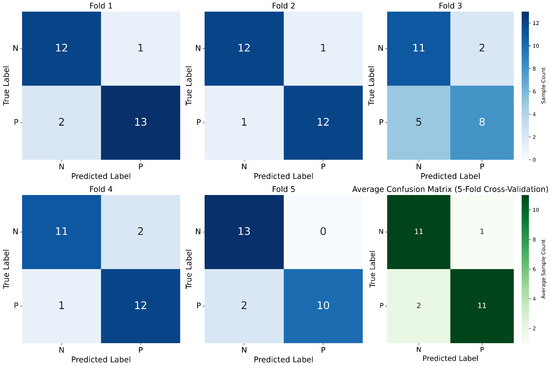
Figure 6.
Confusion matrix (five-fold cross-validation).
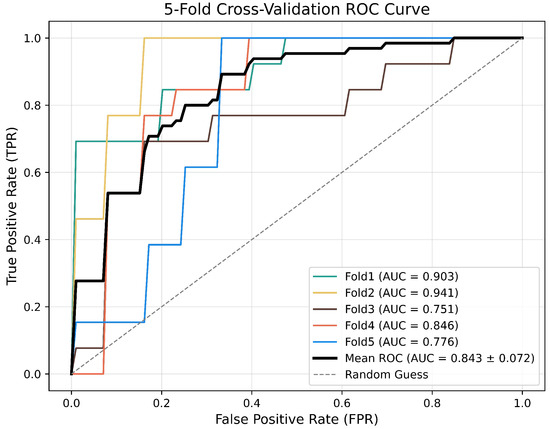
Figure 7.
Five-fold cross-validation ROC curve.
For the third fold with high variability in Figure 6 and Table 7, we performed a traceability analysis on its corresponding samples. It was observed that the proportion of patients with early-stage Parkinson’s disease (PD) in this fold’s test set was significantly higher than in other folds, and the model exhibited a relatively high misclassification rate for these patients—most were misclassified as healthy individuals. This suggests our model performs well in overall PD recognition tasks but still has room for improvement in identifying patients with early-stage PD. Subsequent research will focus on addressing this limitation.
After retrieving public accuracy data for existing clinical detection technologies targeting the disease in question, it was found that the 87.03% accuracy of the proposed method is higher than that of traditional detection approaches and meets the basic clinical access standards for screening technologies for this specific disease. An analysis of applicable scenarios, grounded in the disease’s key characteristics, reveals that the accuracy can satisfy the preliminary screening needs of primary medical institutions (helping reduce subsequent testing costs associated with a large volume of negative samples). However, it is not yet suitable for the diagnostic phase and requires further verification in conjunction with other detection technologies.
In alignment with the clinical diagnosis and treatment pathway of the target disease, we have supplemented a specific risk assessment for these two types of errors:
Clinical impact of false negatives: when used for early screening, false negatives may result in approximately 15.38% of patients (estimated based on the average confusion matrix) missing the golden window for intervention, thereby increasing the risk of disease progression to moderate or severe stages.
Clinical impact of false positives: patients with false positive results will be subjected to unnecessary examinations, and approximately 4% of these individuals may develop anxiety due to being labeled “suspected of having the disease” (data referenced from patient psychological surveys of similar detection technologies).
Under the default threshold, the model developed in this study achieves a balance between sensitivity and specificity (with a difference of <6.44%) and yields an AUC of 0.843. This not only demonstrates the model’s strong comprehensive discriminatory ability but also its capacity to flexibly adapt to different trade-off requirements in practical applications.
4.4. Comparison with Other Methods
The performance of our method is compared with other studies in Table 8. We employed the widely used AlexNet [28], ResNet-50 [29], foot features [4] + SVM (Support Vector Machine), and CNN-AE [17] for comparison. AlexNet and ResNet-50 are typically used for processing image information. Since the original pressure matrix data is similar to grayscale images, the matrix data can be directly used as input for AlexNet and ResNet-50. In our network, the matrix data is converted into point sets for processing. Reference [29] proposed a method for extracting individual foot features from plantar pressure images, and we selected this method combined with the SVM classification method for comparison.

Table 8.
Results of different methods.
At the segment level, we have an accuracy of 87.03%, a precision of 83.55%, a recall of 83.23% and an F1 Score of 86.27%. Our proposed method clearly outperforms previous algorithms. Compared to other methods, our algorithm has the advantage of processing plantar pressure information.
4.5. Ablation Studies
Comprehensive ablation studies were performed to assess the essentiality and performance impact of each implemented approach, with detailed results presented in Table 9. The proposed components are evaluated, including our network architecture, initial linear module, initial MA-module, AVE-module, MA-module + AVE-module, and original attention. The initial linear module serves as the baseline networks with an accuracy of 82.40%. The MA-module has an accuracy of 85.60%. The AVE-module has an accuracy of 84.00%. The MA-module + AVE-module achieves an accuracy of 84.00%. The original attention has an accuracy of 83.20%. The experimental outcomes, demonstrating an 87.03% accuracy rate, confirm the essential role of tensor fusion methodology in this method. To sum up, the excellent quantitative analysis results validate the effectiveness of our network architecture.

Table 9.
Ablation results of the proposed model.
4.6. Visualization of the Extracted Feature
The results of the embedding layer and the feature vector following the tensor fusion layer are depicted, utilizing t-SNE for dimensionality reduction, as illustrated in Figure 8 and Figure 9. In these figures, each point is color-coded according to its label. Labels in the left figure correspond to the labels of the original data, while labels in the right figure correspond to the labels of the predicting results. It can be seen from Figure 8 that all the points are clustered together and there is no clear divide between them. However, after the first LR layer, the data distribution in Figure 9 exhibits a more structured pattern, with a clear demarcation between the predicted labels. These visualizations demonstrate that our model effectively maps the data into a space where it can be more easily distinguished, leading to improved classification performance.
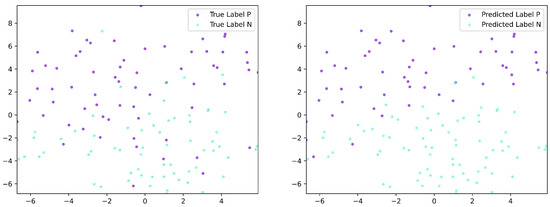
Figure 8.
Visualization of the t-SNE result of the embedding layer output.
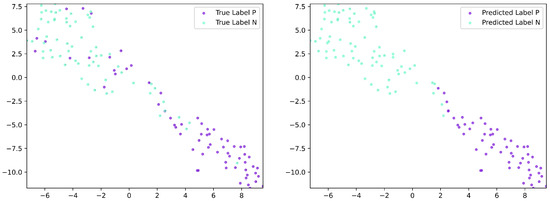
Figure 9.
Visualization of the t-SNE result of the feature extracted after the first LR layer.
4.7. Visualization and Analysis of the Attention Map
The attention matrices represent the correlation of each point in the maximum module and average module. We choose one sample to visualize the attention map of the maximum module and the attention map of average module. For comparison, the heat map of plantar pressure of the sample is shown in Figure 10. The bright points in Figure 10 have higher pressure values.
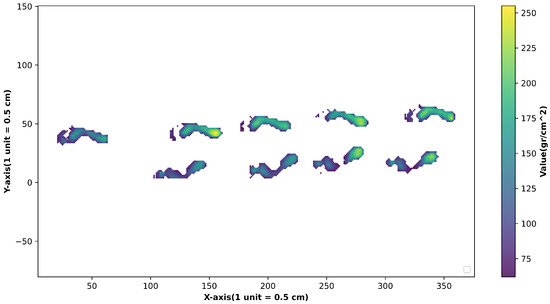
Figure 10.
Heat map of plantar pressure.
The attention map in the Maximum module of the sample is shown in Figure 11-top. And the attention map in the Average module of the sample is shown in Figure 11-middle. In addition, we performed basic Euclidean distance computations between various points as illustrated in Figure 11-bottom. When contrasted with Figure 11-bottom, the discriminative power of salient features and the magnitude of attention coefficient responses within salient regions are notably greater in Figure 11-top and Figure 11-middle. This means that attention pays more attention to what is noteworthy.
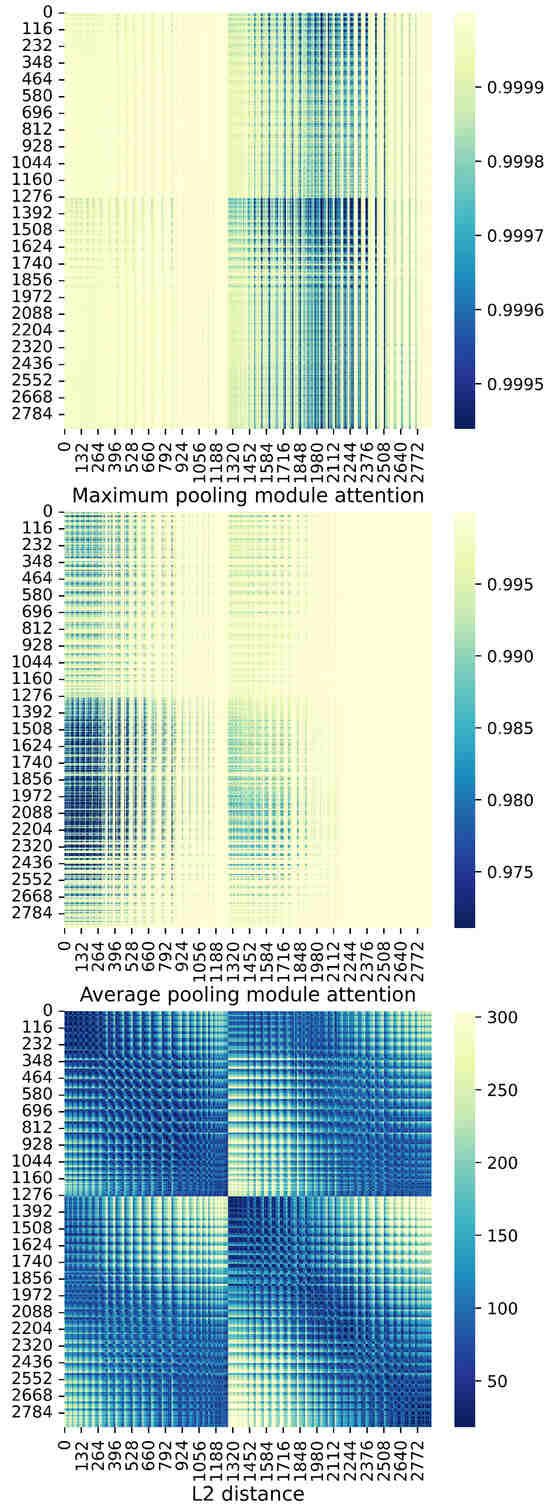
Figure 11.
(1) Attention map of Maximum module (top). (2) Attention map of Average module (middle). (3) L2 distance (bottom).
In addition, to discover the difference between the attention maps of queries on different parts of the array, we visualized attention maps in the Maximum module and Average module of queries on different parts of the array in Figure 12 and Figure 13. We found that attention maps in the Maximum module and Average module of points 0, 600, 1200, 1800, 2400 are similar in the initial stage, but the distribution difference in the later period is great. Attention maps in the Average module are sharper than that in the other. The lighter areas are mainly distributed in the middle and on the edge of the footprint in the Maximum module attention maps but in the middle of the footprint in the Average module attention maps.
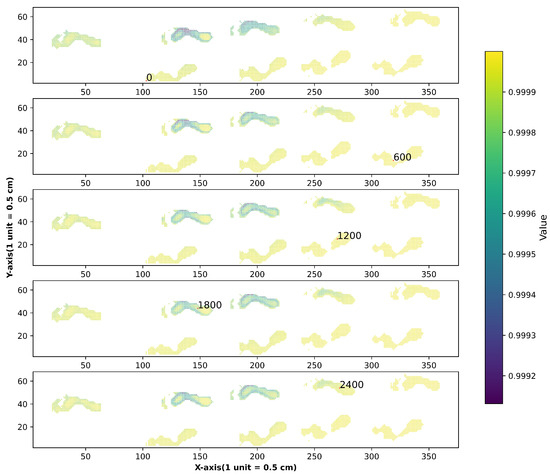
Figure 12.
Attention map of Maximum module for different query points (indicated by the red point).
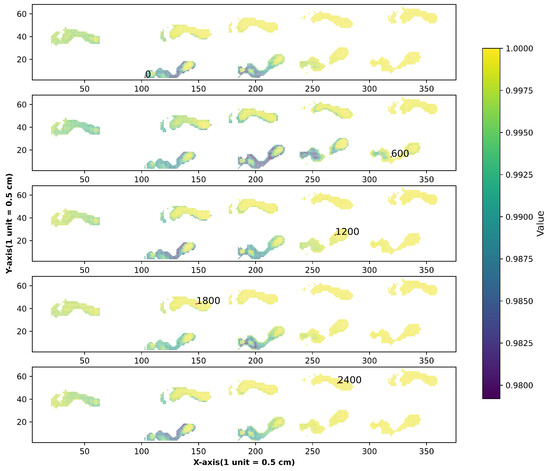
Figure 13.
Attention map of Average module for different query points (indicated by the red point).
5. Discussion
Based on the plantar pressure detection technology, it demonstrates significant application value in monitoring patients with Parkinson’s disease, with interdisciplinary teams playing a foundational role in its development. This technology offers three major advantages: non-invasiveness and safety, convenience and accessibility, and precise monitoring, effectively overcoming the limitations of traditional methods and meeting the long-term monitoring needs of PD patients. Meanwhile, interdisciplinary teams composed of neurologists and data scientists collaborate throughout the entire process, from requirement definition and data annotation to model guidance, solution adjustment, and model optimization, providing core support for technology implementation and patient care.
This method has the characteristics of being non-invasive and safe. PD patients often experience motor dysfunction and require long-term follow-up to assess disease progression. Traditional PD diagnostic aids, such as functional brain imaging or cerebrospinal fluid tests, can be invasive, reliant on specialized equipment, or carry radiation risks, making frequent long-term monitoring challenging. In contrast, the AI-based detection method in this study only requires plantar pressure data collected during natural walking. This is particularly suitable for long-term use by elderly PD patients or those with limited mobility.
The detection technology is convenient and user-friendly. Current PD motor function assessments, such as the UPDRS scale, heavily rely on clinicians’ subjective ratings and require hospital visits. Some objective assessment devices are also confined to hospital settings due to space limitations, making them difficult to deploy in primary care institutions. The approach in this study utilizes common plantar pressure acquisition equipment, which features simple procedures (patients only need to walk a short distance) and can be flexibly deployed in community health centers, rehabilitation facilities, or even patients’ homes, thereby improving the accessibility of disease detection and condition monitoring.
This method provides precise monitoring and support for personalized treatment. Motor impairments in PD patients are often subtle and progressive, making it difficult to capture multi-dimensional features through manual analysis of plantar pressure data. The AI model proposed in this study can automatically extract key features from plantar footprints, improving detection accuracy. Furthermore, this method can dynamically track changes in plantar pressure across different disease stages, providing objective data for clinicians to adjust medication dosages and develop personalized rehabilitation plans.
The interdisciplinary team plays a crucial role in the care of patients with Parkinson’s disease. The implementation of this technology and its application in patient care rely on close collaboration between neurologists and data scientists throughout the entire process. Neurologists contribute clinical expertise to define core requirements for PD motor function assessment, such as early screening, disease staging, and rehabilitation outcome evaluation. They also provide clinical cases annotated with UPDRS scores and medication history, which are essential for labeling and validating AI models. Data scientists guide the selection and construction of AI models, ensuring the technical approach aligns with clinical pathological logic. Neurologists adjust treatment plans based on AI-driven dynamic monitoring results, while data scientists iteratively optimize the models according to clinical feedback.
6. Conclusions
In light of the translation invariance exhibited by footprint pressure data, this paper introduces a novel method for identifying Parkinson’s disease using Transformer networks, specifically tailored to analyze footprints captured through a flexible force sensor array. This study meticulously constructs two distinct sole pressure feature extraction modules, meticulously analyzing the distribution of foot pressure. The resultant model adeptly captures the distinctive biomechanical signatures of Parkinson’s disease patients during ambulation. Advanced tensor fusion techniques are utilized to seamlessly integrate foot pressure features across various levels. Furthermore, the outcomes of ablation studies and comparative analyses with alternative methodologies affirm the exceptional accuracy and robustness of the proposed model architecture in the diagnosis of Parkinson’s disease. Nonetheless, the footprint recognition approach outlined in this paper is not without its challenges. We treat the footprint as a holistic input, which optimizes memory usage for the entire dataset while enabling the deep network to discern the intricate relationships within the footprint. However, this approach does come with limitations, primarily in its ability to focus on the temporal dynamics of the footprint. Moving forward, we envision adopting a temporal methodology to learn the dynamic characteristics of sole pressure distribution. This innovation is poised to enhance the accuracy of footprint recognition in the future.
Author Contributions
Conceptualization, L.M. and H.H.; methodology, L.M.; software, L.M.; validation, L.M., H.H.; formal analysis, L.M.; investigation, L.M.; resources, H.H.; data curation, L.M.; writing—original draft preparation, L.M.; writing—review and editing, L.M.; visualization, L.M.; supervision, L.M.; project administration, H.H.; funding acquisition, H.H. All authors have read and agreed to the published version of the manuscript.
Funding
This work was partially supported by the National Natural Science Foundation of China (61672210), the Major Science and Technology Program of Henan Province (221100210500), and the Central Government Guiding Local Science and Technology Development Fund Program of Henan Province (Z20221343032).
Institutional Review Board Statement
The study was conducted in accordance with the Declaration of Helsinki, and approved by the Institutional Review Board (or Ethics Committee) of The First Affiliated Hospital of Henan University of Science and Technology (protocol code 2023-469, date of approval 8 June 2023).
Informed Consent Statement
Informed consent was obtained from all subjects involved in the study.
Data Availability Statement
The data presented in this study is available on request from the corresponding author.
Conflicts of Interest
The authors declare no conflicts of interest.
References
- Parkinson, J. An essay on the shaking palsy. J. Neuropsychiatry Clin. Neurosci. 2002, 14, 223–236. [Google Scholar] [CrossRef]
- Poewe, W.; Seppi, K.; Tanner, C.M.; Halliday, G.M.; Brundin, P.; Volkmann, J.; Schrag, A.-E.; Lang, A.E. Parkinson disease. Nat. Rev. Dis. Primers 2017, 3, 1–21. [Google Scholar] [CrossRef] [PubMed]
- Sun, Y.; Cheng, Y.; You, Y.; Wang, Y.; Zhu, Z.; Yu, Y.; Han, J.; Wu, J.; Yu, N. A novel plantar pressure analysis method to signify gait dynamics in Parkinson’s disease. Math. Biosci. Eng. 2023, 20, 13474–13491. [Google Scholar] [CrossRef]
- Zou, J.; Zhang, C.; Ma, Z.; Yu, L.; Sun, K.; Liu, T. Image feature analysis and dynamic measurement of plantar pressure based on fusion feature extraction. Trait. Du Signal 2021, 38, 1829–1835. [Google Scholar] [CrossRef]
- Hoffmann, R.; Brodowski, H.; Steinhage, A.; Grzegorzek, M. Detecting walking challenges in gait patterns using a capacitive sensor floor and recurrent neural networks. Sensors 2021, 21, 1086. [Google Scholar] [CrossRef]
- Hu, X.Y.; Duan, Q.S.; Tang, J.P.; Chen, G.S.; Zhao, Z.; Sun, Z.L.; Chen, C.; Qu, X.D. A low-cost instrumented shoe system for gait phase detection based on foot plantar pressure data. IEEE J. Transl. Eng. Health Med. 2024, 12, 84–96. [Google Scholar] [CrossRef] [PubMed]
- Liu, Q.; Sun, W.B.; Peng, N.; Meng, W.; Xie, S.Q. DCNN-SVM-based gait phase recognition with inertia, EMG, and insole plantar pressure sensing. IEEE Sens. J. 2024, 24, 28869–28878. [Google Scholar] [CrossRef]
- Zhang, G.; Hong, T.T.-H.; Li, L.; Zhang, M. Automatic detection of fatigued gait patterns in older adults: An intelligent portable device integrating force and inertial measurements with machine learning. Ann. Biomed. Eng. 2025, 53, 48–58. [Google Scholar] [CrossRef]
- Iskandar, A.; Alfonse, M.; Roushdy, M.; El-Horbaty, E.M. Biometric systems for identification and verification scenarios using spatial footsteps components. Neural Comput. Appl. 2024, 36, 3817–3836. [Google Scholar] [CrossRef]
- Ascioglu, G.; Senol, Y. Design of a wearable wireless multi-sensor monitoring system and application for activity recognition using deep learning. IEEE Access 2020, 8, 169183–169195. [Google Scholar] [CrossRef]
- Ascioglu, G.; Senol, Y. Activity recognition using different sensor modalities and deep learning. Appl. Sci. 2023, 13, 10931. [Google Scholar] [CrossRef]
- Luna-Perejón, F.; Salvador-Domínguez, B.; Perez-Peña, F.; Rodríguez Corral, J.M.; Escobar-Linero, E.; Morgado-Estévez, A. Smart shoe insole based on polydimethylsiloxane composite capacitive sensors. Sensors 2023, 23, 1298. [Google Scholar] [CrossRef]
- Li, B.; Yao, Z.; Wang, J.; Wang, S.; Wu, Q.; Wang, P.; Yang, X. Analysis of plantar pressure image based on flexible force-sensitive sensor array. In Proceedings of the 13th International Symposium on Computational Intelligence and Design (ISCID), Hangzhou, China, 12–13 December 2020; pp. 326–329. [Google Scholar]
- Oliveira, F.P.M.; Sousa, A.; Santos, R.; Tavares, J.M.R. Towards an efficient and robust foot classification from pedobarographic images. Comput. Methods Biomech. Biomed. Eng. 2012, 15, 1181–1188. [Google Scholar] [CrossRef] [PubMed][Green Version]
- Ardhianto, P.; Liau, B.-Y.; Jan, Y.-K.; Tsai, J.-Y.; Akhyar, F.; Lin, C.-Y.; Subiakto, R.B.R.; Lung, C.-W. Deep learning in left and right footprint image detection based on plantar pressure. Appl. Sci. 2022, 12, 8885. [Google Scholar] [CrossRef]
- MacDonald, E.; Larracy, R.; Phinyomark, A.; Scheme, E. Underfoot pressure-based left and right foot classification algorithms: The impact of footwear. IEEE Access 2023, 11, 137937–137947. [Google Scholar] [CrossRef]
- Wu, C.C.; Tsai, C.W.; Wu, F.E.; Chiang, C.H.; Chiou, J.-C. Plantar Pressure-Based Gait Recognition with and Without Carried Object by Convolutional Neural Network-Autoencoder Architecture. Biomimetics 2025, 10, 79. [Google Scholar] [CrossRef]
- Vaswani, A.; Shazeer, N.; Parmar, N.; Uszkoreit, J.; Jones, L.; Gomez, A.N.; Kaiser, Ł.; Polosukhin, I. Attention is all you need. In Advances in Neural Information Processing Systems 30 (NeurIPS 2017); Curran Associates, Inc.: Red Hook, NY, USA, 2017; Volume 30, pp. 5998–6008. [Google Scholar]
- Kumar, S.S. Advancements in medical image segmentation: A review of transformer models. Comput. Electr. Eng. 2025, 123, 110099. [Google Scholar] [CrossRef]
- Li, X.; Yu, J.; Jiang, S.C.; Lu, H.C.; Li, Z.Y. MSViT: Training multiscale vision transformers for image retrieval. IEEE Trans. Multimed. 2024, 26, 2809–2823. [Google Scholar] [CrossRef]
- Ramachandran, P.; Parmar, N.; Vaswani, A.; Bello, I.; Levskaya, A.; Shlens, J. Stand-alone self-attention in vision models. In Advances in Neural Information Processing Systems 32 (NeurIPS 2019); Curran Associates, Inc.: Red Hook, NY, USA, 2019; Volume 32. [Google Scholar]
- Guo, M.H.; Cai, J.X.; Liu, Z.N.; Mu, T.J.; Martin, R.R.; Hu, S.M. Pct: Point cloud transformer. Comput. Vis. Media 2021, 7, 187–199. [Google Scholar] [CrossRef]
- Zhao, H.; Jiang, L.; Jia, J.; Jia, J.; Torr, P.; Koltun, V. Point transformer. In Proceedings of the IEEE/CVF International Conference on Computer Vision, Montreal, QC, Canada, 10–17 October 2021; pp. 16259–16268. [Google Scholar]
- Crea, S.; De Rossi, S.M.M.; Donati, M.; Reberšek, P.; Novak, D.; Vitiello, N.; Lenzi, T.; Podobnik, J.; Munih, M.; Carrozza, M.C. Development of gait segmentation methods for wearable foot pressure sensors. In Proceedings of the 2012 Annual International Conference of the IEEE Engineering in Medicine and Biology Society, San Diego, CA, USA, 28 August 2012–1 September 2012; pp. 5018–5021. [Google Scholar]
- Zhang, C.; Pan, S.; Qi, Y.; Yang, Y. A Footprint Extraction and Recognition Algorithm Based on Plantar Pressure. Trait. Signal 2019, 36, 419–424. [Google Scholar] [CrossRef]
- Li, X.; He, Y.; Zhang, X.; Zhao, Q. Plantar pressure data based gait recognition by using long short-term memory network. In Proceedings of the Biometric Recognition: 13th Chinese Conference, CCBR 2018, Urumqi, China, 11–12 August 2018; Springer International Publishing: Berlin/Heidelberg, Germany, 2018; pp. 128–136. [Google Scholar]
- Zadeh, A.; Chen, M.; Poria, S.; Cambria, E.; Morency, L.P. Tensor fusion network for multimodal sentiment analysis. arXiv 2017, arXiv:1707.07250. [Google Scholar] [CrossRef]
- Krizhevsky, A.; Sutskever, I.; Hinton, G.E. ImageNet classification with deep convolutional neural networks. Commun. ACM 2017, 60, 84–90. [Google Scholar] [CrossRef]
- He, K.; Zhang, X.; Ren, S.; Sun, J. Deep residual learning for image recognition. In Proceedings of the IEEE Conference on Computer Vision and Pattern Recognition, Las Vegas, NV, USA, 27–30 June 2016; pp. 770–778. [Google Scholar]
Disclaimer/Publisher’s Note: The statements, opinions and data contained in all publications are solely those of the individual author(s) and contributor(s) and not of MDPI and/or the editor(s). MDPI and/or the editor(s) disclaim responsibility for any injury to people or property resulting from any ideas, methods, instructions or products referred to in the content. |
© 2025 by the authors. Licensee MDPI, Basel, Switzerland. This article is an open access article distributed under the terms and conditions of the Creative Commons Attribution (CC BY) license (https://creativecommons.org/licenses/by/4.0/).