Abstract
Electricity tariffs in emerging economies are often influenced by macroeconomic volatility and regulatory design, affecting both affordability and system stability. Understanding these interactions is crucial for anticipating price fluctuations and ensuring sustainable energy policy. This paper examines the influence of macroeconomic conditions on electricity tariff dynamics in Colombia by integrating econometric and machine learning approaches. Using monthly data from 2009 to 2024 and a set of 153 macroeconomic indicators condensed via principal component analysis (PCA), we assess the predictive performance of vector autoregressive (VAR), SARIMAX, and XGBoost models, as well as a hybrid VAR–XGBoost specification. Impulse-response analysis reveals that tariff components exhibit limited sensitivity to macroeconomic shocks, underscoring the buffering role of regulation and sector-specific drivers. However, forecasting exercises demonstrate that accuracy is highly component-specific: SARIMAX performs best for transmission and restrictions, and VAR dominates for distribution and losses, while the hybrid model outperforms for generation and commercialization. These findings highlight that although macroeconomic pass-through into tariffs is weak, hybrid approaches that combine structural econometric dynamics with nonlinear learning can deliver tangible forecasting gains. The study contributes to the literature on electricity pricing in emerging economies and offers practical insights for regulators and policymakers concerned with tariff predictability and energy affordability.
1. Introduction
The Colombian electricity sector has experienced persistent volatility in end-user tariffs over the last decade, driven by the interplay between regulatory mechanisms, generation costs, transmission constraints, and distribution inefficiencies. Such fluctuations have significant socioeconomic implications, particularly for regulated users, who account for nearly 70% of national demand. Increases in tariffs not only affect household welfare but also reduce the competitiveness of firms and create additional pressure on policymakers to guarantee affordable and reliable energy supply.
Beyond the regulatory formula that decomposes tariffs into generation, transmission, distribution, commercialization, restrictions, and losses, macroeconomic factors have been shown to exert a substantial influence on electricity prices. Variables such as producer price indices, exchange rate fluctuations, and economic growth have been consistently linked to electricity demand and generation costs, thereby shaping tariff dynamics [1,2]. Understanding these interactions is particularly relevant in emerging economies, where external shocks and domestic macroeconomic volatility often amplify uncertainty in energy markets.
The application of quantitative and econometric models has contributed to a deeper understanding of these dynamics. Vector autoregressive (VAR) models, in particular, have been widely used to examine interdependencies between macroeconomic indicators and energy markets, offering insights into causality and dynamic responses to shocks [3,4]. More recently, hybrid approaches combining traditional econometric tools with advanced statistical and computational methods have been introduced to improve predictive accuracy, especially in the context of electricity prices and load forecasting [5].
Despite these advances, the role of macroeconomic variables in shaping electricity tariffs has received limited attention in the Latin American context. While prior studies on electricity pricing have analyzed the effects of market design, hydrological variability, and fuel costs, limited attention has been given to how macroeconomic conditions influence tariff dynamics in regulated markets. Moreover, most forecasting applications rely exclusively on either econometric or machine learning techniques, overlooking the potential gains from hybrid approaches. This study fills these gaps by integrating macroeconomic factors through principal component analysis and comparing econometric, machine learning, and hybrid frameworks to assess their predictive performance. By focusing on the Colombian electricity market—an emerging economy with a unique regulatory design—this paper contributes novel evidence on how macroeconomic uncertainty interacts with tariff formation and offers methodological advances for tariff forecasting under regulation. Specifically, we combine principal component analysis (PCA) to extract latent macroeconomic dimensions, vector autoregressive models (VAR) to capture dynamic interdependencies, and a hybrid VAR+XGBoost approach to enhance predictive performance. The contribution of this research is threefold: (i) it provides empirical evidence on the influence of macroeconomic shocks on tariff components in an emerging electricity market, (ii) it compares the performance of traditional econometric and hybrid models in tariff forecasting, and (iii) it offers insights with practical implications for policymakers, regulators, and firms operating in the energy sector.
By highlighting the interaction between macroeconomic conditions and tariff dynamics, this work contributes to the broader literature on electricity pricing, forecasting, and energy policy in emerging economies, while also showcasing the potential of hybrid modeling approaches for enhancing predictive capacity in complex energy systems.
Based on previous evidence and the regulatory characteristics of the Colombian electricity market, this study tests two main hypotheses: (H1) Macroeconomic shocks exert only a limited short-term influence on electricity tariffs due to the buffering role of regulation and cost-based pricing mechanisms. (H2) Hybrid modeling approaches that combine econometric and machine learning methods can improve the forecasting accuracy of electricity tariffs compared with traditional single-model approaches. Electricity tariffs thus represent a nexus between macroeconomic stability, regulatory design, and social welfare. Understanding their dynamics is not only of academic interest but also of practical importance for policymakers seeking to enhance energy affordability and system resilience. The following section reviews the existing literature on electricity pricing, macroeconomic influences, and methodological approaches to tariff forecasting, outlining the theoretical foundations and identifying key research gaps that motivate the present study.
The remainder of this paper is organized as follows. Section 2 reviews the literature on electricity tariffs, macroeconomic influences, and forecasting methodologies. Section 3 outlines the methodological framework, including data collection, dimensionality reduction, and the econometric, machine learning, and hybrid models. Section 4 presents the empirical results, covering descriptive statistics, impulse-response analysis, and forecasting performance. Finally, Section 5 concludes with key findings, policy implications, and directions for future research.
2. Literature Review
The analysis of electricity tariffs has attracted increasing attention in both developed and emerging economies, as energy prices directly affect household welfare, industrial competitiveness, and broader economic stability. Understanding how macroeconomic dynamics influence tariff variability is particularly relevant in the context of deregulated or partially regulated electricity markets, where exogenous shocks can rapidly translate into higher costs for end users. This section reviews the literature in three stages: first, we discuss general studies on the economic and social implications of electricity pricing; second, we examine research that explicitly links macroeconomic variables to energy markets and tariff formation; and third, we review methodological approaches, including econometric and hybrid models, used in forecasting energy prices and tariffs.
2.1. Electricity Tariffs, Economic Stability, and Social Welfare
Electricity tariffs are a cornerstone of energy policy, as their variability has a direct impact on both consumers and producers. Rising prices reduce disposable income, disproportionately affecting vulnerable households, while also undermining the competitiveness of industries in global markets. Studies in the European Union and OECD countries have highlighted how sustained increases in electricity prices create inflationary pressures and constrain long-term growth [1,6]. In emerging economies, these effects are amplified due to higher energy intensity and weaker social safety nets [7].
Several contributions underline the link between electricity affordability and welfare distribution. For instance, authors of [8] argue that high retail tariffs exacerbate inequality by imposing larger proportional burdens on low-income households. In the Latin American context, as shown in [9] show that tariff reforms are often politically sensitive, as they directly affect both consumer welfare and fiscal sustainability.
The relationship between electricity pricing and competitiveness has also been studied in industrial settings. Reference [10] show that rising energy prices negatively influence productivity in energy-intensive sectors, while in [11] authors highlight that energy costs significantly shape foreign direct investment decisions in developing economies. These studies collectively suggest that electricity tariffs are not merely a regulatory issue but a macroeconomic concern with wide-ranging implications.
Within this context, tariff volatility is increasingly recognized as a critical risk factor for both households and firms. Research on energy poverty emphasizes that sustained price increases push vulnerable households into precarious conditions [12], while analyses of industrial competitiveness underscore the systemic risks of high tariffs for manufacturing exports and employment stability [13]. These findings underline the importance of incorporating macroeconomic considerations into tariff analysis, as shocks in exchange rates, inflation, or fuel costs can magnify existing vulnerabilities.
2.2. Macroeconomic Variables and Electricity Tariff Formation
Electricity tariffs in regulated and partially liberalized markets are not solely the outcome of cost-of-service formulas and market design; they also embed macroeconomic impulses that shape fuels, capital costs, and demand conditions. A consistent body of evidence shows that shocks in energy prices, exchange rates, and inflation propagate to wholesale prices and—depending on regulation and pass-through—reach retail tariffs with lags and asymmetries. In emerging economies, these channels can be amplified by import dependence on fuels and equipment, exchange-rate volatility, and procyclical demand, making macro conditions a first-order driver of tariff variability. Recent contributions have therefore moved beyond purely sectoral determinants to integrate macro shocks, often via VAR/SVAR frameworks and cross-country panels that identify causal links and quantify pass-through to electricity prices [14,15].
Oil and gas prices influence marginal generation costs—especially in systems where thermal plants set prices in scarcity periods—so wholesale electricity prices react strongly to global energy shocks. Structural VAR analyses for liberalized markets corroborate that unanticipated supply shocks in power systems and commodity markets transmit rapidly to electricity prices, with heterogeneous magnitudes across regimes and time horizons [15]. In the Colombian case, institutional features such as the reliability charge and firm-energy obligations modify bidding behavior and can magnify the price response to cost shocks [9]. These findings imply that tariff components linked to generation (G) and restrictions (R) are especially sensitive to global energy volatility.
Currency depreciation raises the local-currency cost of imported fuels (diesel, coal, gas contracts indexed to international markers) and capital inputs (turbines, transformers), which, in turn, pressure wholesale prices and regulated tariffs. Recent empirical surveys confirm robust bidirectional interactions among energy prices, exchange rates, and inflation, with ERPT intensifying under positive oil shocks [16]. In emerging economies, weaker monetary anchors and higher import exposure typically strengthen these pass-through mechanisms, heightening tariff volatility—particularly in components indexed to fuel or producer price indices (PPIs).
Producer price inflation acts as an indexation benchmark in many utility contracts and investment outlays. High-frequency studies of cost pass-through show that energy and imported-input shocks permeate producer prices, especially during inflation surges [17]. Where regulatory formulas reference PPIs, these macro shocks can translate into tariff adjustments with short lags. This underscores the importance of modeling PPIs alongside commodity prices in tariff forecasting and impulse-response analysis.
Income and price elasticities in Latin America’s residential sector are non-negligible. A recent meta-analysis finds sizable heterogeneity across countries and time, with elasticities that condition tariff incidence and the welfare cost of price spikes [18]. Regional assessments also emphasize that meeting future load growth under macro uncertainty requires pricing frameworks that internalize demand responses—otherwise, excess volatility in wholesale markets will spill into tariffs [19]. These results justify incorporating macro demand indicators (e.g., activity, employment) into tariff models and scenario analyses.
Cross-country panel evidence indicates that power-market reforms and country-specific features—income level, consumption structure, and regulatory governance—are key determinants of electricity price–cost margins, interacting with macro shocks in shaping retail outcomes [14]. In Colombia, recent research finds that design elements such as the reliability charge can elevate spot prices on average, suggesting that institutional rules may amplify or dampen macro shock transmission to tariffs [9]. Consequently, macro-structural modeling that nests both design rules and macro variables is preferable to purely sectoral or purely macro approaches.
Recent studies have deepened the understanding of how macroeconomic cycles influence energy dynamics in emerging economies. In [20], Li et al. (2022) show that energy intensity tends to decline during economic expansions and increase during recessions, revealing a clear cyclical sensitivity of energy use to aggregate demand fluctuations. Moreover, they identify a nonlinear relationship between business cycles and energy intensity, moderated by foreign direct investment (FDI) and the level of economic development. These findings reinforce the view that macroeconomic volatility—through mechanisms such as growth slowdowns, inflation, and investment shocks—translates into structural adjustments in energy consumption and cost formation. Incorporating these insights into tariff modeling is therefore essential, as electricity prices in emerging economies may reflect not only regulatory and sectoral factors but also broader cyclical pressures and investment conditions affecting energy supply chains.
Taken together, the literature supports a multi-channel view: (i) fuel and commodity shocks drive wholesale prices; (ii) exchange-rate movements modulate local-cost exposure and capital-goods pricing; (iii) inflation and PPIs govern indexation and contract updates; (iv) income and demand shape incidence and dynamic feedback; and (v) market design conditions how these macro shocks reach end-user tariffs. This motivates empirical strategies that combine macro factor extraction with VAR/SVAR impulse responses and forecasting models able to capture nonlinearity and time-varying pass-through—precisely the approach adopted in this study.
2.3. Empirical Framework
The modeling of electricity tariffs and prices has traditionally relied on econometric frameworks that capture the dynamic interplay between macroeconomic indicators, energy costs, and demand fluctuations. However, the increasing availability of high-frequency data and advances in computational techniques have expanded the methodological toolkit, allowing for the integration of machine learning (ML) and hybrid approaches to improve forecasting accuracy.
Vector autoregressive (VAR) and structural VAR (SVAR) models have been widely employed to assess the influence of macroeconomic variables on energy markets. For instance, reference [3] showed how VAR techniques can identify causal relationships between energy consumption and economic growth in oil-exporting countries. Similarly, reference [4] applied a VAR framework to Nigeria, highlighting significant feedback effects between macroeconomic shocks and electricity consumption. These models remain valuable for impulse-response analysis and variance decomposition, offering interpretability and causal insights. Yet their performance in forecasting is often limited under nonlinearities and structural breaks [2,21].
With the rise of data-driven modeling, ML algorithms have increasingly been applied to electricity price and demand forecasting. Techniques such as random forests, support vector machines (SVMs), and gradient boosting have demonstrated superior performance in capturing nonlinear dependencies compared to traditional econometrics [22,23]. Recent works show that ensemble learning methods, including XGBoost, outperform linear models in short-term price forecasting across deregulated markets [24]. Nevertheless, these models are often criticized for their “black box” nature and limited interpretability, which can be problematic for regulatory applications where transparency is required [25].
To reconcile interpretability and predictive accuracy, hybrid models that integrate econometric and ML techniques have gained traction. Reference [5] proposed a hybrid ARIMA–GARCH–ELM framework, showing significant gains in forecasting electricity prices. Similarly, the authors of [26] reviewed state-of-the-art algorithms for day-ahead electricity price forecasting and highlighted that hybrid approaches combining econometric structures with machine learning techniques yield improved accuracy, particularly in volatile markets. This aligns with recent trends in energy forecasting research, where methodological innovation emphasizes ensemble learning and the fusion of statistical and computational intelligence [26,27].
In summary, the literature reveals that electricity tariff dynamics are influenced by multiple channels connecting macroeconomic shocks, regulatory frameworks, and system-specific drivers. Empirical studies show that while fuel prices, exchange rates, and inflation significantly shape wholesale electricity prices, the transmission of these shocks to retail tariffs depends heavily on market design and regulatory mechanisms. Moreover, emerging research highlights the potential of hybrid econometric–machine learning models to enhance tariff forecasting accuracy in complex energy systems. However, empirical evidence for Latin American markets remains limited, particularly regarding the integration of macroeconomic dimensions into tariff prediction frameworks. This gap motivates the present study, which combines traditional VAR structures with XGBoost learning to evaluate macroeconomic influences on Colombia’s electricity tariffs.
3. Methodology
The methodological framework of this study integrates econometric modeling with machine learning techniques in order to capture the dynamic influence of macroeconomic variables on electricity tariffs and improve forecasting accuracy. The analysis follows a multi-stage process. First, we construct a comprehensive dataset combining monthly macroeconomic indicators and electricity tariff components from Colombian distributors. Data preprocessing ensures consistency through standardization and imputation of missing values. Second, we apply principal component analysis (PCA) to reduce the dimensionality of the macroeconomic dataset, extracting latent factors that synthesize common trends and mitigate multicollinearity. Third, we estimate traditional econometric models, including vector autoregressive (VAR) and seasonal autoregressive integrated moving average with exogenous regressors (SARIMAX), to model the interactions between tariffs and macroeconomic factors. Fourth, we implement the extreme gradient boosting algorithm (XGBoost) as a machine learning alternative capable of capturing nonlinear patterns in the data. Finally, we develop a hybrid VAR–XGBoost framework, where impulse-response dynamics from the VAR model are used as explanatory features within XGBoost, thus combining the interpretability of econometric analysis with the predictive power of ensemble learning. Model performance is assessed using standard forecasting metrics (RMSE, MAE), allowing for a comparative evaluation across methods. Figure 1 shows the stages of the methodology.
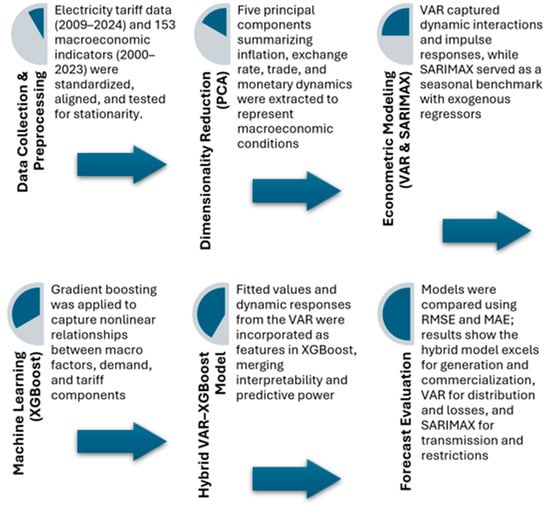
Figure 1.
Overview of the methodological framework.
The methodological choice of integrating econometric and machine learning models is grounded in both economic reasoning and empirical evidence. Traditional econometric frameworks such as VAR and SARIMAX are well suited for capturing linear dependencies, temporal dynamics, and policy-relevant impulse responses in energy markets. However, their performance tends to deteriorate when facing nonlinearities, structural breaks, and complex interactions between macroeconomic indicators and regulated tariffs. In contrast, machine learning models—particularly ensemble methods like XGBoost—excel in capturing such nonlinear patterns but lack interpretability and causal structure. Following the approach of [28], who demonstrated that hybrid frameworks combining statistical and computational intelligence can significantly improve the forecasting of macroeconomic variables such as the US Consumer Price Index (CPI), this study applies a similar rationale to the context of electricity tariffs in an emerging economy. The proposed VAR–XGBoost hybrid leverages the strengths of both paradigms: the VAR captures macroeconomic transmission mechanisms consistent with economic theory, while XGBoost enhances predictive power through residual learning. This combination provides both explanatory clarity and forecasting precision, aligning with recent methodological advances in data-driven economic analysis.
3.1. Data
The empirical analysis relies on two main datasets. The first consists of macroeconomic indicators for Colombia, compiled from national statistics and international databases, covering the period from February 2000 to September 2023. This dataset includes 153 monthly variables spanning fiscal receipts, producer and consumer price indices, exchange rates, monetary aggregates, credit, labor market indicators, trade balances, construction costs, and measures of consumer and business confidence. Such broad coverage allows for capturing multiple channels through which macroeconomic dynamics may affect electricity tariffs. Colombia offers a representative case of an emerging economy with a regulated yet market-linked electricity sector, where tariff dynamics are shaped by both macroeconomic volatility and regulatory design. The selected period ensures data consistency following the adoption of CREG’s tariff unbundling scheme and includes relevant macroeconomic episodes—such as commodity price shocks, exchange rate fluctuations, and the COVID-19 disruption—that provide a comprehensive environment to test model robustness. The macroeconomic dataset, covering a broad range of fiscal, monetary, and real-sector variables, complements the tariff information and enables the evaluation of pass-through mechanisms between macro conditions and electricity prices.
The second dataset comprises electricity tariff information from 16 major Colombian electricity distributors, collected from January 2009 to June 2024. For each distributor, the series reflects the tariff applicable to regulated users under low-voltage service conditions, consistent with national regulatory definitions. The tariff structure is disaggregated into six components: generation (G), transmission (T), distribution (D), commercialization (C), restrictions (R), and losses (PR). A national monthly average was computed across distributors to obtain a homogeneous series suitable for aggregate analysis (see supplementary material).
Preprocessing involved handling missing values, standardization, and alignment of the two datasets. In the macroeconomic dataset, missing entries were imputed using simple averaging of adjacent periods, while in the tariff dataset incomplete early observations were dropped to avoid distortion. All series were converted into logarithmic transformations when required to stabilize variance and ensure comparability. Prior to modeling, stationarity was tested using the Augmented Dickey–Fuller (ADF), Phillips–Perron (PP), and Kwiatkowski–Phillips–Schmidt–Shin (KPSS) procedures. Series failing these tests were differenced or transformed accordingly.
This combined database provided the foundation for subsequent dimensionality reduction and modeling, ensuring consistency between macroeconomic shocks and tariff dynamics across the studied period.
The inputs include (i) five principal components summarizing macroeconomic conditions (Dim1–Dim5), (ii) control variables representing system dynamics (electricity demand, hydro generation, fossil generation), and (iii) lagged values of each tariff component to capture autoregressive behavior. The outputs correspond to the forecasted values of each electricity tariff component—generation (G), transmission (T), distribution (D), commercialization (C), restrictions (R), and losses (PR)—as well as the overall tariff index (CU_total). For the hybrid VAR–XGBoost model, the fitted values and impulse-response features derived from the VAR stage were included as additional inputs to the XGBoost algorithm, enhancing its ability to capture nonlinearities while preserving interpretability.
In summary, the study uses monthly data combining 153 macroeconomic indicators (2000–2023) and electricity tariffs from 16 Colombian distributors (2009–2024). Tariffs are disaggregated into six components—generation, transmission, distribution, commercialization, restrictions, and losses—aligned with the national regulatory structure. Macroeconomic indicators include prices, exchange rates, credit, fiscal variables, and labor statistics from official national and international sources. All series were standardized, log-transformed when appropriate, and synchronized to ensure temporal consistency.
3.2. Dimensionality Reduction
Given the large number of macroeconomic indicators in the dataset, the application of all series in their original form would lead to overparameterization and multicollinearity in subsequent models. To address this, we applied Principal Component Analysis (PCA), a widely used technique for dimensionality reduction that transforms correlated variables into a smaller set of uncorrelated components [29].
Let the macroeconomic dataset be represented by a matrix , where denotes the standardized value of variable at time . Each principal component is obtained as a linear combination of the original variables (Equation (1)):
where are the component loadings and k < N is the number of retained components. The loadings are derived by solving the eigenvalue problem of the covariance matrix (Equation (2))
such that with representing the variance explained by the j-th component.
The proportion of variance explained (PVE) by each component is given by Equation (3):
and the cumulative variance explained by the first k components is .
3.3. Econometric Modeling (VAR/SARIMAX)
To model the dynamic interactions between electricity tariffs and macroeconomic factors, we implemented Vector Autoregressive (VAR) and Seasonal Autoregressive Integrated Moving Average with Exogenous Regressors (SARIMAX) models. These approaches are standard in macroeconometrics and energy forecasting, offering both interpretability and benchmarking for comparison with machine learning methods.
3.3.1. Vector Autoregressive (VAR)
The VAR framework allows for the modeling of multivariate time series where each variable depends on its own lags and those of other variables in the system [30]. Let be a vector of dimension k × 1, containing electricity tariffs and the selected principal components from PCA. A reduced-form VAR(p) model is expressed as (Equation (4))
where c is a k × 1 vector of intercepts, are k × k coefficient matrices, and is a white-noise error term with covariance matrix . The model enables the estimation of Impulse Response Functions (IRFs) and Forecast Error Variance Decomposition (FEVD), which provide insights into how shocks in macroeconomic components propagate to electricity tariffs over time [31].
3.3.2. Seasonal ARIMA with Exogenous Regressors (SARIMAX)
As a complementary benchmark, we employed SARIMAX models, which extend the ARIMA framework by incorporating seasonality and exogenous predictors [32]. Let denote the electricity tariff series. A general SARIMAX (p,d,q)(P,D,Q)s specification is given by Equation (5):
where is the lag operator, and are the non-seasonal AR and MA polynomials of orders p and q, and are the seasonal AR and MA polynomials of orders P and Q with periodicity s, d and D denote the degrees of non-seasonal and seasonal differencing, is the vector of exogenous regressors (the retained principal components), is the vector of coefficients. SARIMAX models provide flexibility for capturing autocorrelation, seasonality, and exogenous effects in electricity tariffs, making them a robust baseline for comparison with more advanced approaches.
3.4. Machine Learning Model (XGBoost)
To complement the econometric benchmarks, we implemented the Extreme Gradient Boosting (XGBoost) algorithm, a scalable ensemble method that has shown strong performance in energy forecasting tasks [23,24]. XGBoost builds upon the gradient boosting framework by introducing regularization and efficient optimization techniques, which enhance predictive accuracy and prevent overfitting.
The general form of a boosted prediction at time t is (Equation (6))
where is the input feature vector at time t, are regression trees belonging to the functional space , and K is the number of trees. The objective function minimized in XGBoost is (Equation (7)):
where is a differentiable loss function (e.g., squared error), and is a regularization term that penalizes model complexity: with denoting the number of leaves in tree , the leaf weights, a complexity parameter, and a regularization coefficient.
The algorithm constructs trees sequentially, where each new tree is fit to the gradient of the loss function with respect to the current prediction. The leaf weights are updated as (Equation (8))
where and are the first- and second-order gradients, and is the set of observations assigned to leaf .
In our context, the input space included the principal components extracted via PCA, lagged values of electricity tariffs, and seasonal dummies. This structure allowed the model to capture both macroeconomic drivers and temporal dependencies.
3.5. Hybrid Model (VAR + XGBoost)
While VAR models provide interpretability through impulse-response analysis and variance decomposition, their forecasting performance is often limited under structural breaks or nonlinear dynamics. Conversely, XGBoost captures nonlinearities and complex interactions but lacks an explicit causal structure. To exploit the advantages of both approaches, we implemented a hybrid VAR–XGBoost framework, consistent with recent trends in hybrid modeling for energy forecasting [5].
The hybrid procedure proceeds in two steps. First, a VAR(p) model is estimated using electricity tariffs and the macroeconomic principal components such as Equation (4). Second, the fitted values and impulse-response dynamics from the VAR are incorporated as explanatory features in the XGBoost model:
where represents the macroeconomic and tariff-related predictors, are the VAR-based forecasts, and summarizes the dynamic responses of tariffs to macroeconomic shocks over a finite horizon. The objective function of the hybrid model is analogous to the standard XGBoost optimization:
With as the regularization term controlling model complexity. This structure allows the hybrid framework to (i) retain the interpretability of VAR through shock decomposition, and (ii) improve forecasting accuracy by leveraging the nonlinear learning capability of XGBoost. The combination has been shown to outperform single-model approaches in volatile energy and financial markets [26,27].
4. Results
This section presents the empirical results derived from the proposed methodological framework. We begin with a descriptive analysis of electricity tariffs and their components, complemented by the main macroeconomic dimensions obtained through PCA. Subsequently, we report the estimation outcomes from the econometric benchmarks (VAR and SARIMAX), followed by the XGBoost model and the hybrid VAR–XGBoost approach. In addition, impulse-response functions are examined to assess the dynamic effects of macroeconomic and system-specific shocks on tariff components. Finally, the forecasting performance of all models is compared using standard accuracy metrics, highlighting the improvements achieved by the hybrid framework.
4.1. Tariff Components
The descriptive analysis provides an initial overview of the tariff components that make up the electricity price in Colombia. By examining their distribution, central tendency, and dispersion, it is possible to identify patterns of variability across generation (G), transmission (T), distribution (D), commercialization (C), restrictions (R), and losses (PR), as well as the overall tariff index (CUcal). This stage is crucial for understanding the heterogeneity among components and for highlighting potential sources of volatility that may later be linked to macroeconomic drivers.
Figure 2 presents the boxplots of the electricity tariff components, highlighting marked differences in both scale and dispersion. Generation and Distribution stand out as the most volatile elements, exhibiting wide interquartile ranges and a considerable number of outliers, which evidences the strong fluctuations that characterize these components over time. In contrast, Transmission and Restrictions display narrow interquartile ranges and minimal variability, reflecting the regulated and more predictable behavior of these charges. Commercialization occupies an intermediate position, with a moderate degree of dispersion, suggesting greater stability than generation and distribution but less than transmission. Meanwhile, Losses (PR) reveal an asymmetric distribution with several extreme values, consistent with their dependence on operational and technical efficiency. Finally, the overall tariff (CUcal) consolidates the dynamics of all components, showing a broad dispersion and multiple outliers, thereby confirming that the volatility of generation and distribution is the main driver of fluctuations in the total tariff.

Figure 2.
Tariff components and CUcal. Note: The tariff structure is disaggregated into six components: generation (G), transmission (T), distribution (D), commercialization (C), restrictions (R), and losses (PR). A national monthly average was computed across distributors to obtain a homogeneous series suitable for aggregate analysis: ultimately CUcal.
Regarding Figure 3, this displays the national average time series of the tariff components over the 2009–2024 period. The trajectories reveal heterogeneous dynamics across components. Generation exhibits the steepest upward trend, particularly after 2016, reflecting the rising costs of energy supply that directly drive the overall tariff. Distribution also shows a marked increase, though with periods of stabilization, underscoring its relevance as a structural component of the tariff. Transmission grows more gradually but consistently, which is consistent with the regulated nature of this charge and the progressive expansion of the transmission grid. In contrast, Commercialization reveals greater variability, with evident declines around 2018–2020 followed by a partial recovery, indicating sensitivity to market and regulatory adjustments.
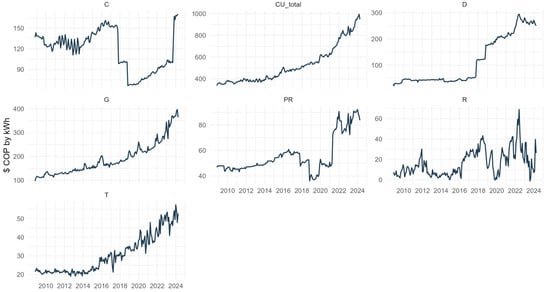
Figure 3.
Series by component (national average). Note: generation (G), transmission (T), distribution (D), commercialization (C), restrictions (R), and losses (PR).
Losses follow a rising path with intermittent fluctuations, pointing to persistent inefficiencies that contribute to tariff volatility. Restrictions present the most erratic behavior, characterized by sharp peaks and drops, which highlights their dependence on operational and system-specific conditions rather than structural trends. Finally, the overall tariff (CUtotal) consolidates these dynamics, showing a sustained upward trend that accelerates after 2016, largely driven by generation and distribution.
Together, these patterns confirm that while some components evolve predictably under regulatory or structural constraints (e.g., transmission and distribution), others such as generation, commercialization, losses, and restrictions introduce higher variability and play a central role in explaining the volatility of the aggregate tariff.
Table 1 reports the descriptive statistics of the tariff components. The results confirm that Generation has the highest average value (189.46) among individual components, followed by Distribution (114.26) and Commercialization (117.76), indicating their weight in the overall tariff. Transmission and Restrictions present the lowest averages (30.42 and 16.54, respectively), which is consistent with their regulated nature. In terms of variability, Distribution shows the largest standard deviation (90.52), suggesting strong dispersion across the sample period, while Restrictions also display relatively high variability relative to their scale. By contrast, Losses appear more concentrated, with limited dispersion around the mean (55.77). Finally, the aggregate CU_total shows a mean of 524.20 with a wide range between minimum (337.39) and maximum (995.46), reflecting the cumulative effect of volatility in its underlying components.

Table 1.
Descriptive Statistics (National Average).
4.2. Macroeconomic Dimensions
In order to reduce the dimensionality of the macroeconomic dataset and identify the main sources of common variation, a PCA was conducted on the 153 series. The analysis extracted five principal dimensions, which together account for 77.77% of the total variance. These dimensions provide a compact representation of the economic environment, enabling the integration of multiple signals into a manageable set of drivers for the modeling of energy tariff components. Table 2 summarizes the main contributing variables for each dimension and their corresponding explanatory power.
Table 2.
Contribution of variables for macroeconomic dimensions.
The first dimension (49.9%), labeled Inflation and Structural Demand Dimension, is dominated by consumer price indices across different subgroups, complemented by construction costs, monetary supply, and population. This configuration highlights how inflationary pressures and structural demand factors form the primary macroeconomic driver, shaping both cost conditions and the scale of demand. From an energy systems perspective, this dimension can be linked to overall consumption capacity and price stability, both of which influence the demand for electricity and the resilience of tariff structures. The second dimension (15.0%), named Labor Market–Exchange Rate Dimension, combines employment indicators in construction and transport sectors with exchange rate expectations and dynamics. Additional contributions from mortgage credit quality and portfolio investment flows reinforce the connection between real labor activity and external financial conditions. For the energy sector, this dimension suggests that fluctuations in tradable sectors and currency valuations can alter both input costs and financing conditions for infrastructure projects, directly affecting investment cycles in generation and distribution.
The third dimension (5.5%), or Trade–Inflation Nexus Dimension, is characterized by import and export price indices, inflation expectations, terms of trade, and selected import values. This reflects the interaction between external trade dynamics and domestic price formation. In the energy context, it underlines the relevance of international markets for fuels, equipment, and capital goods, which can transmit external shocks into domestic tariffs through cost pass-through and supply chain pressures. The fourth dimension (4.5%), designated as Trade–Monetary Policy Dimension, blends export price indices and consumer prices with policy interest rates and various loan rates. This represents the bridge between external competitiveness and domestic credit conditions. For energy systems, this dimension signals the importance of monetary policy and financing costs in shaping project feasibility, tariff adjustments, and the overall risk profile of energy investments, especially under scenarios of external price volatility.
Finally, the fifth dimension (2.9%), the Domestic Cost–Inflation Structure Dimension, is strongly driven by consumer price measures (general CPI, sectoral CPI, and trimmed mean CPI) and detailed construction cost indices. These are reinforced by inflation expectations and credit indicators, painting a picture of internal cost structures and financial constraints. In the energy domain, this dimension reflects the direct influence of domestic inflation and construction costs on project development and tariff-setting processes, where housing and infrastructure costs often overlap with energy system expansion.
It is important to note that, at this stage, the principal components are only interpreted as latent structures summarizing the macroeconomic environment. While the five retained dimensions provide a clear economic narrative—ranging from inflationary and structural demand pressures to trade, exchange rate, and monetary policy linkages—their role as explanatory factors for the tariff components remains to be validated. Subsequent modeling with the VAR framework will determine whether these macroeconomic dimensions exert statistically significant effects on the dynamics of generation, transmission, distribution, commercialization, losses, restrictions, and the overall tariff index.
4.3. VAR Results
To assess the dynamic interactions between electricity tariffs and macroeconomic conditions, we implemented a VAR framework. This approach allows us to evaluate how shocks in macroeconomic dimensions are transmitted to tariff components over time. Prior to estimation, all series were subjected to stationarity tests (ADF, PP, and KPSS), ensuring valid inference. Additionally, we included relevant control variables—electricity demand, hydro generation, and fossil-based generation—given their central role in explaining short-run adjustments in electricity tariffs and their ability to capture system-specific dynamics beyond purely macroeconomic influences.
The results of the unit root tests (ADF, PP, and KPSS) presented in Table 3 indicate that most of the tariff components and macroeconomic factors exhibit non-stationary behavior in levels. For example, G, D, C, R, and total tariff (CU) showed consistent evidence of unit roots, while some dimensions extracted from PCA (Dim4 and Dim5) and the fossil-based generation control variable exhibited stationary patterns. In several cases, mixed evidence was found across tests (e.g., transmission and hydro generation), which is not unusual given the sensitivity of unit root tests to sample size and specification choices. To ensure valid estimation within the VAR framework, all series identified as non-stationary were transformed into stationary processes. Specifically, we applied logarithmic differencing to the original data for specific variables. This transformation stabilizes the variance and eliminates stochastic trends, allowing for consistent inference in the VAR estimation. As a result, the final dataset included stationary series for each tariff component, the retained principal components, and the control variables (demand, hydro generation, and fossil generation). These controls were particularly relevant for capturing short-run adjustments in electricity tariffs driven by system-specific dynamics, complementing the broader macroeconomic dimensions.
Table 3.
Stationarity tests.
To determine the appropriate lag length for the VAR specification, we evaluate up to 10 lags based on the number of observations. The Akaike Information Criterion (AIC) indicated an optimal lag order of 10, while more parsimonious criteria such as the Schwarz Bayesian Criterion (BIC) suggested shorter lag lengths. Given the trade-off between capturing dynamic interactions and maintaining model parsimony, the final specification employed 10 lags, ensuring both model fit and stability.
The impulse response functions reported in Appendix A illustrate how tariff components react to shocks in macroeconomic dimensions and system-specific controls. A general feature across all panels is the limited amplitude of the responses: while certain fluctuations appear at isolated horizons, most responses remain statistically indistinguishable from zero once confidence bands are considered. This indicates that tariff dynamics are only weakly connected to short-term macroeconomic shocks.
More specifically, the responses of generation (G), transmission (T), and distribution (D) display occasional deviations at early horizons, yet the estimated effects quickly converge back to zero. Commercialization (C), restrictions (R), and losses (PR) show even more muted reactions, with wide confidence intervals suggesting that macroeconomic influences on these components are either negligible or overshadowed by idiosyncratic sectoral factors. Similarly, shocks to principal components (Dim1–Dim5) produce modest responses that rarely persist beyond a few months. Overall, the evidence suggests that electricity tariffs are largely insulated from broad macroeconomic disturbances, reflecting the buffering role of regulation and cost-allocation mechanisms in the Colombian market.
This weak sensitivity should not be interpreted as a limitation of the modeling approach. On the contrary, the VAR framework provides a transparent structure to quantify and validate the absence of strong macroeconomic pass-through into tariffs. The finding that most macroeconomic shocks exert minimal influence is itself relevant, as it highlights the predominance of sector-specific determinants—such as regulatory design, cost-based pricing, and energy mix composition—over external macro drivers. Moreover, the VAR structure offers predictive value by capturing the temporal dependence and internal dynamics of tariff components, even if cross-effects with macroeconomic dimensions are limited.
The IRF analysis shows that macroeconomic shocks play only a marginal role in explaining short-run tariff adjustments. This reinforces the view that forecasting exercises should rely on the internal dynamics of tariff series and a careful treatment of system-level variables (demand, hydro generation, fossil generation), rather than on the expectation of strong macroeconomic spillovers. The predictive application of the VAR model, therefore, remains justified: while not driven by large macro shocks, it provides a coherent statistical tool to project tariff trajectories under different scenarios and to quantify the uncertainty surrounding such forecasts.
4.4. Forecasting Performance: Traditional vs. AI-Based Models
This section compares four forecasting approaches for each tariff component: a VAR estimated in differences and reintegrated to levels; a SARIMAX model in levels that accounts for seasonal dynamics with exogenous regressors; an XGBoost model using only exogenous information; and a hybrid VAR–XGBoost that corrects residuals from the baseline VAR. Models were trained on 75% of the sample, tuned on 10% of observations, and tested on a strictly out-of-sample window (15%). Exogenous drivers include electricity demand, hydro and fossil generation, and the five macroeconomic dimensions (Dim1–Dim5). Figure A9, Figure A10, Figure A11, Figure A12, Figure A13 and Figure A14 (Appendix B) display only the test horizon, while Table 4 reports RMSE and MAE.
Table 4.
Forecast accuracy of alternative models across tariff components.
Two broad insights stand out. First, forecasting performance is highly component-specific: no single model dominates across the board. Second, models that capture own dynamics and seasonal regularities tend to outperform those relying solely on contemporaneous exogenous signals. In other words, tariff components exhibit a strong degree of path dependence that cannot be replaced by external regressors.
Transmission (T) illustrates this pattern. SARIMAX provides the most accurate forecasts, closely matching the observed path (RMSE = 4.11; MAE = 3.57), while the VAR is a credible alternative (RMSE = 5.61; MAE = 4.68). In contrast, both the hybrid and XGBoost deteriorate substantially (RMSE = 23.58 and 15.69, respectively), underscoring that this series is driven primarily by its own autoregressive and seasonal structure. Generation (G) behaves very differently. Here the hybrid VAR–XGBoost achieves the best accuracy (RMSE = 24.07; MAE = 18.87), significantly improving on the plain VAR (RMSE = 50.06) and outperforming SARIMAX and XGBoost alone (RMSE = 58.45 and 91.25). The visual profiles confirm that the residual-learning step is able to capture short-run fluctuations linked to demand and the changing generation mix. Distribution (D) represents a cautionary case. The VAR emerges as the only robust specification (RMSE = 23.70; MAE = 20.14), while the hybrid collapses with an explosive error (RMSE ≈ 7061). SARIMAX and XGBoost also fail to provide competitive forecasts (RMSE = 54.62 and 110.58). This episode highlights the danger of layering complex models on weak signals: when residuals contain little predictable structure, the boosting step magnifies noise instead of extracting information. For commercialization (C), the hybrid again proves useful, attaining the lowest errors (RMSE = 11.39; MAE = 8.57) compared with VAR (RMSE = 15.78) and SARIMAX or XGBoost (around RMSE = 20). This suggests modest but exploitable deviations from the VAR baseline that can be explained by system-level variables. Losses (PR) confirm the opposite: the VAR remains preferable (RMSE = 30.44; MAE = 29.99), with the hybrid, SARIMAX, and XGBoost performing worse (RMSE = 34.52, 44.64, and 39.52). In this case, exogenous drivers add virtually no forecasting value, reinforcing the view that some components evolve in a quasi-deterministic manner. Restrictions (R) close the picture. SARIMAX provides the best fit (RMSE = 20.04; MAE = 16.18), followed by XGBoost (RMSE = 22.14) and VAR (RMSE = 27.03), while the hybrid offers no improvement (RMSE = 33.66). The result reflects the dominant role of stable seasonality, which SARIMAX is best equipped to handle.
Taken together, these results show that simple linear models still hold a strong position: for D and PR, nothing surpasses VAR; for T and R, SARIMAX is unrivaled in capturing persistence and seasonality. Yet, the hybrid VAR–XGBoost proves that in contexts where short-run shocks matter—as in G and C—augmenting the VAR baseline with residual learning can yield tangible gains. In practice, a selective, component-by-component strategy emerges as the most effective: SARIMAX for T and R, VAR for D and PR, and the hybrid for G and C.
Beyond numerical fit, the forecasting exercise carries a broader implication. While macro pass-through into tariffs is generally weak, the results demonstrate that tariff components remain forecastable through their own dynamics, and occasionally through system-level covariates. Rather than endorsing a single “best” method, the evidence supports a pragmatic toolkit: rely on classical time-series models when dynamics are stable and regulated, but resort to hybrid specifications when meaningful exogenous shocks can be exploited. This combination delivers not only smaller errors but also a nuanced understanding of how different tariff components respond to structural and short-run forces.
The dataset covers the 2020–2021 pandemic period, characterized by abrupt demand reductions, supply adjustments, and temporary regulatory interventions. These shocks introduced short-term anomalies in tariff trajectories, particularly in commercialization and distribution components. The forecasting results indicate that models incorporating lagged dynamics, such as VAR and SARIMAX, were able to smooth these disruptions, confirming the resilience of the proposed frameworks even under extreme conditions.
4.5. Economic Discussion
The results presented in the previous sections reveal that electricity tariffs in Colombia are only marginally sensitive to macroeconomic shocks and that their predictive dynamics depend strongly on the structural features of each tariff component. From an economic standpoint, these findings illustrate the predominance of institutional and regulatory mechanisms over macroeconomic transmission channels in shaping end-user electricity prices.
The limited pass-through from macroeconomic shocks to tariffs can be understood as a reflection of the cost-based and stabilization features embedded in Colombia’s tariff regulation. Unlike fully liberalized markets where prices react immediately to variations in input costs, the Colombian system incorporates adjustment lags and regulated formulas that smooth volatility across components. This design effectively isolates households and small firms from abrupt fluctuations in exchange rates, commodity prices, or inflation, contributing to social and political stability in the energy sector. However, this buffering also implies reduced short-term responsiveness to macroeconomic conditions, which may constrain the capacity of the system to adapt to structural changes in production costs or investment dynamics.
Economic interpretation of the empirical results underscores that the strongest interactions with macroeconomic drivers occur in the generation (G) and commercialization (C) components. Both are partially exposed to fuel prices, exchange-rate movements, and demand-side fluctuations, explaining why the hybrid VAR–XGBoost model delivered superior forecasting accuracy for these series. In contrast, transmission (T) and restrictions (R) exhibit low volatility and high predictability, consistent with their cost-of-service nature and the presence of long-term regulatory contracts. Distribution (D) and losses (PR) represent intermediate cases: they are influenced by operational efficiency and investment cycles yet remain less responsive to macroeconomic shocks due to the predominance of technical and regulatory constraints.
This heterogeneity reflects a broader economic principle: when regulation dominates price formation, external macroeconomic variables explain less variance in tariffs, while endogenous operational factors and lagged behavior become the main determinants. Consequently, forecasting models that emphasize internal dynamics (VAR, SARIMAX) outperform data-driven algorithms unless market-linked components introduce nonlinearities that machine learning can capture.
The superior performance of the hybrid VAR–XGBoost model for generation and commercialization can be interpreted through the lens of asymmetric adjustment mechanisms. These components face short-run shocks related to demand variability, generation costs, and strategic bidding in the wholesale market, which traditional linear models may not capture. The residual-learning structure of the hybrid model identifies these nonlinearities, allowing for improved forecasts without sacrificing the economic interpretability provided by VAR impulse responses.
From a policy perspective, this result suggests that hybrid methods can serve as early-warning tools for tariff volatility, especially in components exposed to external factors such as international fuel markets or exchange-rate pressures. Their integration into regulatory planning could support more proactive pricing supervision and reduce the social costs of unexpected tariff adjustments.
The weak macroeconomic transmission found in Colombia aligns with evidence from other regulated or partially liberalized markets, such as those analyzed by [15] for the United Kingdom and [14] in cross-country studies of electricity reforms, where regulation mitigates the direct impact of global energy and monetary shocks. Conversely, studies like [20] demonstrate stronger cyclical sensitivity in economies with higher market exposure and limited tariff regulation. This contrast highlights that institutional design, rather than macroeconomic volatility alone, determines the degree of price responsiveness.
In addition, the forecasting performance observed here mirrors results in other domains of applied econometrics. Similarly to [28], who found that hybrid models improved CPI forecasting accuracy by combining macroeconomic structure with nonlinear learning, our findings confirm that electricity tariffs—though partly insulated—still contain nonlinear residual dynamics that benefit from machine learning integration.
From a broader economic perspective, these findings contribute to the debate on energy affordability and macroeconomic resilience. The results suggest that in emerging economies with regulated electricity markets, maintaining low pass-through from macroeconomic shocks protects consumers in the short run but may conceal long-term adjustment needs, especially if inflationary or exchange-rate pressures persist. The coexistence of stable and market-sensitive components implies that tariff reforms should balance predictability with flexibility, allowing gradual alignment with macro fundamentals while preserving social protection mechanisms.
Moreover, the success of hybrid forecasting models underscores the importance of combining economic theory with data-driven innovation. Econometric structures remain essential for policy interpretation, whereas machine learning enhances predictive capability in contexts characterized by complex, nonlinear adjustments. This complementarity represents a valuable methodological pathway for future energy economics research, bridging theoretical rigor with practical forecasting accuracy.
5. Conclusions
This study provides a comprehensive assessment of electricity tariff dynamics in Colombia by integrating macroeconomic drivers into forecasting frameworks that combine econometric and machine learning techniques. A critical finding is that macroeconomic shocks exhibit only marginal influence on tariff components, which reflects the buffering role of regulation and cost-based allocation mechanisms. While this outcome underscores the relative stability of the tariff-setting framework, it also suggests a limited responsiveness to external conditions, raising concerns about the adaptability of the system under persistent macroeconomic pressures.
Forecasting results reveal that methodological effectiveness is highly component-specific: SARIMAX remains superior for components dominated by persistence and seasonality (Transmission and Restrictions), VAR is robust for Distribution and Losses, and the hybrid VAR–XGBoost provides tangible gains for Generation and Commercialization. Importantly, the collapse of the hybrid model in Distribution highlights the risks of overfitting when residuals contain little predictable structure—evidence that complex models are not universally beneficial. This reinforces the need for selective, context-driven applications rather than a one-size-fits-all approach.
From a policy perspective, these results carry significant implications. First, regulators should recognize that tariff volatility is driven less by macroeconomic fluctuations and more by sectoral and regulatory design features, which should be prioritized in reform agendas. Second, predictive exercises can support planning and oversight, but models must be tailored to the specific dynamics of each tariff component. Over-reliance on black-box machine learning without careful validation risks misleading decision-making. Third, improving transparency in tariff forecasting can enhance public trust, especially in contexts where rising energy costs intersect with broader social and political sensitivities.
The results underscore the importance of maintaining regulatory mechanisms that buffer end-user electricity tariffs from short-term macroeconomic volatility while ensuring long-term flexibility to adapt to structural changes in costs and demand. For policymakers, the findings highlight that tariff stability in emerging economies depends less on macroeconomic management and more on regulatory design and cost allocation. For the scientific community, this study demonstrates the potential of hybrid econometric–machine learning models to improve predictive performance while preserving interpretability, thus contributing to the advancement of data-driven methodologies in energy economics. The empirical evidence supports both research hypotheses established in the introduction. (H1) is confirmed, as macroeconomic shocks exhibit only limited influence on electricity tariffs, consistent with the buffering effect of regulation. (H2) is also validated, since the hybrid VAR–XGBoost model achieved higher forecasting accuracy than traditional approaches, particularly for market-sensitive components such as generation and commercialization.
Future research should expand the scope beyond Colombia, testing whether the weak macroeconomic pass-through observed here also holds in other emerging economies with different regulatory frameworks. Methodologically, hybrid models warrant further exploration, particularly by embedding regime-switching, non-linear cointegration, or Bayesian approaches that may better capture structural breaks. Finally, linking tariff forecasts to welfare analysis and distributional outcomes would provide a richer foundation for policy design, ensuring that affordability and competitiveness remain at the center of electricity pricing strategies.
Supplementary Materials
The following supporting information can be downloaded at https://www.mdpi.com/article/10.3390/technologies13110495/s1. Imp_Colombia: is the aggregate of Colombia’s macroeconomic variables. Imp_cu: is the prices of each component of the energy price.
Author Contributions
Conceptualization, O.J.-B. and S.L.-E.; methodology, O.J.-B.; software, S.L.-E.; validation, O.J.-B.; formal analysis, O.J.-B. and S.L.-E.; investigation, data curation, S.L.-E.; writing—original draft preparation, O.J.-B., S.L.-E. and O.W.O.-C.; writing—review and editing, O.J.-B. and S.L.-E.; visualization, O.J.-B., O.W.O.-C. and S.L.-E. All authors have read and agreed to the published version of the manuscript.
Funding
This research was funded by Pontificia Universidad Javeriana, Cali, Colombia, within the framework of the Nuevo Doctor 2025 project. Project 20223. Topics in Economic and Energy Systems.
Institutional Review Board Statement
Not applicable.
Informed Consent Statement
Not applicable.
Data Availability Statement
Data are contained within this paper.
Conflicts of Interest
The authors declare no conflicts of interest.
Appendix A. Impulse Response Functions of Tariff Components to Macroeconomic and System-Specific Shocks

Figure A1.
Impulse response functions of tariff components to shocks in macroeconomic dimension 1 (Dim1).

Figure A2.
Impulse response functions of tariff components to shocks in macroeconomic dimension 2 (Dim2).

Figure A3.
Impulse response functions of tariff components to shocks in macroeconomic dimension 3 (Dim3).

Figure A4.
Impulse response functions of tariff components to shocks in macroeconomic dimension 4 (Dim4).

Figure A5.
Impulse response functions of tariff components to shocks in macroeconomic dimension 5 (Dim5).

Figure A6.
Impulse response functions of tariff components to shocks in hydroelectric generation.

Figure A7.
Impulse response functions of tariff components to shocks in fossil-based generation.

Figure A8.
Impulse response functions of tariff components to shocks in electricity demand.
Appendix B. Forecasting Figures by Tariff Component

Figure A9.
Forecasts for the commercialization component (C).

Figure A10.
Forecasts for the distribution component (D).

Figure A11.
Forecasts for the generation component (G).

Figure A12.
Forecasts for the losses component (PR).

Figure A13.
Forecasts for the restrictions component (R).

Figure A14.
Forecasts for the transmission component (T).
References
- Bildirici, M.E.; Kayikçi, F. Economic Growth and Electricity Consumption in Former Soviet Republics. Energy Econ. 2012, 34, 747–753. [Google Scholar] [CrossRef]
- Narayan, P.K.; Smyth, R. Multivariate Granger Causality between Electricity Consumption, Exports and GDP: Evidence from a Panel of Middle Eastern Countries. Energy Policy 2009, 37, 229–236. [Google Scholar] [CrossRef]
- Mehrara, M. Energy Consumption and Economic Growth: The Case of Oil Exporting Countries. Energy Policy 2007, 35, 2939–2945. [Google Scholar] [CrossRef]
- Oyelami, L.O.; Olomola, P.A. External Shocks and Macroeconomic Responses in Nigeria: A Global VAR Approach. Cogent Econ. Financ. 2016, 4, 1239317. [Google Scholar] [CrossRef]
- Zhang, J.; Tan, Z.; Wei, Y. An Adaptive Hybrid Model for Short Term Electricity Price Forecasting. Appl. Energy 2020, 258, 114087. [Google Scholar] [CrossRef]
- Apergis, N.; Payne, J.E. Renewable Energy Consumption and Growth in Eurasia. Energy Econ. 2010, 32, 1392–1397. [Google Scholar] [CrossRef]
- Chontanawat, J. Relationship between Energy Consumption, CO2 Emission and Economic Growth in ASEAN: Cointegration and Causality Model. Energy Rep. 2020, 6, 660–665. [Google Scholar] [CrossRef]
- Giuliano, F.; Lugo, M.A.; Masut, A.; Puig, J. Distributional Effects of Reducing Energy Subsidies: Evidence from Recent Policy Reform in Argentina. Energy Econ. 2020, 92, 104980. [Google Scholar] [CrossRef]
- Gómez Pérez, C.M.; Barrientos Marín, J. Pricing Evolution in the Colombian Electricity Market: Does Regulation Matter? Electr. J. 2023, 36, 107340. [Google Scholar] [CrossRef]
- Sadorsky, P. Trade and Energy Consumption in the Middle East. Energy Econ. 2011, 33, 739–749. [Google Scholar] [CrossRef]
- Nketiah-Amponsah, E.; Sarpong, B. Effect of Infrastructure and Foreign Direct Investment on Economic Growth in Sub-Saharan Africa. Glob. J. Emerg. Mark. Econ. 2019, 11, 219–239. [Google Scholar] [CrossRef]
- Bouzarovski, S.; Petrova, S. A Global Perspective on Domestic Energy Deprivation: Overcoming the Energy Poverty-Fuel Poverty Binary. Energy Res. Soc. Sci. 2015, 10, 31–40. [Google Scholar] [CrossRef]
- Rentschler, J.; Kornejew, M. Energy Price Variation and Competitiveness: Firm Level Evidence from Indonesia. Energy Econ. 2017, 67, 242–254. [Google Scholar] [CrossRef]
- Erdogdu, E. The Impact of Power Market Reforms on Electricity Price-Cost Margins and Cross-Subsidy Levels: A Cross Country Panel Data Analysis. Energy Policy 2011, 39, 1080–1092. [Google Scholar] [CrossRef]
- Ganepola, C.N.; Shubita, M.; Lee, L. The Electric Shock: Causes and Consequences of Electricity Prices in the United Kingdom. Energy Econ. 2023, 126, 107030. [Google Scholar] [CrossRef]
- Bigerna, S. Energy Price Shocks, Exchange Rates and Inflation Nexus. Energy Econ. 2023, 128, 107156. [Google Scholar] [CrossRef]
- Jiménez-Rodríguez, R.; Morales-Zumaquero, A. Commodity Price Pass-Through along the Pricing Chain. Rev. World Econ. 2022, 158, 23–48. [Google Scholar] [CrossRef]
- Zabaloy, M.F.; Viego, V. Household Electricity Demand in Latin America and the Caribbean: A Meta-Analysis of Price Elasticity. Util. Policy 2022, 75, 101334. [Google Scholar] [CrossRef]
- Yépez-García, R.A.; Johnson, T.M.; Andrés, L.A. Meeting the Balance of Electricity Supply and Demand in Latin America and the Caribbean; World Bank: Washington, DC, USA, 2011. [Google Scholar] [CrossRef]
- Li, T.; Li, X.; Liao, G. Business Cycles and Energy Intensity. Evidence from Emerging Economies. Borsa Istanb. Rev. 2022, 22, 560–570. [Google Scholar] [CrossRef]
- Alkhathlan, K.; Javid, M. Energy Consumption, Carbon Emissions and Economic Growth in Saudi Arabia: An Aggregate and Disaggregate Analysis. Energy Policy 2013, 62, 1525–1532. [Google Scholar] [CrossRef]
- Weron, R. Electricity Price Forecasting: A Review of the State-of-the-Art with a Look into the Future. Int. J. Forecast. 2014, 30, 1030–1081. [Google Scholar] [CrossRef]
- Lago, J.; De Ridder, F.; De Schutter, B. Forecasting Spot Electricity Prices: Deep Learning Approaches and Empirical Comparison of Traditional Algorithms. Appl. Energy 2018, 221, 386–405. [Google Scholar] [CrossRef]
- Chen, T.; Guestrin, C. XGBoost: A Scalable Tree Boosting System. In Proceedings of the 22nd ACM SIGKDD International Conference on Knowledge Discovery and Data Mining, San Francisco, CA, USA, 13–17 August 2016; pp. 785–794. [Google Scholar] [CrossRef]
- Entezari, N.; Fuinhas, J.A. Quantifying the Impact of Risk on Market Volatility and Price: Evidence from the Wholesale Electricity Market in Portugal. Sustainability 2024, 16, 2691. [Google Scholar] [CrossRef]
- Lago, J.; Marcjasz, G.; De Schutter, B.; Weron, R. Forecasting Day-Ahead Electricity Prices: A Review of State-of-the-Art Algorithms, Best Practices and an Open-Access Benchmark. Appl. Energy 2021, 293, 116983. [Google Scholar] [CrossRef]
- Marcjasz, G.; Narajewski, M.; Weron, R.; Ziel, F. Distributional Neural Networks for Electricity Price Forecasting. Energy Econ. 2023, 125, 106843. [Google Scholar] [CrossRef]
- Gur, Y.E. Development and Application of Machine Learning Models in US Consumer Price Index Forecasting: Analysis of a Hybrid Approach. Data Sci. Financ. Econ. 2024, 4, 469–513. [Google Scholar] [CrossRef]
- Stock, J.H.; Watson, M.W. Forecasting Using Principal Components from a Large Number of Predictors. J. Am. Stat. Assoc. 2002, 97, 1167–1179. [Google Scholar] [CrossRef]
- Sims, C.A. Macroeconomics and Reality. Econometrica 1980, 48, 1–48. [Google Scholar] [CrossRef]
- Lütkepohl, H. New Introduction to Multiple Time Series Analysis; Springer: Berlin/Heidelberg, Germany, 2005. [Google Scholar]
- Box, G.E.P.; Jenkins, G.M.; Reinsel, G.C. Time Series Analysis: Forecasting and Control, 4th ed.; Wiley: Hoboken, NJ, USA, 2013. [Google Scholar] [CrossRef]
Disclaimer/Publisher’s Note: The statements, opinions and data contained in all publications are solely those of the individual author(s) and contributor(s) and not of MDPI and/or the editor(s). MDPI and/or the editor(s) disclaim responsibility for any injury to people or property resulting from any ideas, methods, instructions or products referred to in the content. |
© 2025 by the authors. Licensee MDPI, Basel, Switzerland. This article is an open access article distributed under the terms and conditions of the Creative Commons Attribution (CC BY) license (https://creativecommons.org/licenses/by/4.0/).