Article

Carbon Emission Reduction Capability Analysis of Electricity–Hydrogen Integrated Energy Storage Systems

1
School of Electrical and Computer Engineering, The University of Sydney, Sydney, NSW 2006, Australia
2
School of Information Engineering, Nanchang University, Nanchang 330031, China
3
School of AI and Advanced Computing, Xi’an Jiaotong-Liverpool University, Suzhou 215400, China
4
Foshan Graduate School of Innovation, Northeastern University, Foshan 528311, China
*
Authors to whom correspondence should be addressed.
Technologies 2025, 13(10), 472; https://doi.org/10.3390/technologies13100472 (registering DOI)
Submission received: 16 September 2025 / Revised: 15 October 2025 / Accepted: 16 October 2025 / Published: 18 October 2025

Abstract

Against the dual backdrop of intensifying carbon emission constraints and the large-scale integration of renewable energy, integrated electricity–hydrogen energy systems (EH-ESs) have emerged as a crucial technological pathway for decarbonising energy systems, owing to their multi-energy complementarity and cross-scale regulation capabilities. This paper proposes an operational optimisation and carbon reduction capability assessment framework for EH-ESs, focusing on revealing their operational response mechanisms and emission reduction potential under multi-disturbance conditions. A comprehensive model encompassing an electrolyser (EL), a fuel cell (FC), hydrogen storage tanks, and battery energy storage was constructed. Three optimisation objectives—cost minimisation, carbon emission minimisation, and energy loss minimisation—were introduced to systematically characterise the trade-offs between economic viability, environmental performance, and energy efficiency. Case study validation demonstrates the proposed model’s strong adaptability and robustness across varying output and load conditions. EL and FC efficiencies and costs emerge as critical bottlenecks influencing system carbon emissions and overall expenditure. Further analysis reveals that direct hydrogen utilisation outperforms the ‘electricity–hydrogen–electricity’ cycle in carbon reduction, providing data support and methodological foundations for low-carbon optimisation and widespread adoption of electricity–hydrogen systems.

1. Introduction

Against the backdrop of the advancing global energy transition and carbon neutrality objectives, industrial park energy systems face dual pressures [1]. On the one hand, the large-scale development of renewable energy sources (RESs) such as wind and solar power presents significant opportunities for emission reduction [2]. However, their intermittent and unpredictable nature increases operational instability within systems [3]. On the other hand, the loads within these parks typically exhibit characteristics of rigidity [4], continuity, and high intensity, creating a significant mismatch with the fluctuating nature of renewable energy [5]. This limits the level of renewable energy integration and undermines the overall potential for emission reduction [6].
Electricity–hydrogen integrated energy systems (EH-ESs) are viewed as a potential solution to these contradictions [7], as their complementary multi-energy and cross-scale regulation capabilities can enhance system flexibility to some extent [8,9]. Meanwhile, EH-ESs offer a viable pathway for achieving low-carbon targets in energy-intensive industries and sectors where emission reduction proves challenging, such as chemicals, ceramics, and metallurgy [10]. However, existing research has primarily focused on capacity optimisation and equipment configuration, with limited exploration of their dynamic response mechanisms and carbon reduction efficacy under complex operational conditions [11]. Moreover, the intrinsic coupling between energy losses and carbon emissions remains unsystematically characterised, leaving the emission reduction potential of EH-ESs without a verifiable quantitative foundation.
Consequently, in-depth operational research on EH-ESs is imperative to elucidate their operational characteristics, energy loss patterns, and carbon reduction potential under various typical operating conditions. This will provide theoretical underpinnings and methodological support for subsequent low-carbon optimisation of integrated energy systems (IESs).
A significant portion of existing research has focused on the capacity scale and investment allocation of electricity–hydrogen systems and IESs. Employing methods such as multi-objective optimisation and two-level optimisation, scholars have explored optimal combinations of equipment including electrolysers (ELs), fuel cells (FCs), hydrogen storage tanks (HSTs), and battery energy storage (BES) systems, balancing economic viability against emission reduction outcomes. For example, Li K et al. 2024 developed a multi-objective pathway model integrating energy structure, industrial layout, land use, and economic costs [12]; Mu Y and Guo H employed a bilevel programming approach to achieve the coordinated optimisation of multi-energy and carbon flows, thereby enhancing long-term investment returns and decarbonisation efficiency [13]; Ref. [14] synthesised twelve carbon-neutrality pathways for industrial parks, offering strategic guidance for policymakers and park administrators; and Ref. [15] comprehensively reviewed bioeconomy strategies and synergistic carbon reduction pathways. Wu D et al. designed an IES that integrates photovoltaic (PV), wind turbine (WT), and energy storage components, achieving multi-objective coordination through the joint optimisation of operating conditions and equipment configuration [16]; additionally, one research group [17] developed a microgrid integrating hydrogen storage and carbon capture, utilisation, and storage (CCUS) technologies, proposing a two-stage scheduling model. Ref. [18] developed an industrial park energy system model covering hydrogen production, compression, transportation, and storage; Ref. [19] proposed a bilevel scheduling strategy for electricity–storage–hydrogen coupling systems; and Ref. [20] constructed a low-carbon electricity–heat–hydrogen integrated modelling framework based on mixed-integer linear programming (MILP). However, such studies are generally based on static or long-term planning scenarios, lacking characterisation of systems’ operational responses and dynamic adaptability under multi-disturbance conditions.
Another category of research focuses more on the operational processes and low-carbon operation strategies of EH-ESs, encompassing energy conversion modelling, energy storage dispatch mechanisms, and the impact of external market signals such as carbon quotas and electricity pricing mechanisms [21]. This work demonstrates the significant potential of EH-ESs in enhancing renewable energy integration and reducing carbon emissions. Ref. [22] constructed IESs for industrial parks, incorporating advanced technologies such as CCUS, hydrogen production via electrolysis, hydrogen storage, and combined cooling, heating, and power (CCHP) load management. Ref. [23] conducted scenario-based optimisation for synergistic decarbonisation and pollution reduction in energy-intensive parks; Zhu J et al. 2025 employed blockchain technology to ensure data credibility and incorporated a tiered carbon trading mechanism to optimise park-level scheduling [24]; Gu H et al. 2022 constructed a dual-level ‘city–park’ carbon quota scheduling model to coordinate interactions across different system hierarchies [25]; and Shi Z et al. 2023 proposed a carbon quota allocation and economic scheduling model spanning annual, monthly, and daily timescales, applicable to systems integrated with CCUS [26]. However, such studies are often validated solely within a single energy pathway or under idealised institutional conditions [27], lacking quantitative analysis of the coupling relationship between energy losses and carbon emissions. Furthermore, insufficient attention is paid to systems’ adaptability under typical disturbance conditions.
In summary, existing research has made significant progress in capacity optimisation, operational mechanisms, and low-carbon strategies, yet several shortcomings remain. Firstly, capacity optimisation studies emphasise long-term planning and equipment configuration while neglecting systems’ performance under short-term disturbances and dynamic operating conditions. Secondly, although research on operational optimisation and market mechanisms has partially revealed the potential of EH-ESs, it lacks a quantitative analytical framework linking energy losses to carbon emissions, making it difficult to comprehensively explain emission reduction variations under different operating conditions. Finally, current research generally pays insufficient attention to external grid dynamics and typical disturbance scenarios, limiting the applicability of findings to complex industrial environments. To address these shortcomings, further systematic research at the operational level is necessary to uncover the emission reduction potential and operational mechanisms of EH-ESs under multi-disturbance conditions.
This study proposes an evaluation framework for assessing the low-carbon performance of EH-ESs. Rather than focusing solely on capacity optimisation or isolated operational cases, the framework emphasises a comprehensive integration of modelling, quantitative evaluation, and scenario-based validation. By combining objective functions with system-level constraints and analysing system behaviour under diverse operating conditions, the framework enhances the methodological robustness of EH-ES evaluation and provides insights into these systems’ adaptability to complex energy environments. Through this approach, this study not only quantifies the decarbonisation potential of EH-ESs but also elucidates their operational trade-offs across economic, environmental, and technical dimensions. The key contributions of this study are summarised as follows:
  • Comprehensive modelling of EH-ES: A detailed system representation was established, covering EL, FC, HST, and BES, thereby capturing the structural and operational characteristics of electricity–hydrogen conversion.
  • Quantitative evaluation of carbon reduction capability: A systematic method was developed to measure the decarbonisation performance of the EH-ES across different optimisation objectives, enabling consistent comparisons among cost, emissions, and energy loss indicators.
  • Operational behaviour analysis under multi-disturbance conditions: A series of representative scenarios were designed to evaluate the system’s response and resilience, revealing its adaptability in managing external fluctuations and internal constraints.
The remainder of this study is organised as follows. Section 2 introduces the system architecture and the operation mechanism of the EH-ES, and formulates the optimisation model, including the definition of objective functions and the establishment of constraint conditions. Section 3 presents the design of solution algorithms, including linearisation techniques and multi-objective optimisation approaches. Section 4 presents a case study based on typical multi-disturbance operating conditions to validate the proposed model and evaluate its performance in terms of cost, carbon emissions, and energy losses. Section 5 concludes the study by summarising the main findings and highlighting future research directions. Specifically, the list of names for parameters, abbreviations, superscripts and subscripts is provided in Appendix A, Table A1.

2. System and Model

This section introduces the system architecture and EH-ES model.

2.1. System Architecture

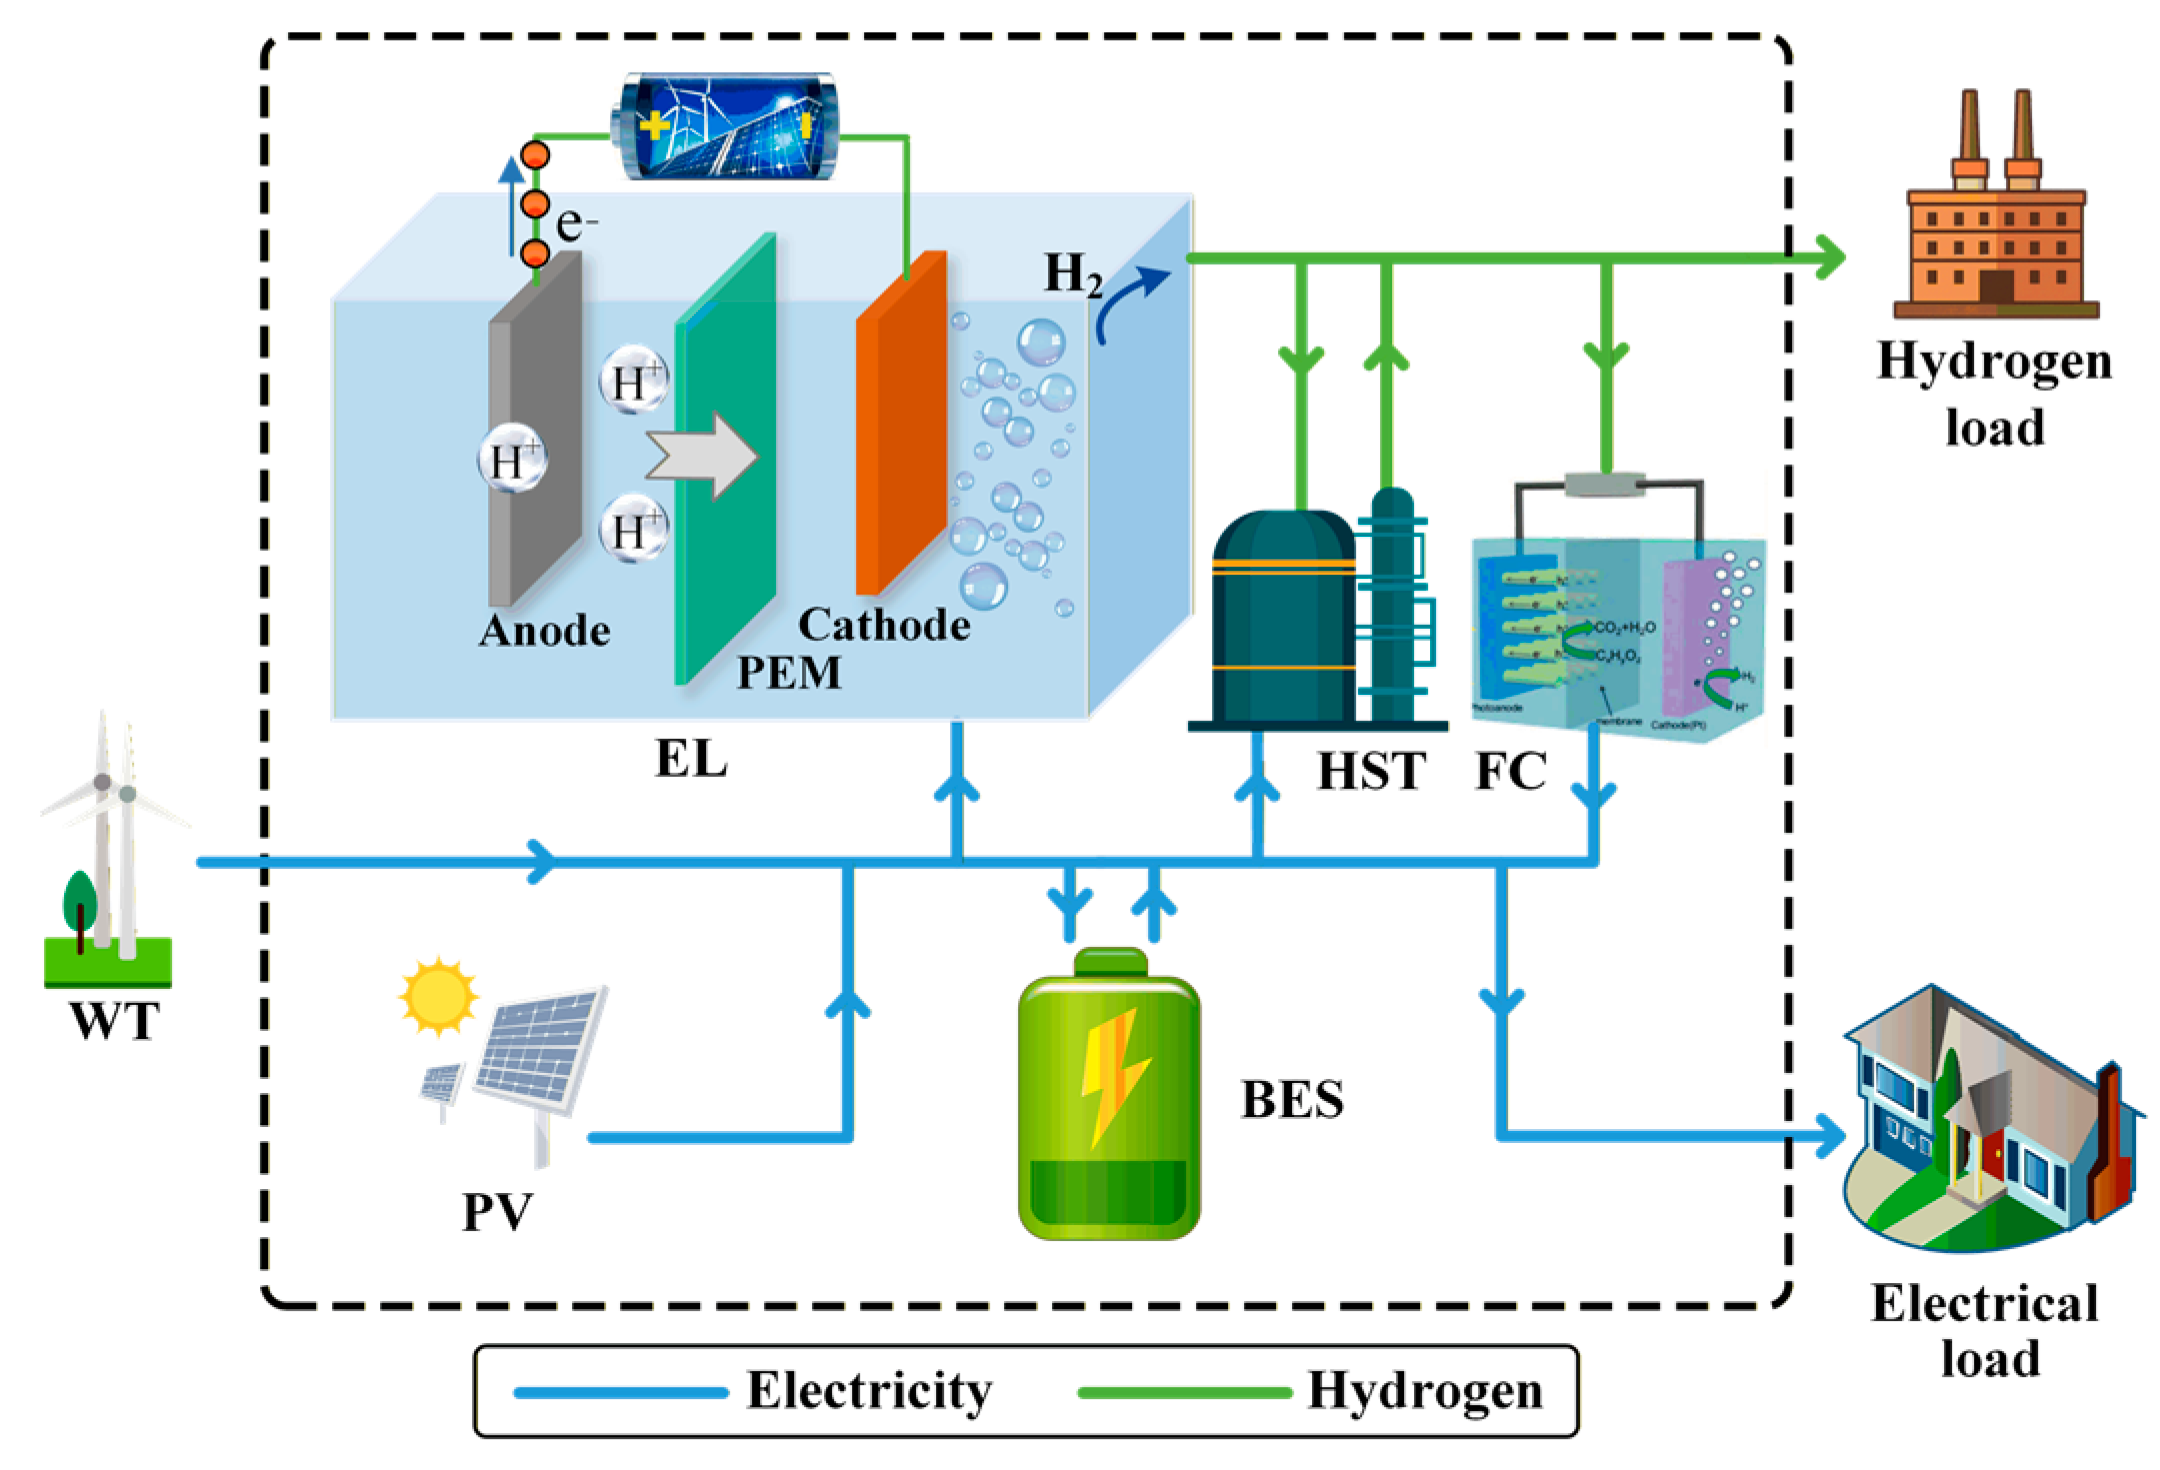
The generation, energy storage, and load sides collectively form three core modules, as illustrated in the system architecture diagram in Figure 1. These three components are mutually coupled through processes of energy flow, storage, and conversion, which exert significant influence on the setting of decision variables, the formulation of objective functions, and the design of constraints within the system capacity optimisation process.
The integrated wind–solar–electricity–hydrogen energy system employs an electricity–hydrogen hybrid energy storage approach to achieve energy distribution and scheduling. Based on the operational status of the power generation system, it can be broadly categorised into three operating conditions: the load demand is fully met; the demand cannot be met by the system, requiring energy release from the storage system for supplementation; and surplus electricity is produced, prompting the storage system to charge. Similarly, from the operational perspective of the energy storage subsystem, three conditions can be distinguished: charging and discharging of batteries; hydrogen charging and release from storage tanks; and bidirectional conversion between hydrogen energy and electrical energy.

2.2. Electricity and Hydrogen Storage and Conversion Model

According to the energy usage and conversion pathways illustrated in Figure 1, the equipment operation model for the storage and conversion of hydrogen and electrical energy within the EH-ES [28] is as follows.

2.2.1. Hydrogen Energy System

The hydrogen energy system (HES) comprises hydrogen production, storage, and consumption, corresponding to the equipment for the EL, HST, and FC.
  • The HES model, incorporating the state of energy (SOE) and hydrogen charging and discharging rate, can be described as Equations (1)–(3). Specifically, to ensure the model exhibits favourable scalability across temporal scales, it is essential that the energy storage state remains consistent between the initial and final time points.
    S O E ( t ) = 1 τ sc h S O E ( t 1 ) + H HST ch ( t ) H HST dc ( t ) Δ t / X HST
    S O E min S O E ( t ) S O E max
    S O E ( t initial ) = S O E ( t final )
  • The formulas for the electricity–hydrogen and hydrogen–electricity conversions of the EL and FC are shown in Equations (4) and (5).
    H EL ( t ) = π h , e η EL P EL ( t )
    η FC H FC ( t ) = π h , e P FC ( t )
  • The charging and discharging of the HSTs are constrained by the maximum charging rate, which limits hydrogen flow. Meanwhile, the electricity consumed by the com-pressor during hydrogen compression is also accounted for in Equations (6)–(13).
    0 H HST ch η HST ch X HST
    0 H HST dc η HST dc X HST
    0 H HST ch ( t ) H HST ch , max B HST ch ( t )
    0 H HST dc ( t ) H HST dc , max B HST dc ( t )
    H EL ( t ) > H load ( t ) B HST ch ( t ) = 1
    H EL ( t ) < H load ( t ) B HST dc ( t ) = 1
    0 B HST ch ( t ) + B HST dc ( t ) 1
    P HST cp ( t ) = η HST cp H HST ch ( t )

2.2.2. Battery Energy Storage

  • The BES model, incorporating the state of charge (SOC) and charging and discharging efficiency, can be described as Equations (14)–(16). Like HES, BES must also maintain consistency between the initial state and the final state.
    S O C ( t ) = ( 1 τ sc e ) S O C ( t 1 ) + η e , ch P BES ch ( t ) P BES dc ( t ) / η e , dc Δ t / X BES
    S O C min S O C ( t ) S O C max
    S O C ( t initial ) = S O C ( t final )
  • The BES must likewise account for the maximum charging and discharging rates, while simultaneous charging and discharging are not permitted. The specific formula is as shown in Equations (17)–(21).
    P BES ch , max = η BES ch X BES
    P BES dc , max = η BES dc X BES
    0 P BES ch ( t ) P BES ch , max B BES ch ( t )
    0 P BES dc ( t ) P BES dc , max B BES dc ( t )
    B BES ch ( t ) + B BES dc ( t ) 1

2.3. Objective Function Settings

This section defines the optimisation objective functions to characterise the system’s core requirements in terms of economic efficiency, low-carbon performance, and energy efficiency. By introducing three types of objective functions—cost minimisation, carbon emission minimisation, and energy loss minimisation—it comprehensively reflects the multidimensional trade-offs encountered during the operation of the EH-ES. Simultaneously, integrating these objectives with global optimisation variables not only provides a direction for subsequent constraint formulation but also lays the groundwork for applying multi-objective optimisation algorithms.

2.3.1. Global Optimisation Variables

The optimisation variables established in this paper primarily consider the capacity of the EH-ES, while simultaneously incorporating operational variables such as multi-energy purchase and sale, which enables a more effective optimised configuration for the system’s energy supply. The specific variables and classifications are shown in Table 1.

2.3.2. Cost Minimisation

The cost structure considers equipment investment, operation and maintenance, loss in BES lifespan, and electricity procurement costs, as Equation (22).
min   C = C ic + C om   + C ep + C ll C es
  • The equipment configuration, operation, and maintenance costs are calculated based on equipment capacity and unit price, while the equivalent annualised cost is converted into a quarterly value, as Equations (23)–(25).
    C ic   = σ Ψ CFG C ic   σ / 4
    C ic   σ = X σ c σ r σ 1 + r σ y σ 1 + r σ y σ 1 σ Ψ CFG
    C om   = σ Ψ CFG c om σ c σ X σ / 4
  • The costs of electricity purchase and sale and loss in BES lifespan are calculated, as in Equations (26)–(29).
    C ς = c ς Π ς Δ t ς Ψ OPR
    C ς = C ep C ll C es
    c ς = c ep ( t ) c ll c es ( t ) T
    Π ς = P ep ( t ) P BES ch ( t ) + P BES dc ( t ) P es ( t )

2.3.3. Carbon Emission Minimisation

The EH-ES and hydrogen energy substitution model can effectively reduce the system’s carbon emissions, whose sources include purchased electricity energy and equipment configuration, as Equation (30).
min   E = E ep + E ic
  • The calculation of carbon emissions from purchased energy is given as Equation (31).
    E ep = e cef ( t ) P ep ( t ) Δ t
  • The calculation of equipment configuration carbon emissions is given in Equation (32), with the service life converted into a quarterly value.
    E ic = σ Ψ CFG e ic σ X σ / 4 y σ

2.3.4. Energy Loss Minimisation

The energy loss function is designed to quantify energy losses during computational energy conversion and storage processes, as Equations (33)–(37).
min   L = L EL + L FC + L HST + L BES
L ς = ( 1 l ς ) Π ς Δ t ς Ψ OPR
L ς = L EL L FC L HST L BES
l ς = η EL η FC τ sc h η e , ch η e , dc τ sc e T
Π ς = P EL ( t ) π h , e H FC ( t ) E HST ( t ) P BES ch ( t ) P BES dc ( t ) E BES ( t )

2.4. Constraint Conditions

The constraints include three categories: energy balance, the planning boundary, and reliability.

2.4.1. Energy Balance

The energy balance equation ensures that energy supply and demand always remain consistent, as Equations (38)–(40) and (41).
  • Electrical power.
    P ge ( t ) + P ep ( t ) = P load ( t ) + P es ( t )
    P ge ( t ) = P wt ( t ) + P pv ( t ) + P FC ( t ) + P BES dc ( t )
    P load ( t ) = P fa ( t ) + P EL ( t ) + P HST cp ( t ) + P BES ch ( t )
  • Hydrogen energy.
    H HST dc ( t ) + H EL ( t ) = H FC ( t ) + H fa ( t ) + H HST ch ( t )

2.4.2. Planning Boundary

The capacity of the equipment needs to be planned with upper and lower limits, as Equation (42).
X σ min X σ X σ max σ Ψ CFG

2.4.3. Reliability

Reliability constraints are employed to evaluate the operational reliability of the system, as Equations (43)–(44).
0 P es ( t ) χ ps P ge ( t )
0 P ep ( t ) χ ps P load ( t )

3. Algorithm

This section details linearisation algorithms, which are used to transform complex, multi-objective, multi-constraint problems into solvable forms, whilst simultaneously constructing Pareto-based optimisation methods to address the multi-objective nature of the problems.

3.1. Linearisation Algorithm

The original model was formulated as a mixed-integer nonlinear programming (MINLP) problem, wherein the nonlinearity primarily stemmed from two types of product terms: one involving the product of planning variables and optimisation variables, and the other involving the product of planning variables and binary variables. To transform the model into an MILP formulation [29], the former type was linearised using the auxiliary variable method, while the latter was addressed by applying the Big-M method [30].
The auxiliary variable method is implemented by introducing two variables representing the hydrogen stock in the HST and the electrical energy in the BES. Consequently, Equations (1) and (14) are rewritten as Equations (45) and (46).
S O E HST ( t ) = 1 τ sc h S O E HST ( t 1 ) + P HST ch ( t ) P HST dc ( t ) Δ t
S O C BES ( t ) = 1 τ sc e S O C BES ( t 1 ) + η e , ch P BES ch ( t ) P BES dc ( t ) / η e , dc Δ t
The Big-M method employs the approach of introducing a sufficiently large positive integer, M, to rewrite Equations (10), (11), (19), and (20), specifically expressed as Equations (47)–(52).
M 1 B HST ch ( t ) H EL ( t ) H load ( t ) M B HST ch ( t )
M 1 B HST dc ( t ) H EL ( t ) H load ( t ) M B HST dc ( t )
0 P BES ch ( t ) P BES ch , max + M 1 B BES ch ( t )
0 P BES ch ( t ) M B BES ch ( t )
0 P BES dc ( t ) P BES dc , max + M 1 B BES dc ( t )
0 P BES dc M B BES dc ( t )

3.2. Multi-Objective Optimisation Algorithm

In multi-objective optimisation, to characterise and visually represent trade-offs between objectives, this paper introduces the ε-constraint method [31] to generate a solution set of the Pareto frontier. This approach transforms one objective into a constraint condition. By progressively adjusting the constraint boundary (ε value), it generates a discrete Pareto frontier solution set. This method provides an intuitive representation of the trade-offs among objectives [32]. The implementation process of multi-objective optimisation based on the ε-constraint method is as follows:
  • Single-objective boundary determination: First, treat the primary objective as the free variable and solve the secondary objective’s value as the maximum. Subsequently, swap the objectives and solve for the secondary objective’s value as the minimum. To ensure the completeness of the solution set, appropriately contract both ends of the boundary to obtain the ε value range, as shown in Equation (53).
    ε O b j e c t i v e Secondary , min , O b j e c t i v e Secondary , max
  • Value discretisation: Divide the interval into N subintervals to generate a discrete sequence of ε values, as Equation (54).
    ε 1 , ε 2 , ε 3 , ε N
  • Iterative solution of the Pareto solution set: For each ε value, transform the sub-objectives into constraints, solve the reformulated primary objective optimisation problem, and obtain the corresponding solution and strategy, as Equations (55) and (56).
    min O b j e c t i v e Primary
    s . t . min O b j e c t i v e Secondary ε O t h e r s
  • Post-processing of frontier solution sets: Following the elimination of infeasible and redundant solutions, a discretised Pareto frontier solution set is constructed to visually illustrate trade-offs between different objectives.
Through systematic constraint management and efficient solution strategies, this method provides quantitative decision support for solving multi-objective optimisation problems. The complete algorithmic process (Algorithm 1) is as follows:
Algorithm 1. Algorithm of Pareto
Start
1Input: System parameters, power and load data
2For each two objectives
3  Initialise operation variables
4  Defining sub-objective boundary
5  Discretise the ε range into N intervals
6  For each ε
7    Transform the sub-objectives into constraints
8    Run optimisation model
9    Update and record primary objective
10  end
11  Eliminate infeasible or redundant solutions
12  Generate and evaluate Pareto frontier
13end
14Output: Pareto curve and optimal configuration
End
Equations (1)–(52) collectively constitute the complete mathematical framework for the proposed EH-ES. Specifically, Equations (1)–(13) describe the HES, encompassing the SOE dynamics of the HST and the bidirectional conversion processes of the EL and FC. Equations (14)–(21) define the operational characteristics of the BES, encompassing SOC and charge and discharge constraints. Equations (22)–(37) establish the three optimisation objectives of cost, carbon emissions, and energy losses, alongside their corresponding component cost structures and conversion loss models. Equations (38)–(44) characterise the system-wide constraints, encompassing energy balance, capacity limits, and reliability requirements. Finally, Equations (45)–(52) establish the linearisation and multi-objective optimisation workflow, transforming the original mixed-integer nonlinear problem into a solvable mixed-integer linear programming form and generating a set of Pareto optimal solutions.
Collectively, these formulations ensure the proposed model’s logical consistency, mathematical completeness, and physical interpretability, with each equation playing an indispensable role in capturing the operational behaviour and optimisation characteristics of the integrated system.

4. Case Studies

In this study, MATLAB 2024b and Gurobi solver version 11.0 [19] were used to optimise the solution on a computer with the Intel (R) Core (TM) Ultra 7 258 V, a 2.2 GHz CPU, and 32 GB of RAM. The implementation details are discussed as follows.

4.1. Case Settings

As shown in Figure 2, the WT and PV data are from a centralised 90 MW WT farm and a 110 MW PV power station around that area. Electricity load and gas load are derived from the values of an industrial park in Jiangxi Province, China, measured in 2023. Using the K-means clustering algorithm, seven typical daily profiles were generated, with a total simulation duration of 168 h. Both WT and PV outputs exhibit clear diurnal fluctuations, where PV generation peaks at noon, while wind power varies more irregularly throughout the day. The electricity and hydrogen loads show a smoother trend.
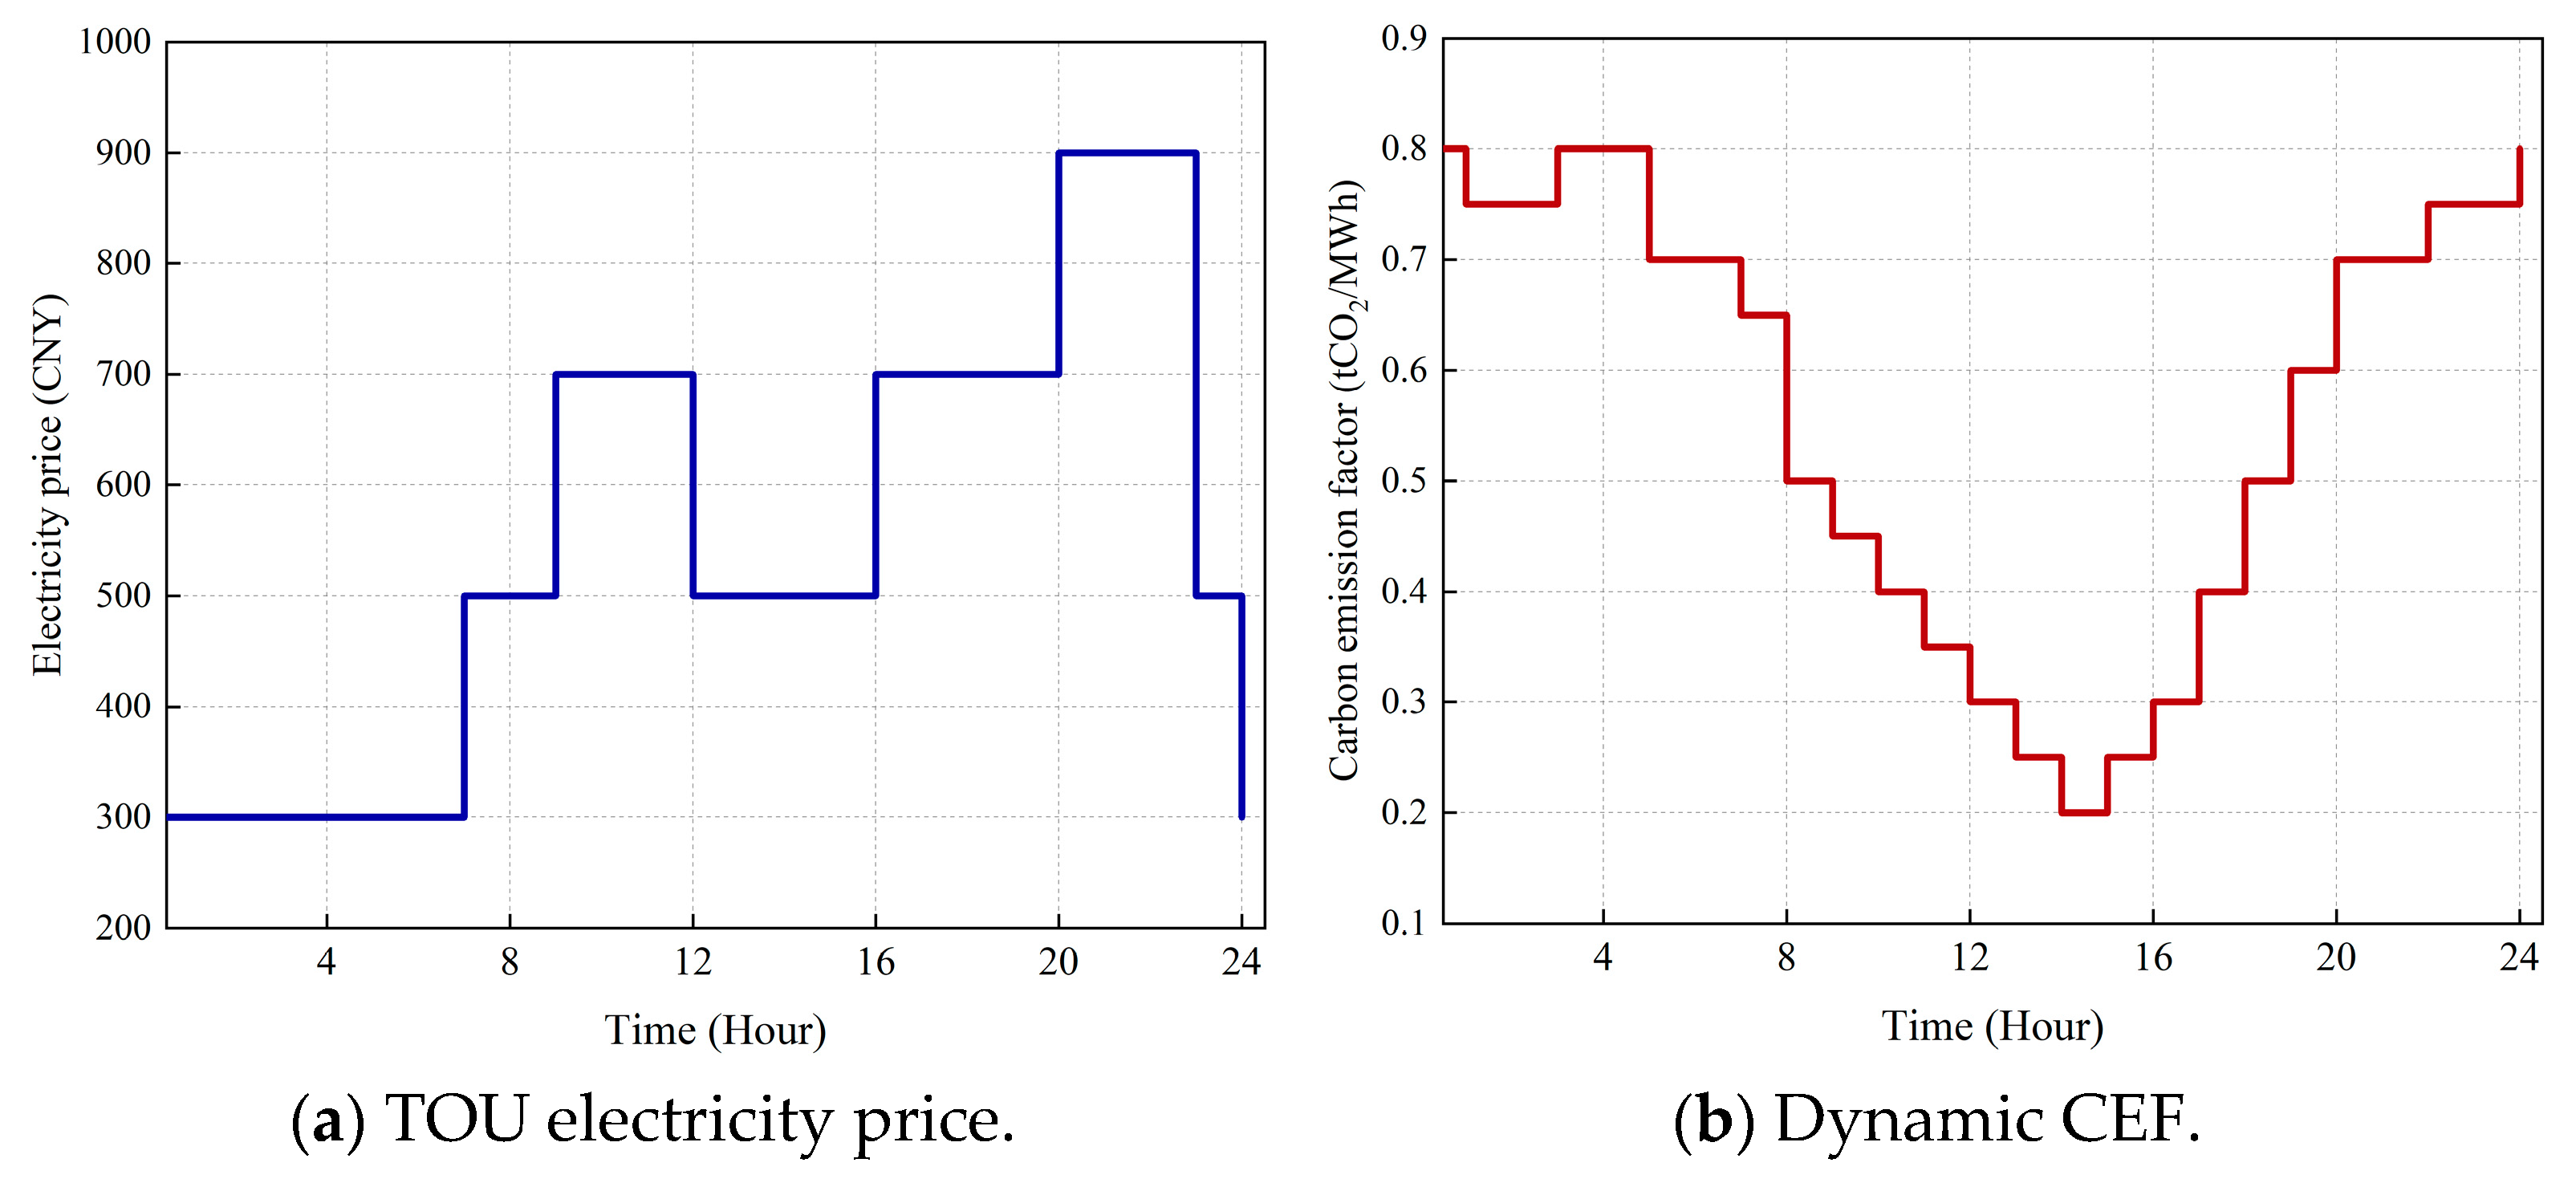
The time-of-use (TOU) electricity price is defined according to Ref. [33], with configuration parameters obtained from tariff schemes regularly published by a power grid company, which typically issues the planned TOU schedule one day in advance. The dynamic carbon emission factor (CEF) is sourced from Ref. [33], where the hourly values are derived from the carbon intensity data of grid electricity released by a utility company and subsequently updated based on the day-ahead operation plan. As illustrated in Figure 3, the TOU electricity price follows a stepped pattern with higher prices during daytime and evening peaks, while the dynamic CEF shows an opposite trend, reaching its minimum around midday when renewable generation is abundant.
Detailed parameters for the EH-ES and its operation are summarised in Appendix A, Table A2 and Table A3.

4.2. Analysis of Optimisation and Operational Results

This section presents the results of the multi-objective configuration optimisation and further analyses the system’s operational responses under the seven-day typical operating conditions.

4.2.1. Optimal Configuration Results

Table 2 presents the optimal configuration schemes for the system under different optimisation objectives. The results demonstrate that the proposed low-carbon EH-ES exhibits strong adaptability and distinctive structural characteristics in terms of equipment capacity allocation and operational strategies. During system operation, hydrogen storage plays a dominant role, with the allocated capacities for the EL and HSTs significantly exceeding those of other energy storage forms. Concurrently, despite its relatively modest scale, the BES assumes auxiliary regulation functions within the system, owing to its rapid power regulation capability. Overall, the system exhibits characteristics of hydrogen–electricity complementarity and collaborative division of labour.
When minimising carbon emissions is the objective, the system enhances self-sufficiency in green hydrogen through large-scale deployment of the EL and HSTs, achieving a significant reduction in carbon emissions, approximately 19.6%. In contrast, under a cost minimisation objective, the system prioritises external market utilisation by selling surplus clean electricity to reduce total system costs. Although the carbon reduction advantage is not fully realised, this approach effectively enhances economic benefits. The operational mode differences under distinct objectives demonstrate the system’s high flexibility in switching between economic and environmental priorities.
When minimising energy losses, the system tends to expand the scale of various equipment configurations, reducing cyclic losses from high-frequency charging and discharging of individual units through capacity redundancy. Results show that total energy losses decrease from 1186.867 MWh under the cost objective to 1093.575 MWh, a reduction of approximately 7.9%. However, this strategy proves disadvantageous in terms of both economic efficiency and emission reduction: total costs rise to CNY 19.262 × 10⁶, while carbon emissions increase to 1632.142 tCO2, representing the worst outcomes among the three scenarios. This demonstrates that prioritising energy loss minimisation as a singular objective leads to excessive system expansion, thereby sacrificing economic and environmental benefits. It underscores the necessity of multi-objective trade-off analysis.

4.2.2. Operational State Analysis

To comprehensively verify the adaptability and regulation capability of the low-carbon electricity–hydrogen integrated system, a seven-day typical-condition simulation was conducted to observe the system’s response and recovery. Day 1 represents high WT and PV output; Day 2, WT and PV shutdown; Days 3 and 6, stable operation; Day 4, factory shutdown to analyse surplus-handling mechanisms; Day 5, intermittent renewable fluctuations to test rapid response and storage coordination; and Day 7, intermittent load fluctuations to assess demand-side volatility management. In all cases, the electricity purchase-to-sale ratio is uniformly increased from 20% to 50% to evaluate how expanded external trading flexibility affects dispatch, storage interaction, and carbon-reduction performance. The system operation results are shown in Figure 4, Figure 5, Figure 6 and Figure 7.
In scenarios with abundant wind and solar resources, the system prioritises externally selling clean electricity within a 50% cap. During peak periods, when external sales reach the cap, surplus green electricity is converted into hydrogen via the EL while simultaneously charging the BES, effectively utilising excess power. Throughout this process, the HES exhibits a pronounced net charging state, with batteries primarily engaged in short-cycle power regulation and the FC predominantly operating at low loads. Overall, this operating condition demonstrates the system’s strongest carbon reduction potential, achieving both direct emission reductions through external sales and future substitution through electricity-to-hydrogen conversion. Energy losses remain moderate, primarily stemming from the bidirectional conversion processes within the EL and BES.
In scenarios where wind and solar output abruptly drop to zero, the system primarily relies on purchased electricity, with the procurement ratio rapidly reaching the 50% upper limit. When external procurement is constrained, the system compensates for the shortfall through FC and BES discharge to ensure load satisfaction. In this stage, HSTs exhibit net discharge behaviour, with BES accounting for a significant proportion of discharge. System operation becomes more reliant on the release of internal energy storage. Regarding carbon and energy performance, the carbon reduction potential under this operating condition is markedly diminished, as operations are primarily supported by purchased electricity and hydrogen-to-electricity conversion. Concurrently, the frequent charging and discharging of the FC and BES increases the system’s energy loss levels.
Under stable output and load conditions, the system’s electricity purchase and sale remain within the 50% upper limit, with extreme peak-to-trough fluctuations rarely reaching the boundary. During operation, the EL and FC undergo minor alternating cycles, with BES undertaking fine-grained rapid regulation while HSTs exhibit gradual fluctuations without abrupt charge–discharge switching. Carbon reduction potential under this operating condition is moderate. However, as the system avoids frequent overcharging and over-discharging, the number of charge–discharge cycles is significantly reduced, resulting in minimal or low energy losses.
When industrial loads drop abruptly, the system rapidly increases its external sale of clean electricity to the 50% upper limit. The EL operates at high capacity to absorb surplus power, while BES primarily focuses on charging. In this stage, HSTs undergo rapid net charging, establishing a subsequent low-carbon buffer capacity for utilisation. Under these operating conditions, the system demonstrates significant carbon reduction effects, achieving emission targets through a dual pathway of ‘external sales and hydrogen production’. Concurrently, as the primary absorption task is undertaken by the EL with minimal involvement from the FC, the system’s energy losses remain within manageable limits.
Under conditions of frequent fluctuations in wind and solar output, BES mitigates short-term power variations through high-frequency charging and discharging. During high-generation periods when external sales are constrained, the EL absorbs surplus capacity, while during low-generation periods when external purchases reach their limit, the FC provides compensation. Both the HES and BES exhibit numerous charge–discharge cycles in this operating scenario, with the former responsible for medium-to-long-term stabilisation and the latter undertaking dynamic regulation at the second-to-minute scale. This configuration yields the highest system resilience, though frequent charge–discharge cycles markedly increase energy losses. Carbon reduction effectiveness hinges on the proportion of electricity sold versus hydrogen production during high-generation periods.
During periods of significant load fluctuations, BES assumes rapid response functions, absorbing or compensating for peak power demands. When external procurement is constrained by the 50% cap and fluctuations persist, the FC provides steady-state underpinning. In this stage, external sales of clean electricity decrease as substantial power is consumed by peak demand, making external procurement more susceptible to reaching its upper limit. The level of carbon reduction depends on the degree of alignment between load fluctuations and renewable generation output; when these are mismatched, carbon reduction effectiveness is diminished. Concurrently, due to the frequent intervention of the BES and FC, the system’s energy loss level remains moderately high. Detailed operational status impacts are shown in Table 3.
Under the uniform constraint of a 50% electricity purchase-to-sale ratio, the system operation prioritises external power trading as the primary means of peak shaving and valley filling. When the electricity purchase-to-sale ratio reaches its upper limit, excess power is absorbed by the EL and HST, while the FC and BES jointly compensate for power deficits, achieving internal flexible regulation and energy balance. This mechanism exhibits distinct operational characteristics under varying conditions: during periods of high wind and solar generation coupled with factory shutdowns, the system simultaneously leverages dual pathways—selling clean electricity and hydrogen production—to maximise low-carbon benefits and achieve peak carbon reduction effects; meanwhile, during stable operation, minimal internal circulation and gentle cycling processes maintain energy losses at the lowest level. Conversely, under conditions of significant fluctuations in wind and solar generation or load demand, frequent high intensity charging and discharging by the BES and FC lead to a marked increase in energy losses. Overall, the system demonstrates a clear trade-off between economic viability, low-carbon performance, and operational efficiency.

4.3. Analysis of Carbon Emission Reduction Capability

In this section, the focus is placed on evaluating the carbon emission reduction capability of the proposed electricity–hydrogen integrated system. The electricity–hydrogen load ratio was systematically altered to examine how different operating modes influence system behaviour. Concurrently, sensitivity analyses were conducted across three key dimensions: (1) EL and FC efficiency; (2) the optimisation objectives; (3) the electricity purchase-to-sale ratio.
For each case, a parameter scan captured the corresponding system responses, with the obtained results presented and compared in the following subsections.

4.3.1. Equipment Efficiency

This section further details sensitivity analyses of the efficiency of the EL and FC to elucidate the impact of varying electrolysis-to-hydrogen load ratios on system operational performance, as shown in Figure 8. By comparing trends across three metrics—cost, carbon emissions, and energy losses—it enables a systematic evaluation of how efficiency improvements shift the operational optimum. This provides quantitative support for low-carbon operational strategies under adjusted electrolysis-to-hydrogen ratios.
The sensitivity analysis results indicate that variations in EL and FC efficiency exert a significant influence on system costs, carbon emissions, and energy losses. Firstly, concerning costs, the results indicate that neither a purely electrical load nor a purely hydrogen one yields an optimal solution for the system. When the electricity-to-hydrogen ratio reaches extreme states, total costs rise markedly, whereas a distinct cost trough emerges within a specific mixed-ratio range. This phenomenon underscores the necessity of multi-energy complementarity: synergistic configuration of electricity and hydrogen can effectively mitigate the high-cost risks associated with single-source energy supply, thereby achieving economic optimisation.
Secondly, from a carbon emission perspective, efficiency improvements shift the hydrogen load proportion corresponding to the minimum emission point upwards, manifesting as an overall rightward–downward shift in the emission curve. In other words, under high-efficiency conditions, the system favours achieving emission reduction targets by increasing the proportion of hydrogen energy. This outcome demonstrates that enhanced efficiency in both the EL and FC not only improves the environmental benefits of hydrogen utilisation but also endows the system with greater carbon reduction potential at higher hydrogen load levels.
Finally, energy loss analysis indicates that as the proportion of hydrogen loading increases, the level of losses exhibits a monotonically increasing trend. This phenomenon is primarily attributable to the inherent requirements of the electrolytic cell’s electricity-to-hydrogen conversion process, wherein the energy transformation stages inevitably introduce additional losses. Whilst the hydrogen energy pathway demonstrates superior performance in carbon reduction, it simultaneously amplifies the system’s energy losses. Consequently, optimising system operation necessitates striking a balance between carbon reduction potential and energy utilisation efficiency to achieve the dual objectives of environmental benefits and enhanced energy efficiency.

4.3.2. Objective Function

This section analyses the impact of different optimisation objectives on system operational outcomes. Comparisons are made using cost minimisation, carbon emission minimisation, and energy loss minimisation as objectives to reveal the differences in electricity-to-hydrogen ratio selection among the three approaches and their inherent conflicting relationships.
As shown in Figure 9, the results indicate that the optimal points for the three optimisation objectives are not consistent: when minimising cost is the aim, the system achieves the lowest cost at an electricity proportion of 70–80%; when minimising carbon emissions is goal, the optimal solution occurs at an approximately 90% electricity proportion; and when minimising energy loss is the objective, 100% electricity is optimal. Notably, as the hydrogen load proportion increases (and the electricity proportion decreases), energy losses rise significantly across all objectives while the curves gradually converge. This indicates that the fixed efficiency upper bound of the electrolysis–hydrogen storage–fuel cell chain determines the lower bound of losses in high-hydrogen scenarios, making it difficult for scheduling strategies to further ‘flatten’ these inherent losses. This also explains why, in this calculation example, the ‘excess electricity–hydrogen–electricity’ approach is not conducive to emission reduction and cost reduction. Instead, greater overall advantages are offered by a ‘primarily electricity and supplementarily hydrogen’ structure—where electricity provides the main energy supply and hydrogen is used directly in specific areas (such as process heat or gas requirements).
This reveals a classic ‘triangular dilemma’ between economic viability, environmental performance, and energy efficiency. Reducing carbon emissions typically necessitates increasing the hydrogen proportion, yet this elevates the accompanying energy loss levels. Conversely, prioritising loss reduction diminishes emission reduction effectiveness. When cost-driven, the system selects a relatively compromise operating point, failing to achieve simultaneous optimisation in both emission reduction and energy efficiency. This divergence implies that practical operational strategies cannot rely on a single objective. Instead, multi-objective optimisation methods are required to balance trade-offs across different dimensions.

4.3.3. Electricity Purchase to Sale Ratio

Building upon the preceding analysis of efficiency and objective function sensitivity, this section further examines the impact of the electricity purchase-to-sale ratio on system operational performance. By establishing varying external electricity procurement constraints, we analyse their underlying mechanisms affecting three key metrics—cost, carbon emissions, and energy losses—thereby revealing the coupling relationship between self-sufficiency rates and the proportion of electricity-based hydrogen loads.
As shown in Figure 10, the results indicate that increasing the proportion of externally procured electricity can significantly reduce the overall system cost. This is because this electricity partially substitutes for local electrolysis processes, thereby reducing high-cost stages. However, curve comparisons also reveal noteworthy phenomena: at a 40% procurement ratio, the cost of 100% electrical load exceeds that of 90% electrical load at a 30% procurement ratio; similarly, at a 50% external procurement ratio, the cost of a 100% electricity load remains higher than that of a 90% electricity load at a 40% external procurement ratio. This outcome indicates that relying solely on increasing the external procurement ratio is not the only path to cost reduction. By rationally adjusting the electricity-to-hydrogen load ratio, economic performance superior to that in high-external-procurement scenarios can be achieved even under lower external procurement.
In terms of carbon emissions, the overall distribution of curves across different external electricity procurement ratios exhibits certain regularities. Higher procurement ratios typically imply reduced carbon emissions, as externally procured electricity may substitute high-emission local generation processes during specific periods. Crucially, however, as the external procurement ratio increases, the carbon emission curve exhibits an overall ‘leftward shift’. This means that under conditions of higher self-sufficiency (lower external procurement ratio), the hydrogen load proportion corresponding to the system’s lowest carbon emission point is greater. This indicates that in scenarios dominated by local self-sufficiency, the marginal contribution of hydrogen utilisation towards achieving emission reduction targets is more pronounced.
The energy loss curve further reveals the interactive effects between the proportion of externally procured hydrogen and the configuration of the electricity–hydrogen load. As the external procurement ratio decreases (and the system self-sufficiency rate increases), the minimum point on the loss curve gradually shifts to the right. For instance, at a 30% external procurement ratio, the point of minimum loss occurs near approximately 70% hydrogen load. This indicates that when the system relies more heavily on self-sufficient operation, minimising energy loss can only be achieved at higher-hydrogen load ratios. In other words, increasing self-sufficiency necessitates greater reliance on hydrogen’s deep integration within operational optimisation to offset additional losses arising from multiple energy conversion stages.

4.4. Analysis of Decision Benchmarks in Multi-Objective Trade-Offs

In this section, the analysis is extended from single-objective optimisation to a multi-objective trade-off framework. The aim is to investigate how the electricity–hydrogen integrated system behaves when economic, environmental, and technical objectives conflict with one another. To this end, Pareto front analysis is employed to characterise the trade-offs among cost, carbon emissions, and energy losses.
To further reveal the system’s responsiveness under different external and technical conditions, each Pareto analysis is combined with a targeted sensitivity study. The correspondence between trade-off pairs and sensitivity analyses is summarised in Table 4.

4.4.1. Cost–Emission Objectives

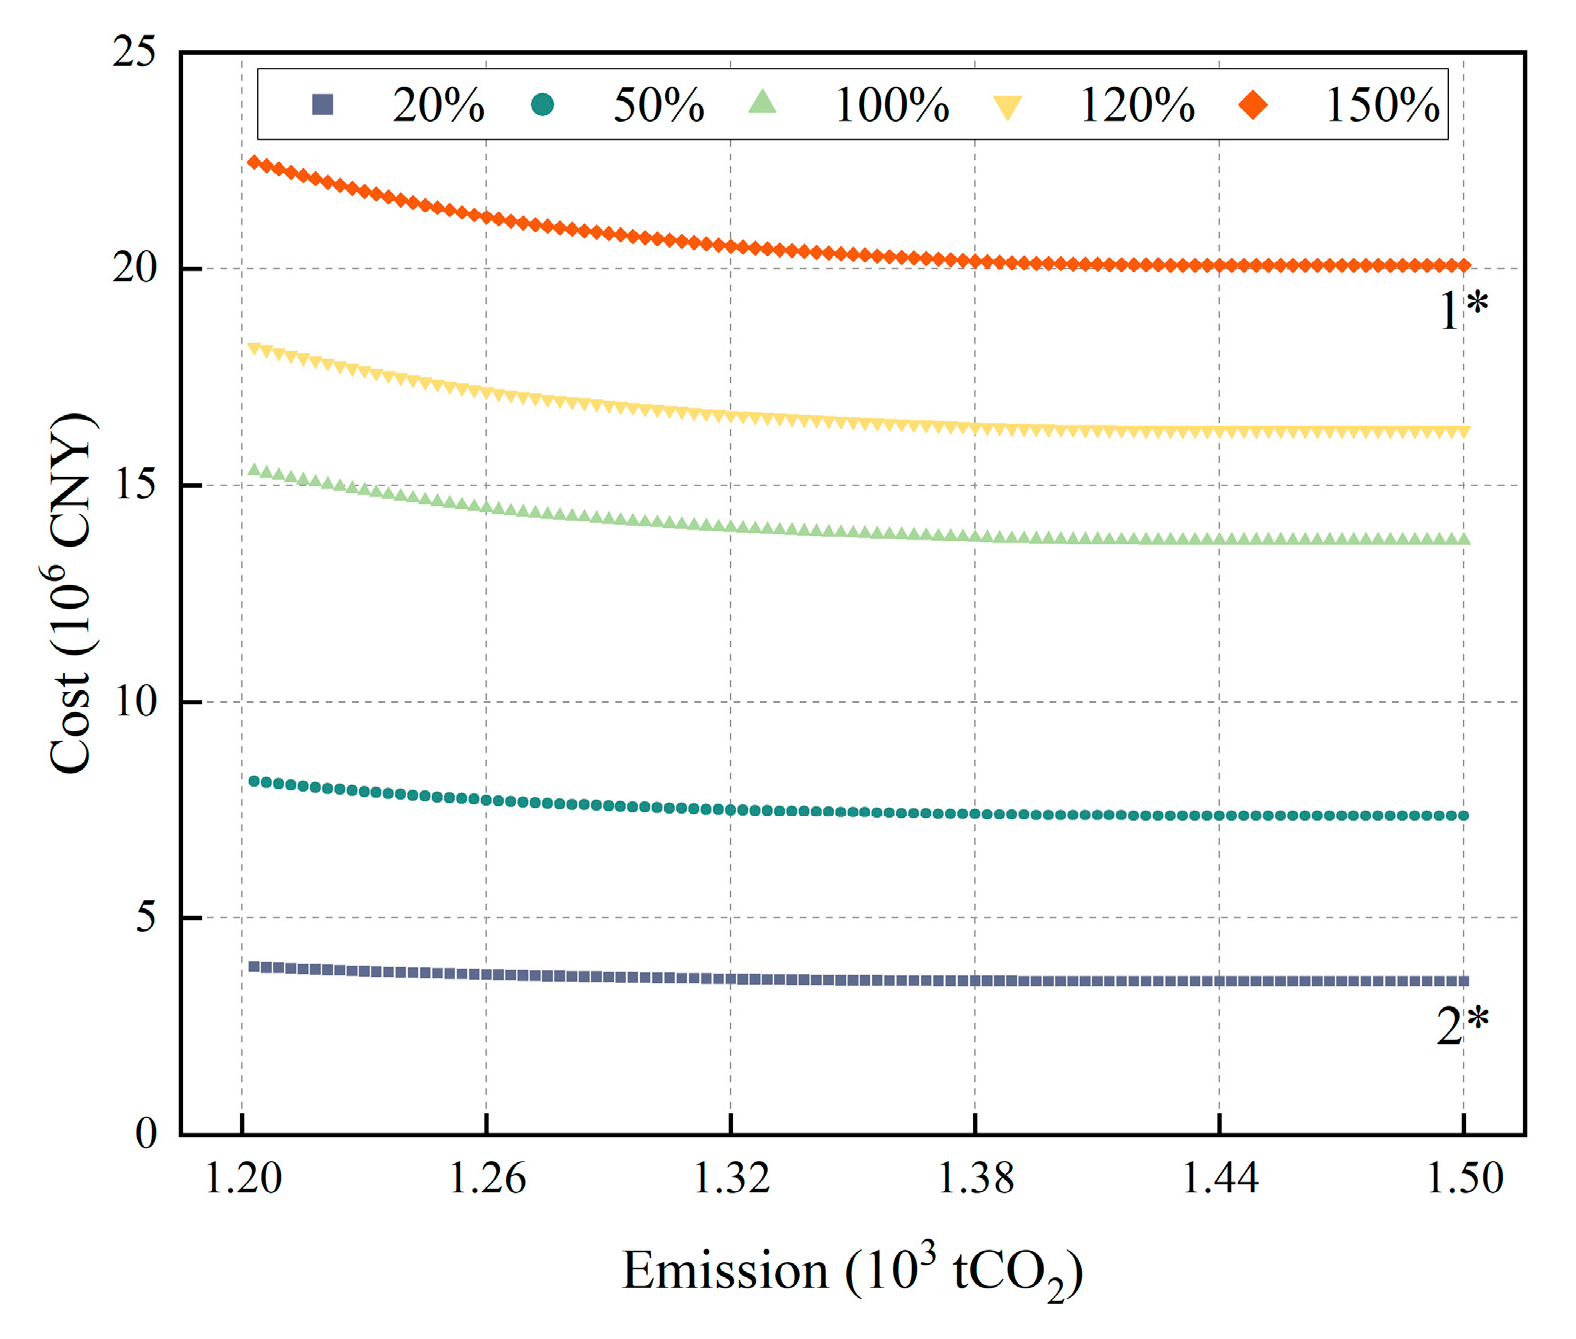
In the Pareto frontier analysis of dual cost and carbon emission targets, significant variations in curve morphology can be observed across different equipment price levels, shown in Figure 11. When equipment prices remain at the benchmark level (100%), the right-hand region of the curve flattens, yet the fitted marginal slope remains as high as 288 CNY/tCO2, as shown by 1*. This indicates that under current market conditions, the opportunity cost of emission reduction far exceeds the prevailing carbon price (approximately 94 CNY/tCO2), thereby lacking direct economic incentives. Further comparison reveals that only when equipment prices decline to approximately 20% of the benchmark level does the marginal slope of the curve fall below the carbon price threshold, as shown by 2*, thereby rendering carbon reduction economically viable. This outcome indicates that equipment investment costs constitute the core constraint on the economic viability of low-carbon operations. Only through significant reductions in equipment prices achieved via technological advancement or large-scale deployment can carbon reduction measures demonstrate tangible economic benefits within the carbon market mechanism.

4.4.2. Cost–Loss Objectives

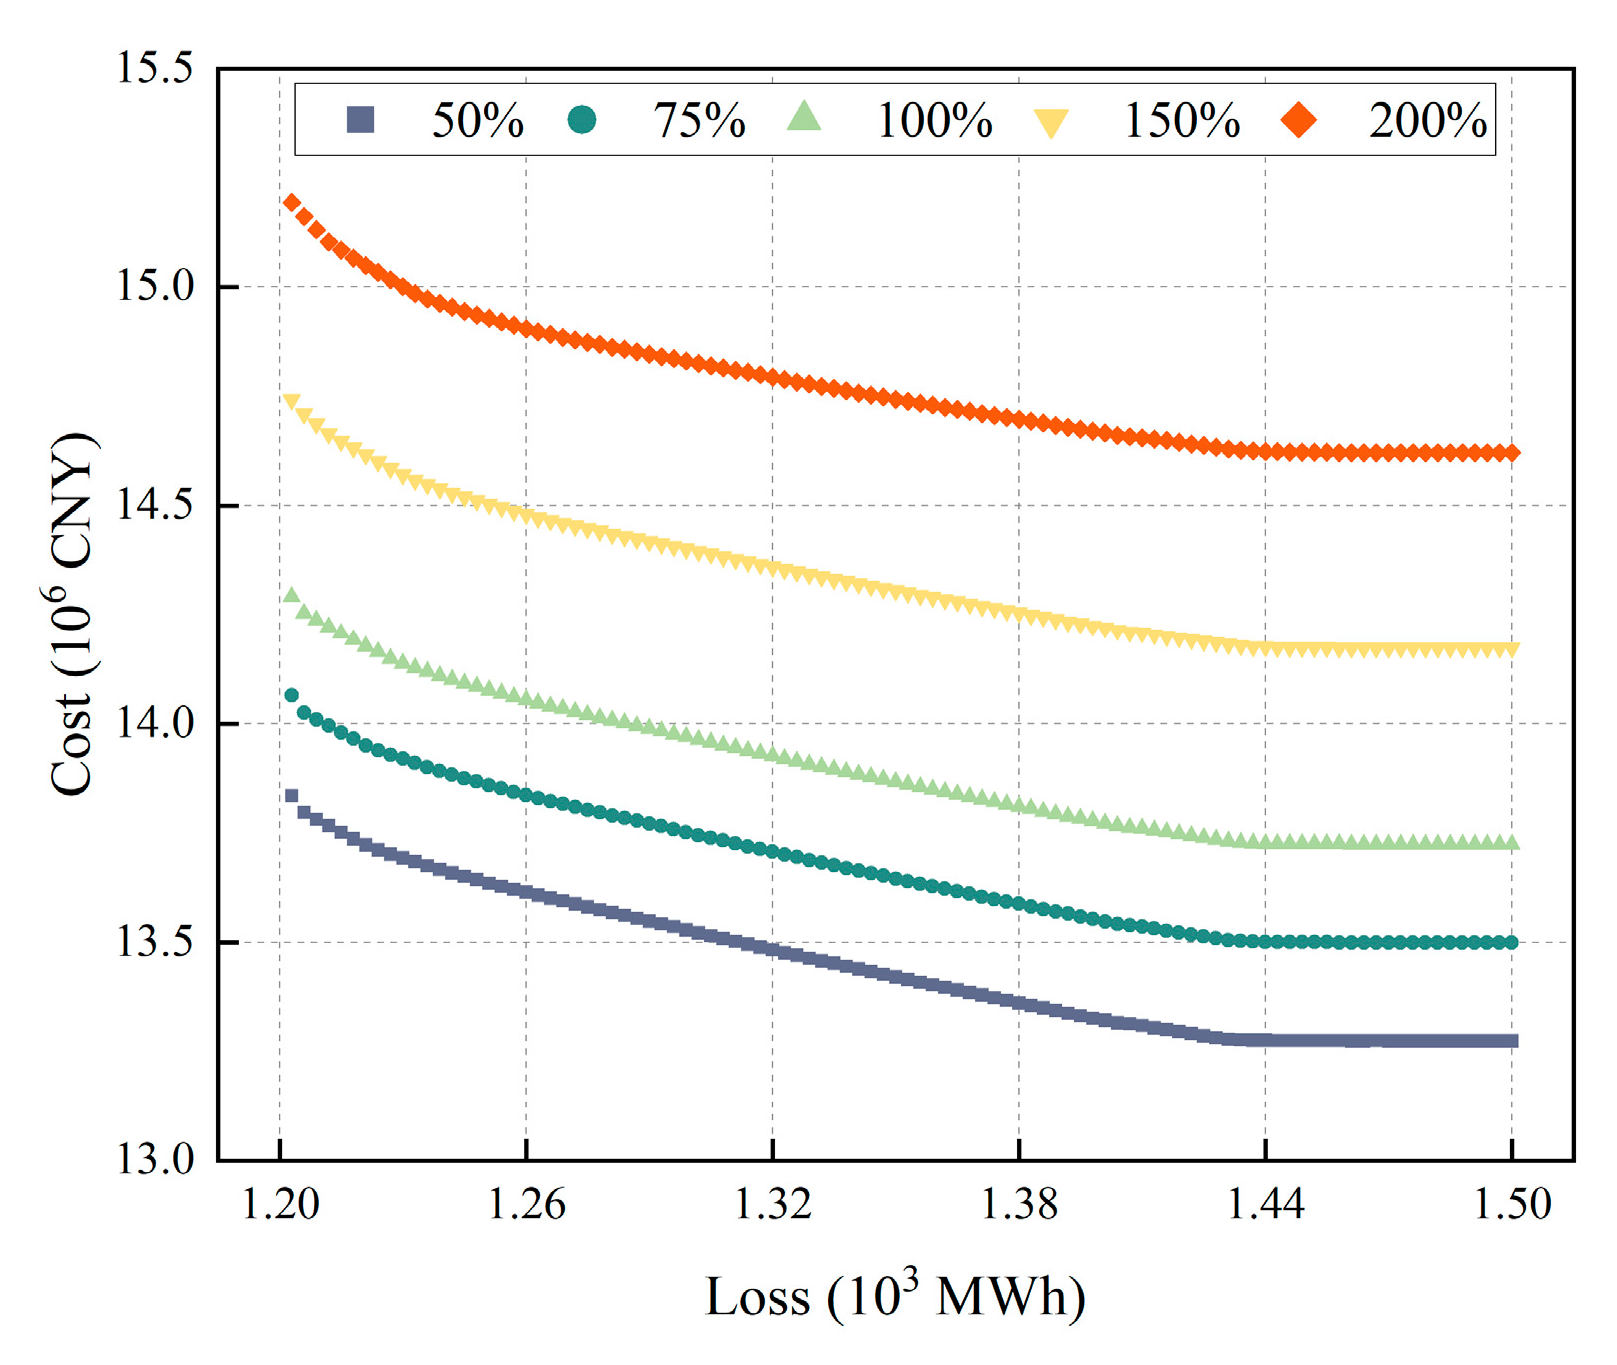
In a Pareto analysis addressing dual objectives of cost and energy loss, the impact of electricity price fluctuations on system operation is further examined, as shown in Figure 12. The results indicate that as electricity prices rise (or equivalently, as green electricity resources become relatively scarce), the overall curve shifts upwards while marginal improvement potential diminishes. Under these conditions, the influence of energy loss on system costs is significantly amplified, meaning that the cost burden per unit of loss increases. Consequently, when electricity prices are elevated, ‘paying to reduce losses’ emerges as a more rational choice. The system should prioritise investments in enhancing the efficiency of components such as the EL, FC, and BES to minimise losses during energy conversion and storage processes. This finding demonstrates that in scenarios of high electricity costs or scarce renewable power, loss reduction strategies not only hold significance in energy efficiency but can also directly translate into economic benefits.

4.4.3. Emission–Loss Objectives

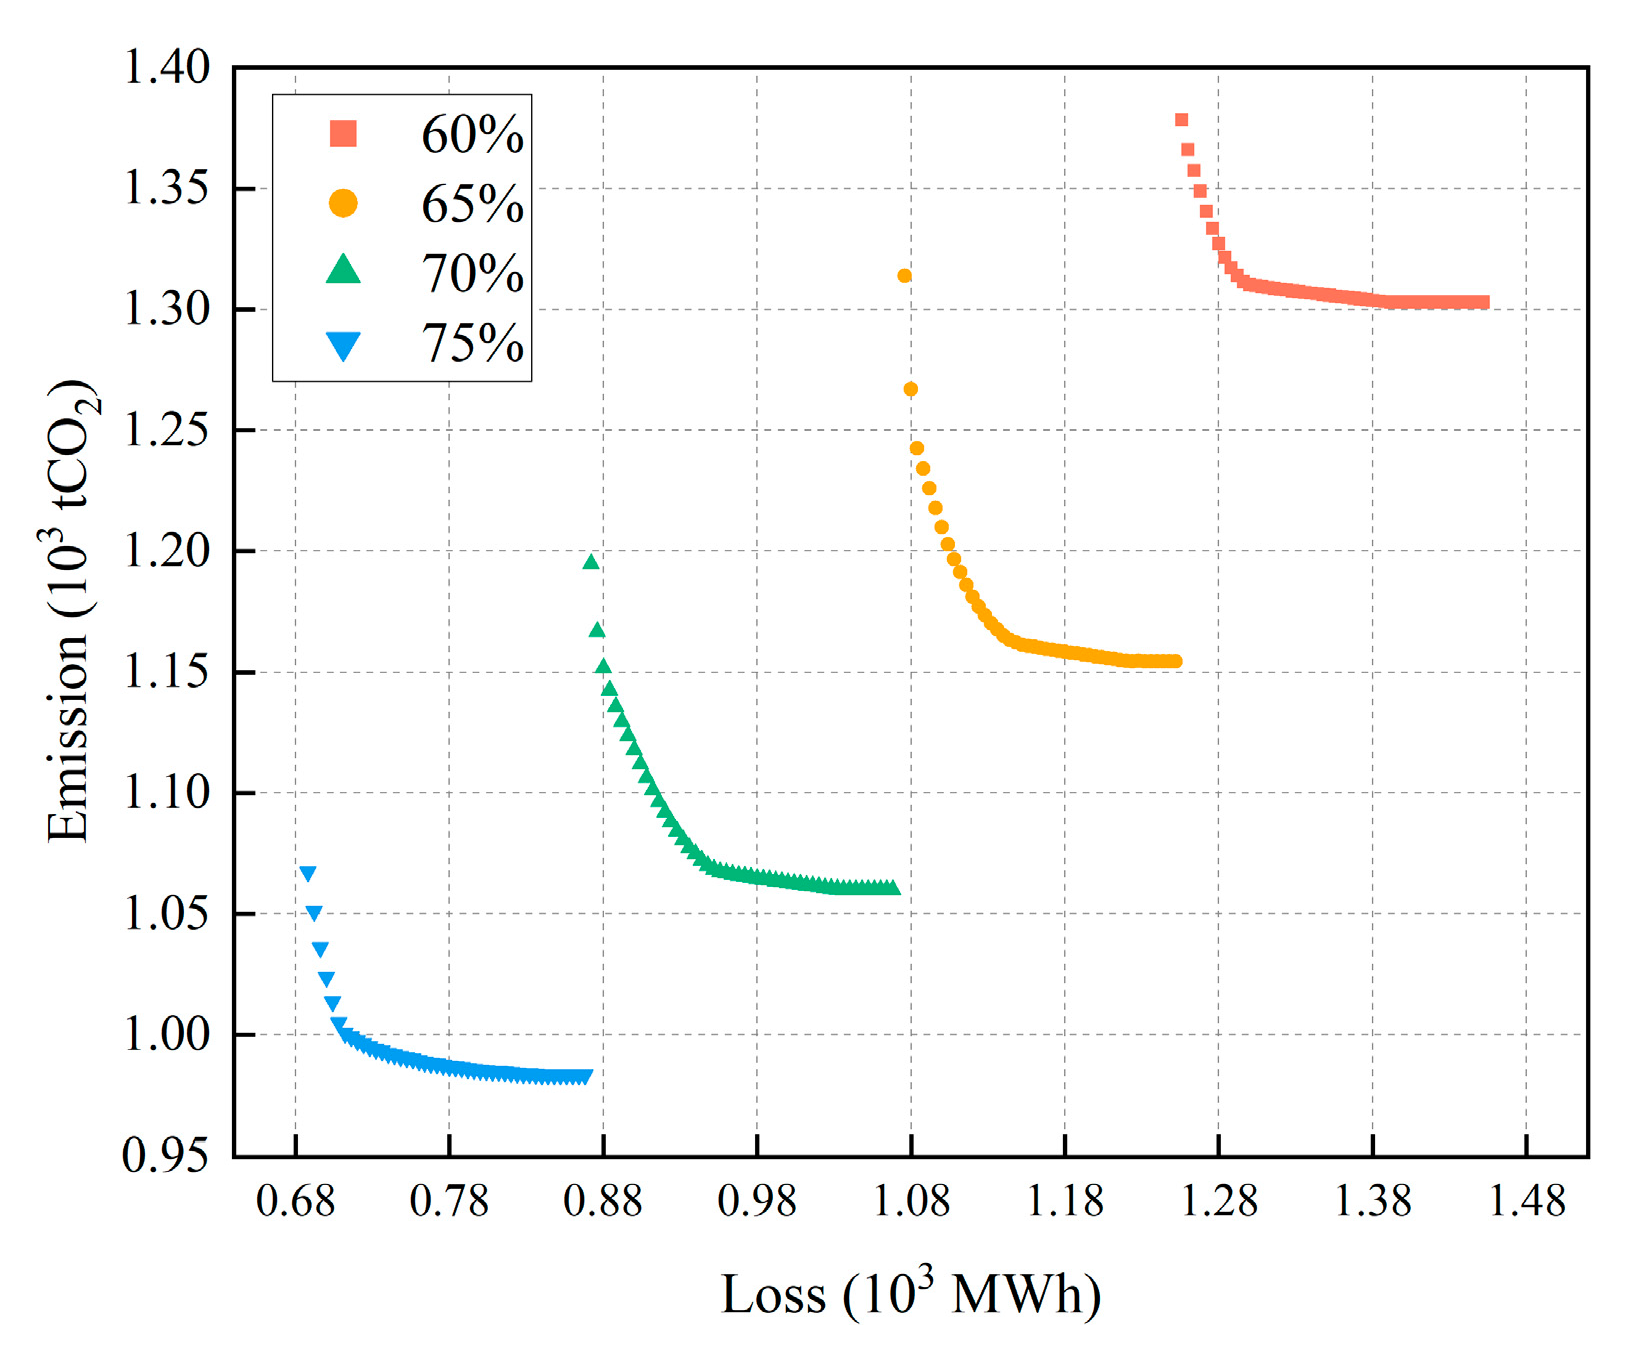
In the Pareto analysis addressing dual objectives of carbon emissions and energy losses, the sensitivity impact of equipment efficiency variations is examined, as shown in Figure 13. The results indicate that equipment efficiency exhibits extreme sensitivity to system performance, with distinct segmentation observed in the Pareto frontier across different efficiency levels. Overall, the marginal benefits of relying on loss reduction measures for carbon mitigation are limited. Once efficiency reaches a certain threshold, further reductions in energy losses yield diminishing carbon savings. Consequently, strategies should pivot towards more direct carbon reduction pathways—such as direct hydrogen supply or process substitution—to achieve more substantial emission reductions.

5. Conclusions

In this study, a comprehensive optimisation framework is developed and validated for an electricity–hydrogen integrated energy system (EH-ES) tailored to ceramic industrial parks. By incorporating multi-objective optimisation with time-of-use (TOU) pricing, the dynamic carbon emission factor (CEF), and detailed equipment models, the study evaluates the system’s configuration and operational responses under multi-disturbance conditions. Through case studies, the proposed framework demonstrates the capability to flexibly coordinate electricity and hydrogen storage, achieve stable operation under diverse scenarios, and quantitatively assess the trade-offs among cost, carbon emissions, and energy losses.
Three important findings emerge from this analysis.
  • The proposed model is technically feasible and operationally robust, with high adaptability across different load and renewable conditions.
  • The carbon reduction potential is strongly shaped by equipment efficiency and the electricity trading ratio (self-sufficiency rate), underscoring the importance of external–internal interactions in determining system performance.
  • The efficiency and cost of the electrolyser (EL) and fuel cell (FC) are the most critical bottlenecks: significant reductions in equipment prices can make emission reduction economically viable, while efficiency improvements both enhance decarbonisation effectiveness and mitigate energy losses.
Looking forward, these results highlight several promising directions. Improving EL and FC efficiency not only strengthens the environmental benefits of hydrogen utilisation but also shifts the system towards higher hydrogen load levels with greater carbon reduction potential, thereby supporting the broader substitution of hydrogen in industrial energy structures. Moreover, only when equipment costs decline to approximately 20% of current levels does emission reduction become economically attractive under existing carbon prices, suggesting that cost breakthroughs are essential for market-driven decarbonisation. Finally, strategies should increasingly move toward more direct carbon mitigation pathways—such as direct hydrogen supply or process substitution—to achieve deeper and more cost-effective reductions in high-emission industries. Nevertheless, this study is limited by the fixed renewable generation profiles and region-specific operational data, which may affect the generalisability of the results. Future work will extend the framework to include stochastic renewable variations, different market and policy scenarios, and multi-regional system interactions to further validate and expand the applicability of the proposed approach.
Author Contributions

Conceptualization, R.Z.; Methodology, R.Z. and J.Q.; Software, R.Z.; Validation, R.Z., Y.L., X.H., Y.X., B.Z. and X.Z.; Formal analysis, R.Z.; Investigation, R.Z.; Writing—original draft, R.Z.; Writing—review & editing, X.H., Y.T., B.Z. and X.Z.; Visualization, Y.L. and Y.X.; Supervision, J.Q. and X.Z.; Project administration, J.Q. and X.Z. All authors have read and agreed to the published version of the manuscript.

Funding

This work is supported by Guangdong Basic and Applied Basic Research Foundation (2024A1515030012).

Institutional Review Board Statement

Not applicable.

Informed Consent Statement

Not applicable.

Data Availability Statement

The original contributions presented in this study are included in the article. Further inquiries can be directed to the corresponding authors.

Conflicts of Interest

The authors declare no conflict of interest.

Appendix A

Table A1. Nomenclature.
Abbreviations Δ Per unit
BESBattery energy storage η Efficiency
CCUSCarbon capture, utilisation and storage π Energy conversion coefficient
CEFCarbon emission factor τ Self-consumption rate
CO2Carbon dioxide χ Reliability coefficient
EH-ESElectricity–hydrogen integrated energy system
ELElectrolyserSubscript
ESSEnergy storage systemcefCarbon emission factor
FCFuel cellepElectricity purchase
H2HydrogenesElectricity sale
HESHydrogen energy systemfaFactory
HSTHydrogen storage tankgeGeneration
IESIntegrated energy systemgpGas purchase
MILPMixed-integer linear programminghsHydrogen sale
MINLPMixed-integer nonlinear programmingicInvestment cost
PVPhotovoltaicllLife loss
RESRenewable energy sourceomOperation and maintenance
SOCState of chargepvPhotovoltaic
SOEState of energyscSelf-consumption
TOUTime-of-usewtWind turbine
WTWind turbine
Superscript
VariableschCharge
BBinary variablecpCompression
CCostdcDischarge
ECarbon emissioneElectricity
HHydrogen powerhHydrogen
LEnergy lossmaxMaximum
PElectrical powerminMinimum
ParametersIndex and set
eCarbon emission coefficient σ Configuration variable index
rDiscount rate ς Operation variable index
tTime Π Global optimisation variable set
yYear Ψ Variable index set
Table A2. EH-ES parameters.
Types EL FC HST BES
c σ (106 CNY)5.5 (MW)2.5 (MW)8 (t)1.2 (MWh)
X σ min / X σ max 0/50 (MW)0/50 (MW)0.5/10 (t)2.5/50 (MWh)
η σ (%)6565//
η e , ch / η e , dc (%)///95/97
y σ (years)810208
r σ (%)8.726.084.3211.51
c om σ (%)6425
e ic σ (tCO2)65 (MW)100 (MW)120 (t)100 (MWh)
S O E initial / S O C initial //10 (t)50 (MWh)
S O E min / S O E max (%)//5/95/
S O C min / S O C max (%)///5/95
τ sc σ (%/h)//0.025
η σ ch / η σ dc (%)//25/5060/80
η HST cp (MWh/t)//0.75/
c ll (CNY/MW)///150
π h , e (MWh/kg)0.0330.033//
Table A3. Operational parameters.
TypesParameter Settings
χ ps (%)20
c es / c ep (%)50

References

  1. Cheng, Y.; Zhang, N.; Wang, Y.; Yang, J.; Kang, C.; Xia, Q. Modeling carbon emission flow in multiple energy systems. IEEE Trans. Smart Grid 2019, 10, 3562–3574. [Google Scholar] [CrossRef]
  2. Wang, J.; An, Q.; Zhao, Y.; Pan, G.; Song, J.; Hu, Q.; Tan, C.-W. Role of electrolytic hydrogen in smart city decarbonization in China. Appl. Energy 2023, 336, 120699. [Google Scholar] [CrossRef]
  3. Li, J.; Zhou, Z.; Wen, B.; Zhang, X.; Wen, M.; Huang, H.; Yu, Z.; Liu, Y. Modeling and analysis method for carbon emission flow in integrated energy systems considering energy quality. Energy Sci. Eng. 2024, 12, 2405–2425. [Google Scholar] [CrossRef]
  4. Hübner, T.; Harper, R.; Kleinertz, B.; Von Roon, S. Challenges and solutions in the industrial energy transition: Use case ceramics industry. Interceram—Int. Ceram. Rev. 2021, 70, 34–39. [Google Scholar] [CrossRef]
  5. Furszyfer Del Rio, D.D.; Sovacool, B.K.; Foley, A.M.; Griffiths, S.; Bazilian, M.; Kim, J.; Rooney, D. Decarbonizing the ceramics industry: A systematic and critical review of policy options, developments and sociotechnical systems. Renew. Sustain. Energy Rev. 2022, 157, 112081. [Google Scholar] [CrossRef]
  6. Ding, K.; Li, A.; Lv, J.; Gu, F. Decarbonizing ceramic industry: Technological routes and cost assessment. J. Clean. Prod. 2023, 419, 138278. [Google Scholar] [CrossRef]
  7. Zhang, K.; Zhou, B.; Or, S.W.; Li, C.; Chung, C.Y.; Voropai, N. Optimal Coordinated Control of Multi-Renewable-to-Hydrogen Production System for Hydrogen Fueling Stations. IEEE Trans. Ind. Appl. 2022, 58, 2728–2739. [Google Scholar] [CrossRef]
  8. Al-Hanahi, B.; Wen, J.; Habibi, D.; Aziz, A. Techno-economic analysis of hybrid hydrogen fuel-cell/PV/wind turbine/battery/diesel energy system for rural coastal community in western australia. In Proceedings of the 2023 International Conference on Sustainable Technology and Engineering (i-COSTE), Nadi, Fiji, 4–6 December 2023; IEEE: New York, NY, USA; pp. 1–6. [Google Scholar] [CrossRef]
  9. Zhang, G.; Wang, W.; Chen, Z.; Li, R.; Niu, Y. Modeling and optimal dispatch of a carbon-cycle integrated energy system for low-carbon and economic operation. Energy 2022, 240, 122795. [Google Scholar] [CrossRef]
  10. Jayachandran, M.; Gatla, R.K.; Flah, A.; Milyani, A.H.; Milyani, H.M.; Blazek, V.; Prokop, L.; Kraiem, H. Challenges and opportunities in green hydrogen adoption for decarbonizing hard-to-abate industries: A comprehensive review. IEEE Access 2024, 12, 23363–23388. [Google Scholar] [CrossRef]
  11. Franco, A.; Rocca, M. Renewable electricity and green hydrogen integration for decarbonization of “hard-to-abate” industrial sectors. Electricity 2024, 5, 471–490. [Google Scholar] [CrossRef]
  12. Li, K.; Yang, R.; He, X. Realizing low-carbon development of industrial parks in China: Model construction and its application. Energy 2024, 301, 131664. [Google Scholar] [CrossRef]
  13. Mu, Y.; Guo, H.; Wu, Z.; Jia, H.; Jin, X.; Qi, Y. A two-layer low-carbon economic planning method for park-level integrated energy systems with carbon-energy synergistic hub. Energy AI 2024, 18, 100435. [Google Scholar] [CrossRef]
  14. Sun, Y.; Li, Y.; Ning, J.; Fu, H.; Liu, F.; Feng, Z.; Liu, G.; Shi, L. Twelve pathways of carbon neutrality for industrial parks. J. Clean. Prod. 2024, 437, 140753. [Google Scholar] [CrossRef]
  15. Yan, K.; Gao, H.; Liu, R.; Lyu, Y.; Wan, M.; Tian, J.; Chen, L. Review on low-carbon development in Chinese industrial parks driven by bioeconomy strategies. Renew. Sustain. Energy Rev. 2024, 199, 114541. [Google Scholar] [CrossRef]
  16. Wu, D.; Han, S.; Wang, L.; Li, G.; Guo, J. Multi-parameter optimization design method for energy system in low-carbon park with integrated hybrid energy storage. Energy Convers. Manag. 2023, 291, 117265. [Google Scholar] [CrossRef]
  17. Ju, L.; Lu, X.; Li, F.; Bai, X.; Li, G.; Nie, B.; Tan, Z. Two-stage optimal dispatching model and benefit allocation strategy for hydrogen energy storage system-carbon capture and utilization system-based micro-energy grid. Energy Convers. Manag. 2024, 313, 118618. [Google Scholar] [CrossRef]
  18. Lin, J.; Cai, R. Optimal planning for industrial park-integrated energy system with hydrogen energy industry chain. Int. J. Hydrogen Energy 2023, 48, 19046–19059. [Google Scholar] [CrossRef]
  19. Huo, Q.; Liu, Q.; Deng, H.; Wang, W.; Shi, C.; Wei, T. Research on dual-layer optimization strategy of photovoltaic-storage-hydrogen system in coal chemical industry park. Renew. Energy 2024, 230, 120813. [Google Scholar] [CrossRef]
  20. Wei, X.; Qiu, R.; Liang, Y.; Liao, Q.; Klemeš, J.J.; Xue, J.; Zhang, H. Roadmap to carbon emissions neutral industrial parks: Energy, economic and environmental analysis. Energy 2022, 238, 121732. [Google Scholar] [CrossRef]
  21. Shen, X.; Zhu, X.; Yuan, Y.; Luo, Z.; Zhang, X.; Liu, Y. Optimal dispatch of power grids considering carbon trading and green certificate trading. Technologies 2025, 13, 294. [Google Scholar] [CrossRef]
  22. Qi, Z.; Zhao, H.; Zhang, Y.; Guo, S. Study on two-stage robust optimal configuration of integrated energy system considering CCUS and electric hydrogen production. Energy Convers. Manag. 2025, 324, 119278. [Google Scholar] [CrossRef]
  23. Zhao, Y.; Wang, S.; Gao, G.; Xue, X.; Song, H.; Zhang, R. Exploring the green and low-carbon development pathway for an energy-intensive industrial park in China. J. Clean. Prod. 2024, 459, 142384. [Google Scholar] [CrossRef]
  24. Zhu, J.; Zhou, J.; Zhang, D.; Gan, W.; Sun, C. Trusted low-carbon optimized economic dispatch for integrated energy industrial park based on blockchain technology. Appl. Energy 2025, 381, 125055. [Google Scholar] [CrossRef]
  25. Gu, H.; Yu, J.; Shen, Y.; Li, Y.; Guan, D.; Ye, P. Bi-Level Decentralized Optimal Economic Dispatch for Urban Regional Integrated Energy System Under Carbon Emission Constraints. IEEE Access 2022, 10, 62341–62364. [Google Scholar] [CrossRef]
  26. Shi, Z.; Yang, Y.; Xu, Q.; Wu, C.; Hua, K. A low-carbon economic dispatch for integrated energy systems with CCUS considering multi-time-scale allocation of carbon allowance. Appl. Energy 2023, 351, 121841. [Google Scholar] [CrossRef]
  27. Uche-Soria, M.; Martínez Raya, A.; Muñoz Cabanes, A.; Moya Velasco, J. Redefining transactions, trust, and transparency in the energy market from blockchain-driven technology. Technologies 2025, 13, 412. [Google Scholar] [CrossRef]
  28. Liu, N.; Zhang, K.; Zhang, K. Coordinated configuration of hybrid energy storage for electricity-hydrogen integrated energy system. J. Energy Storage 2024, 95, 112590. [Google Scholar] [CrossRef]
  29. Wang, X.; Li, F.; Zhang, Q.; Shi, Q.; Wang, J. Profit-Oriented BESS Siting and Sizing in Deregulated Distribution Systems. IEEE Trans. Smart Grid 2023, 14, 1528–1540. [Google Scholar] [CrossRef]
  30. Zhong, J.; Li, Y.; Wu, Y.; Cao, Y.; Li, Z.; Peng, Y.; Qiao, X.; Xu, Y.; Yu, Q.; Yang, X.; et al. Optimal Operation of Energy Hub: An Integrated Model Combined Distributionally Robust Optimization Method With Stackelberg Game. IEEE Trans. Sustain. Energy 2023, 14, 1835–1848. [Google Scholar] [CrossRef]
  31. Wang, Y.; Wang, H.; Razzaghi, R.; Jalili, M.; Liebman, A. Multi-objective coordinated EV charging strategy in distribution networks using an improved augmented epsilon-constrained method. Appl. Energy 2024, 369, 123547. [Google Scholar] [CrossRef]
  32. Lu, S.; Li, Y.; Gu, W.; Xu, Y.; Ding, S. Economy-carbon coordination in integrated energy systems: Optimal dispatch and sensitivity analysis. Appl. Energy 2023, 351, 121871. [Google Scholar] [CrossRef]
  33. Zhang, X.; Guo, Z.; Pan, F.; Yang, Y.; Li, C. Dynamic carbon emission factor based interactive control of distribution network by a generalized regression neural network assisted optimization. Energy 2023, 283, 129132. [Google Scholar] [CrossRef]
Figure 1. System architecture.
Technologies 13 00472 g001
Figure 2. WT and PV power and electricity and hydrogen loads.
Technologies 13 00472 g002
Figure 3. TOU electricity price and dynamic CEF.
Technologies 13 00472 g003
Figure 4. Electricity power balance.
Technologies 13 00472 g004
Figure 5. Hydrogen power balance.
Technologies 13 00472 g005
Figure 6. BES operational status.
Technologies 13 00472 g006
Figure 7. HES operational status.
Technologies 13 00472 g007
Figure 8. The impact of EL and FC efficiency on cost, carbon emissions and energy loss.
Technologies 13 00472 g008
Figure 9. The impact of objective function on cost, carbon emissions, and energy loss.
Technologies 13 00472 g009
Figure 10. The impact of electricity purchase-to-sale ratio on cost, carbon emissions and energy loss.
Technologies 13 00472 g010
Figure 11. Pareto of cost–emission objectives (1* and 2* refer to the right endpoint of the curve).
Technologies 13 00472 g011
Figure 12. Pareto of cost–loss objectives.
Technologies 13 00472 g012
Figure 13. Pareto of emission–loss objectives.
Technologies 13 00472 g013
Table 1. Global variable classification.
ClassificationVariables
Ψ CFG X EL   X FC   X HST   X BES
Ψ OPR P ep ( t )   P es ( t )   P BES ch ( t )   P BES dc ( t )   P EL ( t ) H HST ch ( t )   H HST ch ( t )   H FC ( t )   E HST ( t )   E BES ( t )
Table 2. Optimisation results.
CategoryTypeMinimisation Objective Function
CostEmissionLoss
Global variablesEL (MW)40.41750.00050.000
FC (MW)14.3828.94050.000
HST (t)8.0587.5235.230
BES (MWh)31.25950.00050.000
Objective functionCost (106 CNY)13.72516.70919.262
Emission (tCO2)1435.5361154.4511632.142
Loss (MWh)1186.8671139.2771093.575
Table 3. Operational state influence.
DayConditionIntensity of UseLevel
ELFCBESHSTTrading CapCarbon ReductionEnergy Loss
1High RESs outputH 1L 2M 3HHHM
2Renewable shutdownLHMHHLM
3, 6StableMLLLLML
4Factory shutdownHLMHHHM
5Intermittent RESs fluctuationsMMHMMMH
7Intermittent load fluctuationsMMHMMMM
1 High. 2 Low. 3 Medium.
Table 4. Multi-objective analysis settings.
CaseTrade-Off ObjectivesSensitivity Parameters
1Cost–EmissionEquipment price
2Cost–LossElectricity price
3Emission–LossEL and FC efficiency
Disclaimer/Publisher’s Note: The statements, opinions and data contained in all publications are solely those of the individual author(s) and contributor(s) and not of MDPI and/or the editor(s). MDPI and/or the editor(s) disclaim responsibility for any injury to people or property resulting from any ideas, methods, instructions or products referred to in the content.