3.1. Investigating the Wear Properties of the Pin of a Transmission Chain Using a Reciprocating Wear Test Rig
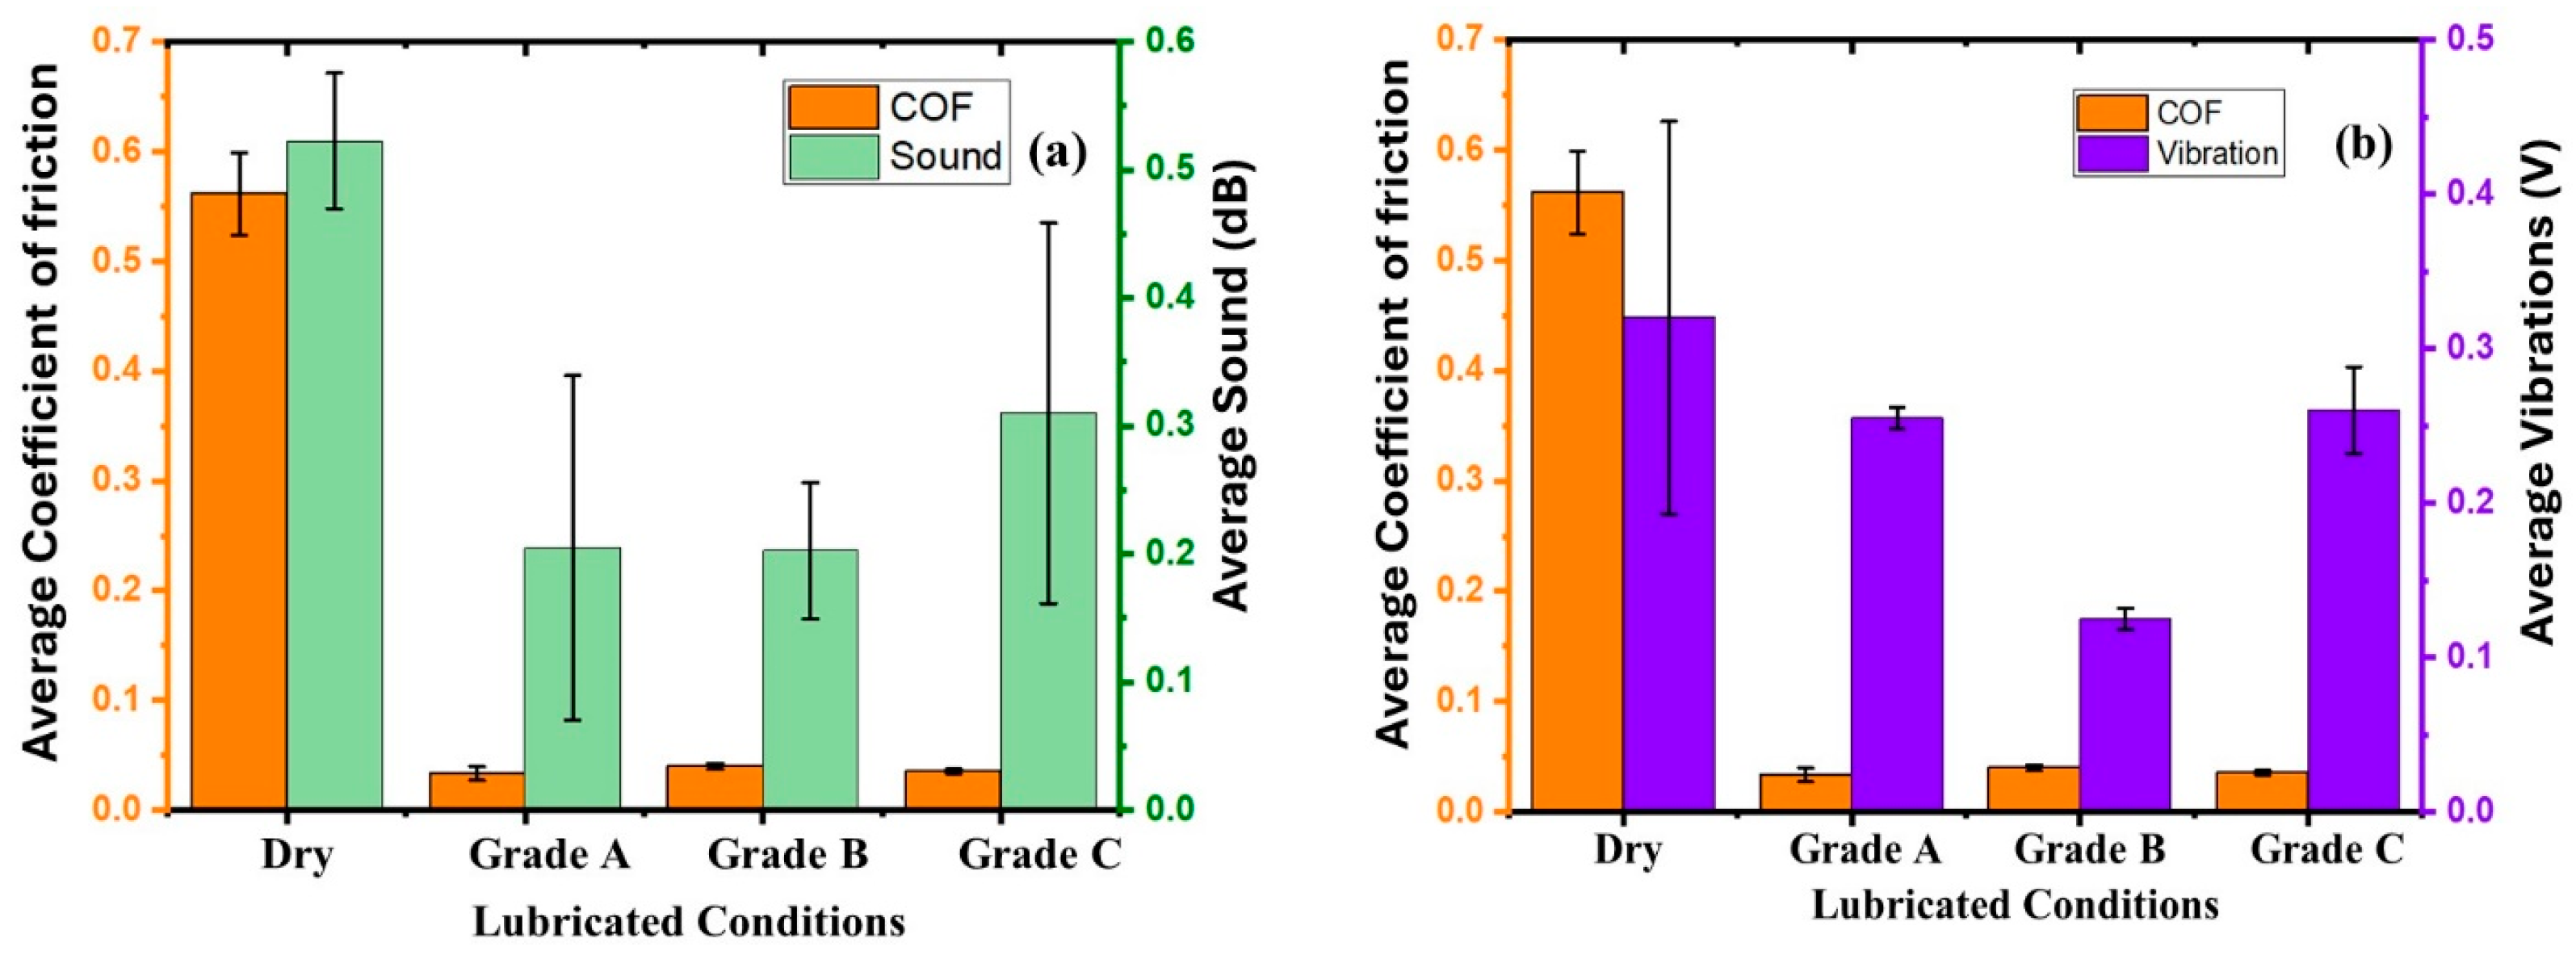
Figure 6 indicates the average CoF and WSD during the tribology test. The coefficient of friction in the case of dry condition (0.5615 ± 0.037) was 41% higher than Grade A aerosol (0.0335 ± 0.0063) and Grade C aerosol (0.0355 ± 0.002) and 28% higher than Grade B aerosol (0.040 ± 0.0028).
The CoF in all the samples with aerosols exhibited similar frictional coefficients. However, the average wear scar diameter on the pin with Grade C (0.401 ± 0.129 mm) was higher than the pins with Grade A (0.209 ± 0.159 mm) and Grade B (0.204 ± 0.165 mm) (
Figure 6a). The intense interaction between the mating pair in dry conditions can be identified with the high peak in the coefficient of friction graph (
Figure 6b), which resulted in a high wear scar and a higher CoF. From
Figure 7, it can be seen that the average sound and vibrations produced during the friction test in dry conditions were higher than the sound produced during the friction test using Grade A, Grade B, and Grade C aerosols; however, each of the aerosol lubricants behaved in different from each other, indicating that the composition of any lubricant would play a major role in controlling the acoustic emissions generation and vibration produced due to friction between the mating pair.
The test in dry conditions produced an average sound level of 0.522 ± 0.053 dB, while 0.205 ± 0.134 dB, 0.205 ± 0.053 dB, and 0.310 ± 0.148 dB were produced during the friction test with Grade A, Grade B, and Grade C aerosols (
Figure 7a). Thus, the dry condition produced about 60% more sound emissions than Grade A and Grade B conditions and 41% more sound emissions than Grade C. Similarly, the dry condition (0.32 ± 0.127 V) produced 12% higher vibration than Grade A (0.255 ± 0.007 V) and Grade C (0.260 ± 0.028 V). The vibrations produced in the friction test using Grade B (0.125 ± 0.007 V) exhibited significantly lower vibration of 61% than in dry conditions and 51% lower vibrations than in Grade A and Grade C aerosols (
Figure 7b).
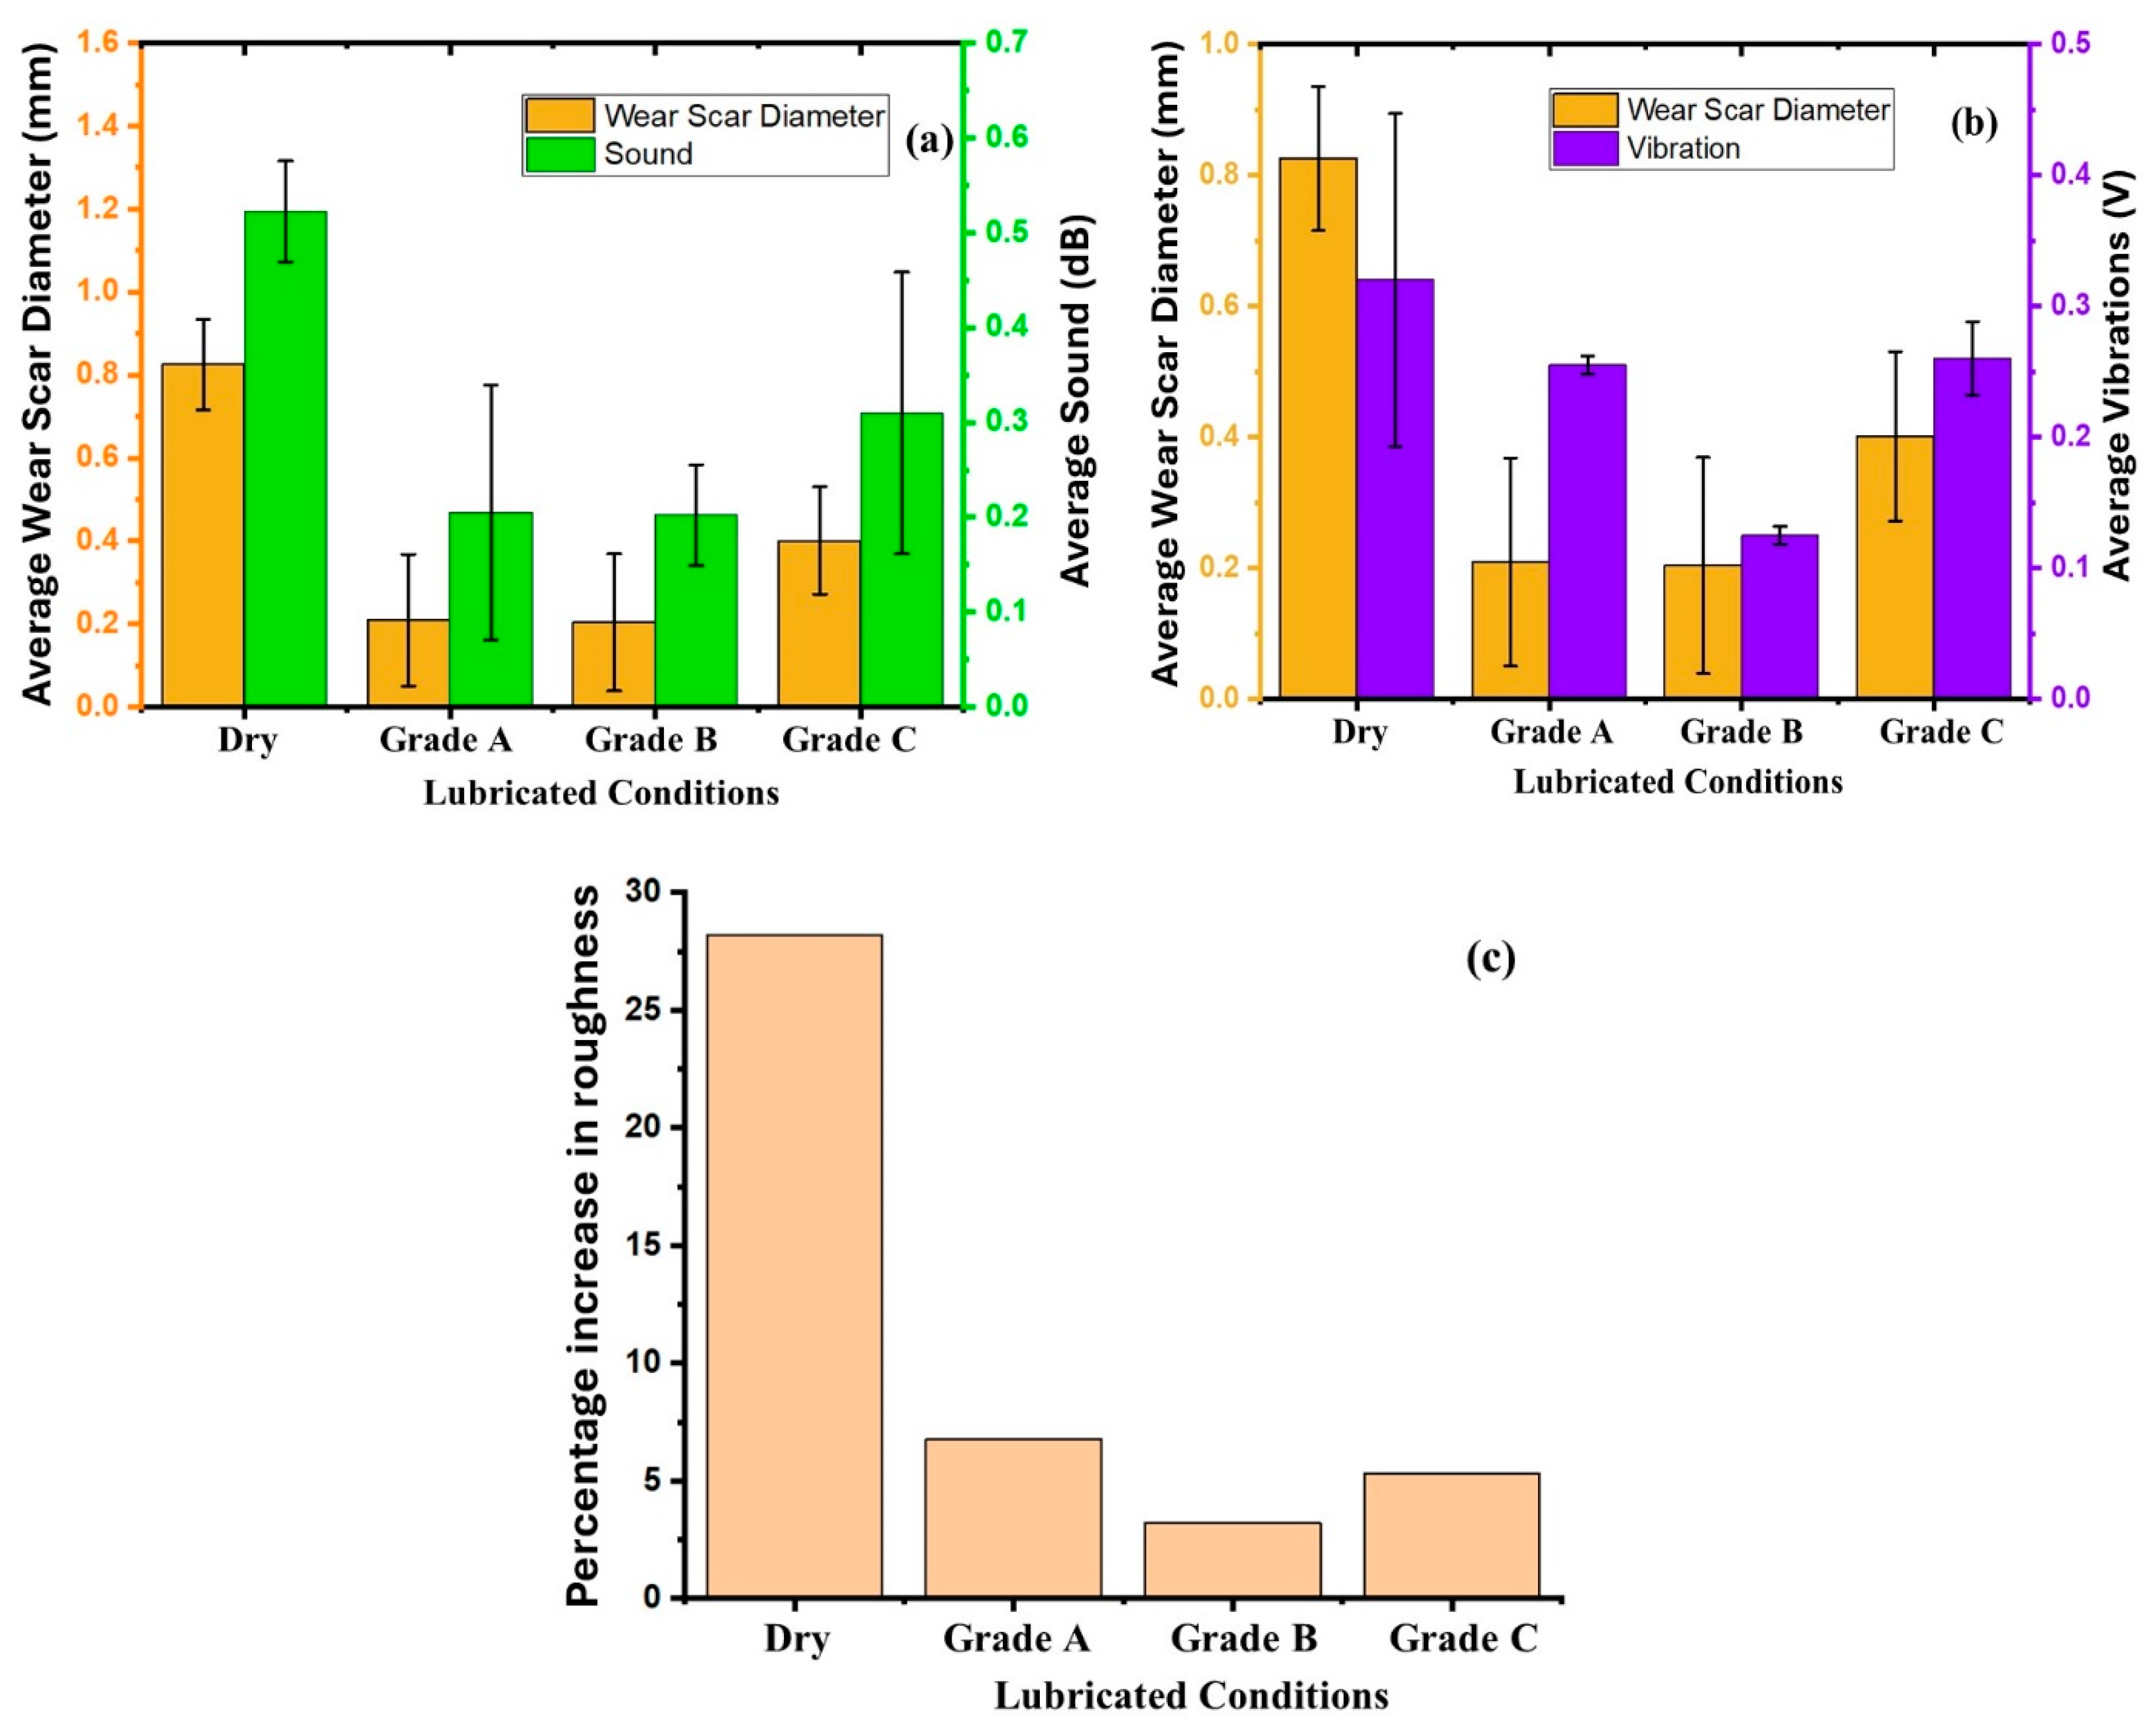
Figure 8 exhibits the relationship between the average wear scar diameters, sound emissions, and vibrations produced during the tribo-test on the pins. It can be seen that the sound and the vibrations produced during the friction process correlated with each other (
Figure 8a). High-wear scars produce more sound (noise) and vibrations, thus indicating an aggressive wear condition (
Figure 8b). The average wear scar diameter in dry conditions (0.825 ± 0.11 V) was higher than in other lubricated conditions, so the sound produced was also higher in dry conditions. It is to be noted that the wear scar diameters in the case of Grade A (0.209 ± 0.159 V) and Grade B (0.204 ± 0.165 V) are equal, and hence, the sound produced during the friction was also similar. The vibrations recorded in the case of Grade B (0.125 ± 0.007 V) were the least among all the samples. It is interesting to note that even when the wear scars and acoustic emissions with Grade A and Grade B are almost equal, the vibrations produced in Grade A were higher than in Grade B. The increase in vibrations in Grade A as compared to Grade B may be due to the intense interaction between the mating pairs, which is confirmed by the increase in the roughness of the pin surface (
Figure 8c). The percentage increase in roughness for Grade A (6.75%) and Grade C (5.32%) pins after the tests was greater than that for Grade B (3.21%).
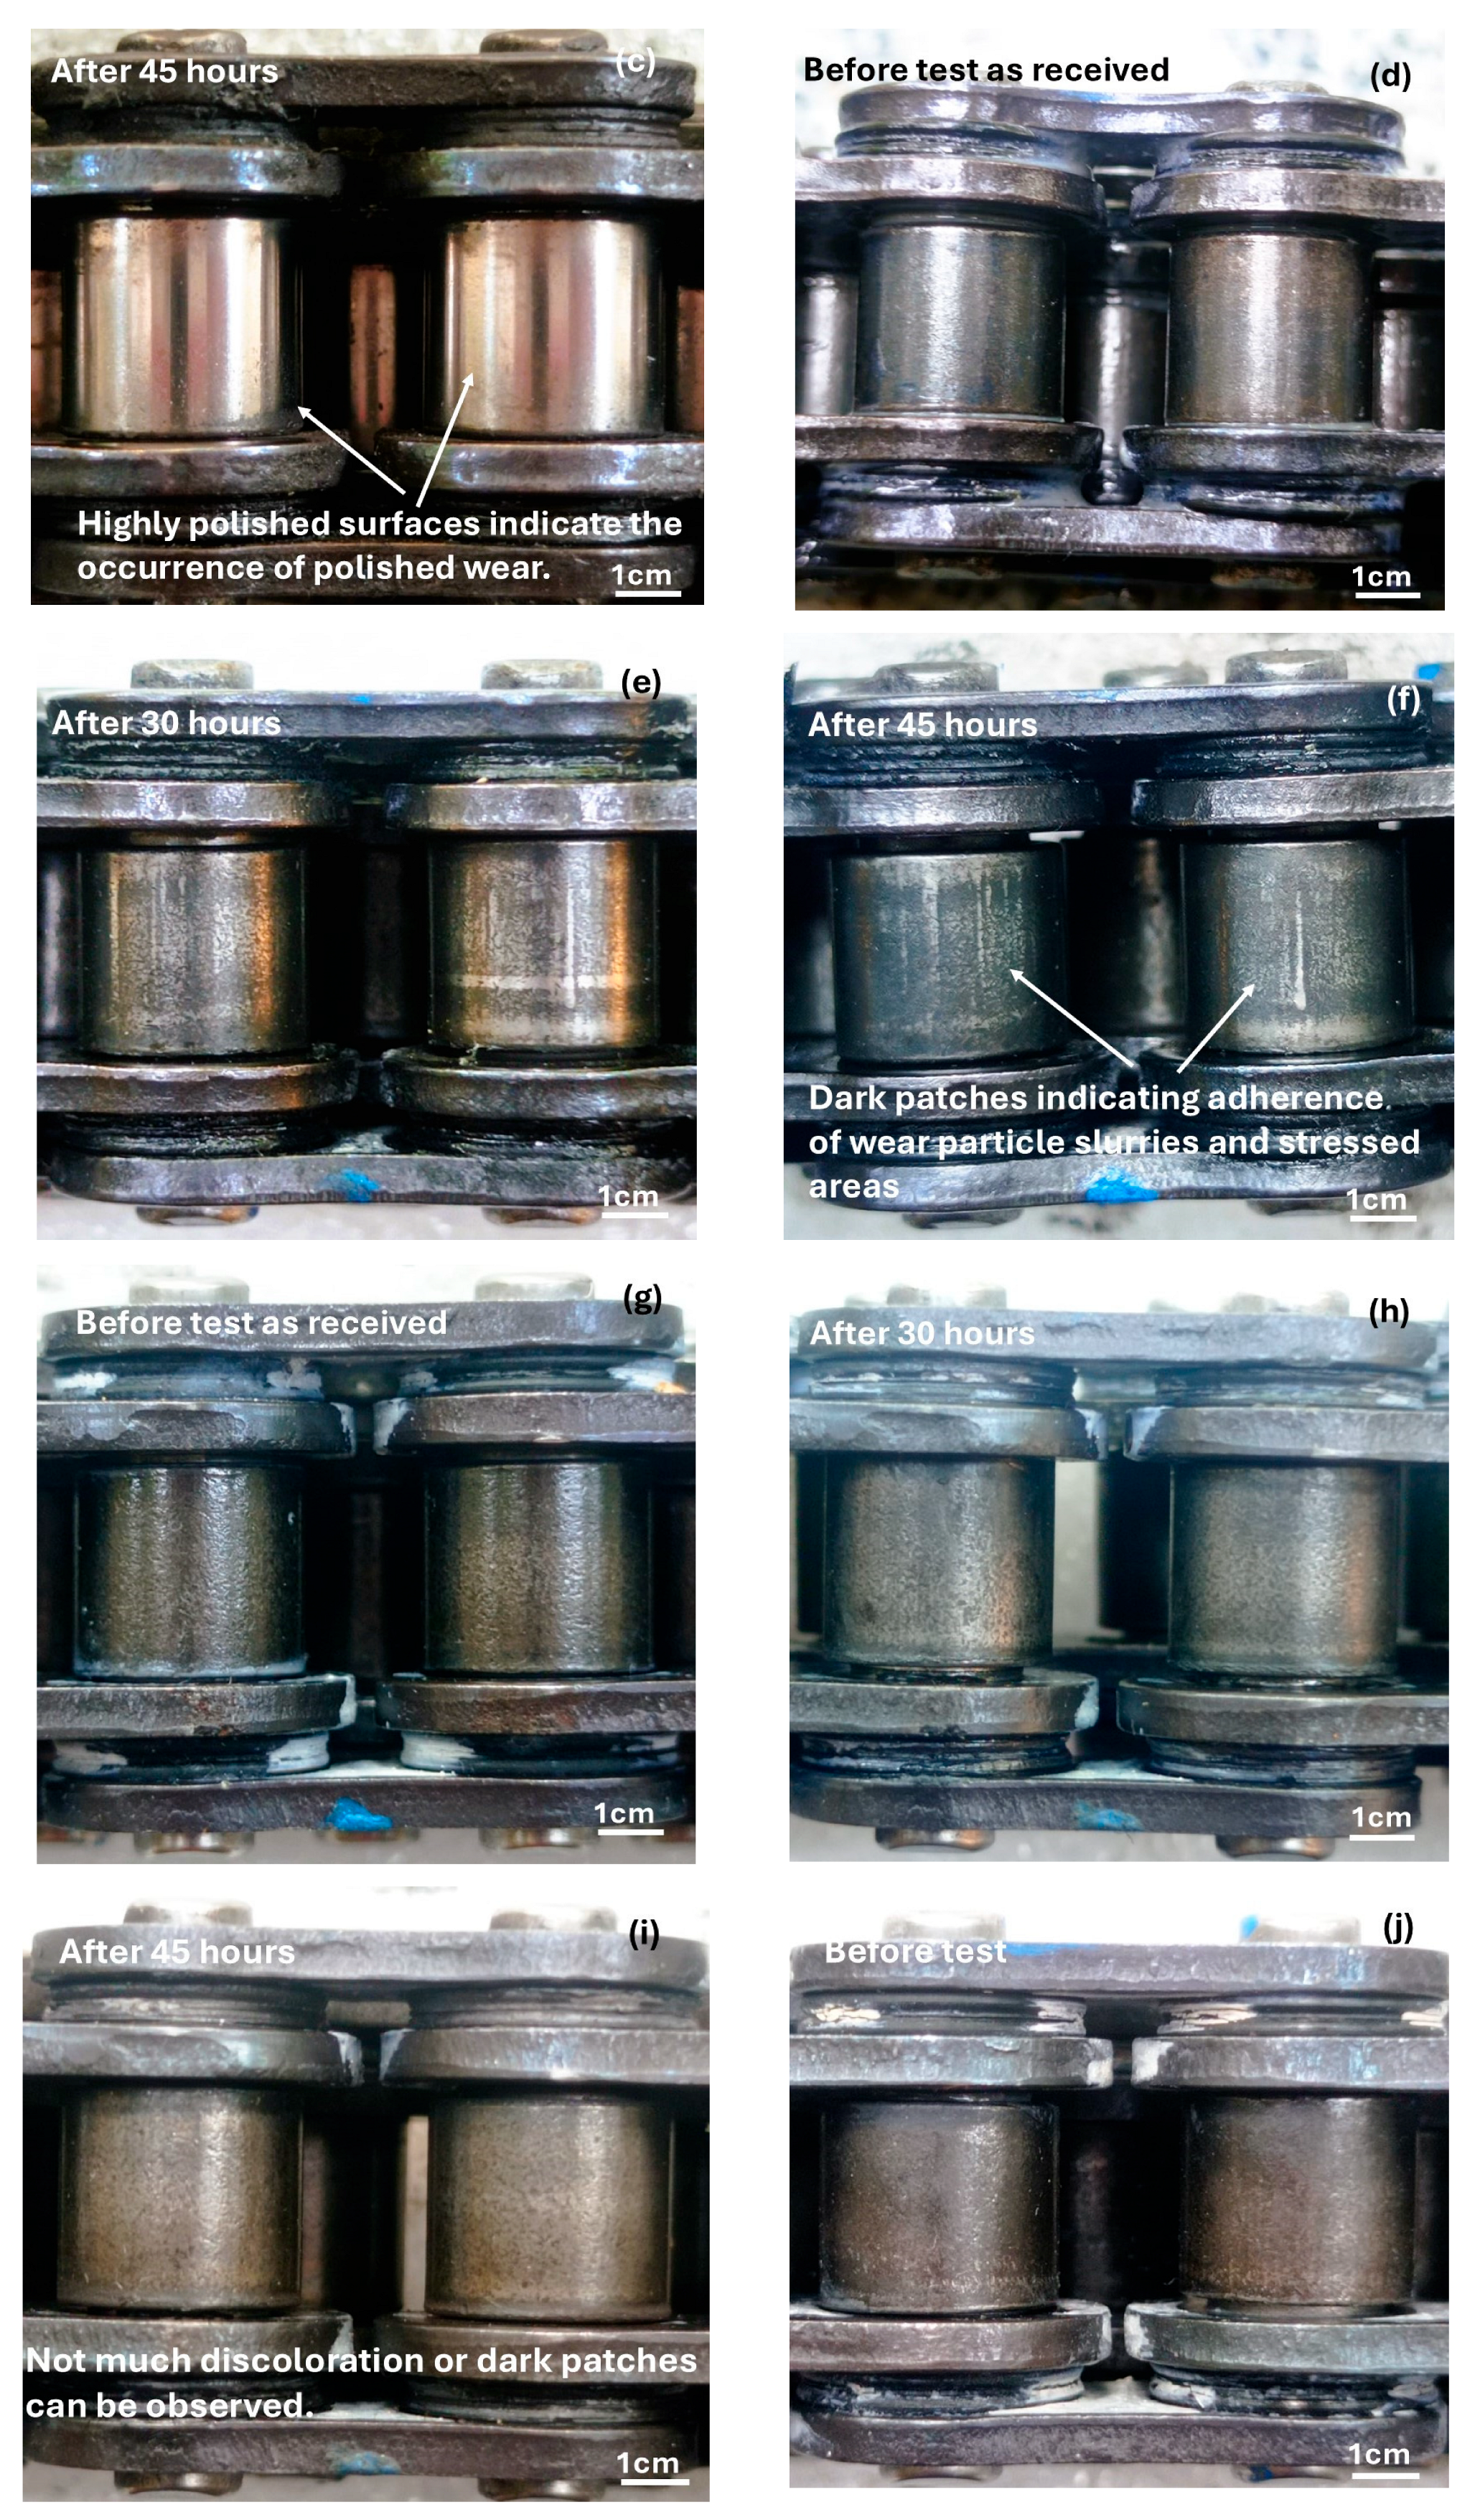
Figure 9 shows the optical microscope images of the wear scars of tribo-pairs. As shown in
Figure 9a, the dry surface exhibited high wear, characterized by intense wear tracks, compared to the lubricated conditions. It is worth noting that the plate experienced more damage in all cases, with the highest damage occurring in dry conditions. In aerosol-sprayed conditions, surface damage is higher for Grades A and C compared to Grade B. Therefore, due to the surface damage in Grades A and C, the vibration levels were also higher in Grades A and C than in Grade B. The percentage increase in surface roughness seen earlier of the pins is also an indication of the intense metal-to-metal contact, the highest being in dry condition and the least being exhibited by the pin of Grade B. From the results obtained in this work, it can be seen that even when friction and acoustic emissions follow a similar trend, the vibration induced due to friction may not follow a similar trend. Similar results correlating surface damage and friction-induced vibrations have also been reported by Qian et al. [
17]. Thus, a non-interdependent nature between the frictional coefficient and sound generated during friction, along with the friction-induced vibration, can be established.
3.2. Statistical Analysis of the CoF, WSD, Sound Generated, and Vibrations Using ANOVA
One-way ANOVA was used to analyze the outputs generated during the tests [
18,
19]. The one-way ANOVA showed significant group effects on CoF (
p = 0.00000246) and WSD (
p = 0.02967), whereas no effect was found for sound (
p = 0.1088) and vibration (
p = 0.15005) (
Table 3). This shows that the experimental conditions had a greater impact on frictional and wear characteristics than on dynamic noise and vibration responses.
Pairwise
t-tests indicated that there is a significant variation in CoF for dry test (DT) when compared to Grade A, Grade B and Grade C (DT-A, DT-B and DT-C), with significance from
t-tests (
Table 4). WSD indicated significant differences for the DT-A pair as well. By contrast, sound and vibration revealed few valid pairwise differences, with significance in DT-B (sound) and A-B (vibration).
Pairwise comparisons were further tested using the Holm–Bonferroni correction. The adjusted threshold values were found to be smaller than the corresponding pairwise
t-test
p-values (
Table 5), indicating that none of the pairwise differences reached statistical significance after controlling for multiple comparisons.
Cohen’s d values were evaluated and analyzed to find effect size (0.2 for small, 0.5 for medium, and 0.8 for large effects) (
Table 6). Effect size analysis according to Cohen’s d confirmed that the majority of pairwise comparisons between CoF and WSD were characterized by large effects, especially for the DT-A, DT-B, and DT-C pairs, affirming significant differences in friction and wear performance among these groups. Sound also revealed large effects for DT-A, DT-B, and DT-C, Vibration large effects for DT-A, DT-B and AB, and a medium effect for DT-C. As opposed to this, AC and BC pairs tended to have essentially zero effects on all parameters, indicating little difference between these two groups. The η
2 values showed variation of 95.6% for COF, 87.1% for WSD, 74.8% for sound, and 70.1% for vibration, although only CoF and WSD were statistically significant (
Table 7).
The 95% confidence interval (CI) of Cohen’s d, as approximated by the simple delta-method, added further information to the stability of these effect sizes. Significant differences were found at substantial intervals for DT-A (Sound, CoF, WSD), DT-B (Sound, CoF, WSD), and DT-C (CoF, WSD), supporting the existence of strong and stable differences. AB also revealed a significant difference for vibration, whereas BC revealed significance for CoF and vibration (
Table 8). For most others, the CIs crossed with zero, suggesting no statistically reliable differences even though an effect size magnitude was observed.
From above, it can be seen that DT-A and DT-B differences uniformly show strong, statistically significant effects on a variety of performance measures, specifically CoF and WSD. The results confirm the previous ANOVA results by demonstrating that friction and wear measurements not only significantly vary between groups but also exhibit practically significant changes with large effect sizes. Conversely, comparisons between AC and BC are marked by insignificant effects, implying a larger similarity between the two groups.
3.3. Mapping Sound Generated and CoF During the Reciprocating Wear Test
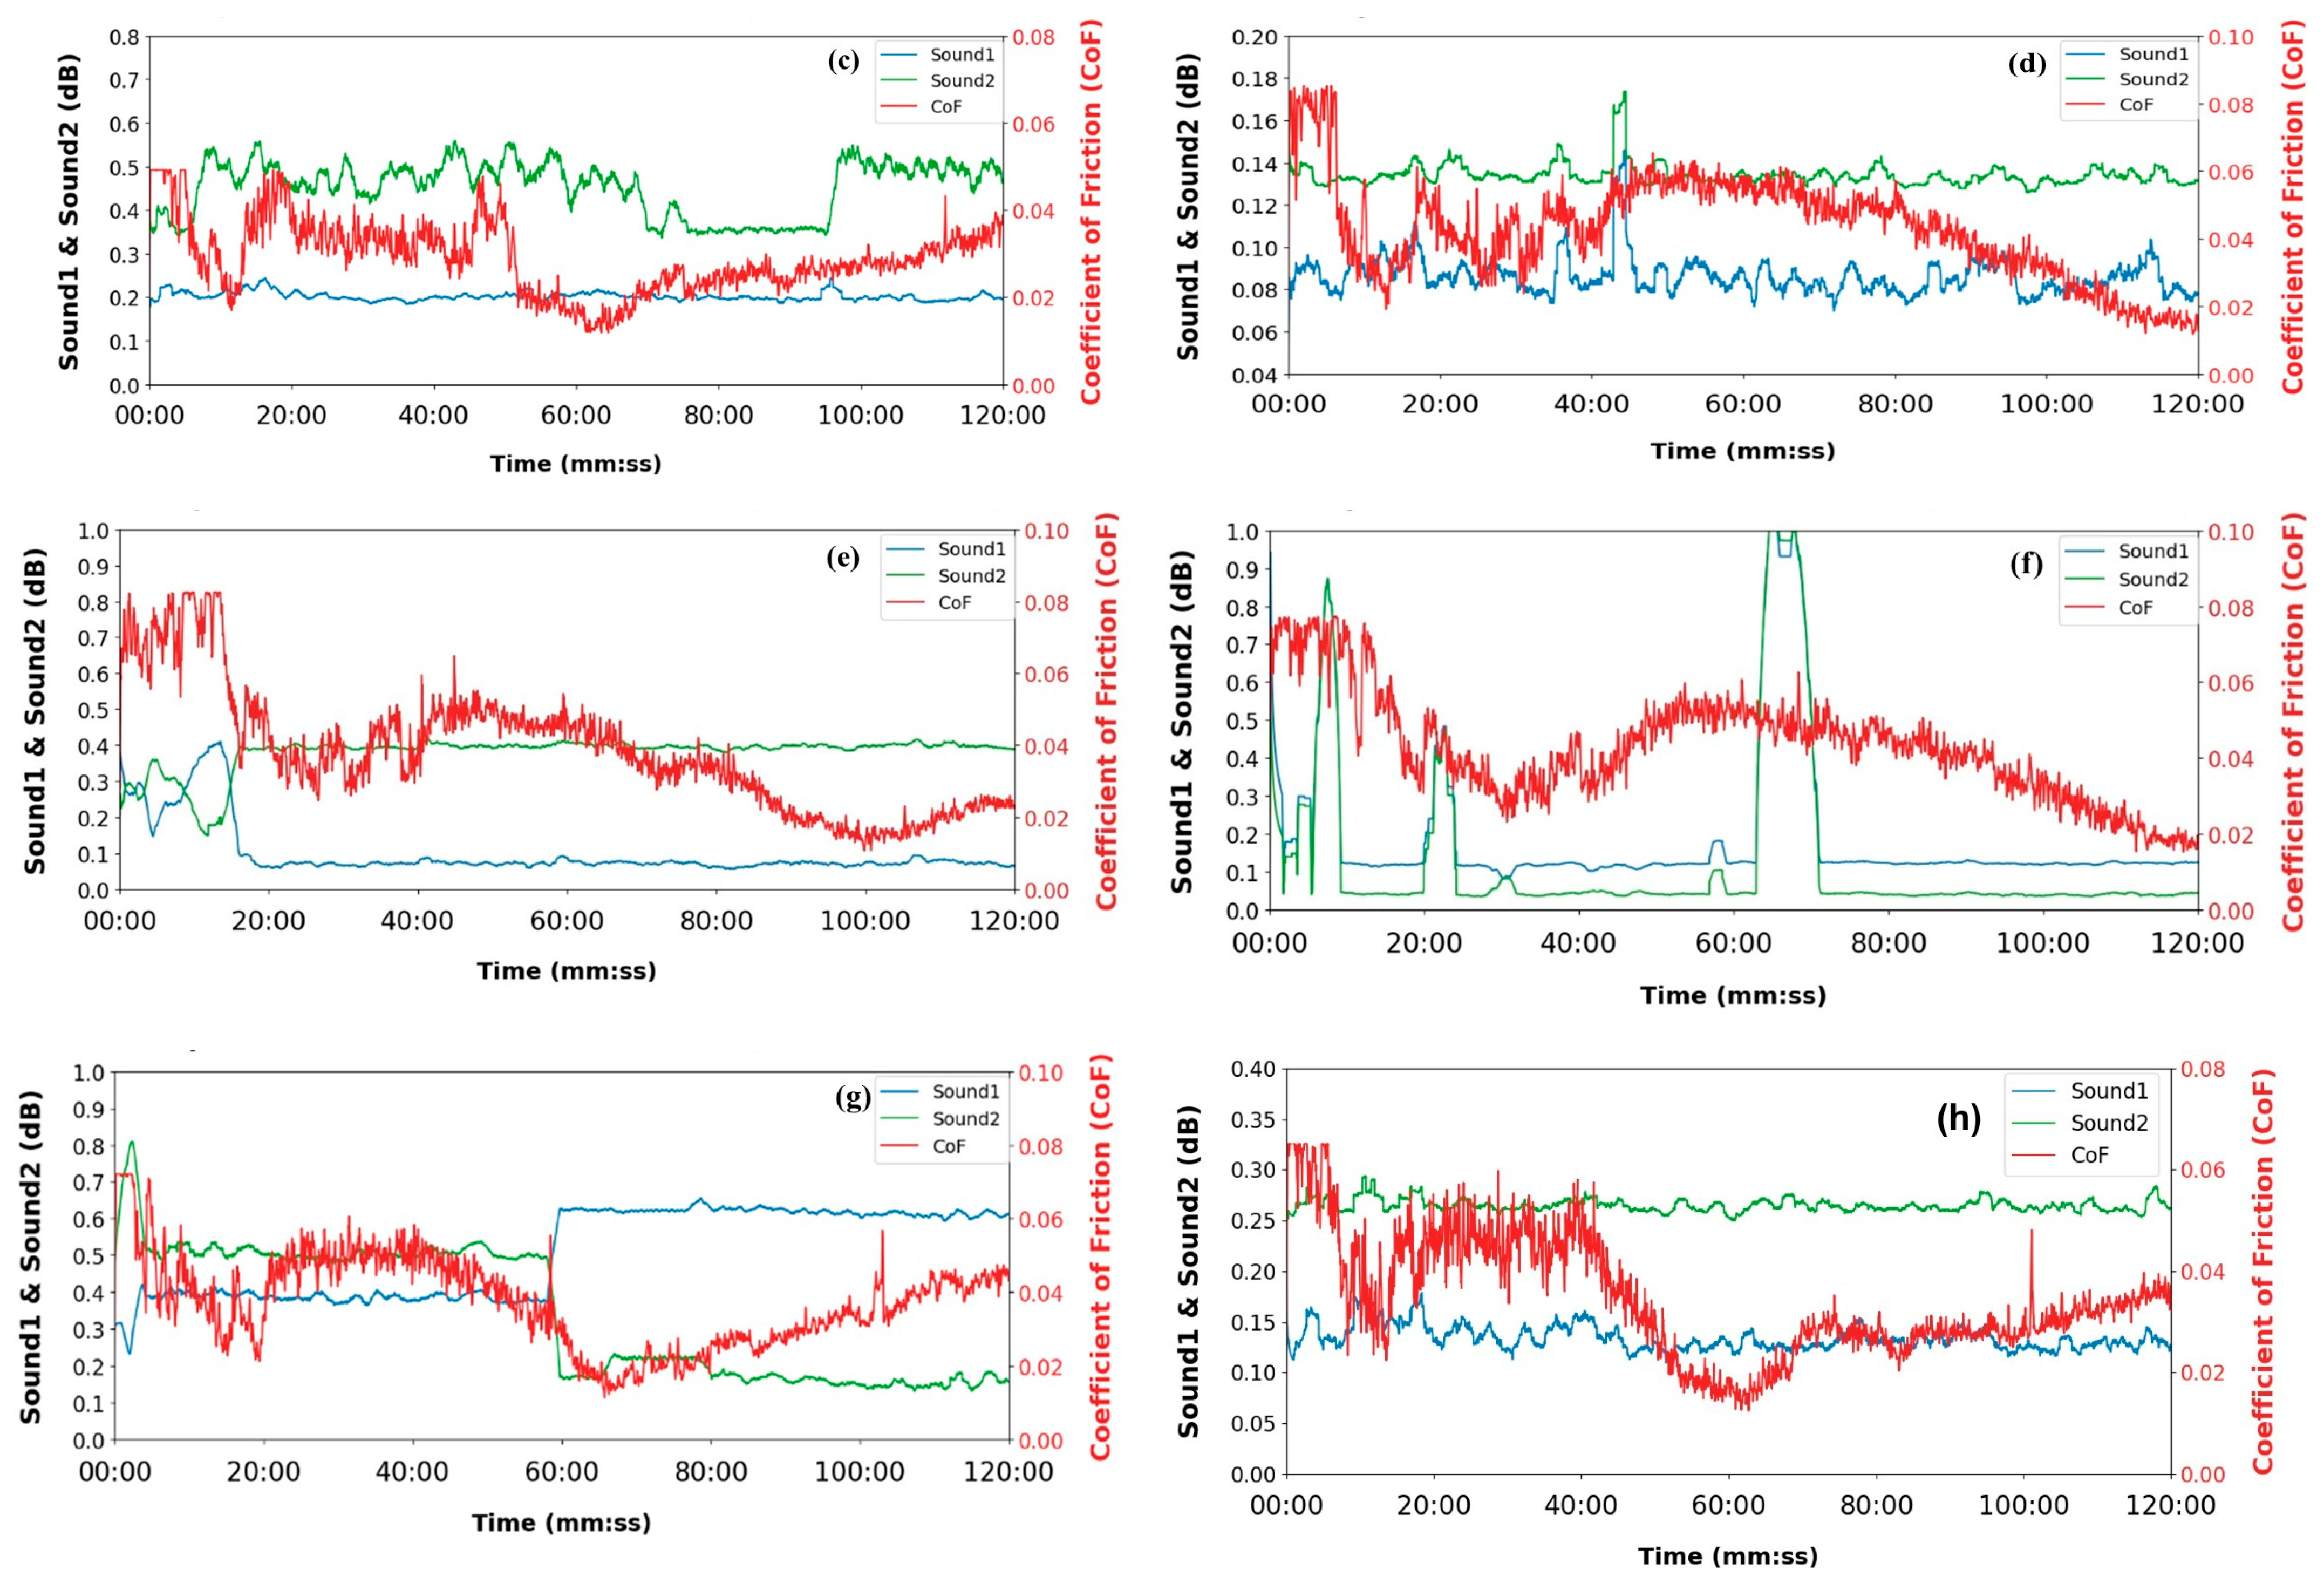
The acoustic emissions were mapped with the CoF for each test as shown in
Figure 10:
Test 1: Initially, from 0 to 30 min, both acoustic emission signals and CoF remain relatively stable. As CoF starts to increase around the 30 min mark, both acoustic emission signals show slight increases in amplitude and variability, but not to the same extent as CoF. During the peak CoF period (40–60 min), Sound1 and Sound2 exhibit more fluctuations, but their overall amplitude does not match the dramatic rise in CoF. This suggests that while the sound generated responds to changes in friction, the relationship is not strictly linear. After 60 min, as the CoF decreases, both sound signals become more stable but exhibit greater variability than at the beginning of the test. The dry test conditions likely caused a significant increase in CoF, possibly due to higher adhesion or material transfer between the surfaces.
Test 2: Initially, from 0 to 30 min, all three parameters (Sound1, Sound2, and CoF) exhibit relatively stable behavior, with Sound2 displaying a slightly higher amplitude than Sound1. As the CoF begins to rise around the 30 min mark, an increased variability in both sound signals was observed, though their overall amplitude changes are less dramatic than the CoF increase. During the period of highest CoF (50–80 min), Sound1 and Sound2 exhibited correlation with the friction trends, displaying increased fluctuations. However, the magnitude of these acoustic changes is not proportional to the extreme CoF spike, suggesting a non-linear relationship between friction and acoustic emissions. After the 90 min mark, as CoF returns to its initial levels, both sound signals also stabilize but maintain a slightly higher variability compared to the test’s start.
Test 1: The graph illustrates the interaction between Sound1, Sound2, and CoF during a Grade A test on a reciprocating test rig over 120 min. Sound1 remains stable around 0.2 dB, indicating consistent operation throughout the test. However, Sound2 shows noticeable fluctuations, particularly between 20:00 and 60:00 min, where its amplitude increases from 0.4 dB to above 0.5 dB, suggesting an increase in mechanical vibrations or surface interactions. Between 60 and 100 min, the system maintains lower friction and acoustic emission levels, indicating a period of smooth operation. However, at 100 min, there is a sharp increase in Sound2 followed by a gradual rise in CoF, signaling a breakdown of the beneficial conditions—possibly due to lubricant depletion or a shift in wear mechanisms.
Test 2: The graph shows the relationship between Sound1, Sound2, and the CoF. Initially, from 0 to 20 min, Sound2 closely follows the fluctuations in CoF, indicating a strong correlation. In contrast, Sound1 displays less pronounced peaks, suggesting it might be less sensitive to the friction changes observed in this period. During this time, the CoF stabilizes around 0.06 with minimal fluctuations. Sound2 remains relatively constant around 0.14 dB, consistently higher than Sound1, which averages around 0.08 dB. This implies that Sound2 may be more attuned to the overall friction conditions, while Sound1 might be detecting subtler surface interactions. The notable increase in both Sound1 and Sound2 at the 40 min mark, coinciding with a brief rise in the CoF, suggests that this rise in acoustic emissions levels could imply the surface is experiencing more significant wear, resulting in greater sound generation. In the final phase (80–120 min), an interesting inverse relationship emerges: as the CoF gradually decreases from 0.06 to 0.02, the amplitude and variability of Sound1 increase significantly, eventually approaching the levels of Sound2. This shift indicates a change in wear mechanisms or surface conditions.
Test 1: From 0 to 20 min, the CoF exhibits high-amplitude fluctuations, ranging from approximately 0.06 to 0.09. During this time, Sound1 shows significant variations, peaking around 0.4 dB before rapidly decreasing, suggesting that Sound1 is highly sensitive to the initial break-in period of the surfaces. At the 40 min mark, an anomaly occurs with a sharp spike in CoF, reaching approximately 0.08, yet neither Sound1 nor Sound2 displays a corresponding spike. This indicates a macroscopic friction event that did not significantly alter the sound emissions, possibly due to the presence of debris particles. Toward the end, the CoF stabilizes around 0.04 to 0.05, while both Sound1 and Sound2 remain constant. Sound2 consistently measures around 0.4 dB, notably higher than Sound1. The CoF then gradually decreases from approximately 0.04 to 0.02, suggesting a smoothing of the surface.
Test 2: The CoF fluctuates significantly in the initial phase, ranging from 0.07 to 0.08, with Sound2 exhibiting high-amplitude spikes of up to 0.9 dB, while Sound1 stabilizes at around 0.1 dB. During the transition phase, CoF stabilizes at 0.03–0.04, and both acoustic emissions exhibit low levels, indicating a decoupling of friction and acoustic signals. The major anomaly, occurring around 65 min, is characterized by a dramatic spike in Sound2 to 1.0 dB, accompanied by only a minor increase in CoF. This suggests that the event, possibly caused by a significant debris particle or sudden surface change, did not substantially affect the overall friction. In the final phase, the gradual decrease in CoF from 0.05 to 0.02, indicative of potential surface smoothing, does not impact acoustic emissions, which remain steady.
Test 1: From 0 to 60 min, Sound1 and Sound2 exhibit relatively stable patterns, with Sound2 showing slightly higher amplitude. During this time, CoF fluctuates between 0.04 and 0.06, indicating some variability. At the 60 min mark, a significant change occurs. Sound1 jumps from 0.4 to 0.6 dB and stays there, while Sound2 drops sharply from 0.5 to 0.2 dB. This sudden change in acoustic emissions levels corresponds with a significant drop in CoF from 0.05 to 0.02, suggesting a decrease in friction. This gradual rise in CoF correlates with subtle increases in both Sound1 and Sound2, as the rise in CoF may indicate that while the system is returning to a higher friction state, the mechanical changes are also affecting the sound signals.
Test 2: In this graph comparing Sound1, Sound2, and the CoF for Grade C—Test 2, we observe distinct patterns and correlations over the 120 min test period. Initially, from 0 to 40 min, there is significant variability in the CoF, fluctuating between 0.04 and 0.06, while Sound1 and Sound2 remain relatively stable, with Sound2 consistently higher than Sound1. Around the 40 min mark, there is a noticeable shift: the CoF starts to decline steadily, reaching its lowest point of around 0.02 at 60 min. After this, the CoF gradually rises again, ending at about 0.04 by the end of the test. Throughout this period, both Sound1 and Sound2 stay relatively stable, with Sound2 still higher. However, there is a sharp spike in CoF just after the 100 min mark that is not reflected in either acoustic emissions measurement.
3.4. Mapping Friction-Induced Vibrations and CoF During the Wear Test
The vibration produced during the friction test was mapped with the CoF recorded during the wear test (
Figure 11). The following has been observed during the wear test:
Test 1: Initially, both start at relatively low values, indicating a stable state with minimal friction and vibration. Between 00:00 and 40:00 min, CoF rises significantly, peaking at around 60 min, while Vibration shows a slight increase and spikes at around 80 min. Towards the end, CoF stabilizes at a lower value, and vibration shows a slight increase at the very end.
Test 2: In the initial phase, the vibration level sharply increases, indicating the onset of surface interaction, which subsequently decreases as the system stabilizes. Simultaneously, the CoF starts low and gradually increases During the middle phase, both vibration and CoF remain stable, with periodic spikes. These fluctuations indicate moments of higher resistance or micro-impacts on the surface. Towards the end, during 80 min both vibration and CoF decrease to a more stable state with coinciding trends.
Test 1: The vibration and CoF exhibit varying correlations throughout the test. Both parameters decrease initially and then exhibit gradual fluctuations, with certain periods where the trends align closely, especially during the 20 min and 40 min intervals, where the peak in vibration coincides with the peaks in CoF. They follow a similar trend during the middle to later stages of the test (beyond 40 min). Towards the end of the test, both begin to show an upward trend, with some spikes corresponding to their increase, indicating the onset of wear that leads to an increase in friction.
Test 2: The CoF and vibration start with a high value and then gradually decrease, with vibration oscillations settling towards 0.3 V. The vibration exhibits a consistent pattern of rises and falls, with coinciding peaks between 20 and 40 min. CoF gradually decreases to lower values towards the end of the test, suggesting stabilization in friction characteristics. Vibration also exhibits a similar curve to that of CoF during the 80 to 100 min.
Test 1: The CoF begins with a relatively high value and sharp fluctuations. There is an overlap in the pattern of both parameters during the initial phase from 20 to 40 min showing a consistent trend. Between 60 and 70 min, the vibration peak aligns with the trends in CoF, after which CoF gradually stabilizes and starts decreasing, with fewer fluctuations, indicating reduced frictional resistance.
Test 2: The vibration shows a consistent trend with the CoF throughout the test, with intervals where its peaks coincide. Both CoF and vibration start high, and there is a similar drop within the first 10 min. Between 30 and 50 min, there is a clear correlation where peaks of vibration coincide with a slight increase in the CoF, and a similar trend between 60 and 80 min with overlapping peaks and troughs, suggesting the changes in frictional resistance. CoF and vibration gradually decrease towards the end of the test.
Test 1: In the initial phase, there is a noticeable overlap between the vibration and CoF, both with a high amplitude and downward trend. They have a similar pattern between 20 and 60 min with coinciding peaks. After 60 min, both follow a similar increasing trend. In the final phase (from 90:00 to 120:00), both signals exhibit a general upward trend, with occasional spikes indicating wear of the contact surfaces.
Test 2: Initially, both start at relatively low values, indicating a stable state with minimal friction and vibration. Between 00:00 and 40:00 min, CoF rises significantly, peaking at around 60 min, while vibration shows a slight increase and spikes at around 80 min. Towards the end, CoF stabilizes at a lower value, and vibration shows a slight increase at the very end.
Summarizing the observations from
Section 3.3 and
Section 3.4, it can be seen that although the CoF-sound generated and vibration-wear correlate well throughout the experiment, there are situations where the sound generated and vibrations sometimes spike independently. This spike in CoF and vibrations in a dynamic tribo system is due to the high wear that occurs at that instant, resulting from the instability of the lubricant film that leads to its rupture at that particular instant, thereby causing excessive wear. The occurrence of high wear has already been observed from the deep groove formation and damaged surfaces, as shown in
Figure 9 [
20].
3.5. Tribo-Mechanisms Towards the Generation of Acoustic Emissions and Vibration Induced Due to Friction
The results from both dry and lubricated wear tests indicate that both acoustic emissions and vibration readings need to be considered when correlating them with tribological properties. A good correlation exists between surface damage and acoustic emissions produced. High friction and high wear will produce high acoustic emissions due to the increased dislocation densities caused by plastic deformations. The higher acoustic emissions, along with high vibration values, are a clear indication of extensive asperity interaction between the two bodies in dry conditions [
21]. These acoustic emissions and the vibration values were reduced in the presence of aerosols, which created a lubricating film on the surface. Although the coefficient of friction between all the samples with aerosol was nearly identical, the acoustic emissions exhibited by Grade A and Grade B were similar to each other. In contrast, those of Grade C were higher compared to Grades A and B. This raised an interesting point: whether the frictional coefficient and acoustic emissions should be investigated without further evaluation of other parameters, such as the vibration induced by friction. Geng et al. [
22] reported a poor correlation between acoustic emission and load due to the suppression of friction-induced plastic deformation by the oxide layer fracture noise occurring in dry friction of steel. Hence, the vibration readings were investigated and were observed to follow a slightly different trend than the coefficient of friction in relation to the aerosol performance. Even though the acoustic emissions were similar for Grade A and Grade B, the vibration readings were lowest in the Grade B sample. Correlating the vibration readings with the coefficient of friction, it can be seen that the dry condition exhibited the highest vibrations, consistent with its highest coefficient of friction, even though the coefficients of friction in the samples were similar. Still, vibrations were least in Grade B and almost similar in Grades A and C.
High vibrations in dry, Grade A, and Grade C conditions are related to the extent of surface damage, such as intense deep grooves on wear scars, plastic deformations, and adhered particles. Zhang et al. [
11] also reported that the formation of cracks on the surfaces of the mating pairs increases the vibration induced by friction. The present work exhibited higher surface damage in dry, Grade A, and Grade C conditions compared to Grade B. Consequently, the vibrations in the case of Grade B were the least, followed by Grade A and Grade C, with the highest being in dry conditions. Geng et al. [
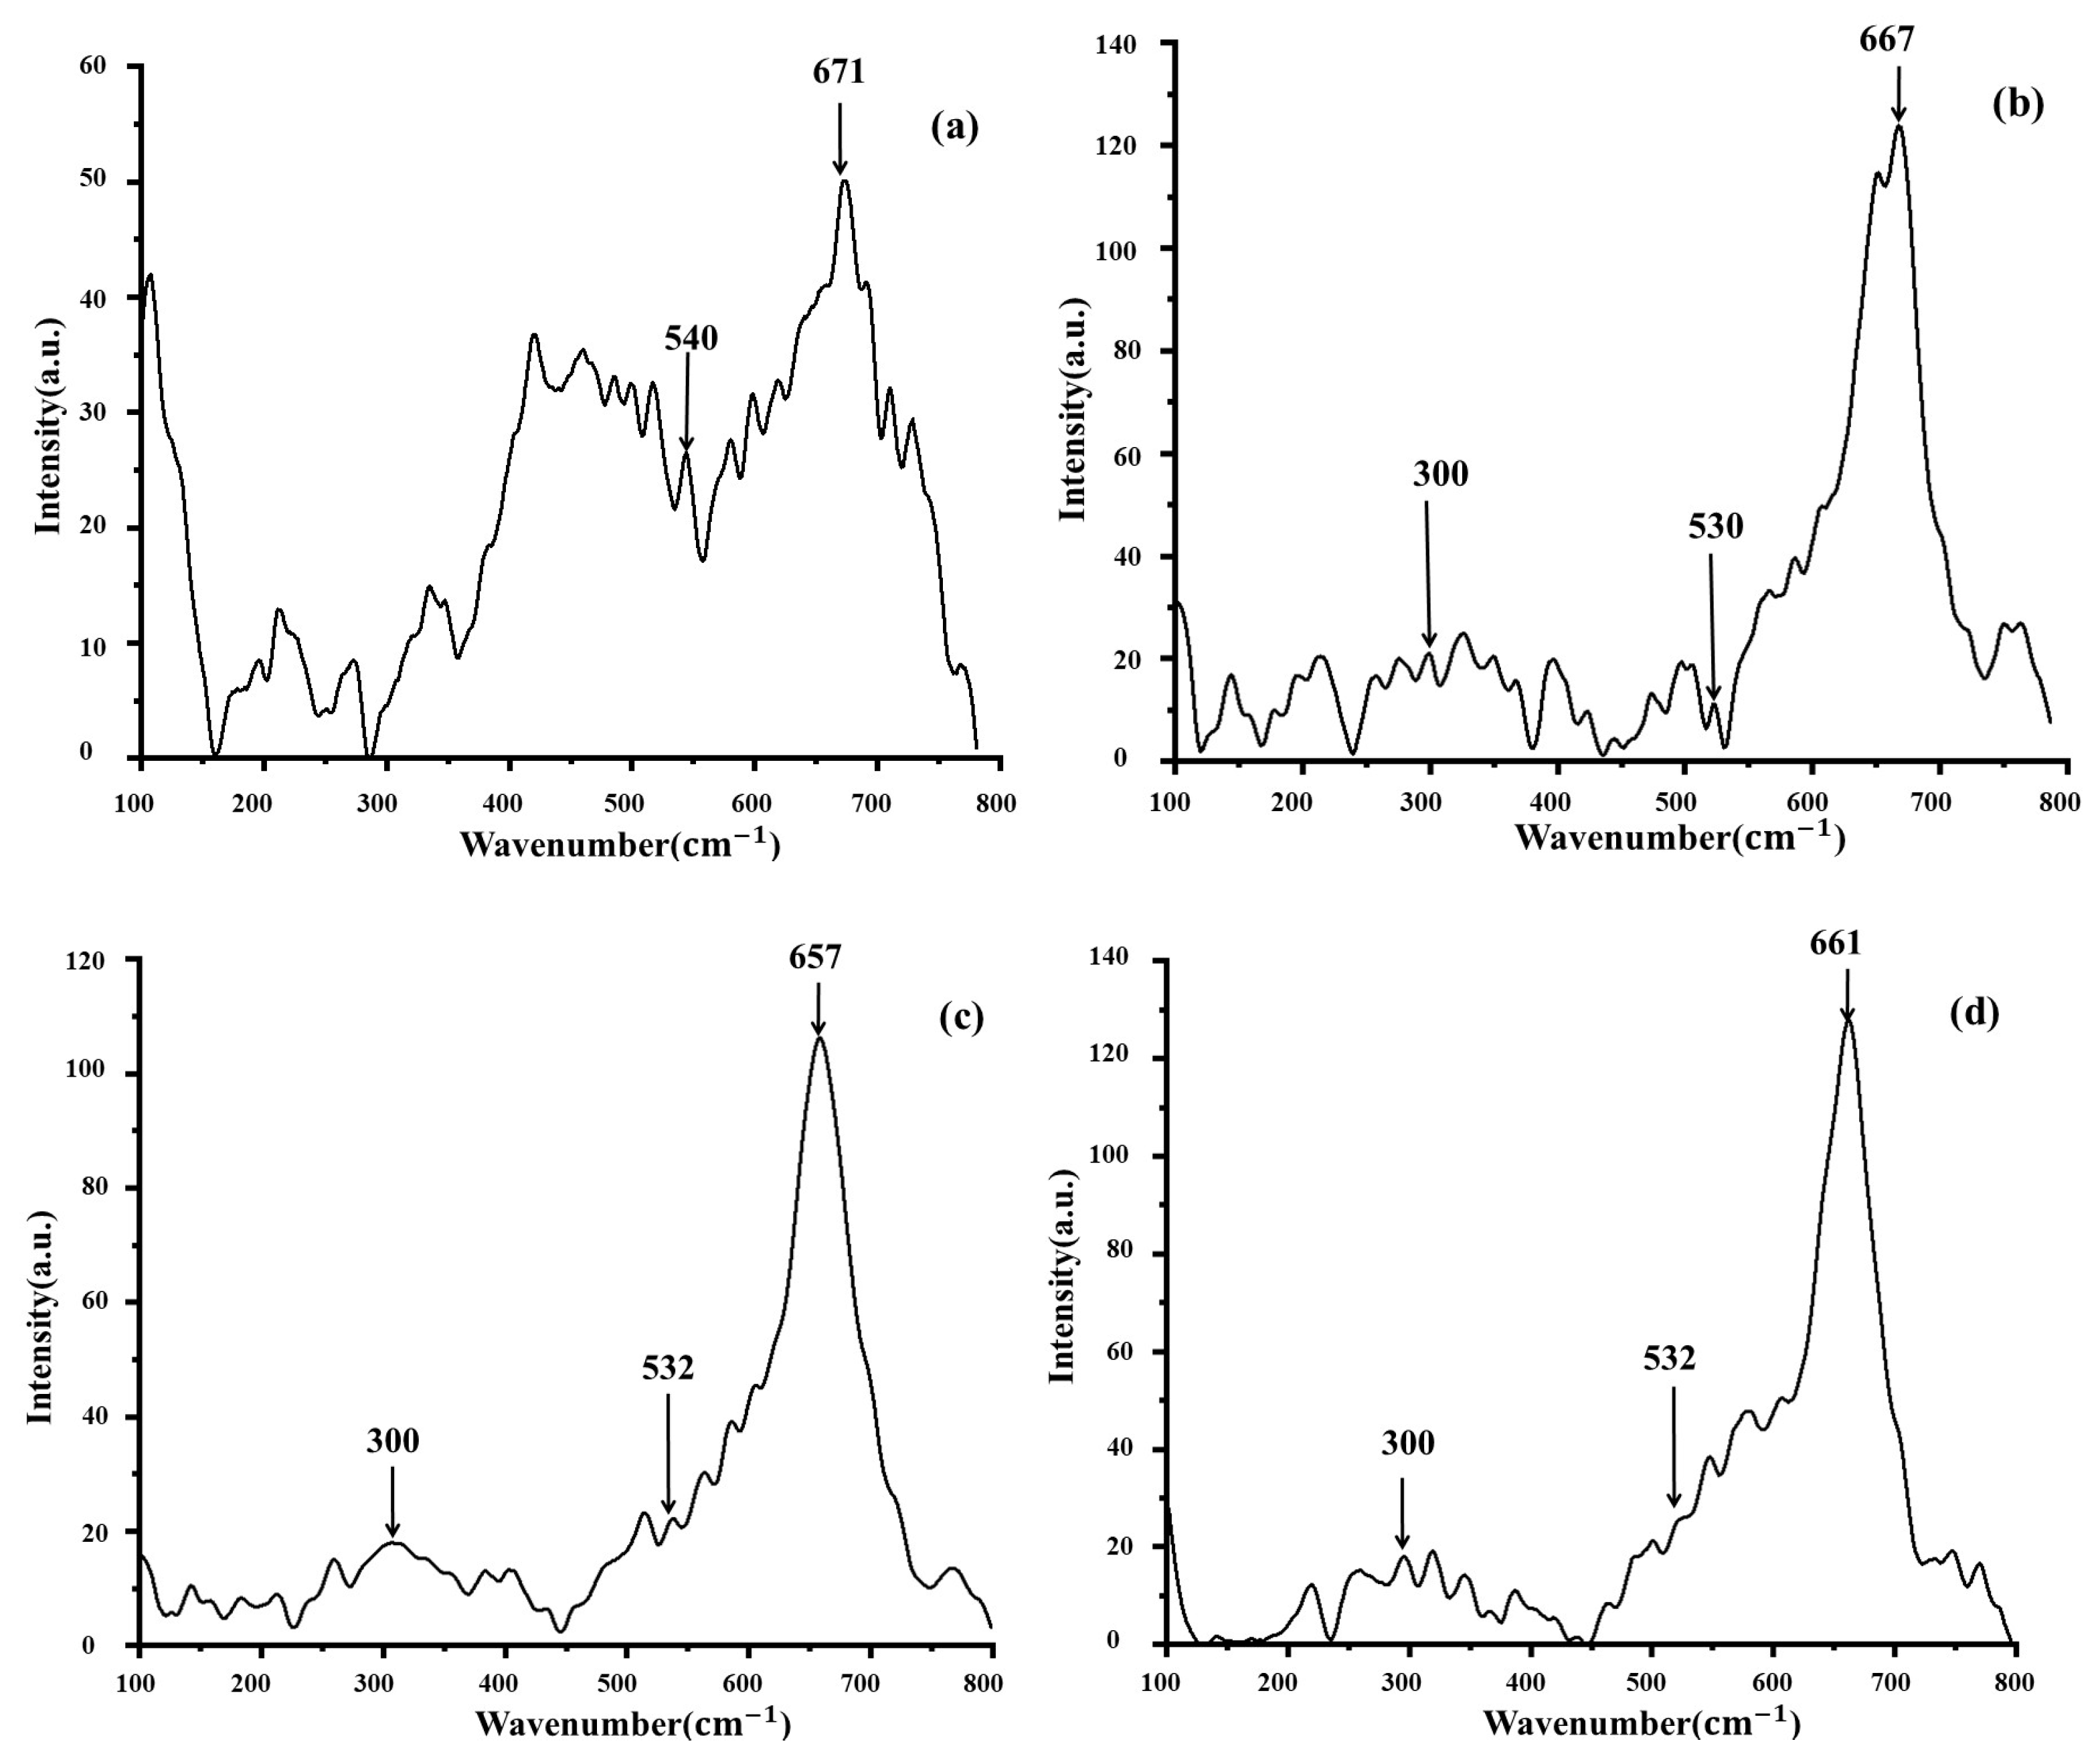
22] reported the formation of various iron oxides on the surface of the mating pair and their profound effects on the sound emissions. The oxide particles are crushed, and the noise from the oxide fracture is detected by the acoustic sensor. The vibrations caused during this crushing are also captured by the sensors during the vibration measurement. The Raman spectra of the wear scars on the pin and the plates indicated the formation of iron oxides (
Figure 12 and
Figure 13). The Raman peaks at 300 cm
−1 to 670 cm
−1 are almost similar to those reported by De Faria et al. [
23], indicating the formation of iron oxides. These oxide layers prevent direct contact between the mating pairs. It can be observed that the Raman peaks are more intense, with strong peaks of iron oxides, in dry conditions compared to the Raman peaks of aerosol-lubricated samples. This results in higher acoustic emissions and vibrations in dry conditions compared to the aerosol-lubricated samples.


