Article

Determination of the Mechanical Tensile Characteristics of Some 3D-Printed Specimens from NYLON 12 CARBON Fiber Material

by
Claudiu Babiș
1,
Andrei Dimitrescu
1,*,
Sorin Alexandru Fica
2,
Ovidiu Antonescu
1,
Daniel Vlăsceanu
1 and
Constantin Stochioiu
1
1
Faculty of Industrial Engineering and Robotics, National University of Science and Technology Politehnica Bucharest, Splaiul Independenței 313, 060042 Bucharest, Romania
2
National Research and Development Institute for Electrical Engineering, Splaiul Unirii 313, Sector 3, 030138 Bucharest, Romania
*
Author to whom correspondence should be addressed.
Technologies 2025, 13(10), 456; https://doi.org/10.3390/technologies13100456
Submission received: 5 July 2025 / Revised: 21 September 2025 / Accepted: 30 September 2025 / Published: 8 October 2025

Abstract

This study investigates the mechanical behavior of Nylon 12 Carbon Fiber specimens manufactured through fused filament fabrication (FFF) for potential integration into light water well drilling rigs. Fifteen tensile test samples were 3D-printed on a MakerBot Method X printer in three orientations: horizontal, vertical, and lateral. Each specimen was printed with a soluble SR-30 support material, which was subsequently dissolved in an SCA 1200-HT wash station using heated alkaline solution. Following support removal, all samples underwent thermal annealing at 80 °C for 5 h in the printer’s controlled chamber to eliminate residual moisture and improve structural integrity. The annealed specimens were subjected to uniaxial tensile testing using an Instron 8875 electrohydraulic machine, with strain measured by digital image correlation (DIC) on a speckle-patterned gauge section. Key mechanical properties, including Young’s modulus, Poisson’s ratio, yield strength, and ultimate tensile strength, were determined. Finally, a finite element analysis (FEA) was performed using MSC Visual Nastran for Windows to simulate the tensile loading conditions and assess internal stress distributions for each print orientation. The combined experimental and numerical results confirm the feasibility of using additively manufactured parts in demanding engineering applications.

1. Introduction

Additive manufacturing (AM), particularly 3D printing, has become an increasingly viable solution for producing functional components in industrial applications [1,2,3]. This study investigates the feasibility of fabricating selected parts for light water well drilling rigs using fused filament fabrication (FFF), with the main objective of evaluating whether AM-produced components can withstand the operational stresses typical of such mechanical systems [4,5,6]. The research addresses the need for flexible, cost-effective alternatives to conventional machining processes and aims to contribute to the modernization of drilling equipment through lightweight and customizable parts [7,8,9,10].
In the context of light water well drilling rigs, components are frequently exposed to humidity, temperature variations, and mechanical stresses. Nylon 12 Carbon Fiber (PA12-CF) was selected for this study due to its well-established combination of high strength, stiffness, chemical resistance, and low water absorption. These attributes make it a suitable candidate for manufacturing load-bearing components that must maintain dimensional stability and durability in wet environments. Moreover, PA12-CF enables the production of complex, lightweight geometries with consistent mechanical performance, which is particularly advantageous for mobile or modular drilling rigs. Compared to other Carbon Fiber reinforced polymers (CFRPs), PA12-CF stands out due to its lower water absorption, high dimensional stability in humid conditions, and excellent printability using FFF technology. While other thermoplastics such as ABS-CF or PETG-CF may offer competitive stiffness or thermal stability, they often exhibit inferior resistance to moisture or interlayer adhesion issues. Thus, PA12-CF represents a balanced and robust choice for engineering applications involving complex geometries and variable mechanical loads, such as those encountered in drilling equipment.
Preliminary investigations indicate that certain structural elements, such as the washing head housing, show promising compatibility with AM technologies and can be effectively produced via 3D printing without compromising mechanical integrity [11,12,13]. These advantages are particularly significant for reducing material waste, shortening production times, and lowering overall manufacturing costs compared to traditional subtractive methods.
Additionally, several studies published in the Buletinul Științific al Universității Politehnica din București have addressed key aspects of raster-angle effects, thermal post-processing, structural simulations, cost–benefit assessments, support-removal techniques, material utilization, fatigue durability, print-speed influences, statistical anisotropy analyses, and finite-element modeling of FFF-printed composites [1,4,6,7,10,11,12,13,14,15,16]. Complementary international studies have further analyzed FEM of composites [17,18].
In addition to experimental characterization, Finite Element Modeling (FEM) is a powerful tool for predicting the mechanical response of anisotropic, additively manufactured components. By incorporating experimental tensile data into numerical simulations, FEM enables a detailed evaluation of stress concentrations, strain localization, and failure initiation across different build orientations. Several recent studies have successfully applied FEM to validate and optimize the structural performance of 3D-printed polymer composites [19,20,21].
Recent studies highlight the crucial role of Finite Element Modeling (FEM) in complementing experimental tensile testing for evaluating the mechanical behavior of 3D-printed composite materials. FEM provides a detailed understanding of the internal stress and strain distribution in printed specimens, offering valuable insights into the anisotropic response governed by print orientation and infill structure. Furthermore, several recent MDPI studies have employed FEM to analyze Carbon Fiber reinforced thermoplastics, supporting both process optimization and the prediction of mechanical performance [22,23,24,25].
The mechanical performance of 3D-printed nylon and Carbon Fiber reinforced parts strongly depends on fabrication parameters such as build orientation, raster angle, infill density, and thermal post-processing. Recent investigations have demonstrated that orientation-dependent behavior can significantly influence tensile strength and ductility [26,27,28], while other studies have highlighted the effects of annealing and fiber distribution on interlayer bonding and mechanical anisotropy [29,30]. In addition, advanced numerical techniques and data-driven models, such as Artificial Neural Networks (ANN) combined with FEM, have been successfully applied to correlate process parameters with the stress–strain response of PA12-CF composites [31].
In this study, the tensile specimens were derived from simplified geometries representative of real functional components used in light water well drilling rigs—notably the pump rotor bracket and anti-rotation guide elements. These components are subject to uniaxial and cyclic loading during operation and typically require high dimensional stability, strength, and durability. The study investigates how different print orientations affect mechanical performance, with the aim of validating the suitability of fused filament fabrication (FFF) for producing such parts. The use of Nylon 12 Carbon Fiber filament was motivated by its high strength-to-weight ratio, low water absorption, and stability under load, which are essential properties for components operating under field conditions.
This work provides an original contribution by integrating tensile testing, digital image correlation (DIC), and finite element analysis (FEA) to characterize the anisotropic mechanical behavior of PA12-CF specimens fabricated via FFF. The influence of print orientation on strength, stiffness, and strain distribution is systematically investigated. Moreover, the combination of experimental data and simulation insights supports optimized design strategies for load-bearing components in light water well drilling rigs.

2. Materials and Methods

2.1. Sample Manufacturing and Preparation

Mechanical testing was carried out in accordance with ISO 527-2:2019 [32], which specifies the geometry of the specimens including a thickness of 5 mm, as shown in Figure 1. The specimens were manufactured by 3D printing.
The fused filament fabrication (FFF) process induces mechanical anisotropy due to the directional deposition of material. Adhesion between layers is typically weaker than the strength of the filament itself, which affects the overall mechanical performance depending on print orientation. To capture this behavior, three printing orientations were selected: horizontal (maximum strength, filament-dominated), vertical (minimum strength, layer adhesion-dominated), and lateral (intermediate). This approach enables the identification of orientation-dependent mechanical limits relevant for structural applications.
Moreover, these orientations reflect practical configurations encountered in the design of components for light water well drilling rigs, where complex part geometries and varying loading directions make it essential to understand the anisotropic response of printed materials.
Consequently, these three orientations were selected based on preliminary analyses of stress trajectories and filament deposition paths that are typically observed in components of light water well drilling rigs. The selection aimed to replicate realistic loading directions that printed parts are expected to experience under service conditions. Accordingly, the filament directions in the A, B, and C configurations correspond to diagonal (45°), vertical (90°), and longitudinal (0°) orientations relative to the loading axis.
The printing process was carried out using the Maker-Bot Method X Carbon Fiber Printer (MakerBot Industries LLC, Brooklyn, NY, USA), which employs two types of FFF (fused filament fabrication) filaments: a high-strength black Nylon 12 Carbon Fiber filament and a white SR-30 support filament, that is subsequently dissolved in a specialized wash station.
The primary material used for the specimens was Nylon 12 Carbon Fiber (PA12-CF), a thermoplastic composite filament reinforced with short Carbon Fibers. According to the manufacturer (MakerBot Industries LLC, Brooklyn, NY, USA), this material contains approximately 14% Carbon Fiber by volume. The fibers are pre-compounded and uniformly dispersed within the polyamide matrix, which enhances stiffness, tensile strength, and thermal stability while maintaining good printability. This fiber content is generally considered optimal for balancing mechanical performance with manufacturability in FFF processes.
To improve reproducibility, the printing process was configured identically for all specimens using MakerBot Print. Each layer began at the front-left corner of the specimen and followed a consistent clockwise extrusion path. The PA12-CF filament was extruded at 260 °C through a 0.4 mm nozzle, with a layer thickness of 0.16 mm. A total of three outer contour lines (perimeters) were applied to enhance dimensional accuracy and wall strength.
The printed material (PA12-CF) provides intrinsic reinforcement through uniformly distributed short Carbon Fibers. No additional structural features, such as ribs or shells, were included in the CAD geometry. However, temporary support material (SR-30) was automatically generated by the slicing software and subsequently removed after printing.
A graphical illustration of the slicing strategy and extrusion path is presented in Figure 2 to clarify the internal and external layout of the printed layers.
The visualizations provide insight into the toolpath strategy implemented by the slicing software, including the perimeter lines, infill patterns, support material, and travel movements. This representation helps to better explain the mechanical behavior of the printed parts, particularly in relation to filament orientation, material distribution, and potential stress concentration zones.
Furthermore, the preview images serve as a useful reference for comparing the three configurations, clearly illustrating how the same CAD geometry is translated into different layer orientations depending on the build direction. This aspect is essential for interpreting the results of the mechanical tests and finite element simulations presented later in the study.
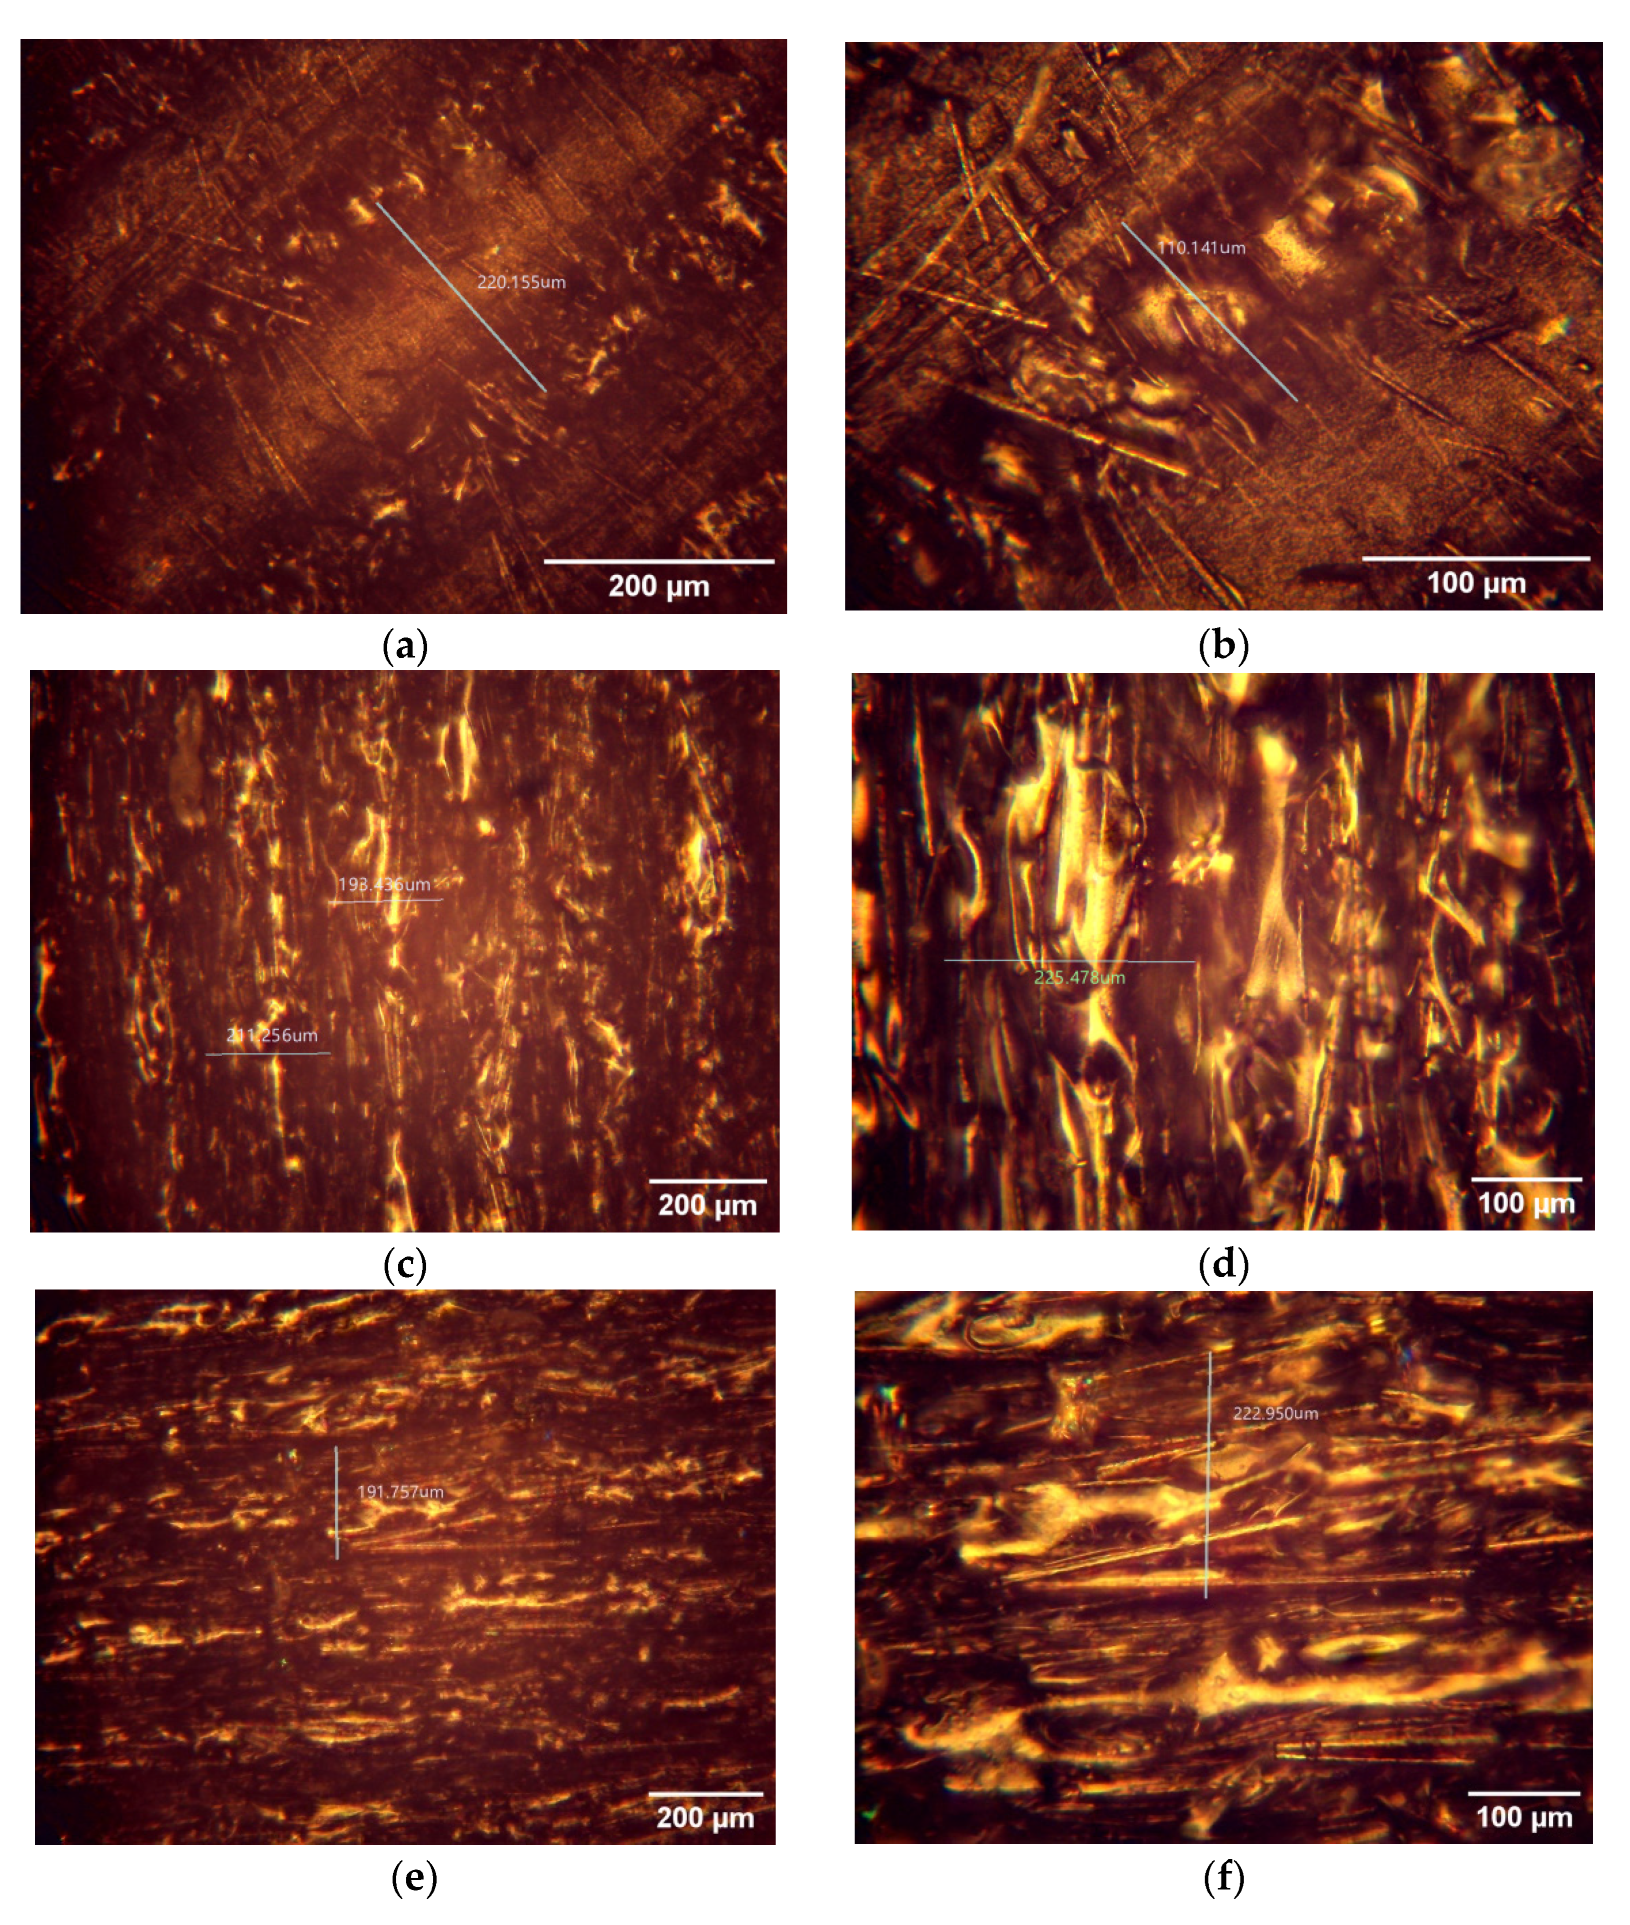
To assess the internal structure and quality of the printed specimens, representative micrographs were obtained from specimens printed in all three orientations, (a,b) horizontal orientation (Set A–45°), (c,d) vertical orientation (Set B–90°), and (e,f) lateral orientation (Set C–0°), as shown in Figure 3. The images illustrate differences in filament alignment and interlayer adhesion resulting from the layer-by-layer deposition strategy. The horizontal (Set A–45°) specimens show inclined filament paths and moderate interlayer bonding. The vertical (Set B–90°) specimens reveal distinct interlayer boundaries, where adhesion is comparatively weaker. The lateral (Set C–0°) specimens exhibit continuous and aligned filaments, ensuring superior bonding along the tensile axis. These microstructural observations support the differences in mechanical performance recorded during tensile testing.
These structural features are essential for understanding the load transfer mechanisms and fracture behavior of the printed specimens. To provide a more detailed characterization, optical micrographs were captured at two magnifications (100× and 200×) for each printing orientation. The corresponding images are shown in Figure 3, allowing for a direct comparison of filament alignment, interlayer bonding quality, and potential defects across the three configurations.
Such microscopic observations are highly relevant as they establish a direct correlation between filament arrangement and the macroscopic tensile behavior. The presence of aligned or misaligned filaments, the degree of interlayer adhesion, and the occurrence of voids or defects can significantly influence stress distribution during mechanical testing. Therefore, the micrographs in Figure 3 provide a solid foundation for interpreting the tensile results presented in the following sections.
In this context, the microscopic evaluation not only validates the printing strategy illustrated in Figure 2 but also offers a microstructural basis for correlating deposition paths with the experimental tensile results. This combined approach ensures a more comprehensive understanding of the mechanical behavior of PA12-CF printed specimens.
The soluble SR-30 support material was removed using the SCA 1200-HT washing station (Oryx Additive, distributed by Stratasys, Minnetonka, MN, USA) in combination with the Ecoworks alkaline cleaning agent (pH 9.8). All specimens (five for each build orientation: Set A–45°, Set B–90°, and Set C–0°) were placed together in the same stainless steel basket and washed simultaneously under identical conditions. For this process, 42 L of water and 950 g of Water Works powder were added to the washing tank, and the dissolution cycle was performed at 85 °C for 8 h, following the manufacturer’s recommendations. This procedure ensured the complete removal of the support material without compromising the mechanical integrity of the Nylon 12 Carbon Fiber specimens. Figure 4 illustrates the support removal process: specimen placement in the basket (a), immersion of the basket in the solvent bath (b), rinsing under water jet (c), and the SCA 1200-HT washing station used in this study (d).

2.2. Annealing Treatment

After the support material was dissolved, all specimens were labeled and prepared for subsequent thermal treatment (annealing). The annealing procedure was carried out inside the enclosed and heated chamber of the MakerBot Method X Carbon Fiber printer at a constant temperature of 80 °C for 5 h, as recommended for Nylon 12 Carbon Fiber materials, as shown in Figure 5. This process was applied to the 3D-printed specimens to eliminate residual moisture and enhance their mechanical strength.
Beyond moisture removal, this thermal post-treatment facilitates the relaxation of residual stresses accumulated during the layer-by-layer deposition process, thereby enhancing dimensional stability and interlayer bonding in the printed parts. The selected temperature, being below the glass transition temperature of Nylon 12, enables stress relief without causing deformation. Consequently, annealing ensures more consistent mechanical behavior across specimens during tensile testing.

2.3. Tensile Testing

After annealing, the specimens were subjected to uniaxial tensile testing to evaluate their mechanical behavior. The experiments were conducted on an Instron 8875 electrohydraulic testing machine (Instron, Norwood, MA, USA), equipped with a 25 kN load cell, at a constant crosshead speed of 2 mm/min. Deformation was monitored using digital image correlation (DIC) with a Q-400 system (Version Q-400, Dantec Dynamics, Skovlunde, Denmark).
Digital image correlation (DIC) was employed as a non-contact optical technique for full-field strain measurement during tensile testing. This method allows for the simultaneous evaluation of axial and transverse deformations across the entire surface of the specimen, offering a significant advantage over traditional point-based methods. Through the high spatial resolution of strain data, DIC enables the direct calculation of Poisson’s ratio during loading. Moreover, it provides valuable insight into the heterogeneity of the strain field, which may indicate material inhomogeneity or printing-related defects that would otherwise remain undetected.
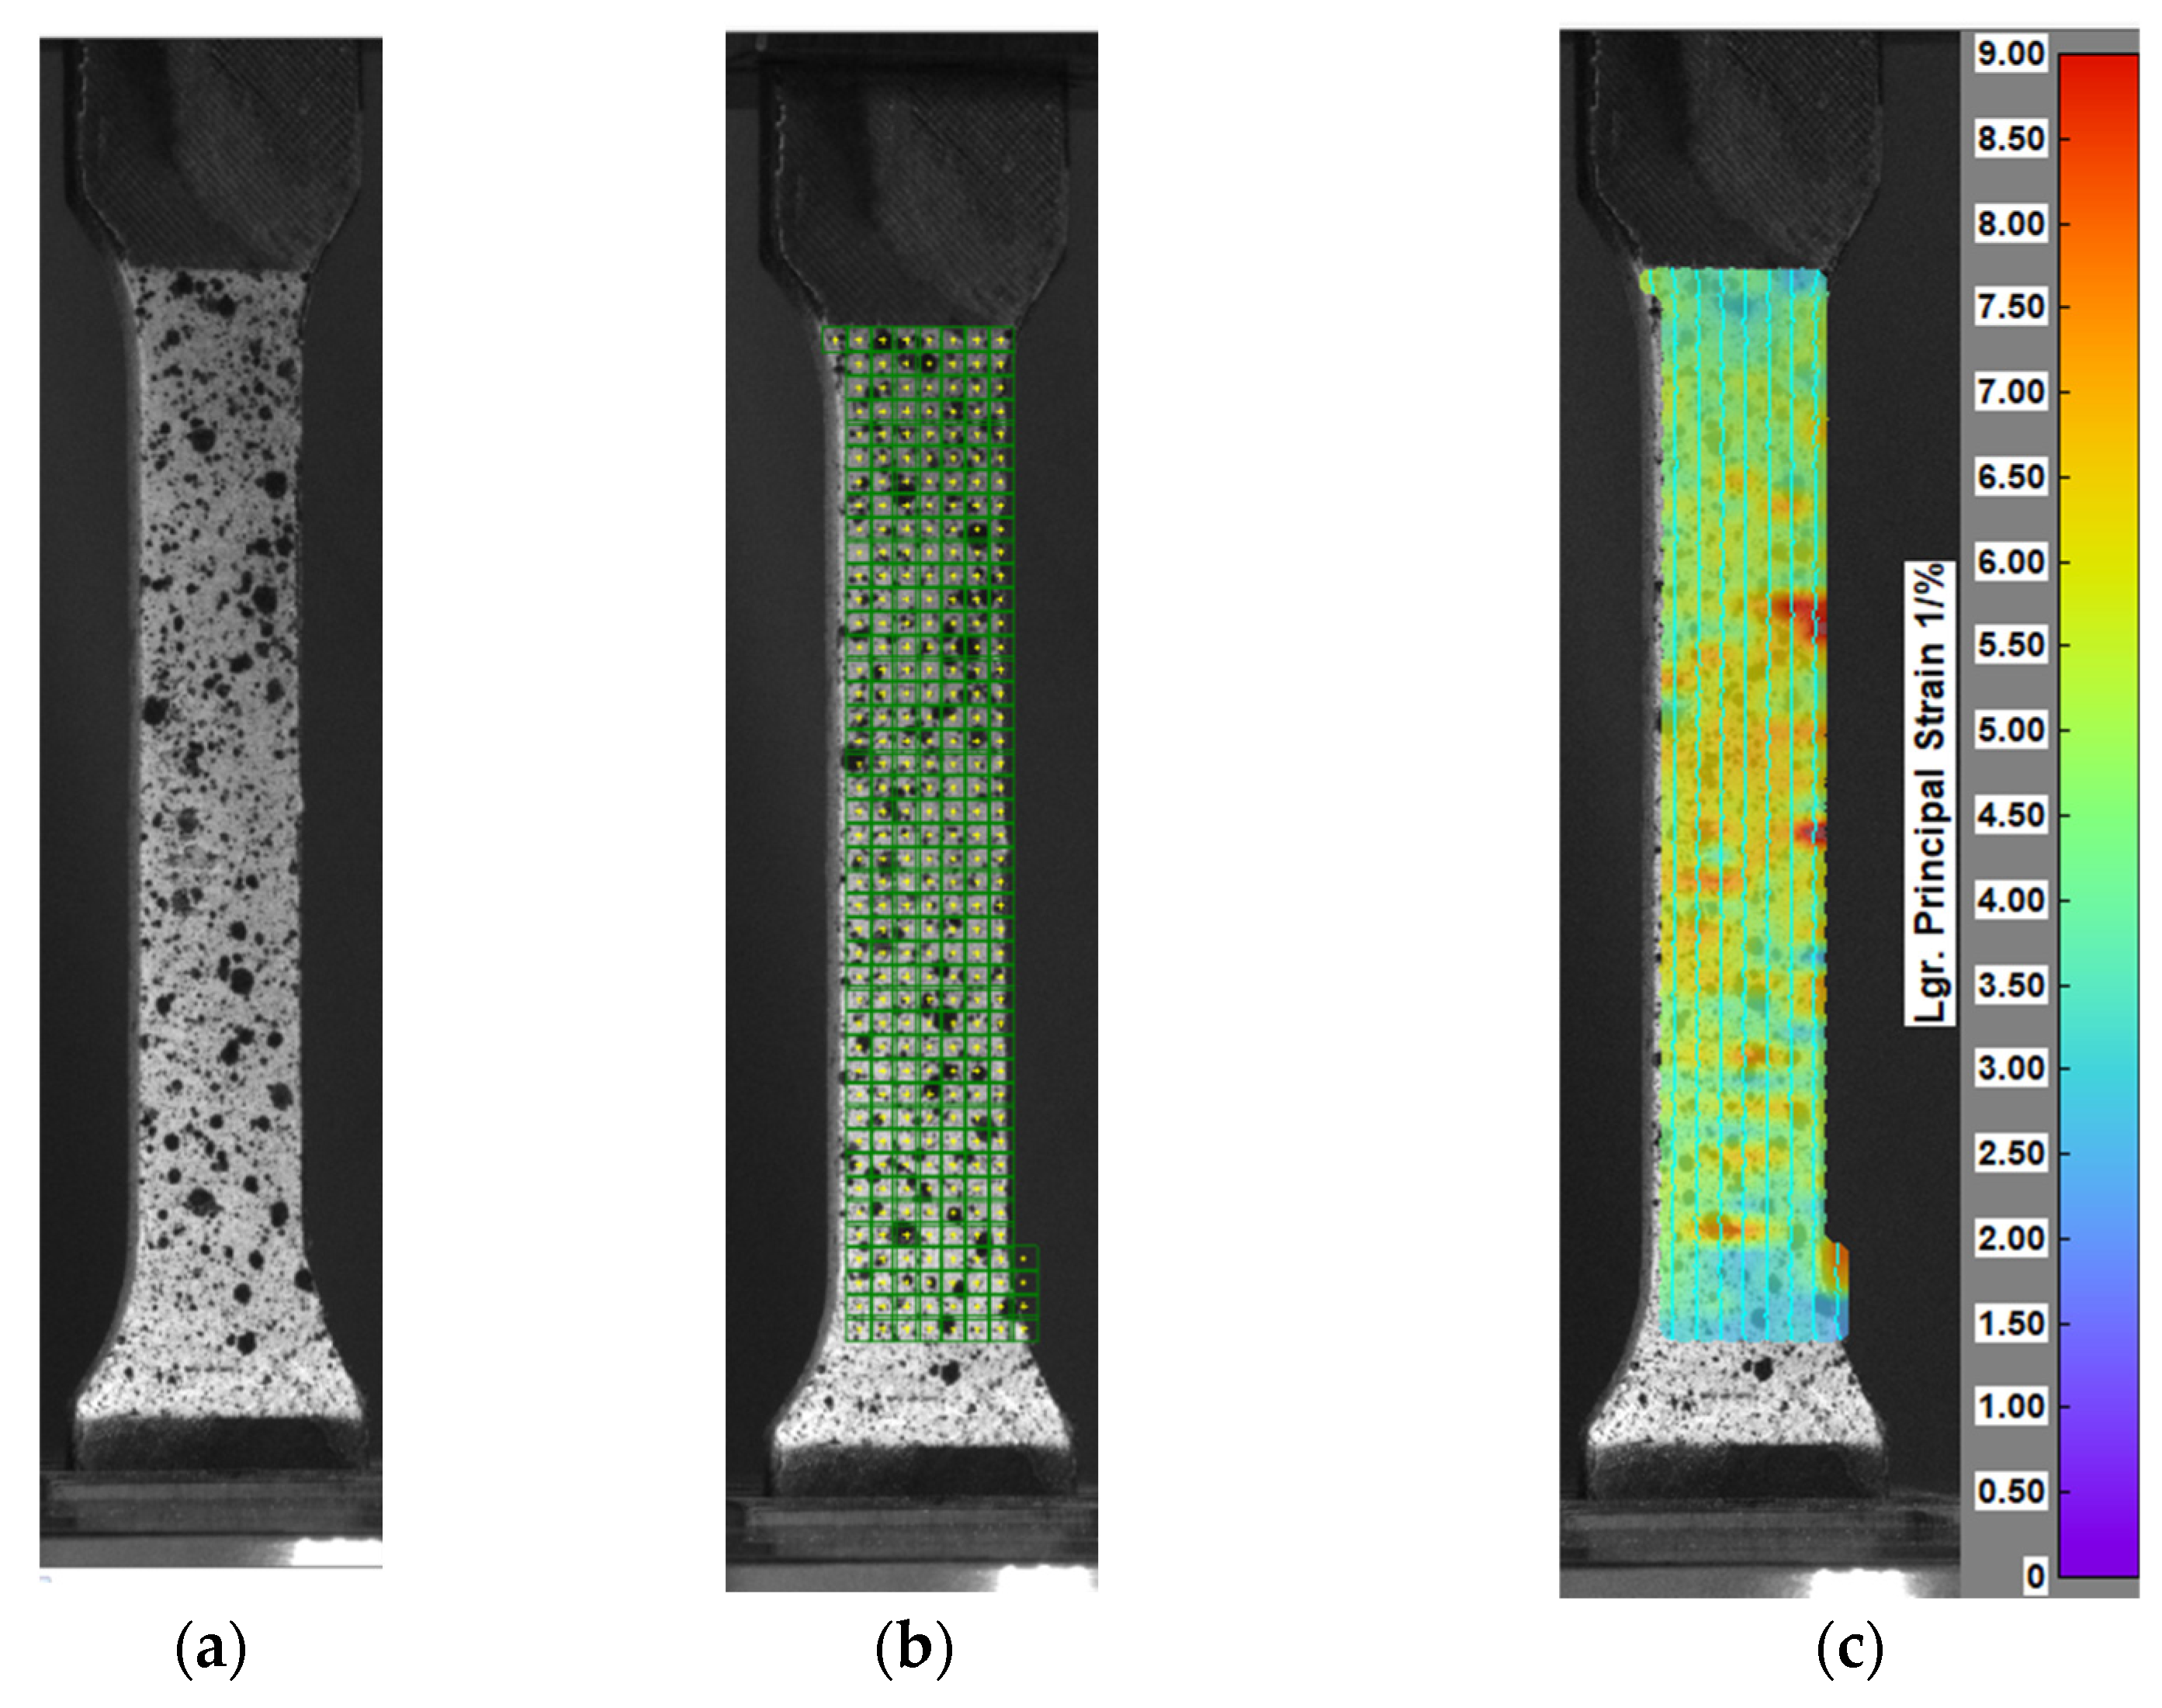
A representative set of images, showing the working principle for strain determination, is presented in Figure 6a–c. First, the recorded surface is spray-painted with a white background and black droplets, which are captured in images during loading. The process involves dividing the surface of interest into facets and analyzing pixel displacement within each facet region to determine the strain field.
Engineering stress was calculated using the following formula:
σ   =   F A   [ M P a ]
where F is the applied force measured by the load cell, and A is the cross-sectional area of the specimen, assumed to be 40 mm2.
The yield strength was defined as the apparent yield strength, corresponding to a 0.2% offset strain, which is standard practice in the mechanical testing of polymeric materials.
The Young’s modulus (E) and Poisson’s ratio (ν) were determined in the elastic deformation range, between approximately ε1 ≈ 0.1% and ε2 ≈ 0.5%, using the following relations:
E   =   σ ε 2 σ ε 1 ε 2 ε 1 ;   ν =   ε t ε 2 ε t ε 1 ε 2 ε 1
where εt represents the transverse strain obtained from DIC measurements.
The ultimate tensile strength (UTS) was defined as the maximum stress value recorded during the tensile test.

2.4. Finite Element Analysis (FEA)

To complement the experimental tensile tests and to investigate the internal stress and strain distribution within the printed specimens, a finite element analysis (FEA) was performed using MSC Visual Nastran for Windows 2003 (licensed version FEMAP 8.2.1, MSC Software, Newport Beach, CA, USA). This analysis aimed to evaluate the influence of printing orientation (horizontal, vertical, and lateral) on the mechanical behavior under uniaxial tensile loading.
For each specimen configuration, a 3D CAD model was created to replicate the geometry and dimensions of the actual tensile test specimens. The models were meshed with solid elements, with particular attention paid to mesh refinement in the gauge section to accurately capture stress concentrations and deformation gradients.
The simulation employed a linear elastic material model, using mechanical properties (Young’s modulus, Poisson’s ratio, and yield strength) experimentally determined in Section 2.3. A vertically distributed force was applied across ten nodes at the upper edge of the specimen, while the lower edge was fully constrained in both horizontal and vertical directions (Ux = Uy = 0). This configuration was intended to replicate the experimental tensile test conditions while allowing for an accurate visualization of internal stress distribution. The FEA provided detailed outputs such as von Mises stress fields, displacement distributions, and strain localization, enabling direct comparison with the physical test results and failure patterns. This numerical investigation helped validate the experimental observations and offered additional insights into the role of anisotropy induced by 3D printing.

3. Results

3.1. Fractured Specimens After Tensile Testing

Figure 7 presents a top-view image of all fractured tensile specimens after testing, grouped according to their printing orientation. In panel (a), the five specimens printed in the horizontal orientation (Set A–45°) are shown. All fractures occurred in the central region of the calibrated gauge section, and the fracture lines appear relatively uniform, with consistent break locations across the set. In panel (b), the specimens printed in the vertical orientation (Set B–90°) are presented. These also failed within the gauge section, but the fracture contours are less regular compared with those in the horizontal group, suggesting more variable interlayer adhesion and increased sensitivity to delamination. Panel (c) shows the specimens printed in the lateral orientation (Set C–0°). The fracture locations are again centered in the gauge section, but the rupture paths appear more irregular and asymmetric, likely due to the anisotropic behavior induced by filament deposition in the lateral direction.

3.2. Mechanical Properties

3.2.1. Horizontal Printing (Set A–45°)

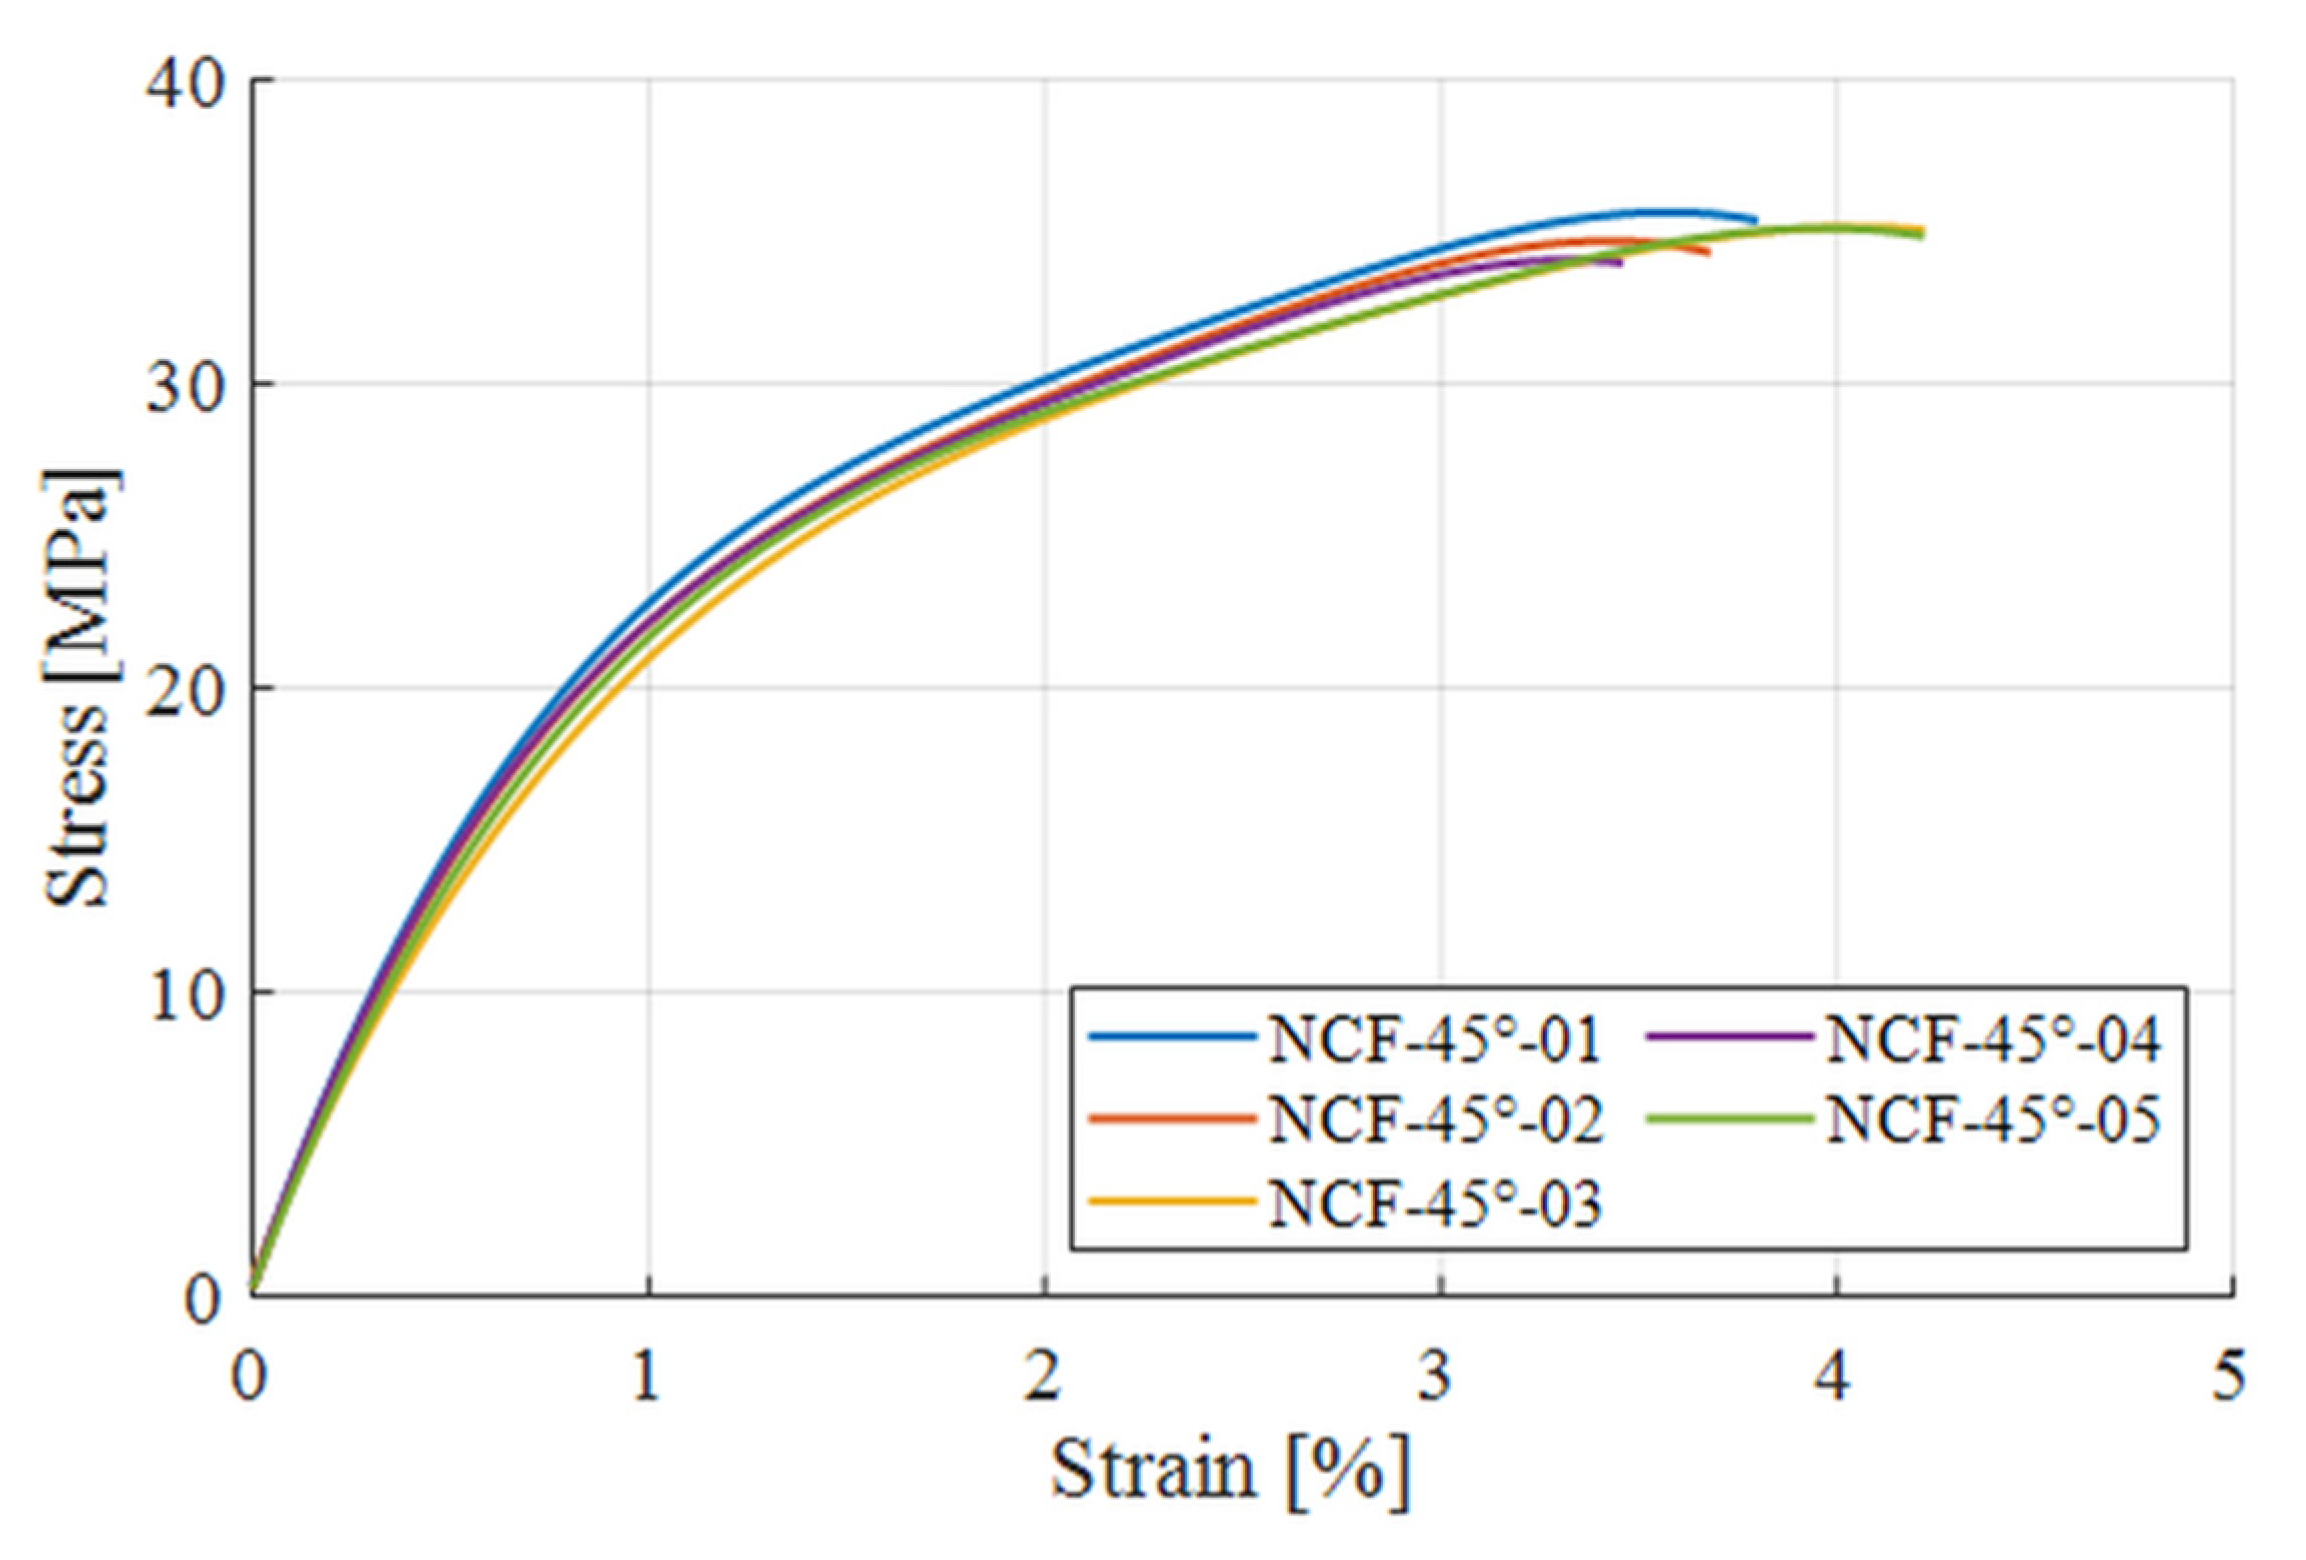
The tensile testing results for specimen fabricated through horizontal printing with a 45° raster orientation (Set A–45°), are summarized in Table 1. A total of five specimens were tested under identical loading conditions to determine their elastic and strength properties. The parameters analyzed included Young’s modulus (E), Poisson’s ratio (ν), yield strength (0.2% offset), and ultimate tensile strength (UTS).
The average Young’s modulus obtained was 2639 MPa, indicating good overall stiffness in the direction of load application. The average yield strength was 21.40 MPa, and the average UTS reached 35.11 MPa, reflecting consistent strength performance across the specimens.
The coefficient of variation (Cv) for yield and ultimate strength was below 2%, demonstrating excellent reproducibility. A slightly higher Cv (13.87%) was observed for Poisson’s ratio, suggesting greater variability in transverse deformation behavior, possibly due to microstructural inconsistencies inherent to the 45° raster orientation.
The stress–strain curves for the five specimens in this group are shown in Figure 8, exhibiting similar trends in elastic and plastic deformation, with minimal scatter among the curves. This confirms the effectiveness of the 45° printing orientation in achieving a balanced mechanical response under tensile loading.

3.2.2. Vertical Printing (Set B–90°)

Table 2 summarizes the mechanical properties obtained from tensile tests conducted on the specimens printed in vertical orientation (Set B–90°). As in the previous case, five specimens were tested. The average Young’s modulus was 809 MPa, significantly lower than that recorded for the horizontally printed specimens (Set A–45°). Poisson’s ratio remained low, with an average value of 0.07, suggesting limited transverse strain under uniaxial loading. The average yield strength was 8.24 MPa, and the ultimate tensile strength reached 16.74 MPa. Both parameters were notably reduced compared to the values observed for Set A.
These results confirm the pronounced anisotropy induced by the layer orientation in fused filament fabrication (FFF). When layers are stacked perpendicular to the tensile direction, interlayer bonding becomes the primary failure interface, leading to earlier fracture and reduced mechanical performance.
Figure 9 illustrates the engineering stress–strain curves for the five vertically printed specimens. All specimens exhibited brittle fracture behavior, with limited plastic deformation and relatively abrupt failure. The curves confirm the consistency of the mechanical response across the batch, as supported by the low standard deviation and coefficient of variation values for yield strength and ultimate tensile strength.

3.2.3. Lateral Printing (Set C–0°)

Table 3 presents the mechanical properties recorded for the specimens printed in the lateral orientation (Set C–0°). These specimens exhibited the best mechanical performance among all tested orientations. The average Young’s modulus reached 3479 MPa, with low variability (coefficient of variation: 2.3%), indicating consistent material stiffness across the batch. The average Poisson’s ratio was 0.32, slightly lower than that of the horizontally printed specimens (Set A–45°), but substantially higher than in the vertical case.
Regarding strength, the average yield strength was 27.33 MPa, and the ultimate tensile strength reached 41.18 MPa, representing the highest values measured in this study. These results highlight the superior interlayer cohesion achieved when the printed filament layers are oriented parallel to the tensile loading axis.
The engineering stress–strain curves for (Set C–0°), shown in Figure 10, confirm a ductile response with significant plastic deformation prior to failure. The curves are highly consistent, with only minor variation in peak stress and slope, reinforcing the observation of excellent structural reliability for laterally printed components.
The mechanical superiority of this orientation is crucial for design considerations in load-bearing 3D-printed components, particularly in structural applications such as those found in light water well drilling rigs.

3.2.4. Comparative Analysis of Printing Orientations

A comparative overview of the three tested orientations, horizontal with filament direction of 45° (Set A–45°), vertical with filament direction of 90° (Set B–90°), and lateral with filament direction of 0° (Set C–0°), reveals a strong influence of build direction on the mechanical behavior of 3D-printed Nylon 12 Carbon Fiber specimens.
The most significant variation was observed for Poisson’s ratio, confirming the highly anisotropic behavior of the material. Specifically, the lowest transverse contraction was recorded in the 90° orientation (loading perpendicular to the printed layers), where interlayer adhesion governs the response. This indicates a reduced ability of the material to contract laterally when the load is applied across the weakest structural direction, consistent with the layered nature of the 3D-printing process. The lateral orientation (Set C–0°) yielded the best mechanical performance, with an average Young’s modulus of 3479 MPa, a yield strength of 27.33 MPa, and an ultimate tensile strength of 41.18 MPa. This superior behavior is attributed to the alignment of filament paths along the loading axis, which minimizes interlayer delamination and optimizes stress transfer.
In contrast, the vertical orientation (Set B–90°) exhibited the weakest mechanical response, with a significantly reduced Young’s modulus of 809 MPa and ultimate tensile strength of 16.74 MPa, confirming that interlayer bonding is the limiting factor when the tensile load is applied perpendicular to the deposited layers.
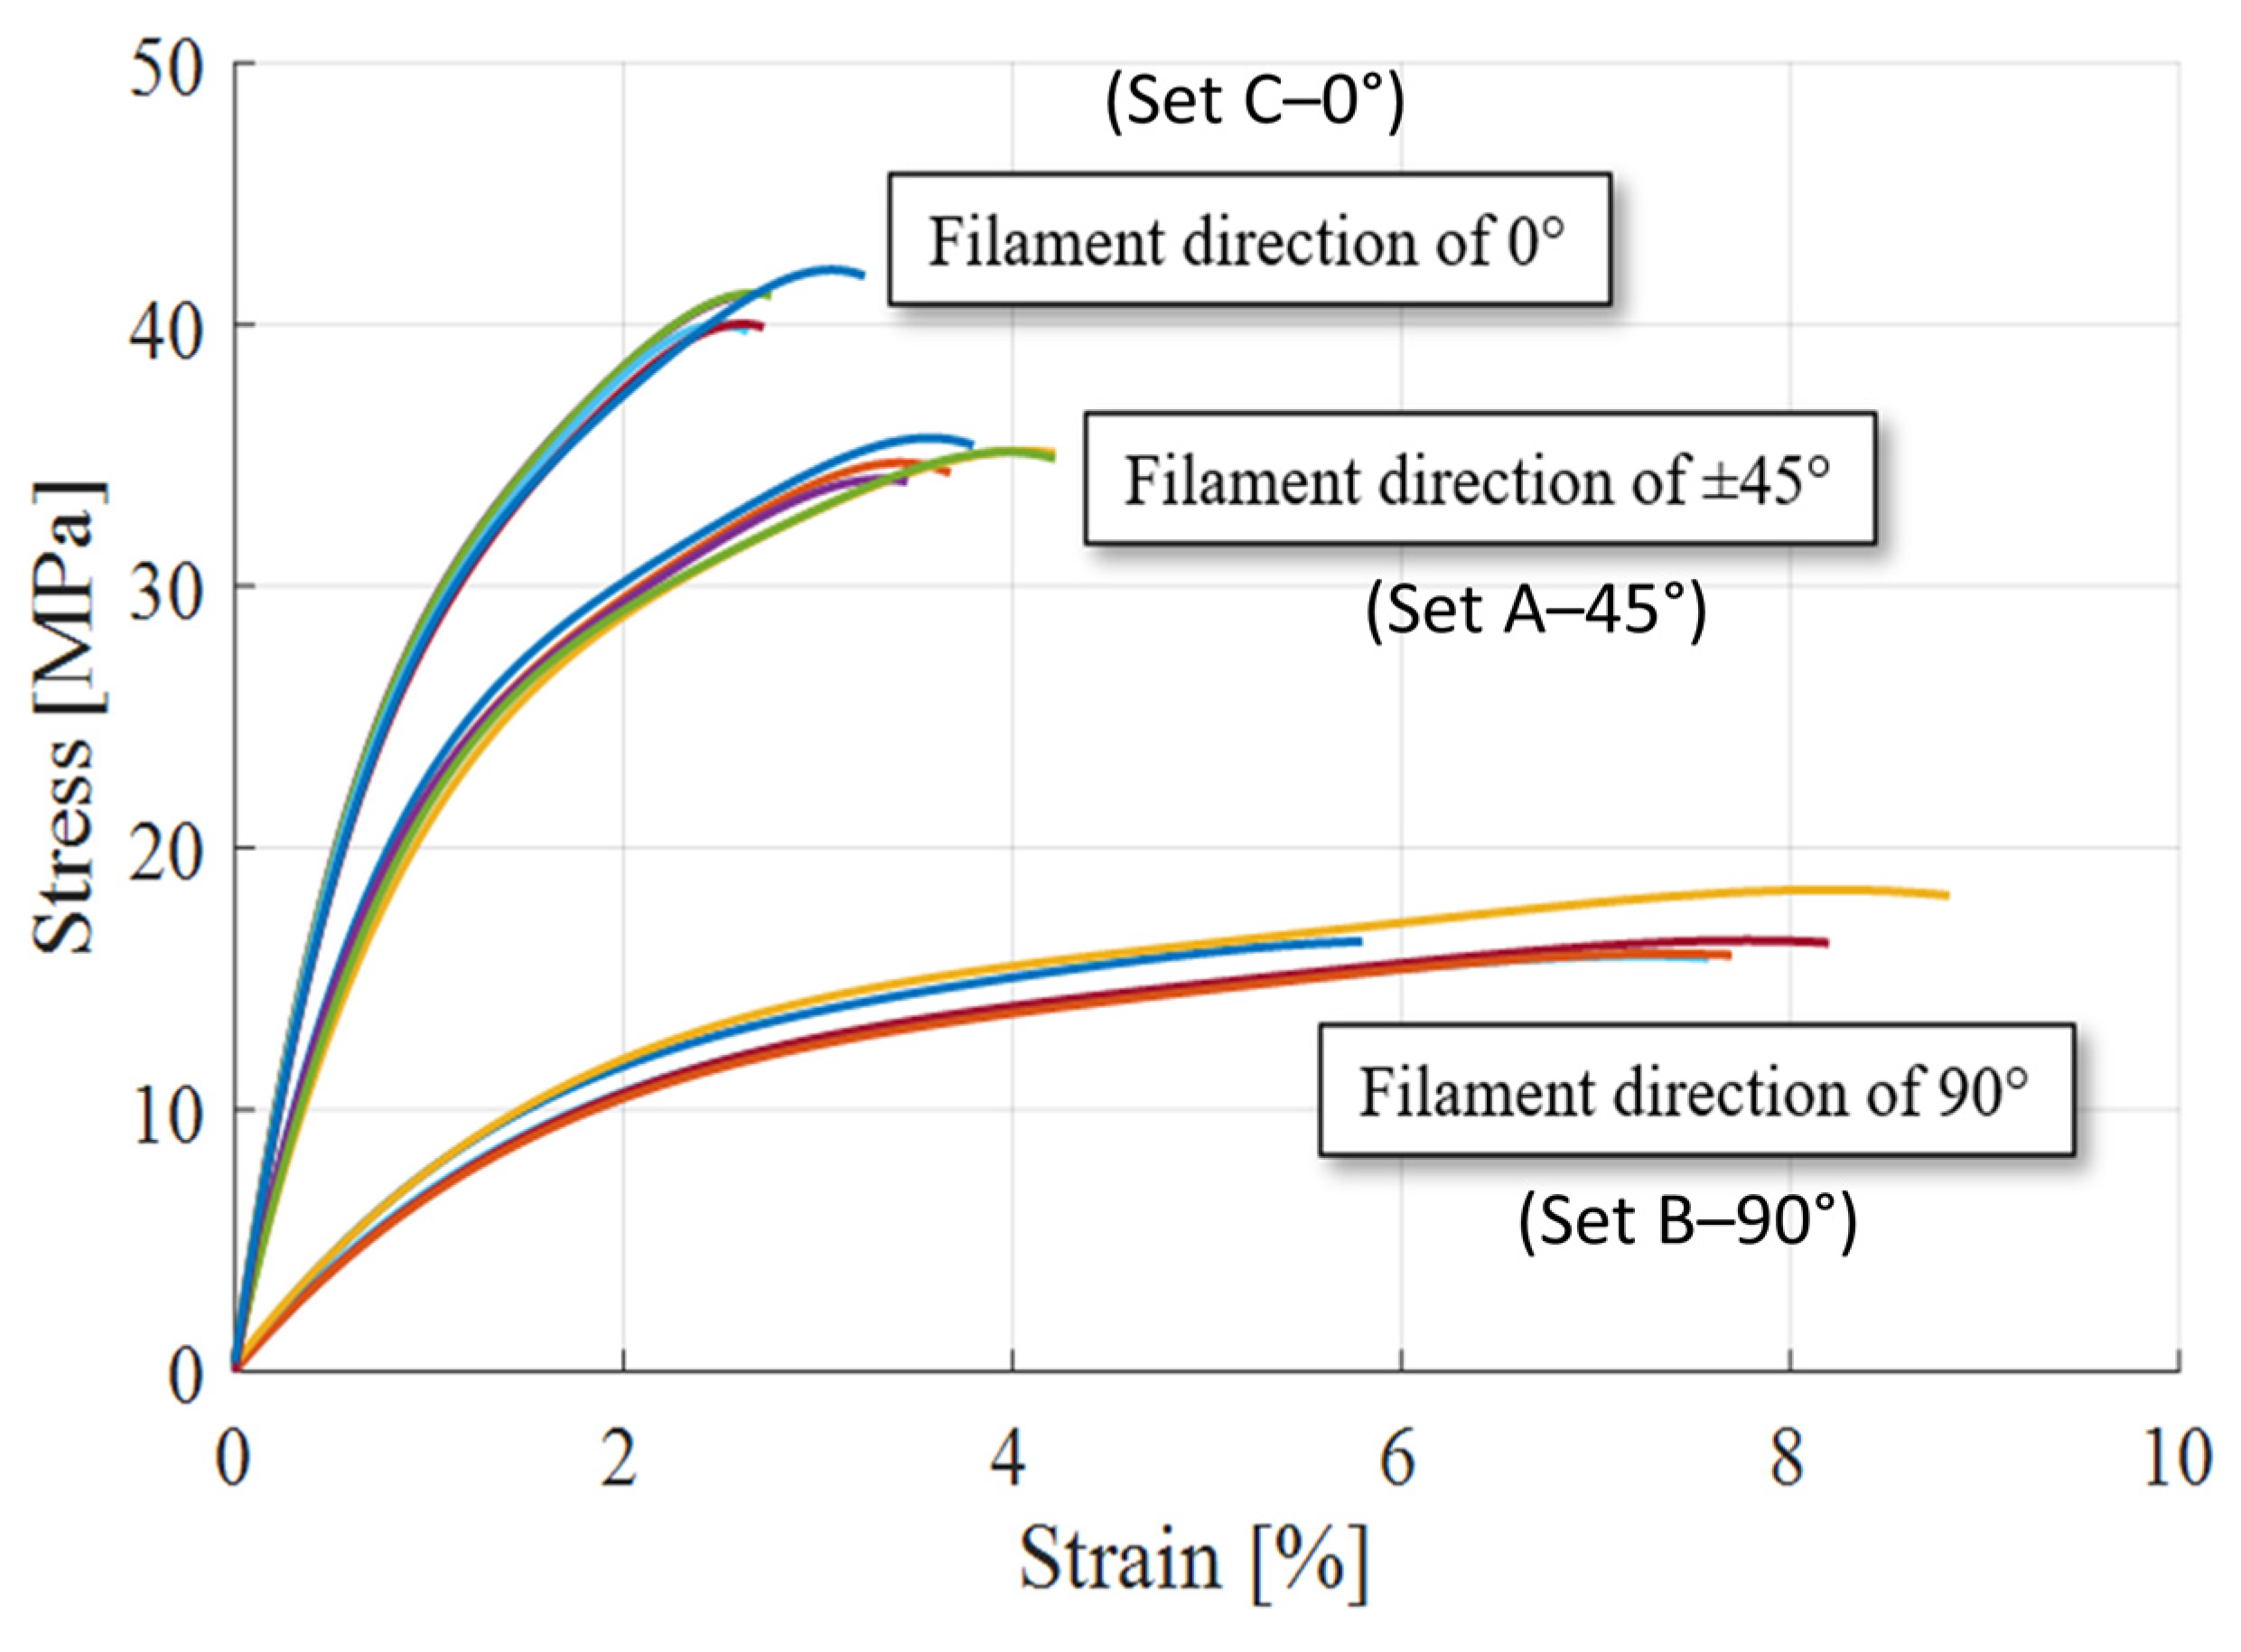
The horizontal orientation (Set A–45°) showed intermediate performance, with a Young’s modulus of 2639 MPa, yield strength of 21.40 MPa, and an ultimate tensile strength of 35.11 MPa. In this case, the inclined deposition paths provided partial alignment with the load axis but also introduced stress concentrations at the filament interfaces. The combined stress–strain curves for all 15 specimens, grouped by build orientation, are presented in Figure 11, enabling a visual comparison of stiffness and failure behavior. The trends confirm the anisotropic mechanical response inherent to FFF-printed composites and emphasize the importance of optimal build orientation in structural applications.
Considering these results, the (Set C–0°)—where the printed filaments are aligned with the loading direction—demonstrates the most favorable mechanical properties and represents the ideal configuration for load-bearing components. However, in practical applications such as drilling tools, where part geometries and loading conditions are complex and printing constraints may limit orientation choices, it is recommended that the printing direction be locally adapted. Maximizing strength along the most highly loaded regions or directions becomes a key design strategy for ensuring structural reliability. At the same time, understanding the full range of mechanical variation—including the minimum values associated with less favorable orientations—is essential for accurately evaluating safety margins and failure risks under service conditions.
The superior tensile strength and stiffness exhibited by the specimens printed in the 0° orientation can be attributed to the alignment of the filaments with the applied tensile load. In this configuration, the force is carried predominantly by the continuous strands of extruded material, thereby minimizing the influence of interlayer adhesion. As a result, the mechanical performance closely approximates that of the bulk material, which explains the enhanced properties observed experimentally.

3.3. Finite Element Simulation

In the present study, the anisotropic behavior of the printed specimens was approximated by assigning effective material properties representative of the mechanical response in each print orientation. The internal mesostructure of the specimens—including filament interfaces, raster paths, and interlayer bonding—was not explicitly modeled. Instead, a homogenized orthotropic approach was used to qualitatively capture the influence of print orientation on stress distribution and global deformation. This simplification reduced computational cost while preserving the essential directional mechanical behavior observed experimentally.

3.3.1. Finite Element Simulation for (Set A–45°)

For the horizontally printed tensile specimens (Set A–45°), an FEA was carried out to analyze the mechanical response under static loading conditions. The loading case LC1 included the specimen’s self-weight and a distributed force applied to 10 nodes located along the upper filet curves of the specimen. This force, F_A1T = 1089.5 N, corresponded to the experimental yield point observed at t = 36 s for specimen NCF_A_01, with a measured yield stress of σC_A1T = 21.79 MPa.
The boundary condition C1 consisted of a full constraint (embedded) applied to 10 nodes along the bottom filet curves of the specimen, preventing both horizontal and vertical displacement Ux = Uy = 0. A vertically distributed force was applied across 10 nodes at the upper edge of the specimen to simulate tensile loading. This configuration was intended to replicate the experimental tensile test conditions while allowing for an accurate visualization of the internal stress distribution. The static FEA revealed a maximum total displacement of δmax = 0.488 mm, as shown in Figure 12.
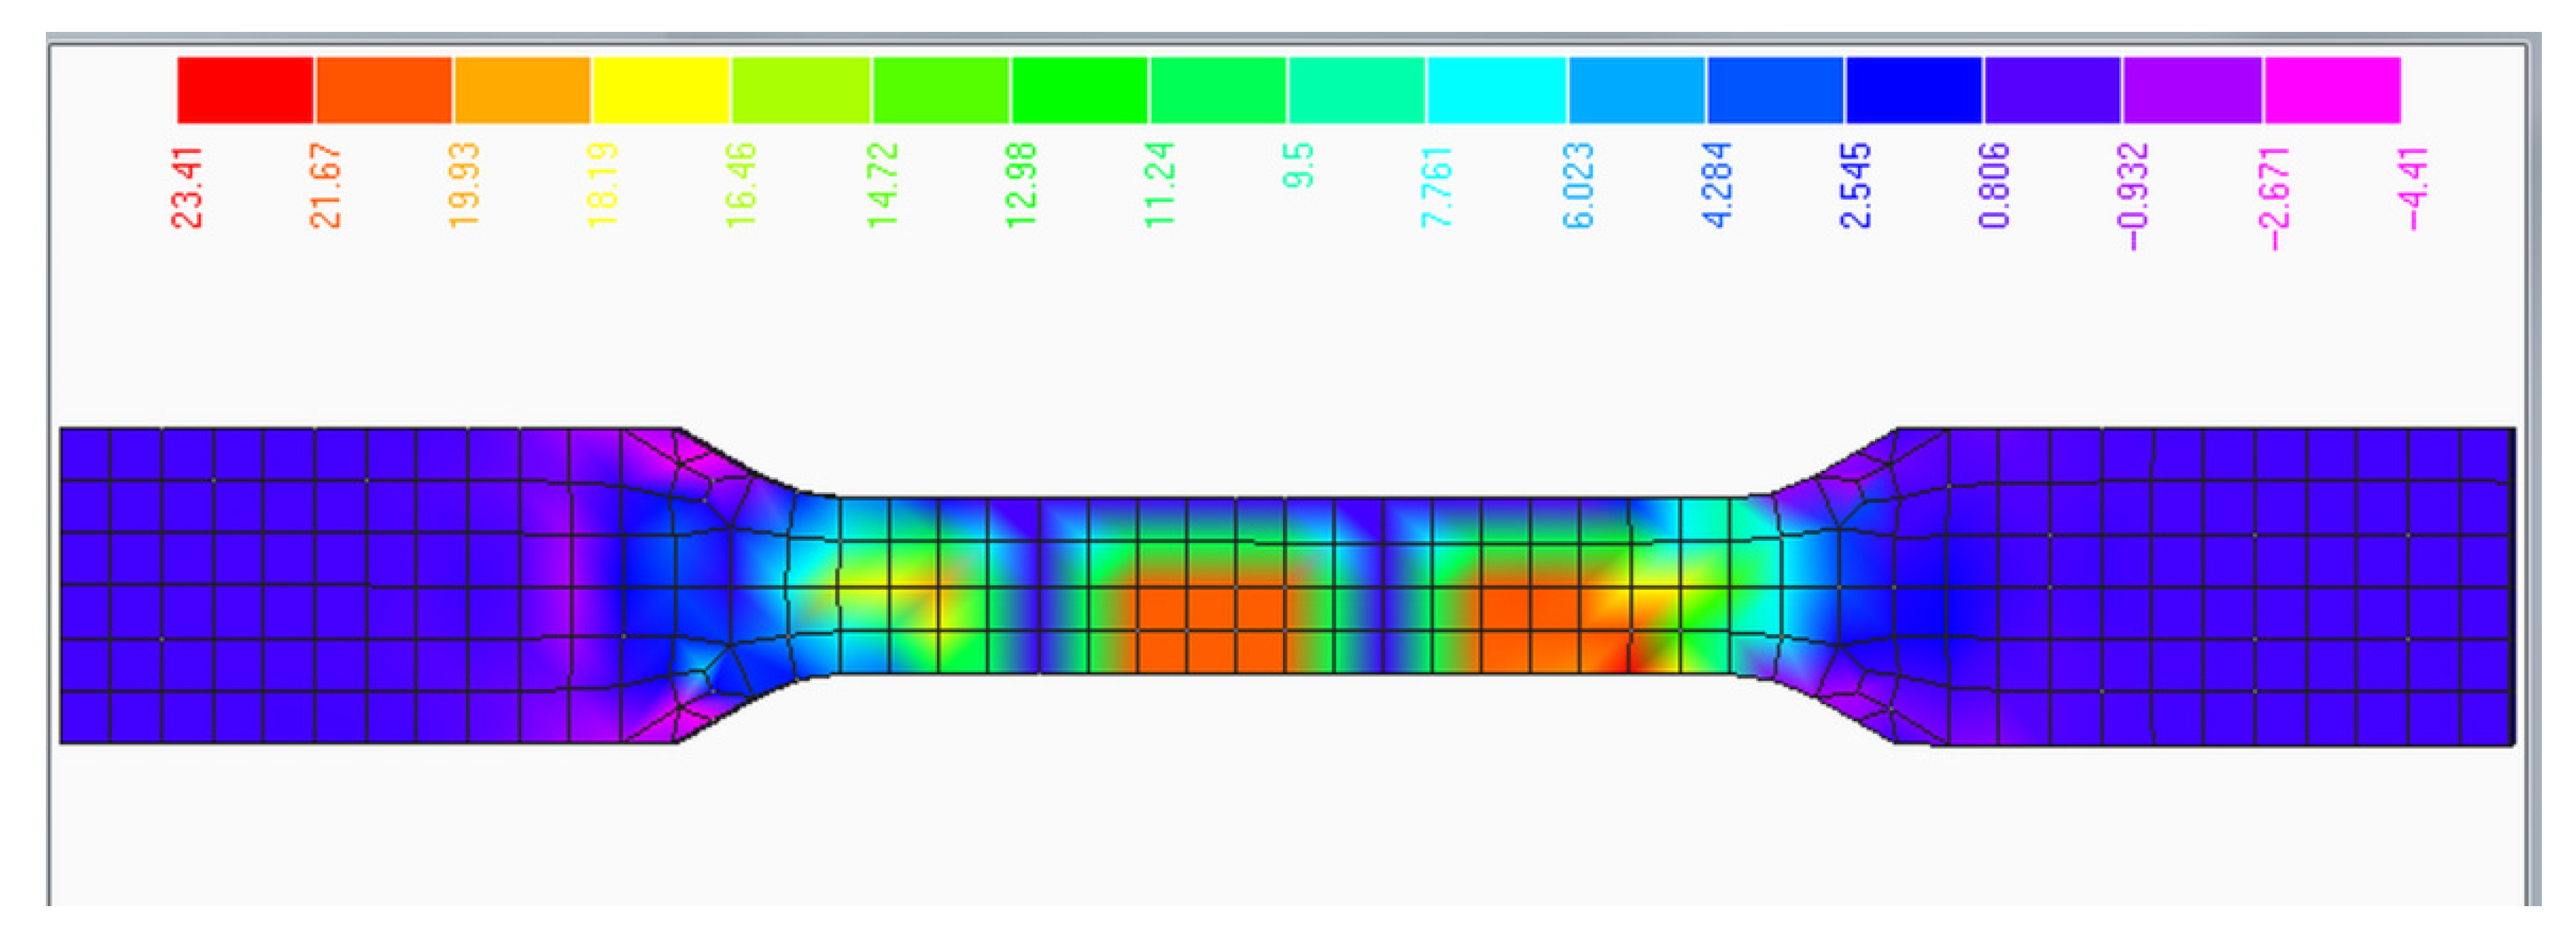
The maximum normal stress in the Y direction, Plate_Top_Y_Normal_Stress, was recorded as σ_y,max = 23.41 MPa in element no. 172, located at the lower connection zone as shown in Figure 13.
These results demonstrate good correlation with the experimental data, where the measured yield stress averaged 21.40 MPa for Set A, with a coefficient of variation below 2%.
Observation: The location of the maximum stress concentration identified in the FEA corresponds closely with the fracture initiation zones observed in the experimental specimens. This correlation supports the validity of the simulation model and confirms that the applied boundary and loading conditions realistically replicate the actual mechanical behavior of the 3D-printed tensile specimens.

3.3.2. Finite Element Simulation for (Set B–90°)

The FEA for the tensile specimen printed in the vertical orientation (Set B–90°) was conducted under the loading case LC1, which included the self-weight of the specimen and an externally applied force. The applied force was F_B1T = 439 N, distributed over ten nodes located along the upper filet curve of the specimen. This value corresponded to the moment t = 46 s during the experimental test for specimen NCF_B_01, when the yield strength of σC_B1T = 8.78 MPa was reached.
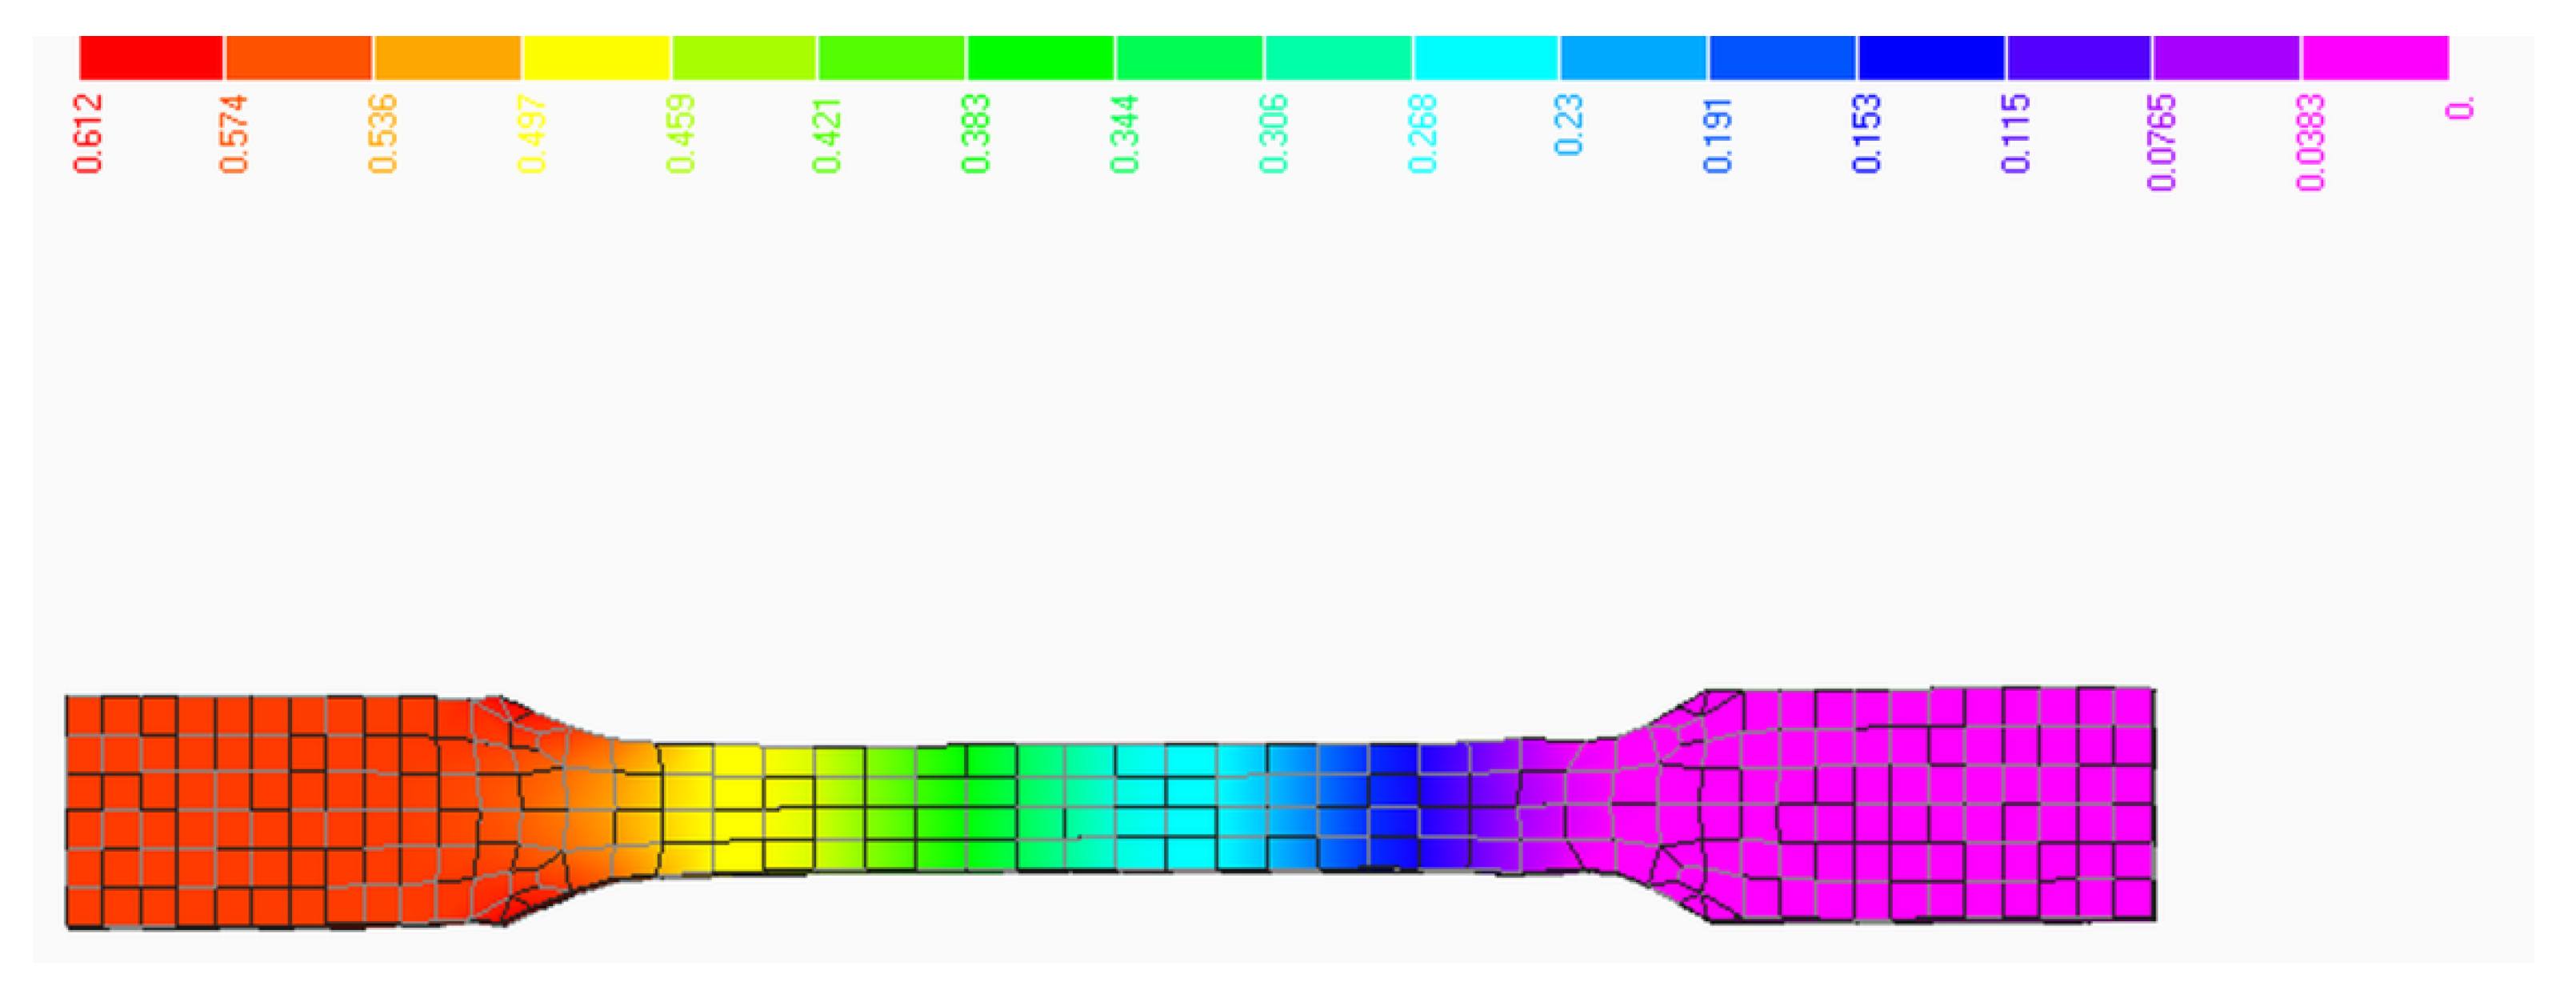
For the vertical printing orientation (Set B–90°), the boundary condition C1 involved full fixation of 10 nodes along the lower fillet curve of the specimen, constraining both horizontal and vertical displacements (Ux = Uy = 0). A vertically distributed load was applied to 10 nodes at the upper edge to simulate the tensile stress conditions observed experimentally. The FEA showed a maximum total displacement of δmax = 0.612 mm, as illustrated in Figure 14.
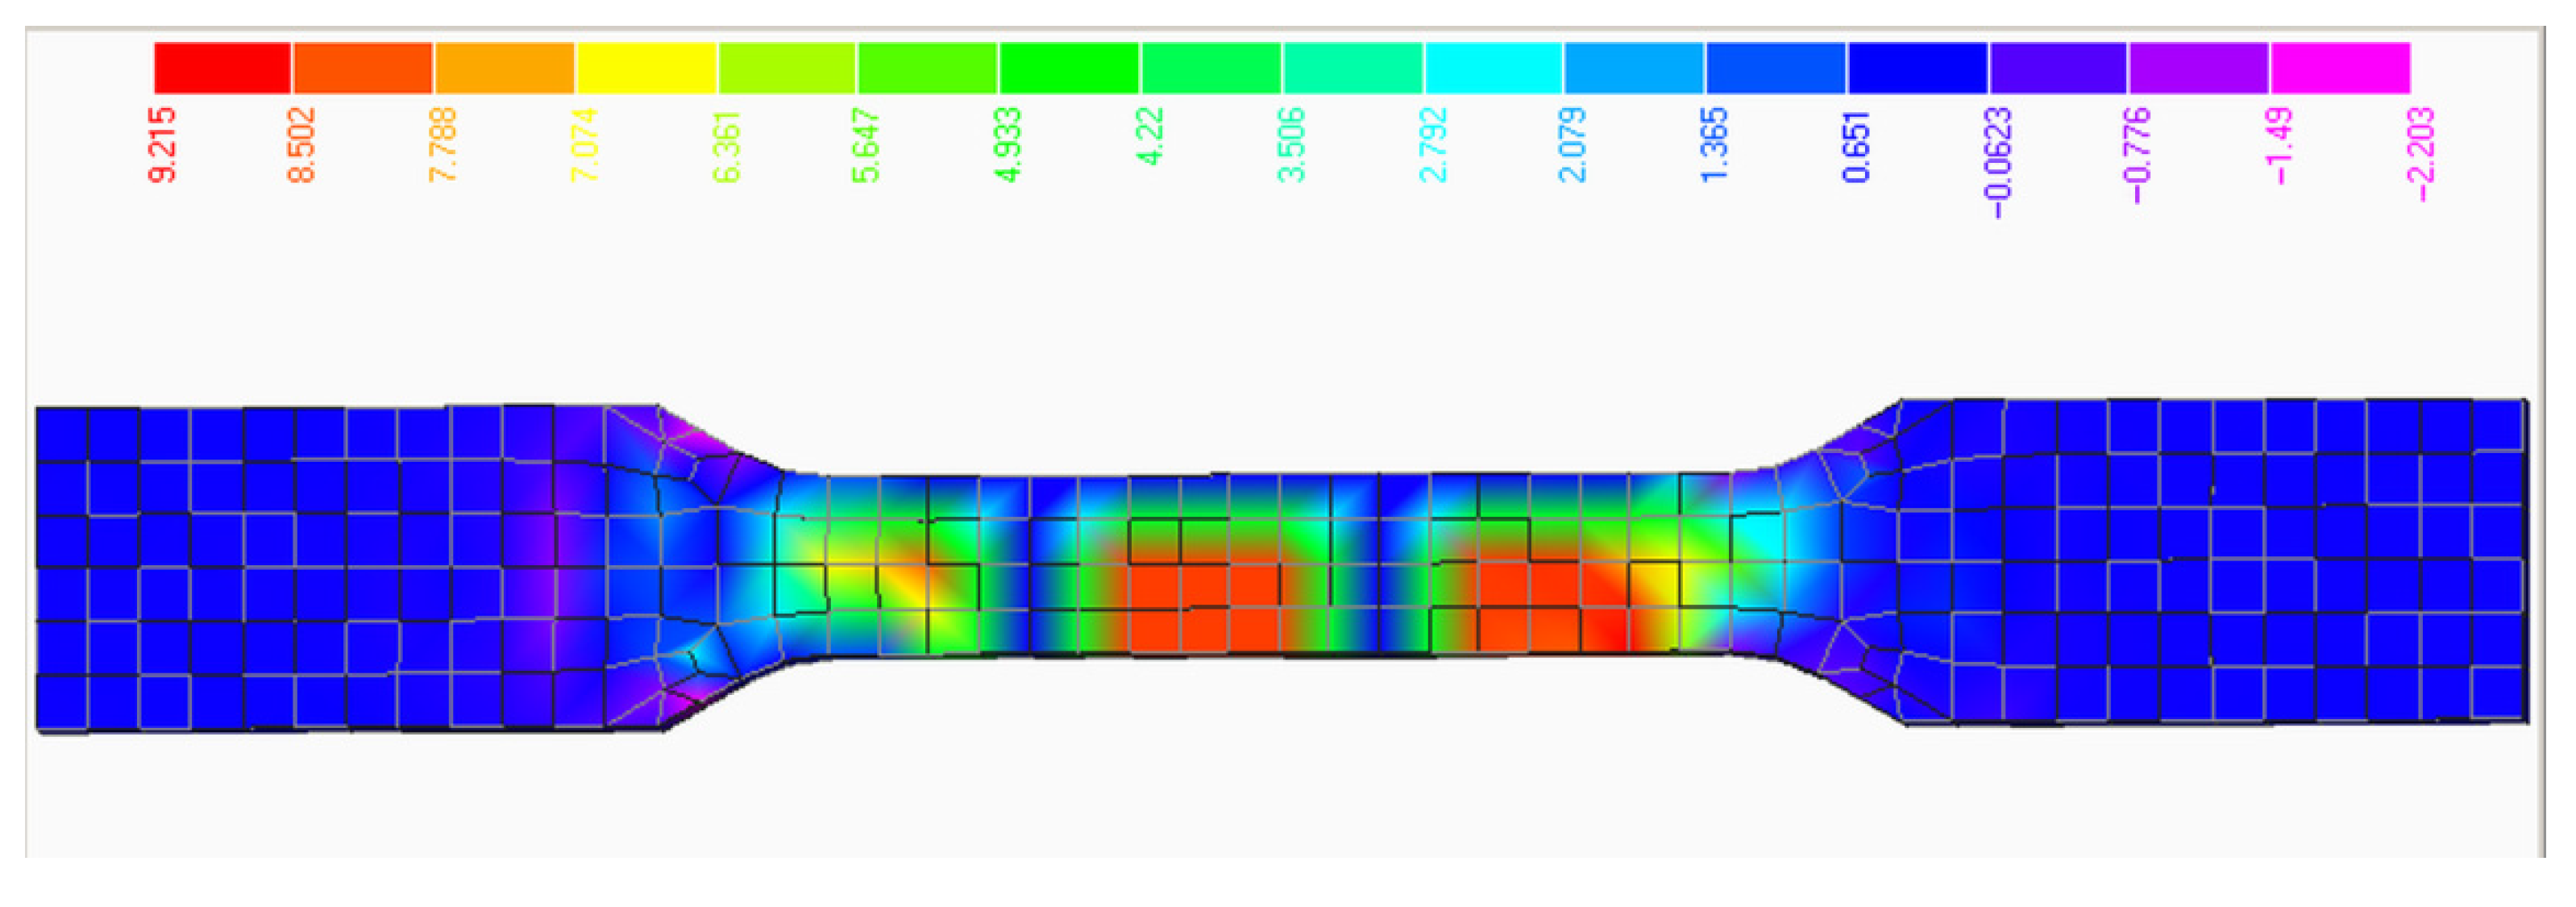
The maximum normal stress in the Y direction, Plate_Top_Y_Normal_Stress, was recorded as σ_y,max = 9.21 MPa in element no. 172, located at the lower connection zone, as shown in Figure 15.
Observation: The finite element stress result (9.21 MPa) closely matched the experimental yield strength (8.78 MPa), with a deviation of approximately 4.9%, thereby validating the simulation model for this orientation. However, compared with (Set A–45°), the lower stiffness and strength observed here confirm the anisotropic mechanical behavior of the printed material depending on build orientation.

3.3.3. Finite Element Simulation for (Set C–0°)

The FEA for the tensile specimen printed in the lateral orientation (Set C–0°) was conducted under the loading case LC1, which included the self-weight of the specimen and an externally applied force. The applied force was F_C1T = 1385.5 N, distributed over ten nodes located along the upper filet curve of the specimen. This value corresponded to the moment t = 58 s, during the experimental test for specimen NCF_C_01, when the experimental yield strength of σC_C1T = 27.71 MPa was reached.
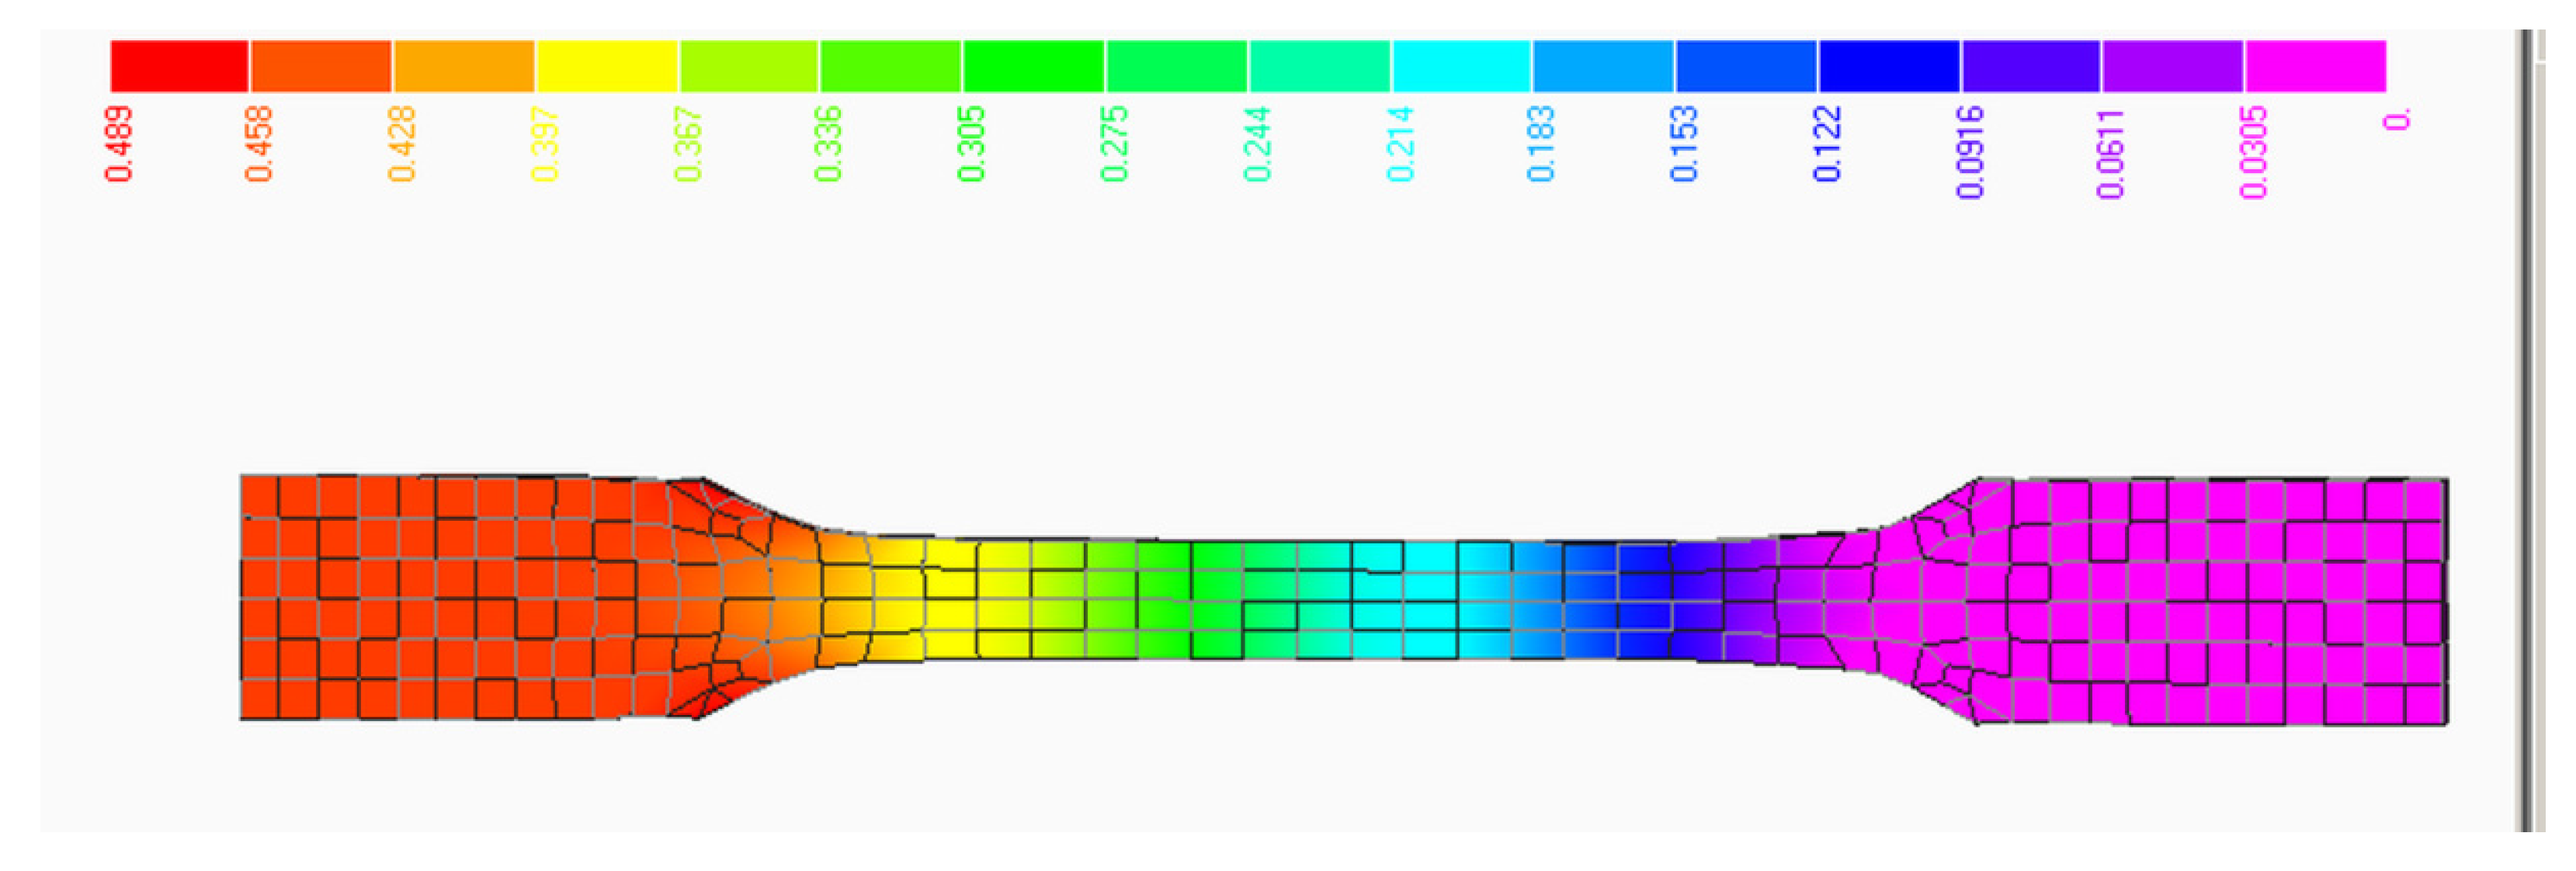
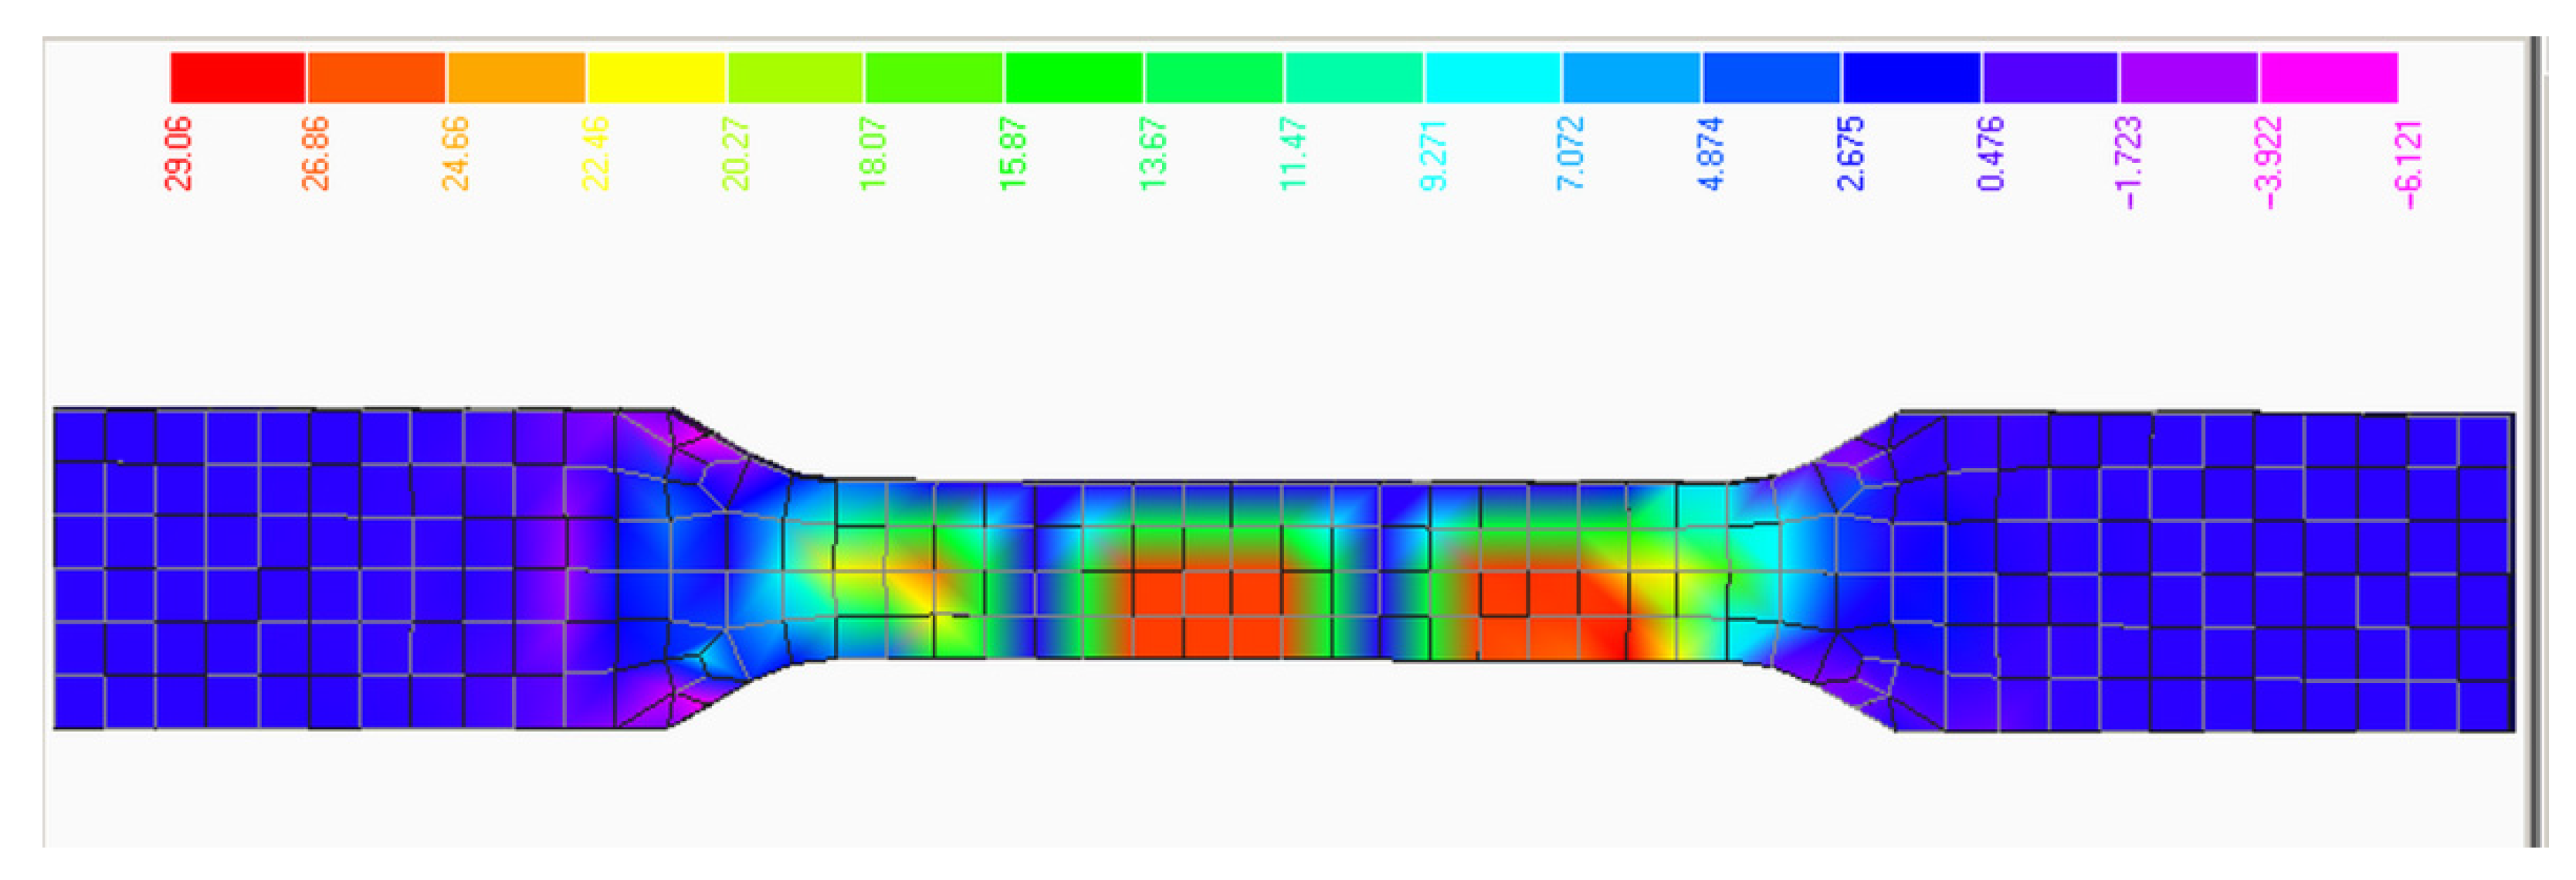
In the case of the lateral printing orientation (Set C–0°), the constraint condition C1 was applied by fully fixing 10 nodes along the lower fillet curve, blocking both horizontal and vertical displacements (Ux = Uy = 0). A vertically distributed tensile load was applied on 10 nodes at the top edge of the specimen. The static analysis revealed a maximum total displacement of δmax = 0.489 mm, as presented in Figure 16. The maximum normal stress in the Y direction, Plate_Top_Y_Normal_Stress, was recorded as σ_y,max = 29.06 MPa in element no. 172, located at the lower connection area as shown in Figure 17.
Observation: The numerical stress result (29.06 MPa) showed close correlation with the experimental yield strength (27.71 MPa), with a deviation of approximately 4.9%, thereby validating the simulation approach. Among all orientations tested, (Set C–0°) exhibits the highest stiffness and strength, emphasizing the pronounced anisotropic response of the 3D-printed Nylon 12 Carbon Fiber material to build direction.
Although the finite element model accurately captured the maximum stress and displacement observed during tensile testing, it was implemented as a single-step static simulation in which the full load was applied in a single increment. Consequently, the software did not provide intermediate output steps required to reconstruct a complete stress–strain curve. This limitation prevented a direct graphical comparison with the experimental tensile response. Nevertheless, the location and magnitude of the peak stresses and displacements were consistent with the experimental data, confirming the validity of the model assumptions and boundary conditions.
The comparative overview of the three build orientations, summarized in Table 4, synthesizes both the experimental tensile testing and the numerical FEA simulations. (Set C–0°) with filaments aligned along the tensile axis, provided the highest tensile strength and the lowest strain, confirming its suitability for structural applications. In contrast, the vertical orientation (Set B–90°) exhibited the lowest mechanical performance and the highest deformation, due to weak interlayer bonding. The FEA displacement values aligned well with the experimental trends, reinforcing the significant influence of build orientation on the mechanical response of 3D-printed Nylon 12 Carbon Fiber specimens.
Furthermore, we acknowledge certain limitations of the FEA that may introduce uncertainty into the numerical results. These include the assumption of isotropic material behavior, the absence of progressive damage modeling, and the single-step simulation approach imposed by the solver. Although these simplifications limit the model’s predictive accuracy in replicating real-world behavior, the observed agreement between the simulated and experimental maximum stress and displacement values supports the validity of the boundary conditions and material parameters applied.

4. Discussion

The mechanical behavior of 3D-printed Nylon 12 Carbon Fiber specimens under tensile loading was strongly influenced by build orientation, confirming the pronounced anisotropy of the material. The analysis focused on three sets of specimens, (Set A–45°)—horizontal (filament direction of 45°), (Set B–90°)—vertical (filament direction of 90°) and (Set C–0°)—lateral (filament direction of 0°), evaluated both experimentally and numerically through FEA.

4.1. Tensile Behavior—Experimental Insights

The stress–strain curves and statistical analysis revealed distinct mechanical responses for each build orientation:
  • (Set A–45°):
This configuration exhibited intermediate mechanical performance, with a mean Young’s modulus of 2639 MPa, a yield strength of 21.40 MPa, and an ultimate tensile strength (UTS) of 35.11 MPa. The high consistency among specimens (coefficient of variation Cv < 6%) indicated good print quality and interlayer bonding at this angle.
The failure mode was characterized by oblique fracture surfaces, which aligned with the 45° raster orientation and supported a mixed failure mechanism combining interlayer and intralayer weaknesses.
  • (Set B–90°):
The vertically printed specimens exhibited the lowest mechanical properties, with an average Young’s modulus of only 809 MPa, a yield strength of 8.24 MPa, and UTS of 16.74 MPa. This poor performance resulted from the loading direction being perpendicular to the layer deposition, causing failure primarily through interlayer delamination. The high coefficient of variation in Poisson’s ratio (26%) further suggested unstable deformation behavior.
  • (Set C–0°):
Specimens printed in the lateral orientation achieved the best mechanical performance, with a mean Young’s modulus of 3479 MPa, a yield strength of 27.33 MPa, and a UTS of 41.18 MPa. These results highlighted the strength of the intralayer bonds when the tensile load was applied along the filament deposition path. Fracture surfaces appeared clean and aligned transversely to the tensile axis, reflecting cohesive failure within the layers rather than between them.

4.2. Finite Element Simulations—Model Validation

The numerical simulations performed using MSC Visual Nastran for Windows closely matched the experimental results:
  • (Set A–45°): The applied load of 1089.5 N produced a maximum stress of 23.41 MPa (vs. experimental 21.79 MPa), with a maximum displacement of 0.488 mm;
  • (Set B–90°): The applied load of 439 N resulted in a maximum stress of 9.21 MPa (vs. experimental 8.78 MPa), with a displacement of 0.612 mm;
  • (Set C–0°): The applied load of 1385.5 N produced a maximum stress of 29.06 MPa (vs. experimental 27.71 MPa), with a displacement of 0.48 mm.
In all cases, the deviation between simulated and experimental stress values remained below 5%, confirming the accuracy of the FEA model and its ability to capture the mechanical response of anisotropic additively manufactured components.

4.3. Influence of Build Orientation

The results clearly demonstrate that build orientation is a critical parameter in the design and manufacturing of structural components using 3D-printed Carbon Fiber reinforced polymers. The lateral orientation (Set C–0°) optimized load-bearing capacity due to favorable stress transfer along the continuous fibers and raster lines, whereas the vertical orientation (Set B–90°) was most susceptible to failure because of weak interlayer adhesion.
This anisotropy must be considered during part design, especially for functional applications involving cyclic or static mechanical loading. The performance gains achieved through optimal orientation can exceed 300% in stiffness and strength compared to unfavorable configurations.

5. Conclusions

This study demonstrated that build orientation critically affects the tensile performance of Nylon 12 Carbon Fiber parts produced by FFF. Lateral orientation (Set C–0°) yielded the highest stiffness (E ≈ 3480 MPa) and strength (UTS ≈ 41 MPa), whereas the vertical orientation (Set B–90°) resulted in the weakest mechanical properties (E ≈ 809 MPa, UTS ≈ 17 MPa). The FEA model accurately predicted the experimental yield stresses within a 5% error margin, validating its use for design optimization. Future work will focus on fatigue behavior and the influence of infill patterns on anisotropic properties.
Considering these results, the lateral orientation (Set C–0°), where the printed filaments are aligned with the loading direction, demonstrated the most favorable mechanical properties and represents the ideal configuration for load-bearing components. However, in practical applications such as drilling tools, where part geometries and loading conditions are complex and printing constraints may limit orientation choices, it is recommended that the printing direction be locally adapted. Maximizing strength along the most highly loaded regions or directions becomes a key design strategy for ensuring structural reliability. At the same time, understanding the full range of mechanical variation, including the minimum values associated with less favorable orientations, is essential for accurately evaluating safety margins and failure risks under service conditions.
Based on the observed mechanical response, a practical recommendation is to assign the lateral orientation (Set C–0°) to critical structural parts, particularly those exposed to tensile loads. In contrast, non-structural or moderately loaded components may be printed using faster or more cost-efficient orientations, depending on manufacturing priorities.
In addition, this study emphasizes the role of specimen preparation and post-processing in achieving reproducible and reliable results. The controlled removal of support material in the SCA-1200HT washing station and the subsequent thermal annealing inside the MakerBot Method X heated chamber ensured specimen consistency and dimensional stability prior to tensile testing. Moreover, the inclusion of representative optical micrographs at 100× and 200× magnifications provided direct evidence of filament alignment and interlayer bonding, thereby strengthening the correlation between manufacturing strategies and mechanical performance.
This study is limited by the fixed process parameters used throughout the experiments (e.g., infill density, raster pattern, print speed) and by the absence of fatigue testing or analysis under cyclic loading conditions. In future research, additional tests and more advanced simulation tools will be employed to extend the model’s predictive accuracy, particularly by incorporating nonlinear damage progression and time-dependent mechanical behavior.
Future work will focus on the microstructural characterization of the printed specimens, with emphasis on porosity evaluation, filament bonding quality, and layer adhesion using microscopic and/or computed tomography (CT) imaging techniques. These analyses will complement the current mechanical findings and provide a deeper understanding of the internal structure–property relationships in PA12-CF components.
Future work will also include parametric FEA simulations incorporating variable fiber volume fractions to evaluate their influence on stress distribution and mechanical response.

Author Contributions

Conceptualization, C.B., S.A.F. and A.D.; methodology, C.B., S.A.F. and D.V.; software, C.B., S.A.F., D.V. and C.S.; validation, C.B., S.A.F., D.V. and C.S.; formal analysis, C.B., S.A.F. and O.A.; investigation, D.V. and C.S.; resources, A.D. and O.A.; data curation, C.B., S.A.F. and D.V.; writing—original draft preparation, C.B. and S.A.F.; writing—review and editing, C.B., S.A.F., C.S. and D.V.; visualization, A.D.; supervision, C.B. and S.A.F.; project administration, C.B., S.A.F., D.V., A.D. and C.S.; funding acquisition, C.B., S.A.F. and D.V. All authors have read and agreed to the published version of the manuscript.

Funding

This research received no external funding.

Data Availability Statement

The original contributions presented in this study are included in the article. Further inquiries can be directed to the corresponding author.

Acknowledgments

This work includes contributions made within the Nucleu Program under the National Research, Development and Innovation Plan 2022–2027, implemented with the support of (MCID), contract no. 42N/2023, project no. PN23140101. The authors have reviewed and edited the output and take full responsibility for the content of this publication.

Conflicts of Interest

The authors declare no conflicts of interest.

Abbreviations

The following abbreviations are used in this manuscript:
AMAdditive Manufacturing
FFFFused Filament Fabrication
FDMFused Deposition Modeling
FEAFinite Element Analysis
DICDigital Image Correlation
UTSUltimate Tensile Strength
EYoung’s Modulus
ν Poisson’s Ratio
σ0.2%Yield Strength at 0.2% Offset Strain
σ_UTSUltimate Tensile Strength
LC1Loading Case 1
C1Constraint Case 1
SR-30Support—material filament code
SCA 1200-HTWashing station model for support removal
NCFNylon 12 Carbon Fiber
PLAPolylactic Acid
PETGPolyethylene Terephthalate Glycol
ABSAcrylonitrile Butadiene Styrene
ASAAcrylonitrile Styrene Acrylate
PCPolycarbonate

References

  1. Tekinalp, H.L.; Kunc, V.; Velez Garcia, G.M.; Duty, C.E.; Love, L.J.; Naskar, A.K.; Blue, C.A.; Ozcan, S. Highly Oriented Carbon Fiber–Polymer Composites via Additive Manufacturing. Compos. Sci. Technol. 2014, 105, 144–150. [Google Scholar] [CrossRef]
  2. Ferreira, R.T.L.; Amatte, I.C.; Dutra, T.A.; Bürger, D. Experimental Characterization and Micrography of 3D Printed PLA and PLA Reinforced with Short Carbon Fibers. Compos. Part B Eng. 2017, 124, 88–100. [Google Scholar] [CrossRef]
  3. Ulkir, M.; Keskin, S.; Durgun, I. Experimental Study and ANN Modeling of Tensile and Surface Quality Characteristics of PA12-CF Composites Fabricated Using FFF. Polymers 2025, 17, 1528. [Google Scholar] [CrossRef]
  4. Cucu, L.; Stoica, M.; Simion, I.; Cananau, S. Sustainable Component Design Using Generative Tools for Additive Manufacturing. UPB Sci. Bull. Ser. D 2021, 83, 91–104. [Google Scholar]
  5. Indreș, A.I.; Constantinescu, D.M.; Baciu, F.; Mocian, O.A. Low Velocity Impact Response of 3D Printed Sandwich Panels with TPU Core and PLA Faces. UPB Sci. Bull. Ser. D 2024, 86, 165–176. [Google Scholar]
  6. Perșinaru, Ș.; Popescu, D.; Desuraune, V. 3D-Printed Adapter for a Robot Gripper: Decisions and Failures. UPB Sci. Bull. Ser. D 2021, 83, 227–238. [Google Scholar]
  7. Durbacă, A.C.; Iatan, R.; Durbacă, I.; Diniță, A.; Rusănescu, C.O. Experimental Aspects of the Application of Strain Gauges on Sandwich Type Circular Plates from Polymer Composite Materials in Pressure Vessels. UPB Sci. Bull. Ser. D 2018, 80, 131–140. [Google Scholar]
  8. Manta (Bălaș), O.M.; Bălaș, R.; Ulmeanu, M.E.; Murzac, R.; Doicin, C. Construction and Testing of the Wave Breaking Prototype—Slosh Noise Baffle. UPB Sci. Bull. Ser. D 2022, 84, 103–116. [Google Scholar]
  9. Simion, I.; Arion, A.F. Dimensioning Rules for 3D Printed Parts Using Additive Technologies (FDM). UPB Sci. Bull. Ser. D 2016, 78, 79–92. [Google Scholar]
  10. Lupeanu, M.E.; Brooks, H.; Rennie, A.E.W.; Hill, D. Research on Deploying Technical Functional Analysis for Additive Manufacturing of a Surgical Device for Intravitreal Interventions. UPB Sci. Bull. Ser. D 2013, 75, 141–160. [Google Scholar]
  11. Mathe, S.; Dimonie, D. The Dependence of the Racemic Crystallization of PLLA on the Molecular Weight of the Stereo-Complexer Macromolecules. UPB Sci. Bull. Ser. B 2023, 85, 139–152. [Google Scholar]
  12. Iacob, M.C.; Popescu, D.; Alexandru, T.G. Printability of Thermoplastic Polyurethane with Low Shore A Hardness in the Context of Customized Insoles Production. UPB Sci. Bull. Ser. D 2024, 86, 95–106. [Google Scholar]
  13. Gheorghe, M.; Branzei, M.; Varzaru, G.; Ionescu, C.; Mihailescu, B.; Svasta, P.; Gheorghe, S.; Ungurelu, R.; Santos Lopez, I.; Rubio, C. Electroless Copper Deposition on Low-Temperature Silver Thick Films. UPB Sci. Bull. Ser. B 2022, 84, 131–144. [Google Scholar]
  14. Drăgoi, M.-V.; Hadăr, A.; Goga, N.; Grigore, L.-Ș.; Ștefan, A.; Ali, H.A. Design and Implementation of an EEG-Based BCI Prosthetic Lower Limb Using Raspberry Pi 4. UPB Sci. Bull. Ser. C 2023, 85, 353–366. [Google Scholar]
  15. Kiran, B.; Rajyalakshmi, G. Experimental Study on Structural Parameters of Wire Arc Additive Manufacturing on Nickel Based Alloy Using Argon Arc Welding. UPB Sci. Bull. Ser. D 2020, 82, 167–178. [Google Scholar]
  16. Jamil, T.; Azher, K.; Tahir, M.A.; Ali, Z.; Hameed, W.; Javed, H.H. Experimental and Numerical Dynamic Analysis of Plexiglass Acrylic for Impact Energy Using Indigenously Developed Testing Equipment. UPB Sci. Bull. Ser. D 2022, 84, 191–206. [Google Scholar]
  17. Zouaoui, M.; Gardan, J.; Lafon, P.; Makke, A.; Labergere, C.; Recho, N. A Finite Element Method to Predict the Mechanical Behavior of a Pre-Structured Material Manufactured by Fused Filament Fabrication in 3D Printing. Appl. Sci. 2021, 11, 5075. [Google Scholar] [CrossRef]
  18. Somireddy, M.; Czekanski, A.; Atre, S.V. Modelling of Failure Behaviour of 3D-Printed Composite Parts. Appl. Sci. 2022, 12, 10724. [Google Scholar] [CrossRef]
  19. Matúš, M. Implementation of Finite Element Method Simulation in Additive Manufacturing Control Strategies. Symmetry 2023, 15, 2036. [Google Scholar] [CrossRef]
  20. Minaoglou, P.; Tzotzis, A.; Efkolidis, N.; Kyratsis, P. Influence of the 3D Printing Fabrication Parameters on the Tensile Properties of Carbon-Based Composite Filament. Appl. Mech. 2024, 5, 745–761. [Google Scholar] [CrossRef]
  21. Oh, J.-S.; Oh, M.-J.; Han, Z.; Seo, H.-S. Effects of Fiber Orientation on the Bearing Strength of 3D-Printed Composite Materials Produced by Fused Filament Fabrication. Polymers 2024, 16, 3591. [Google Scholar] [CrossRef]
  22. El-Deeb, I.S.; Grabowik, C.; Esmael, E.; Nabhan, A.; Rashad, M.; Ebied, S. Investigation of Effect of Part-Build Directions and Build Orientations on Tension–Tension Mode Fatigue Behavior of Acrylonitrile Butadiene Styrene Material Printed Using Fused Filament Fabrication Technology. Materials 2024, 17, 5133. [Google Scholar] [CrossRef]
  23. Appalsamy, T.; Hamilton, S.L.; Kgaphola, M.J. Tensile Test Analysis of 3D Printed Specimens with Varying Print Orientation and Infill Density. J. Compos. Sci. 2024, 8, 121. [Google Scholar] [CrossRef]
  24. Hedjazi, L.; Belhabib, S.; Stephant, N.; Durand, S.; Guessasma, S. Effects of Microstructural Arrangement on the Mechanical Behavior of 3D Printed Polyamide. Symmetry 2023, 15, 2119. [Google Scholar] [CrossRef]
  25. Vanaei, S.; Shirinbayan, M.; Fattahi, A.M.; Fitoussi, J.; Tcharkhtchi, A. Orientation-Dependent Mechanical Behavior of 3D Printed PLA Parts: An Experimental–Numerical Study. Machines 2023, 11, 1086. [Google Scholar] [CrossRef]
  26. Yankin, D.; Popov, A.A.; Zhidkov, I.S.; Korzhenkov, A.M. Optimization of Printing Parameters to Enhance Tensile Strength and Modulus of Elasticity of 3D-Printed Nylon 12. Polymers 2023, 15, 3043. [Google Scholar] [CrossRef] [PubMed]
  27. Butt, J.; Khan, M.A.A.; Adnan, M.; Mohaghegh, V. Performance Analysis of FFF-Printed Carbon Fiber Composites Subjected to Different Annealing Methods. J. Manuf. Mater. Process. 2024, 8, 252. [Google Scholar] [CrossRef]
  28. Monkova, K.; Fabini, M.; Hribernik, A.; Chladek, M.; Kovac, J. Investigating Flexural Properties of 3D-Printed Nylon/CF Composites. Polymers 2025, 17, 788. [Google Scholar] [CrossRef]
  29. Song, M.; Choi, J.H.; Kim, K.W.; Park, S.J. Flowability-Dependent Anisotropic Mechanical Properties of 3D-Printed Composites. Appl. Sci. 2025, 15, 6070. [Google Scholar] [CrossRef]
  30. Pejkowski, Ł.; Seyda, J.; Nowicki, K.; Mrozik, D. Mechanical Performance of Non-Reinforced, Carbon Fiber Reinforced and Glass Bubbles Reinforced 3D Printed PA12 Polyamide. Polym. Test. 2022, 118, 107891. [Google Scholar] [CrossRef]
  31. Dong, C. Finite Element Analysis of Additively Manufactured Continuous Carbon Fiber-Reinforced Composites. JOM 2023, 75, 4150–4157. [Google Scholar] [CrossRef]
  32. ISO 527-2:2019; Plastics—Determination of Tensile Properties—Part 2: Test Conditions for Moulding and Extrusion Plastics. International Organization for Standardization: Geneva, Switzerland.
Figure 1. Geometry of the specimens in accordance with ISO 527-2:2019.
Technologies 13 00456 g001
Figure 2. Slicing previews of the tensile specimens printed in three different orientations, generated using MakerBot Print software: (a) horizontal orientation (Set A–45°); (b) vertical orientation (Set B–90°); and (c) lateral orientation (Set C–0°). The images illustrate the internal toolpath strategy and the support structure configuration for each orientation. Green indicates the specimen, orange the SR-30 support material, and blue the toolpath.
Technologies 13 00456 g002
Figure 3. Representative micrographs of 3D-printed tensile specimens in the three printing orientations, (a,b) horizontal (Set A—45°), (c,d) vertical (Set B–90°), and (e,f) lateral (Set C–0°), shown at 100× and 200× magnifications, respectively. Scale bars correspond to 200 µm (100×) and 100 µm (200×). The images highlight differences in filament alignment and interlayer bonding quality. The color variations result from the optical microscopy process and have no specific meaning.
Technologies 13 00456 g003
Figure 4. Support removal procedure for the 3D-printed specimens: (a) placement of specimens in the stainless steel basket, (b) immersion of the basket in the Ecoworks solvent bath, (c) rinsing with a water jet, and (d) the SCA 1200-HT washing station (Oryx Additive, distributed by Stratasys, Minnetonka, MN, USA) used in this study.
Technologies 13 00456 g004
Figure 5. Thermal annealing procedure of Nylon 12 Carbon Fiber specimens: (a) placement of specimens inside the heated chamber of the MakerBot Method X Carbon Fiber printer, (b) printer display showing the annealing parameters (80 °C, 5 h).
Technologies 13 00456 g005
Figure 6. DIC principle: (a) painted surface; (b) facets on the surface of interest; (c) principal strain ε1, with the upper red area indicating failure initiation.
Technologies 13 00456 g006
Figure 7. Fractured tensile specimens after testing: (a) specimens printed in the horizontal orientation (Set A–45°); (b) specimens printed in the vertical orientation (Set B–90°); (c) specimens printed in the lateral orientation (Set C-–0°). Fracture zones are indicated by blue arrows. A 10 mm scale is shown in the bottom right corner of each image for dimensional reference.
Technologies 13 00456 g007
Figure 8. Stress–strain curves for five specimens printed in the horizontal orientation (Set A–45°).
Technologies 13 00456 g008
Figure 9. Stress–strain curves for five specimens printed in the vertical orientation (Set B–90°).
Technologies 13 00456 g009
Figure 10. Stress–strain curves for five specimens printed in the lateral orientation (Set C–0°).
Technologies 13 00456 g010
Figure 11. Combined stress–strain curves for all 15 specimens, grouped by build orientation: horizontal printing (Set A–45°, filament direction of 45°), vertical printing (Set B–90°, filament direction of 90°), and lateral printing (Set C–0°, filament direction of 0°). Each group includes five specimens tested under identical conditions; individual curve colors have no specific meaning and are used only to distinguish the samples within each group.
Technologies 13 00456 g011
Figure 12. Displacement field for specimens printed in (Set A–45°) orientation. The zero value in the color scale corresponds to the fixed boundary condition, where all degrees of freedom were constrained.
Technologies 13 00456 g012
Figure 13. Normal stress in the Y direction for specimens of (Set A–45°) orientation. The negative stress values (−) near the fixed boundary indicate compressive stresses resulting from the reaction forces at the constrained edge, consistent with the FEM sign convention.
Technologies 13 00456 g013
Figure 14. Displacement field for specimens printed in (Set B–90°) orientation. The zero value in the color scale corresponds to the fixed boundary condition, where all degrees of freedom were constrained.
Technologies 13 00456 g014
Figure 15. Normal stress in the Y direction for specimens printed in (Set B–90°) orientation. The negative stress values (−) near the fixed boundary indicate compressive stresses resulting from the reaction forces at the constrained edge, consistent with the FEM sign convention.
Technologies 13 00456 g015
Figure 16. Displacement field for specimens of (Set C–0°) orientation. The zero value in the color scale corresponds to the fixed boundary condition, where all degrees of freedom were constrained.
Technologies 13 00456 g016
Figure 17. Normal stress in the Y direction for specimens printed in (Set C–0°) orientation. The negative stress values (−) near the fixed boundary indicate compressive stresses resulting from the reaction forces at the constrained edge, consistent with the FEM sign convention.
Technologies 13 00456 g017
Table 1. Results for horizontal printing (Set A–45°).
No.SpecimenEPoissonYield StrengthUltimate Tensile Strength
[MPa][−][MPa][MPa]
1NCF_A_0127180.4921.7935.90
2NCF_A_0227780.5220.9134.94
3NCF_A_0323820.3621.4735.17
4NCF_A_0426990.5221.3634.40
5NCF_A_0526160.5121.4735.17
Medium26390.4821.4035.11
StDev154.50.070.3160.540
Cv [%]5.85713.871.481.54
Table 2. Results for vertical printing (Set B–90°).
No.SpecimenEPoissonYield StrengthUltimate Tensile Strength
[MPa][−][MPa][MPa]
1NCF_B_01776.70.058.1015.97
2NCF_B_02786.10.077.8916.60
3NCF_B_03843.20.098.7316.51
4NCF_B_04759.90.067.6816.09
5NCF_B_05880.20.078.7818.51
Medium8090.078.2416.74
StDev50.550.020.4931.026
Cv [%]6.24626.045.986.13
Table 3. Results for lateral printing (Set C–0°).
No.SpecimenEPoissonYield StrengthUltimate Tensile Strength
[MPa][-][MPa][MPa]
1NCF_C_0135860.3427.5141.24
2NCF_C_0235320.3127.4741.51
3NCF_C_0334680.3427.7140.67
4NCF_C_0433950.3227.1040.28
5NCF_C_0534150.3126.8742.19
Medium34790.3227.3341.18
StDev79.980.020.3400.744
Cv [%]2.2994.761.251.81
Table 4. Comparative summary of the average ultimate tensile stress and the corresponding strain for each build orientation.
OrientationAverage UTS [MPa]Average Strain [%]Max Displacement from FEM [mm]
(Set A–45°)35.11~3.90.448
(Set B–90°)16.74~6.30.612
(Set C–0°)41.18~2.90.480
Disclaimer/Publisher’s Note: The statements, opinions and data contained in all publications are solely those of the individual author(s) and contributor(s) and not of MDPI and/or the editor(s). MDPI and/or the editor(s) disclaim responsibility for any injury to people or property resulting from any ideas, methods, instructions or products referred to in the content.