Abstract
A novel methodology for hybrid energy management in aquaculture is introduced, aimed at enhancing self-sufficiency and optimizing grid-related cash flows. Wind and solar energy generation are modeled using calibrated turbine performance curves and PVGIS data, respectively, with a photovoltaic capacity of 120 kWp. The system also incorporates a 250 kW small hydroelectric plant and a wood drying kiln that utilizes surplus wind energy. This study conducts a comparative analysis between HY4RES, a research-oriented simulation model, and HOMER Pro, a commercially available optimization tool, across multiple hybrid energy scenarios at two aquaculture sites. For grid-connected configurations at the Primary site (base case, Scenarios 1, 2, and 6), both models demonstrate strong concordance in terms of energy balance and overall performance. In Scenario 1, a peak power demand exceeding 1000 kW is observed in both models, attributed to the biomass kiln load. Scenario 2 reveals a 3.1% improvement in self-sufficiency with the integration of photovoltaic generation, as reported by HY4RES. In the off-grid Scenario 3, HY4RES supplies an additional 96,634 kWh of annual load compared to HOMER Pro. However, HOMER Pro indicates a 3.6% higher electricity deficit, primarily due to battery energy storage system (BESS) losses. Scenario 4 yields comparable generation outputs, with HY4RES enabling 6% more wood-drying capacity through the inclusion of photovoltaic energy. Scenario 5, which features a large-scale BESS, highlights a 4.7% unmet demand in HY4RES, whereas HOMER Pro successfully meets the entire load. In Scenario 6, both models exhibit similar load profiles; however, HY4RES reports a self-sufficiency rate that is 1.3% lower than in Scenario 1. At the Secondary site, financial outcomes are closely aligned. For instance, in the base case, HY4RES projects a cash flow of 54,154 EUR, while HOMER Pro estimates 55,532 EUR. Scenario 1 presents nearly identical financial results, and Scenario 2 underscores HOMER Pro’s superior BESS modeling capabilities during periods of reduced hydroelectric output. In conclusion, HY4RES demonstrates robust performance across all scenarios. When provided with harmonized input parameters, its simulation results are consistent with those of HOMER Pro, thereby validating its reliability for hybrid energy management in aquaculture applications.
1. Introduction
One of the specific goals of the HY4RES project is to show the potential of hybrid renewable power systems in decarbonizing the aquaculture sector. Additionally, it will demonstrate how to effectively and efficiently balance supply and demand in such a complex hybrid energy system, utilizing variable supply and demand patterns to further enhance the system’s operation. All of this is to be achieved while optimizing the system for cost savings and emission reductions [1].
Efficient energy utilization and the reduction in environmental pollution are critical drivers for the sustainable development of modern aquaculture systems [2]. In this context, ref. [3] introduced a novel design for hybrid energy systems optimized through multi-objective techniques, specifically tailored to meet the unique demands of the aquaculture industry. Oxygen supply plays a vital role in fish growth, health, and stocking density. To address this, ref. [4] developed an innovative solar-powered oxygen generator that integrates water electrolysis with fuel cell technology, offering a cleaner and more sustainable solution for oxygenation in aquaculture environments. Tackling global challenges in energy and food production requires integrated, forward-thinking approaches. Reference [5] proposed a Smart Integrated Aquaponics system that merges solar-hydro hybrid energy with deep learning-based forecasting, enhancing both the operational efficiency and scalability of aquaculture and hydroponic farming. By leveraging renewable energy sources and artificial intelligence, this system reduces environmental impact, mitigates energy variability, and improves resource optimization [6]. Energy remains a central concern for policymakers, driven by society’s heavy reliance on fossil fuels and the mounting evidence of climate change. Coupled with the pressures of a growing global population and food insecurity, innovative land-use strategies such as Agri-PV—where solar photovoltaic systems are co-deployed with agricultural activities—offer promising solutions [7]. This concept has been further explored through the deployment of concentrating solar power technologies in arid regions, demonstrating potential for integration with aquaculture operations [8]. In terms of operational intelligence, ref. [9] developed a deep learning-based pattern recognition system to monitor and predict fish behavior, providing intelligent decision support for aquaculture management. Meanwhile, ref. [10] analyzed advancements in marine renewable energy technologies, emphasizing the importance of multi-energy complementarity and the integration of these systems with aquaculture infrastructure. Their work highlights the engineering innovations necessary to harness marine renewables effectively within aquaculture settings.
An interesting study analyzed the energy optimization in large-scale recirculating aquaculture systems, including the implementation and performance analysis of a hybrid deep learning approach. Economic analysis revealed a 17% decrease in energy costs per kilogram of fish production. The system’s performance was validated under varying fish biomass densities (80–120 kg/m3) and seasonal temperature profiles. These findings demonstrate the effectiveness of integrating deep learning techniques for energy optimization, providing a scalable solution to enhance the economic and environmental sustainability of intensive aquaculture operations [11]. On the other hand, fisheries and aquaculture are highly reliant on fossil fuels and must change to renewable energy to reduce carbon emissions and meet global planetary health goals. Here, the authors assessed total and renewable energy use in farmed catfish and wild-caught salmon, two of the largest seafood sectors in the United States [12]. The seafood industry is marked by high levels of energy and water consumption, primarily driven by operations such as freezing, refrigeration, heating, cooling, drying, cleaning, de-icing, defrosting, and salt splashing. This excessive use of resources leads to uncontrolled wastewater generation, increased fossil fuel dependency, and elevated greenhouse gas emissions. The interconnectedness of water and energy usage—known as the energy–water nexus—amplifies environmental and economic burdens, as significant energy is required for both freshwater extraction and wastewater treatment. Reference [12] present a review that critically examines the current patterns of energy and water usage in the seafood sector, highlighting inefficiencies and environmental impacts. It underscores the urgent need for sustainable development through resource optimization. Key focus areas include the adoption of advanced management practices, integration of energy-efficient technologies, water recycling, process reengineering, and renewable energy solutions. Emphasis is placed on minimizing environmental degradation and improving cost-effectiveness while enhancing sustainability across the seafood supply chain. Energy and water consumption patterns in seafood processing industries and their optimization methodologies are presented in [13]. Ref. [14] developed a study about energy optimization in seafood processing industries. Energy optimization in the seafood industry essentially involves reducing the amount of energy, be it electrical energy or conventional energy, from sources like fossil fuels or oil consumed by an industry during the period between the procurement of raw materials and the delivery of the final processed product. Energy optimization can substantially contribute to a reduction in operating costs during the processing of seafood materials. Moreover, the utilization of large quantities of energy can lead to poor processing efficiency and increased emission of effluents to the environment, which harms the products’ carbon footprint. The Irish Seafood agency reports that 15% of global energy is consumed by operations related to refrigeration and air conditioning in the fish industry, which stresses the importance of the integration of clean renewables and adoption of smart energy management solutions. While fish processing industries have high energy costs with continuous refrigeration, air conditioning, and ice making processes, there is a real need to analyze and model energy use in fish ports to understand its environmental impacts in terms of CO2 emissions while exploring the potential for integrating renewable energy sources [15]. Ref. [16] developed a systematic literature review of the most recurring themes concerning smart and sustainable logistics initiatives within port cities to develop a multidimensional framework capable of holistically integrating the prevailing enabling factors (Ecosystem, Internal Organization, Data and Security, Policy and Regulation, Finance and Funding, and Digital and Technology), domains (Mobility, Environment, Economy, Telecommunications, Safety and Security, Government, and Community) and goals (Sustainable Development and Digitalization) that characterize smart and sustainable logistical development. Therefore, the results of this research show that smart and sustainable logistics initiatives in port cities (a) have the potential to enhance the efficiency of economic, environmental, social, and technological flows; (b) increase the involvement and awareness of stakeholders such as couriers, shippers, shipping companies, citizens, port authorities, municipalities, security officers, gate and terminal personnel, and so on; (c) provide a detailed overview of the enabling factors, domains, and goals that must be activated by port cities to foster a smart and sustainable logistical transition.
A scientific paper reviews how solar PV can be integrated into freshwater fish farms in Croatia. It emphasizes economic feasibility, reduction in water evaporation, and shading benefits, while discussing challenges like high capital cost and maintenance [17]. A novel economic analysis framework is proposed to assess and compare the profitability of agrivoltaic and aquavoltaic systems. Applied in China, the results show average payback periods of 6.2–6.6 years for agrivoltaics and 9.5–10.1 years for aquavoltaics. Key factors influencing profitability include PV capital cost, solar resource richness, and feed-in tariff. Agrivoltaics and aquavoltaics offer large implementation potential and greater contributions to sustainable development goals than PV-only systems [18].
A new type of floating photovoltaic system designed for water reservoirs is presented by [19]. The system, developed by the Universidad Politécnica de Valencia and Celemin Energy, utilizes polyethylene floating modules connected with tension bars and elastic fasteners to adapt to varying water levels. A prototype was built and tested on an irrigation reservoir in Alicante, Spain. The system aims to reduce water evaporation while simultaneously generating electricity. In [20], the authors reference floating photovoltaic (FPV) plants as showing several benefits compared to ground-mounted photovoltaics (PVs) and potentially having major positive environmental and technical impacts globally.
In this study, a new method for managing hybrid energy in aquaculture is introduced, focusing on improving system self-sufficiency and optimizing grid-related cash flow from energy purchases and sales. The study uses both HOMER® 3.16.2 Pro (a commercial tool) and HY4RES (a research tool) to evaluate energy scenarios tailored to specific site characteristics. It compares the two models using aligned data and assumptions. The models were tailored for hybrid renewable systems in niche sectors, such as aquaculture and fish processing, where energy demands are variable and site-specific. The novelty is associated with a greater flexibility in integrating emerging technologies (e.g., equivalent Aqua/Agri-PV, or even tidal energy) that are not always well-supported by commercial platforms. Open-access and customizable models enable researchers and practitioners in resource-constrained settings to adapt the tool to local conditions and impose more specific constraints/restrictions rather than using the model as a black box with predefined variables.
The broader scientific contribution lies in demonstrating how HY4RES can support context-sensitive energy modeling, especially in industries that are underserved by mainstream energy planning tools. By validating its performance against HOMER Pro, we establish a benchmark of reliability, which then allows us to explore new modeling scenarios, alternative optimization strategies, and policy-relevant insights that extend beyond the capabilities of existing software as follows:
- Explicitly articulate the novel contributions of HY4RES beyond validation.
- Highlight case-specific insights gained through its application to fish processing facilities.
- Clarify the limitations of HOMER Pro in this context and how HY4RES addresses them.
Energy loads for fish processing are based on Island Seafoods data and adjusted for Albatross Seafoods, while wastewater treatment is included in HY4RES. A wood drying kiln, powered by surplus wind energy, is modeled differently in each tool—constant in HY4RES and static in HOMER® 3.16.2 Pro. It identified two sites that are connected through a grid distributed point: a Primary site that initially includes combined hourly loads of Island and Albatross Seafoods using wind generation and five more scenarios with different combinations of biomass, PV, off-grid using BESS, and grid connection, as well as a Secondary site using hydropower and a grid connection in which two additional scenarios were analyzed, which were PV or an off-grid system using BESS.
Hence, this study is structured as follows: Section 1, as previously presented, includes a recent literature review on the subject of hybrid energy solutions and optimization models more related to the type of site under analysis. Section 2 presents the materials and methods used in this research, and a strategic energy operational management program for aquaculture with all input data and definitions of different scenarios included. Section 3 presents results about the operational behavior and grid balance cash-flows of the program. Section 4 discussed the results for the Primary site regarding the total electricity load served and the balance between wind production, grid integration, biomass, and BESS state-of-charge analysis. In the Secondary site the hydropower and grid balance are analyzed, as well as the influence of PV integration. Finally, the limitations of the developed/adapted models are presented. Lastly, Section 5 presents the main conclusions and comparison of possible solutions.
2. Materials and Methods
2.1. Methodology
Hybrid renewable energy systems are needed to combine different renewable energy generation technologies, supplying a single load or a combination of loads. Battery Energy Storage Systems (BESS) can be part of these systems or not. Also, they can be found as off-grid or grid-tied systems [21]. As these systems include different technologies and depend on intermittent sources, their design can be complex.
The HY4RES model was originally designed by Coelho et al. for the water–energy nexus under the HY4RES project [22,23,24,25]. Two models were created, one more sophisticated, based on Python (version 3.13.7) for multi-objective optimization, and the other in Excel for single-objective optimization. In this work, the focus lies on the latter; as such, the Excel model is referred to as the HY4RES model from now on. It is designed to optimize the contribution of different renewable energy technologies to the energy demand for water pumped into a reservoir, which is used for irrigation purposes while also acting as a pumped hydro storage system. Hence, irrigation demand as well as energy demand from the system must be met. NSGA-II is used as the optimization technique in Excel’s Solver. The simulation itself has a range of input parameters. Among them are the hourly water and electricity needs, the hourly grid purchase and feed-in prices, and the hourly generation data for wind, PV, and one more generation technology of choice. Additionally, the specifications of each technology are needed, including reservoir data, hydropower parameters, and the parameters of the BESS. The model is designed to operate either grid-connected or off-grid with a BESS. Once all the input data are set, the model simulates the energy balance, considering hourly loads and generation. Excess electricity can be used to pump water into the reservoir or feed into the grid. At the end, the grid cash flow is computed, and several graphs with the hourly profiles are depicted as an output. The tool does not include an in-depth financial analysis; it only takes grid cash flows into account (Figure 1).
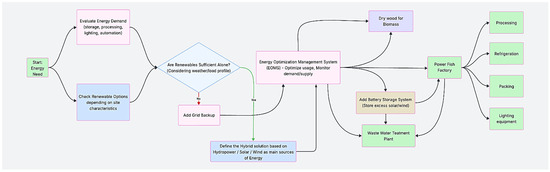
Figure 1.
New methodology for an aquaculture energy management.
The objective is to analyze the operability and performance of this system with two separate sites with two different energy management tools, HOMER, a commercial model, and HY4RES, a research model, and to propose new solutions with more renewable sources in an optimized way to increase the cash flow and reduce energy dependence. The analyzed system has restrictions and potentialities that will be explored during this investigation.
2.2. Aquaculture Case Study
The case study observed for this project was located in the north-west of Ireland in Donegal County [26]. It comprised two aquaculture companies, Island Seafoods and Albatross Seafoods, each producing different value-added fish and seafood products. The water from the two processing facilities is treated in a wastewater treatment facility on-site. On the generation side, a wind turbine and a Small Hydropower (SHP) plant have been installed. Recently, the companies decided to install a biomass drying kiln next to the wind turbine to utilize excess electricity that cannot be fed into the grid. For the simulation and analysis of the system, the site was separated into two, as each is connected separately to the grid. The two systems are shown in Figure 2. From now on, they are referred to as the Primary and Secondary sites.

Figure 2.
Existent aquaculture case study subdivided into the primary and secondary sites.
Island Seafoods has collected 10 years of electricity generation and consumption data, which was available for this project. This included consumption data from the wastewater treatment facility and generation data from the SHP plant. Albatross Seafoods, on the other hand, does not have its consumption data available.
2.3. Model Adaptation
As this case study does not include water needs, the HY4RES model had to be adapted and could be simplified. The model’s results are compared later with those from HOMER Pro. Hence, the adaptation of the HY4RES model was primarily to enable a viable comparison between the tools, taking this aquaculture case study into account. As a first step, the water needs were set to 0, and all the pump variables were as well. This deactivated the hydropower generation in the reservoir. Furthermore, the computation of the energy excess/deficit was adjusted to enable grid and BESS operation simultaneously. Several renewable technologies were integrated in this case study. Therefore, one more alternative energy generation technology was added to the input sheet and to the simulation itself. Hydropower, on the other hand, was inserted with a separate hourly generation profile, instead of relying on the reservoir. Finally, another page was added to the model to summarize important performance metrics for the comparison with HOMER Pro’s results.
2.3.1. Input Data
With the overarching goal of comparing the HY4RES model’s results with those from HOMER Pro, the input data was prepared to resemble the dataset used in HOMER Pro as closely as possible. The same approach and assumptions were taken. The following sections present the parameters and input data for each of the loads and generation technologies. Additionally, some information on energy storage systems and financial parameters is given.
- (i)
- Fish processing facilitiesFor the Primary site, the electricity load data of Island Seafoods for each 15 min of the year 2023 is available. The data was combined to express the electric load for each hour of the same year. As there is no recorded consumption data for Albatross Seafoods, it was assumed that its consumption is 0.9292 of Island Seafoods’ [6]. With this approach, the combined load at the Primary site could be computed and was available as an input to the HY4RES model.
- (ii)
- Wastewater treatment plantThe same approach as for the fish processing facilities was repeated for the data from the wastewater treatment plant. For certain timestamps, data was missing, or too many timestamps were recorded. In this case, the surplus timestamp data was added to another timestamp where the load was zero, to reach the correct yearly total. In HOMER Pro, a different approach is chosen. A commercial electricity consumption profile from the library with 1200 kWh/day and 430.72 kW peak is used.
- (iii)
- Wood drying kilnAs a means of utilizing excess energy from the wind turbine that cannot be fed into the grid due to feed-in restrictions, a wood drying kiln was installed at the Primary site. The typical primary wood used for drying in Ireland is Sitka spruce with a density of 400−500 kg/m3. It is assumed that 2000 kWh are needed to dry 1 t of Sitka spruce [5]. The installed kiln for the drying of this wood has a rated power of 300 kW. Hence, 1.8 t of wood can be dried per day, considering a 12 h operation of the drying kiln. This results in 657 t of dried wood per year. To consider the biomass drying kiln in the simulation, the excess electricity from the base case was assumed to be available for its operation. Operation for 12 h per day between 08:00 a.m. to 08:00 p.m. with a constant power of 300 kW was plotted for every hour of the year. In HOMER Pro, a load of 3600 kWh/day and 516.86 kW peak was chosen to represent the biomass drying kiln.
- (iv)
- Small hydropower plantOn the Secondary site, a small hydropower plant was installed in 2007. It utilizes the river flow and has the parameters shown in Table 1. Due to an installation error, it does not operate at rated power but only at 250 kW. It directly supplies the load of the wastewater treatment facility and feeds excess electricity directly to the grid.
 Table 1. Parameters of the SHP at the secondary site.Table 1. Parameters of the SHP at the secondary site.
Name Value Note Pr 380 kW Only operates at 250 kW Type Francis Reaction turbine Hb 61 m Medium head n 1000 rpm Rated conditions Q 0.7 m3/s Rated flow ηT 80% Turbine efficiency ηElec 95% Electric conversion For the SHP, monthly generation data is available from Island Seafoods. To take the monthly variation into account, each month’s electricity generation was split equally over the hours of the month. The monthly generation data was then compiled into one yearly file to serve as an input for the HY4RES model. In HOMER Pro a different approach was chosen. The SHP was modeled in the program directly with the data from Table 1 and a design flow rate of 0.522 m3/s to reflect the limited power of 250 kW. - (v)
- Wind turbineA single Vestas V52-850 wind turbine was commissioned in 2021. It is directly connected to the primary site’s electrical network, supplying the demand of the two processing facilities and feeding excess electricity into the grid. Due to feed-in limitations, the turbine is only allowed to feed in 120 kW. Approximately 80 kW is used directly in the two processing facilities, while 180 kW is used for heating purposes. This situation leaves 300 kW of unused potential. The key parameters of the turbine are found in Table 2.
Table 2. Parameters of the Vestas V52 850 wind turbine at the primary site.Table 2. Parameters of the Vestas V52 850 wind turbine at the primary site.
Name Value Note Pr 850 kW Maximum operation at 500 kW due to grid injection limitations Hhub 44 m halt 60 m above sea level Lat. 54.673 Long. −8.422 Data merra2 for 2023
To adjust the hourly generation data of the wind turbine, the power coefficient is necessary. As it is a function of the wind speed, it has to be computed for each hourly wind speed. Publicly available data for the Vestas V52 was used, and a polynomial regression was created as shown in Figure 3. The corresponding equation is shown in Equation (1).

Figure 3.
Vestas V52 850 kW power coefficient. Orange is a polynomial regression of the 6th order.
cp = −7.3 · 10−6u6 + 0.00047u5 − 0.01215u4 + 0.16063u3 − 1.14862u2 + 4.21017u − 5.70269
The simulation in HOMER Pro disregards the feed-in limit of the Vestas V52 wind turbine and simulates using the nominal power of 850 kW. The same is performed by HY4RES. HOMER Pro uses an internal wind turbine simulation wherein the turbine model and wind profile are used. Wind data was loaded from NASA’s POWER database with 30 years of mean hourly wind speeds. The wind turbine power curve in HY4RES was adjusted to match HOMER Pro’s annual energy output of 2,240,471 kWh for comparative purposes and thus may not reflect actual operation under the 120 kW feed-in limit. These were then adjusted to u hub = 6.4 m/s as a yearly average. For the wind generation in HY4RES, the data from Table 2 was inserted into Renewables. Ninja’s wind simulation tool received the hourly generation data for the year 2023 [27]. To begin with, the hourly wind speeds were scaled to achieve u hub = 6.4 m/s, the same value that was used in HOMER Pro. However, this led to a much lower annual energy generation of 1,683,882 kWh. Therefore, it was decided to scale the hourly wind speeds for an annual energy generation of 2,240,471 kWh, the same annual generation that resulted from the HOMER Pro simulation. To achieve this, the cp as a function of the wind speed was plotted with data from [28]. The plot can be found in Figure 2. With the help of the plot, a polynomial regression of 6th order was created and hence the power coefficients for any wind speed could be computed. With Excel’s goal seek function, the annual energy generation was adjusted to the corresponding value by multiplying the initial wind speeds from Renewables.Ninja with a multiplier of ≈0.79744156. This adjusted the annual energy generation to the desired value by adjusting the hourly wind speeds, approaching, as much as possible, the simulation of HOMER Pro.
- (vi)
- Solar PVTo simulate the PV system, PVGIS 5.3 was used with the input displayed in Table 3 to generate hourly electric energy values. PVGIS was run with a 1 kWp nominal power; its generation was then scaled to 120 kWp. Due to availability restrictions, the year 2020 was used for the PVGIS simulation. Both slope and azimuth angle were optimized automatically by PVGIS.
Table 3. Parameters of the rooftop PV system.Table 3. Parameters of the rooftop PV system.
Name Value Note Pr 120 kW (c-Si) β 42° Slope γ 0° Azimuth fderate 14% System losses halt 46 m above sea level Lat. 54.673 Long. −8.422 Data PVGIS-SARAH2 for 2020 - (vii)
- Biomass generatorTo utilize only parts of the dried wood in a biomass generator on site, a 25 kW generator was chosen, thus still leaving dried wood to be sold on the local market. It is assumed that the 25 kW is constantly available throughout each hour of the year, amounting to a yearly energy generation through biomass of 219,000 kWh.
- (viii)
- Energy storageWhen the scenario to be compared encompasses a BESS, it was decided upon to use the nominal capacity of the BESS as an input in HY4RES. HOMER Pro uses a more sophisticated BESS simulation and regards the usable capacity. This is used in any scenario where a BESS is present. If not stated otherwise, Li-ion BESSs are used.
- (ix)
- Financial parametersTo achieve similar results in terms of cash flows, the electricity feed-in price and purchase price from HOMER Pro are used. These are 0.195 EUR/kWh and 0.3808 EUR/kWh, respectively. They remain constant throughout each hour of the average year.
2.3.2. Model Comparisons: Scenario Definitions
Following the simulations performed in HOMER Pro, the same scenarios were created in the HY4RES model for comparison. The included technologies and scenarios are listed in Table 4. Furthermore, the approach for each simulated scenario in HY4RES is explained in more detail.
Table 4.
Technologies included in each scenario of the Primary and Secondary systems.
Primary site: In the base scenario, the combined hourly loads of Island Seafoods and Albatross Sseafoods were inserted into the HY4RES model together with the adjusted hourly wind generation. It is worth noting that the feed-in limitation is not considered in any of the HY4RES simulations, as it is not considered in HOMER Pro. The simulation was run, and results are extracted as graphs and key performance indicators. The base case of the Primary site does not include the wood drying kiln. This was chosen to align with HOMER Pro’s simulation.
Regarding the other scenarios, a brief description of their characteristics is listed as follows:
Primary site: Scenario 1—In terms of the energy surplus available for the biomass drying kiln, the value from HOMER Pro’s simulation was used for comparison. The hourly load profile from the base case was used, and the one from the biomass drying kiln was added. This new profile was then considered in the HY4RES model. Additionally, the hourly generation profile of the biomass generator was added. Scenario 2—This was Scenario 1 extended by solar PV generation. Scenario 3—As this scenario was off-grid, only using a BESS to balance energy deficits or excesses, the sum of hourly deficits after the operation of the BESS was subtracted from the annual consumption, leaving only the electricity consumption. According to this value, the reduction in annual consumption of the wood drying kiln could be deduced, as well as the annual reduction in wood dried. The 22 MWh and 63 MWh BESS capacities were selected based on sensitivity analysis to achieve acceptable unmet demand levels while maintaining comparability with HOMER Pro’s scenarios. Scenario 4—The same approach was taken as for Scenario 3, only extending the generation with solar PV; Scenario 5—This scenario did not include the Biomass Generator (BG). However, it still had the wood drying kiln as a load. The wood was simply not consumed on site but sold on the local market. According to [29], the same percentage of unmet electricity demand was used as in Scenario 4. Hence, this reduction in electricity demand translated into less electricity being available for drying the wood, reducing the amount of wood that could be dried per year and the hourly electricity demand. The reduced hourly demand was then added to the hourly loads of the fish processing facilities, and the final vector was the input for the HY4RES tool. To achieve the same percentage of unmet electricity demand, a BESS with a capacity of 63 MWh was needed. Scenario 6—Returning to a grid-tied system, the standard consumption profile of the wood drying kiln was regarded again, with 657 t of wood dried each year. As such, no energy deficit was noted, and a cash flow could be recorded.
Secondary site: In the base scenario, the column of the tertiary generation technology was filled with the hourly generation data of the small hydropower plant (SHP) and the hourly load profile of the wastewater treatment facility was inserted in the electrical consumption column.
In the Secondary site, two scenarios were defined: Scenario 1—the base case was simply extended by the use of the rooftop solar PV system, and its hourly generation vector was inserted into the HY4RES inputs. Scenario 2—Instead of the grid-tied system, this scenario included a 400 kWh BESS. It did not fully meet the electricity demand during the summer months, when hydropower generation was low.
3. Simulation Results
This section presents the simulation results from the HY4RES tool and compares them with HOMER Pro. The discussion of the corresponding results can be found in Section 4.
3.1. Operational Behavior
For the Primary and Secondary sites, the results include energy consumption and generation in Table 5 and Table 6, respectively.
Table 5.
Electricity consumption.
Table 6.
Electricity generation.
3.2. Grid Balance Cash Flow
For the Primary site, the comparison of cash flows from grid feed-in and grid purchasing based on the comparison of models’ performance between HY4RES and HOMER Pro results (Table 7) is presented for the respective scenarios with grid connection.
Table 7.
Primary site: grid cash flows from feed-in and purchase.
HY4RES modeling displays the revenue, expense, and cash-flow figures under the HY4RES column, generated using the custom-built simulation tool of the same name. This tool models hybrid renewable energy systems tailored to aquaculture operations, incorporating site-specific parameters, load profiles, and renewable resource data. Benchmarking with HOMER Pro was used to validate the model, in which the same input parameters and configurations were run through HOMER Pro. This allows for a direct comparison of how each tool handles system optimization, cost allocation, and energy dispatch.
The comparison of results between HY4RES and HOMER Pro across the base case and three scenarios with grid connection shows a good agreement between them. This can be demonstrated by the close values in revenue, expenses, and cash flow, especially considering that these are two different modeling tools that use slightly different assumptions and computational methods. Here is a breakdown: (i) Base case—Revenue: 285,114 EUR (HY4RES) vs. 300,097 EUR (HOMER) → 5% difference; Expenses: 128,919 EUR vs. 200,819 EUR → Larger variation, possibly due to differing CAPEX/OPEX estimation approaches; Cash flow: 156,195 EUR vs. 99,278 EUR → Reflects the expense difference. Despite the variation in expenses, both models identify a positive cash flow, suggesting profitability and general alignment in outcome direction. (ii) Scenario 1: Wind, Biomass and Grid—Revenue: 193,133 EUR vs. 186,283 EUR → ~3.5% difference; Expenses: 366,273 EUR vs. 395,556 EUR → ~8% difference; Cash flow: −173,140 EUR vs. −209,273 EUR → Both models agree on the unprofitability of this scenario and display strong agreement on revenue and qualitative cash flow outcome. (iii) Scenario 2: Wind, Biomass, PV and Grid- Revenue: 198,423 EUR vs. 194,251 EUR → ~2.1% difference; Expenses: 336,769 EUR vs. 373,374 EUR → ~9.8% difference; Cash flow: −138,346 EUR vs. −179,123 EUR → Both show losses. Very close to revenue estimates and matching trend in expenses and losses. (iv) Scenario 6: Wind, PV and Grid—Revenue: 176,664 EUR vs. 175,033 EUR → ~0.9% difference; Expenses: 377,673 EUR vs. 419,040 EUR → ~11% difference; Cash flow: −201,009 EUR vs. −244,007 EUR → Consistent with the trend. Highest alignment in revenue; both models identify the scenario as financially unfavorable.
While some expense estimates vary—likely due to internal model differences—the revenue figures are consistently close, and both tools yield the same directional insights regarding profitability or loss. This suggests good agreement and reliability between HY4RES and HOMER Pro for comparative energy system modeling.
The same type of analysis was developed for the Secondary site (Table 8).
Table 8.
Secondary site: Comparing the grid cash flows from feed-in and purchasing.
Based on Table 8, the comparison between HY4RES and HOMER Pro for the Secondary site shows a good level of agreement in their results across both the base case and Scenario 1 (Hydropower, PV and Grid). Despite being different modeling platforms, the results—particularly for cash flow—are remarkably close, indicating consistency in the financial outcomes they predict. In the base case, HY4RES reports a revenue of 121,499 EUR, while HOMER Pro estimates 90,153 EUR. Though there is a moderate difference in revenue and expenses—likely due to model-specific assumptions and some geographical input data—the resulting cash flows are nearly identical, with HY4RES at 54,154 EUR and HOMER Pro at 55,532 EUR. This suggests that both models agree on the overall financial viability of the base case. In Scenario 1, both models again show close alignment. HY4RES calculates a revenue of 133,547 EUR, and HOMER Pro reports 102,764 EUR. Expenses differ, but the cash-flow values are almost the same: 82,508 EUR from HY4RES and 82,159 EUR from HOMER Pro. The small difference in cash flow (less than 1%) highlights the strong agreement between the models regarding the economic performance of this energy configuration. Overall, this comparison demonstrates that HY4RES and HOMER Pro produce consistent and comparable financial outcomes, especially in terms of cash flow. This reflects a good agreement between the models and supports their reliability for techno-economic analysis in hybrid energy systems.
4. Discussion
4.1. Primary Site
In the base scenario, wood drying was not considered, and the focus was solely on electricity generation and grid sales. The variability of the electric loads throughout the analyzed year becomes evident in Figure 4a, where the load fluctuates and reaches its peak at slightly above 700 kW. This aligns with the 720 kW from HOMER Pro, which was approximately the highest load, supplied by the wind turbine. As the same hourly consumption data was used for HOMER Pro and the HY4RES tool, the yearly energy consumption was almost the same for both simulation tools. On the generation side, the yearly total energy generated by the wind turbine was the same for both models. The HOMER Pro simulation resulted in a more homogeneous output power throughout the year, showing the typical dip in summer but remaining stable. The HY4RES simulation, on the other hand, showed a strong decrease in generation during May. This deviation in wind power output profile can be explained by the underlying wind speeds used for the simulation. However, the HY4RES model’s wind simulation aligns better with the hourly load profile, leading to a reduction in grid injection but also a reduction in grid purchases. The higher degree of energy excess is emphasized in Figure 4b. As seen, the energy produced throughout an average year meets the energy needs. Therefore, excess energy can be used to transfer energy for the biomass wood-drying process. Figure 4b demonstrates that the electricity that can be sold to the grid throughout the year is significantly higher than the electricity consumed.

Figure 4.
Total electrical load served (a); grid balance (b).
In Scenario 1 (Wind+Biomass+Grid) the additional load of the wood drying kiln became evident. It increased the maximum power demand to close to and slightly above 1000 kWh. The results showed a strong alignment between the two models. The implementation of the BG and the additional load of the wood drying kiln was an interesting solution to absorb the excess energy production when the limitation of the grid was evident. As a consequence of this load, the energy balance was much more balanced in terms of grid injection/supply, as can be seen in Figure 5.

Figure 5.
Scenario 1: Monthly electric production (a); load, wind, and biomass energy (b).
Due to the misalignment of the kiln with the excess electricity, the self-sufficiency of the system decreased, even though it should have increased if correctly managed. This was the case both for HOMER Pro and HY4RES. The difference between both models was only 3.2%. The BG had a limited effect on the results, as the generation profile was constant with 25 kW each hour of the year for both models.
In Scenario 2 (Wind+Biomass+PV+Grid) on the load side, both simulations resulted in similar values. The annual electricity generation of the solar PV system was lower by 2558 kWh in HY4RES compared to HOMER Pro. The hourly generation profile followed the typical trend of a peak in the summer months and lower production during winter. Thanks to the PVGIS system, the self-sufficiency of the system could be increased by 3.1% in HY4RES compared to the previous scenario (Figure 6).

Figure 6.
Renewable energy sources and their output values (a); the met electricity load (b).
In Scenario 3 (Wind, Biomass, and BESS) HY4RES presented a sum of the hourly loads that could still be supplied over the year as 96,634 kWh higher compared to the sum in HOMER Pro. HY4RES used a simplified BESS model, which disregarded losses and simply used the nominal capacity instead of the useful capacity, which was considered in HOMER Pro. This was confirmed by the electricity deficit, which was 3.6% higher in HOMER Pro than in HY4RES. As a result, the biomass drying kiln could be operated at a higher capacity in the HY4RES model, leading to an additional 48 tons of dried wood per year. The dip in wind turbine generation in May directly affected the SOC of the BESS during that same period. Figure 7 shows that there was not enough excess electricity to recharge the BESS during this period. On the generation side, the annual values aligned very well for both models.

Figure 7.
Load served and BESS state-of-charge for Scenario 3.
The system utilized 1 MWh lithium-ion batteries, requiring a total of 22 units. As a result, 85.6% of the electricity demand was met, while 14% (348,857 kWh) remained unmet. Due to this energy deficit, the wood-drying capacity needed to be reduced from 657 tons per year to 483 tons per year.
In Scenario 4 (Wind, Biomass, BESS and PV)—as with the previous scenario, the annual generation aligned very well between both models. However, the addition of the rooftop PV system increased the wood-drying capacity by 6% in the HY4RES model. The state of BESS charge and the load served are shown in Figure 8.

Figure 8.
Load served and SOC of BESS for Scenario 4.
In Scenario 5 (Wind, PV, and BESS), with the same wood-drying capacity, which resulted from the previous scenario, HY4RES was not able to meet all of the hourly demand. HOMER Pro did succeed in this, while the former still had an additional 4.7% of electricity demand unmet. The generation side was well aligned. On the topic of storage, the SOC in Figure 9 of the 63 MWh BESS was a lot less volatile compared to the smaller one. In HOMER Pro, this scenario was regarded as the worst one in terms of cost and technical feasibility. With the size of the BESS in mind, this can only be underlined.

Figure 9.
PV, Wind prodution and SOC of BESS for Scenario 5.
In Scenario 6 (Wind, PV and Grid), in terms of loads, there was an alignment between both models. The rate of self-sufficiency differed by 4.5% between the models. In the HY4RES model, it was 1.3% lower compared to Scenario 1, which includes BG instead of the PV system. Figure 10 shows the total electrical load served in this scenario.

Figure 10.
Total load electricity served in Scenario 6.
4.2. Secondary Site
The base case (SHP+ Grid) reached a self-sufficiency of 59.6% and 79.2% in HY4RES and HOMER Pro, respectively. According to the provided data, the hydropower plant should have a nominal capacity of 350 kW; however, due to installation faults, it operates at approximately 250 kW. The technical implications of operating at both full capacity and 250 kW were examined. Previous production data was analyzed every month, and an average flow profile was input into the Homer Pro software (Figure 11). The head value was set at 61 m, with a maximum flow rate of 700 L/s. To operate at 250 kW, the design flow rate needed to be approximately 522 L/s, while for full capacity (350 kW), the design flow rate was calculated to be around 732 L/s. The energy generated could be supplied to the wastewater treatment facility, and any excess energy could be sold to the grid.

Figure 11.
Hydropower and grid balance at Secondary site.
Scenario 1 (SHP+PV+Grid) at the Secondary site reached a self-sufficiency of 69.4% and 87.6% in HY4RES and HOMER Pro, respectively. Adding PV to the base system was highly beneficial. With the integration of PV, electricity consumption from the grid was significantly reduced (Figure 12). A 120 kW PV installation on the rooftop was considered.

Figure 12.
The influence of PV installation (a); total renewable power output and electrical load served (b), in Scenario 1.
In Scenario 2 (SHP+PV+BESS) the HOMER Pro resulted in 11.5% of the original load of the waste water treatment plant being unmet (Figure 13). In HY4RES, 24.9% of the adjusted annual load (approximately 105,000 kWh out of 422,000 kWh) remained unmet, compared to 11.5% (approximately 48,600 kWh) in HOMER Pro. In the case of the BESS, a usable capacity of the BESS of 320 kWh was used. The BESS was charged with 25,055 kWh and 13,123 kWh per year in HY4RES and HOMER Pro, respectively.

Figure 13.
PV power output, SHP, and SOC of BESS in Scenario 2.
Due to the fixed hourly load of the wastewater treatment facility in HY4RES, there was a resulting additional 13.4% of electricity demand remaining unmet compared to HOMER Pro. This is also evident when comparing the values from Scenario 1 and Scenario 2 in Table 8. Additionally, the simplified simulation of the BESS used in HY4RES resulted in 48% more electricity being supplied by battery. Figure 10 shows the operation of the BESS throughout the year. The SOC was stable at 100% during several periods of the year, which could indicate a possible oversizing of the BESS. Likewise, there were a few periods when the renewables’ generation was not sufficient to supply the loads or charge the battery; these were the periods when a deficit occured. Integrating FPV in aquaculture environments introduces hydrodynamic challenges related to mooring system design and response under varying water levels and dynamic loads [30,31].
4.3. Limitations of the Models
Both models, HOMER Pro and HY4RES, have their limitations. In terms of the HY4RES model, the cash-flow computation as used leads to a very limited significance of the result, as it only includes the cash low with the grid and completely disregards any investment cash flows or other operational cash flows. Additionally, HY4RES assumes a simplified BESS model with 100% round-trip efficiency and 100% Depth of Discharge (DoD), ignoring charge/discharge losses and usable capacity constraints. In contrast, HOMER Pro likely incorporates realistic efficiencies (e.g., 90–95% round-trip) and DoD limits (e.g., 80%), leading to a 3.6% higher electricity deficit in Scenarios 3–5. HOMER Pro’s simulation is held back by a simplified hydropower generation profile, which does not differentiate between different hourly power outputs but only between months, keeping the monthly hourly power output constant for each month. Using already-available load profiles from the HOMER Pro library can lead to deviations from reality, but they are a better estimate than assuming constant load profiles.
Secondly, there are limitations induced by the input data used for the HOMER Pro simulation. After reviewing the parameters of the wastewater treatment facility, it becomes evident that the HOMER Pro load profile used has a daily electricity consumption that is 4.68 times higher than the actual daily consumption metered on site. Hence, the input data for both simulations does not reflect complete real conditions. However, using a constant hourly load in HY4RES also induces error that can be substantial compared to the real load profile. The load of the biomass drying kiln, which should be flexible and only operate when excess electricity is available, was considered constant for several hours of the day. Using the annual excess electricity from the Primary Site: base case, a basis for the constant hourly load calculation was assumed. This had the effect of increasing the energy deficit and, as such, also the expenses from purchasing electricity from the grid. This only allows comparisons between scenarios that include the biomass drying kiln, not with the base case or other scenarios. Hence, the results cannot be taken as absolute values. After some further investigation, it became clear that the vector that was supposed to represent Island Seafoods’ hourly loads is the amount of excess electricity from the wind turbine being sold to the grid under a variable price PPA. The downscaling of the wind turbine generation data to the average annual hourly wind speed was performed according to a value that was estimated by an engineering consultancy before the installation of the turbine and hence comes with uncertainty about its applicability. Additionally, HOMER Pro disregarded the grid injection limit, which led to a reduced grid cash flow in both models. In HOMER Pro, the cost of equipment that had already been bought and installed several years ago, the sunk costs, were included in the financial calculation. This renders the results of the financial calculation useless in terms of the real financial benefits; it only allows for a comparison between scenarios.
5. Conclusions
This study evaluates hybrid renewable energy systems for aquaculture using two modeling tools: HOMER Pro and HY4RES. It simulates hourly energy balances based on real load profiles and renewable generation data. The goal is to assess system operability, performance, and financial viability across two distinct sites. HY4RES introduces a tailored methodology for aquaculture energy optimization, focusing on self-sufficiency and grid cash flow. Island Seafoods and Albatross Seafoods provide scaled load data for fish processing facilities. A wastewater treatment plant was included, with HOMER using a generic profile and HY4RES applying site-specific adjustments. A wood drying kiln was modeled differently in each tool to test flexibility in load management. The secondary site includes a 250 kW hydro plant and a wind turbine, with generation adjusted via regression in HY4RES. PV generation was based on 2020 PVGIS data, scaled to 120 kWp for consistency. The comparison reveals operational and economic insights for decarbonizing aquaculture energy systems. Then, this study analyzes the base case plus six additional scenarios for the primary site, and two more for the secondary site:
- Base Case (Primary Site): Includes the combined hourly loads of Island and Albatross Seafoods with wind generation. No wood drying kiln or feed-in limits are considered.
- Scenario 1: Adds biomass drying kiln and a 25 kW biomass generator to the base load.
- Scenario 2: Extends Scenario 1 with 120 kWp solar PV.
- Scenario 3 (Off-grid): Uses only wind, biomass, and a 22 MWh BESS. Load reductions are based on unmet demand; less wood is dried.
- Scenario 4: Scenario 3 + solar PV; similar energy balance, unmet demand remains.
- Scenario 5: Biomass generator removed; kiln still operates. Due to unmet demand, drying is reduced. A larger 63 MWh BESS is needed to maintain the same deficit level.
- Scenario 6: Returns to grid-tied; full kiln operation resumes, 657 t of wood dried/year, and cash flow is recorded.
- Base Case (Secondary Site): It uses the hourly generation data from the small hydropower plant (SHP) as the tertiary generation input, and the hourly load profile of the wastewater treatment facility is entered as the site’s electrical consumption.
- Scenario 1 (Grid-tied): Adds rooftop solar PV, and its hourly generation is included in the simulation.
- Scenario 2 (Off-grid): Replaces the grid connection with a 400 kWh BESS. The system does not fully meet demand in summer due to low hydro generation.
In summary, for the Primary site and base case, both HY4RES and HOMER Pro show the same annual energy output from the wind turbine, with HOMER Pro providing a more stable output profile over the year. In Scenario 1 (Wind + Biomass + Grid), both models show a power demand peak slightly above 1000 kWh due to the added wood drying kiln load. This addition helps balance grid interaction and aligns well across models. In Scenario 2 (Wind + Biomass + PV + Grid), PV generation differs slightly, with HY4RES producing 2558 kWh less than HOMER Pro, but achieving a 3.1% increase in system self-sufficiency. In Scenario 3 (Wind + Biomass + BESS), HY4RES supplies 96,634 kWh more annual load than HOMER Pro, mainly due to its simplified BESS modeling without accounting for system losses. Consequently, HOMER Pro shows a 3.6% higher electricity deficit. Scenario 4 (Wind + Biomass + BESS + PV) shows close alignment in annual generation, while HY4RES increases wood-drying capacity by 6% with the PV addition. In Scenario 5 (Wind + PV + BESS), HOMER Pro fully meets the hourly load, while HY4RES has a 4.7% unmet demand despite similar generation. Finally, in Scenario 6 (Wind + PV + Grid), both models show similar load profiles, but the self-sufficiency rate differs by 4.5%, with HY4RES showing a 1.3% drop compared to Scenario 1.
For the Secondary site, HY4RES reports 121,499 EUR in revenue and 54,154 EUR in cash flow, while HOMER Pro shows 90,153 EUR in revenue and 55,532 EUR in cash flow. In Scenario 1 (Hydropower, PV and Grid), revenues are 133,547 EUR (HY4RES) and 102,764 EUR (HOMER Pro), with nearly identical cash flows of 82,508 EUR and 82,159 EUR, respectively. The minimal cash-flow differences (less than 1%) confirm strong consistency in financial outcomes between the models.
Taking into account the comparisons for all scenarios, a general pattern becomes clear for the optimization tools: (i) For those scenarios that are grid-connected where the same input data in terms of electricity supply and demand is used, both models deliver very similar results. This is confirmed by the results of the Primary site: base case, Scenarios 1, 2, and 6. (ii) When the simulation includes a BESS, the more detailed approach used in HOMER Pro delivers more accurate results. This becomes evident in the consumption data of the Primary site: Scenarios 3, 4, and 5 or in the Secondary site: Scenario 2.
However, the remaining differences between the simulation results of the two optimization models mainly originate from deviations in the input data. If the same input data were used, then the results would align even better, but the data depends on the sources used by each model tool. Finally, this comparison between the HY4RES model and HOMER Pro can be concluded to be a success, and the former’s simulation capabilities are confirmed. HY4RES is well-suited for rapid analysis of grid-connected aquaculture systems due to its simplicity, while HOMER Pro’s detailed BESS modeling is preferable for off-grid scenarios requiring precise loss calculations and storage optimization.
Author Contributions
Conceptualization, H.M.R., N.S., E.B. and J.G.; methodology, H.M.R., N.S., O.E.C.-H. and M.P.-S.; validation, H.M.R., A.M. and J.G.; formal analysis, H.M.R., N.S. and E.B.; investigation, H.M.R., N.S. and E.B.; resources, J.G.; data curation, O.E.C.-H. and M.P.-S.; writing—original draft preparation, H.M.R., N.S. and E.B.; writing—review and editing, O.E.C.-H., A.M. and J.G.; supervision, H.M.R., M.P.-S., A.M. and J.G. All authors have read and agreed to the published version of the manuscript.
Funding
This research received no external funding.
Data Availability Statement
The data supporting the results of this study are available upon request from the corresponding author.
Acknowledgments
This work was supported by FCT, UIDB/04625/2025 CERIS, in the Hydraulic Laboratory, for experiments on pumped storage performance, and the project HY4RES (Hybrid Solutions for Renewable Energy Systems) EAPA_0001/2022 from the INTERREG ATLANTIC AREA PROGRAMME.
Conflicts of Interest
The authors declare no conflicts of interest.
References
- Ramos, H.M.; Morani, M.C.; Carravetta, A.; Fecarrotta, O.; Adeyeye, K.; López-Jiménez, P.A.; Pérez-Sánchez, M. New Challenges towards Smart Systems Efficiency by Digital Twin in Water Distribution Networks. Water 2022, 14, 1304. [Google Scholar] [CrossRef]
- Zhang, R.; Chen, T.; Wang, Y.; Short, M. An optimisation approach for the design and operation of recirculating aquaculture systems integrated with sustainable hybrid energy systems. J. Clean. Prod. 2024, 477, 143860. [Google Scholar] [CrossRef]
- Nguyen, N.T.; Matsuhashi, R. Tran Thi Bich Chau Vo, A design on sustainable hybrid energy systems by multi-objective optimization for aquaculture industry. Renew. Energy 2021, 163, 1878–1894. [Google Scholar] [CrossRef]
- Erdemir, D.; Dincer, I. Development of renewable energy based green hydrogen and oxygen production and electricity generation systems for sustainable aquaculture. J. Clean. Prod. 2024, 434, 140081. [Google Scholar] [CrossRef]
- Dewi, T.; Risma, P.; Oktarina, Y.; Dwijayanti, S.; Mardiyati, E.N.; Sianipar, A.B.; Hibrizi, D.R.; Azhar, M.S.; Linarti, D. Smart integrated aquaponics system: Hybrid solar-hydro energy with deep learning forecasting for optimized energy management in aquaculture and hydroponics. Energy Sustain. Dev. 2025, 85, 101683. [Google Scholar] [CrossRef]
- Li, P.; Wang, Y.; Liu, J.; Liang, M. Evaluation of Carbon Emission Efficiency and Analysis of Influencing Factors of Chinese Oil and Gas Enterprises. Energy Sci. Eng. 2025, 13, 1156–1170. [Google Scholar] [CrossRef]
- Ferreira, R.F.; Lameirinhas, R.A.M.; Bernardo, C.P.C.V.; Torres, J.P.N.; Santos, M. Agri-PV in Portugal: How to combine agriculture and photovoltaic production. Energy Sustain. Dev. 2024, 79, 101408. [Google Scholar] [CrossRef]
- Khalaf, K.A.; Gamil, A.; Attiya, B.; Cuello, J. Exploring the potential of concentrating solar power technologies for vertical farming in arid regions: The case of Western Iraq. Energy Sustain. Dev. 2023, 77, 101310. [Google Scholar] [CrossRef]
- Shreesha, S.; Pai, M.M.M.; Pai, R.M.; Verma, U. Pattern detection and prediction using deep learning for intelligent decision support to identify fish behavior in aquaculture. Ecol. Inform. 2023, 78, 102287. [Google Scholar] [CrossRef]
- Cao, J.; Liu, J.; Liu, X.; Zeng, C.; Hu, H.; Luo, Y. A Review of Marine Renewable Energy Utilization Technology and Its Integration with Aquaculture. Energies 2025, 18, 2343. [Google Scholar] [CrossRef]
- Alnemari, A.M.; Elmessery, W.M.; Moghanm, F.S.; Espinosa, V.; Shams, M.Y.; Elwakeel, A.E.; Saeed, O.; Eid, M.H.; Alhag, S.K.; Al-Shuraym, L.A.; et al. Energy optimization in large-scale recirculating aquaculture systems: Implementation and performance analysis of a hybrid deep learning approach. Aquac. Eng. 2025, 111, 102561. [Google Scholar] [CrossRef]
- Scroggins, R.E.; Fry, J.P.; Brown, M.T.; Neff, R.A.; Asche, F.; Anderson, J.L.; Love, D.C. Renewable energy in fisheries and aquaculture: Case studies from the United States. J. Clean. Prod. 2022, 376, 134153. [Google Scholar] [CrossRef]
- Murali, S.; Krishnan, V.S.; Amulya, P.R.; Alfiya, P.V.; Delfiya, D.S.A.; Samuel, M.P. Energy and water consumption pattern in seafood processing industries and its optimization methodologies, Clean. Eng. Technol. 2021, 4, 100242. [Google Scholar]
- Amulya, P.R.; Murali, S.; Alfiya, P.V.; Delfiya, D.S.A.; Samuel, M.P. Energy optimization in seafood processing industries. Indian Food Ind. Mag. AFST (I) 2018, 37, 49–52. [Google Scholar]
- Alzahrani, A.; Petri, I.; Rezgui, Y. Analysis and simulation of smart energy clusters and energy value chain for fish processing industries. Energy Rep. 2020, 6, 534–540. [Google Scholar] [CrossRef]
- D’Amico, G.; Ioppolo, G.; Szopik-Depczyńska, K.; Dembińska, I. Smart and sustainable logistics of Port cities: A framework for comprehending enabling factors, domains and goals. Sustain. Cities Soc. Artic. 2021, 69, 102801. [Google Scholar] [CrossRef]
- Matulić, D.; Andabaka, Ž.; Radman, S.; Fruk, G.; Leto, J.; Rošin, J.; Rastija, M.; Varga, I.; Tomljanović, T.; Čeprnja, H.; et al. Agrivoltaics and Aquavoltaics: Potential of Solar Energy Use in Agriculture and Freshwater Aquaculture in Croatia. Agriculture 2023, 13, 1447. [Google Scholar] [CrossRef]
- Jing, R.; He, Y.; Hea, J.; Liu, L.; Yang, S. Global sensitivity-based prioritizing the parametric uncertainties in economic analysis when co-locating photovoltaic with agriculture and aquaculture in China. Renew. Energy 2022, 194, 1048–1059. [Google Scholar] [CrossRef]
- Ferrer-Gisbert, C.; Ferrán-Gozálvez, J.J.; Redón-Santafé, M.; Ferrer-Gisbert, P.; Sánchez-Romero, F.J.; Torregrosa-Soler, J.B. A new photovoltaic floating cover system for water reservoirs. Renew. Energy 2013, 60, 63–70. [Google Scholar] [CrossRef]
- Pouran, H.M.; Padilha Campos Lopes, M.; Nogueira, T.; Alves Castelo Branco, D.; Sheng, Y. Environmental and technical impacts of floating photovoltaic plants as an emerging clean energy technology. iScience 2022, 25, 105253. [Google Scholar] [CrossRef]
- Das, K.; Hansen, A.D.; Leon, J.P.M.; Zhu, R.; Gupta, M.; Pérez-Rúa, J.; Long, Q.; Pombo, D.V.; Barlas, A.; Gocmen, T.; et al. Research Challenges and Opportunities of Utility-Scale Hybrid Power Plants. WIREs Energy Environ. 2025, 14, e70001. [Google Scholar]
- Coelho, J.S.T.; van de Loo, M.; Díaz, J.A.R.; Coronado-Hernández, O.E.; Perez-Sanchez, M.; Ramos, H.M. Multi-Objective and Multi-Variable Optimization Models of Hybrid Renewable Energy Solutions for Water–Energy Nexus. Water 2024, 16, 2360. [Google Scholar] [CrossRef]
- Coelho, J.S.T.; Alves, A.B.; Morillo, J.G.; Coronado-Hernández, O.E.; Perez-Sanchez, M.; Ramos, H.M. Hybrid Energy Solution to Improve Irrigation Systems: HY4RES vs. HOMER Optimization Models. Energies 2024, 17, 4037. [Google Scholar] [CrossRef]
- Ramos, H.M.; Coelho, J.S.T.; Bekci, E.; Adrover, T.X.; Coronado-Hernández, O.E.; Perez-Sanchez, M.; Koca, K.; McNabola, A.; Espina-Valdés, R. Optimization and Machine Learning in Modeling Approaches to Hybrid Energy Balance to Improve Ports’ Efficiency. Appl. Sci. 2025, 15, 5211. [Google Scholar] [CrossRef]
- Ramos, H.M.; Pina, J.; Coronado-Hernández, O.E.; Pérez-Sánchez, M.; McNabola, A. Conceptual hybrid energy model for different power potential scales: Technical and economic approaches. Renew. Energy 2024, 237, 121486. [Google Scholar] [CrossRef]
- Interreg Atlantic Area HY4RES. Aquaculture Pilot Site Ireland Online. Available online: https://hy4res.eu/pilot-sites/aquaculture/ (accessed on 4 November 2024).
- Pfenninger, S.; Staell, I. Long-term patterns of European PV output using 30 years of validated hourly reanalysis and satellite data. Energy 2016, 114, 1251–1265. [Google Scholar] [CrossRef]
- Wind-turbine-models.com. Vestas V52 Online. Available online: https://en.wind-turbine-models.com/turbines/71-vestas-v52 (accessed on 29 April 2025).
- Bekci, E. HY4RES Project—Aquaculture in Ireland HOMER Pro simulation report. IST 2024.
- Lian, Y.; Chen, Q.; Zheng, J.; Zhang, J.; Sheng, D.; Tao, L.; Yim, S.C. Effects of water level variation on the response of mooring systems for offshore floating photovoltaic platforms. Ocean. Eng. 2025, 339, 122088. [Google Scholar] [CrossRef]
- Lian, Y.; Chen, Q.; Zheng, J.; Zhang, J.; Sheng, D.; Tao, L.; Yim, S.C. Numerical study on the dynamic response of mooring systems for an offshore floating photovoltaic platform. Int. Conf. Offshore Mech. Arct. Eng. 2024, 87837, V05BT06A034. [Google Scholar]


Disclaimer/Publisher’s Note: The statements, opinions and data contained in all publications are solely those of the individual author(s) and contributor(s) and not of MDPI and/or the editor(s). MDPI and/or the editor(s) disclaim responsibility for any injury to people or property resulting from any ideas, methods, instructions or products referred to in the content. |
© 2025 by the authors. Licensee MDPI, Basel, Switzerland. This article is an open access article distributed under the terms and conditions of the Creative Commons Attribution (CC BY) license (https://creativecommons.org/licenses/by/4.0/).