Abstract
Urban roof segmentation plays a pivotal role in applications such as urban planning, infrastructure management, and renewable energy deployment. This study explores the evolution of deep learning techniques from traditional Convolutional Neural Networks (CNNs) to cutting-edge transformer-based models in the context of roof segmentation from satellite imagery. We highlight the limitations of conventional methods when applied to urban environments, including resolution constraints and the complexity of roof structures. To address these challenges, we evaluate two advanced deep learning models, Mask R-CNN and MaskFormer, which have shown significant promise in accurately segmenting roofs, even in dense urban settings with diverse roof geometries. These models, especially the one based on transformers, offer improved segmentation accuracy by capturing both global and local image features, enhancing their performance in tasks where fine detail and contextual awareness are critical. A case study on Ben Guerir City in Morocco, an urban area experiencing rapid development, serves as the foundation for testing these models. Using high-resolution satellite imagery, the segmentation results offer a deeper understanding of the accuracy and effectiveness of these models, particularly in optimizing urban planning and renewable energy assessments. Quantitative metrics such as Intersection over Union (IoU), precision, recall, and F1-score are used to benchmark model performance. Mask R-CNN achieved a mean IoU of 74.6%, precision of 81.3%, recall of 78.9%, and F1-score of 80.1%, while MaskFormer reached a mean IoU of 79.8%, precision of 85.6%, recall of 82.7%, and F1-score of 84.1% (pixel-level, micro-averaged at IoU = 0.50 on the held-out test set), highlighting the transformative potential of transformer-based architectures for scalable and precise urban imaging. The study also outlines future work in 3D modeling and height estimation, positioning these advancements as critical tools for sustainable urban development.
1. Introduction
The rapid urbanization and expansion of cities globally have underscored the necessity for precise and scalable methods to analyze and visualize urban environments. Roof segmentation, the process of identifying and delineating roof structures within satellite or aerial imagery, is a critical component in various urban applications. These applications range from urban planning and infrastructure management to the deployment of renewable energy systems such as solar panels, where accurate roof segmentation is crucial for assessing potential solar exposure areas [1].
However, extracting meaningful information from satellite imagery presents several challenges, particularly in the context of roof segmentation [2]. Satellite images often suffer from lower resolution compared to UAV images, making it difficult to accurately delineate small or intricate roof structures. The lower resolution results in a loss of fine details, which are critical for identifying and segmenting complex roof geometries, especially in densely built urban environments where buildings are closely packed and roofs may overlap or be partially obscured by shadows or vegetation [3]. This lack of detail can significantly impact the accuracy of segmentation, leading to errors in subsequent applications such as solar panel installation, where precise identification of available roof surfaces is essential.
In contrast, UAV images typically offer higher resolution and more detailed visual information, allowing for more precise segmentation of roofs and other urban features. Despite this advantage, the use of UAVs is often limited by regulatory constraints, cost, and the need for extensive flight planning in large urban areas. Consequently, satellite imagery remains a widely used data source, albeit with inherent challenges [4].
Another critical aspect of roof segmentation is the identification of unused or underutilized roof surfaces. These areas hold significant potential for renewable energy projects, particularly in the context of urban solar energy generation. Accurately identifying and segmenting these surfaces from satellite imagery is vital for optimizing the deployment of solar panels, which requires precise calculations of available space and exposure to sunlight [5]. The complexity of urban environments, combined with the limitations of satellite imagery, makes this task particularly challenging, necessitating the development and application of advanced deep learning models to improve segmentation accuracy.
Traditional image segmentation methods often struggle with the complexities inherent in urban scenes, which are characterized by roofs of varying shapes, sizes, materials, and colors. These methods frequently result in inaccurate or incomplete segmentation, particularly in dense urban areas where overlapping structures and shadows add to the challenge [4]. To address these challenges, recent advancements in deep learning have introduced more sophisticated models capable of capturing intricate details in complex imagery. Among these, Mask R-CNN has emerged as a prominent model due to its ability to perform instance segmentation by accurately identifying and classifying individual objects within an image, making it particularly useful for segmenting roofs in heterogeneous urban landscapes [1].
Despite the effectiveness of Mask R-CNN, its reliance on predefined categories and its limitations in handling very fine-grained details have led to the development of newer models such as MaskFormer. These limitations stem from the inherent architecture of traditional Convolutional Neural Networks (CNNs), which primarily focus on local features due to their reliance on convolutional layers. This focus on local regions can hinder the model’s ability to capture global context and intricate details necessary for tasks such as roof segmentation in complex urban environments [6].
The introduction of transformers into computer vision represents a significant advancement in overcoming the limitations of traditional Convolutional Neural Networks (CNNs). Transformers, originally designed for natural language processing, utilize a self-attention mechanism that enables the model to weigh the importance of different elements across the entire input data [7]. In the context of image segmentation, this mechanism allows the model to capture long-range dependencies and relationships between distant pixels, improving its ability to understand and segment objects that may be spread across an image or obscured by overlapping structures. Traditional CNNs primarily rely on local operations, processing small patches of the image with filters, which can make it challenging to effectively capture global context. By contrast, transformers apply attention mechanisms that consider the entire image at once, allowing the model to simultaneously capture both local and global features [3].
Transformer architectures have gained significant traction in the field of computer vision due to their exceptional capacity to capture intricate patterns and relationships within image data. Prominent examples include the Vision Transformer (ViT), Data-efficient Image Transformers (DeiT), and the Swin Transformer, which introduces a hierarchical structure to enhance scalability and efficiency in high-resolution image processing [3].
MaskFormer capitalizes on the strengths of transformers by combining them with Convolutional Neural Networks (CNNs) to form a unified query-based framework adept at both semantic and instance segmentation tasks. Its ability to maintain a global perspective while focusing on specific image regions enhances segmentation accuracy, especially in complex environments like urban areas [6]. MaskFormer also features a module that converts existing per-pixel classification models into a mask classification approach, using the set prediction mechanism from DETR [8] to predict both the class and shape of roof segments, improving segmentation in dense urban settings.
This study aims to evaluate the performance of these advanced models, Mask R-CNN and MaskFormer, by analyzing quantitative metrics such as Intersection over Union (IoU), precision, recall, and F1-score, alongside qualitative assessments to contribute to more accurate urban imaging solutions.
2. Related Works
Roof segmentation has been a critical area of research due to its applications in urban planning, renewable energy deployment, 3D modeling, and infrastructure management. Traditional image processing techniques, such as edge detection, region growing, and manual annotation, were initially employed but were labor-intensive and error-prone, particularly in complex urban environments where roof structures vary significantly, leading to limited accuracy and scalability [9].
The advent of deep learning revolutionized the field, with Convolutional Neural Networks (CNNs) becoming the primary tool for image segmentation. Early examples, like the use of CNNs for aerial image segmentation, showed promise in detecting and segmenting buildings and roofs. The introduction of Fully Convolutional Networks (FCNs) further advanced the field by enabling pixel-wise segmentation of entire images, improving accuracy and efficiency in various segmentation tasks, including urban imagery [10].
Building on these advancements, Mask R-CNN added a branch for predicting object masks, facilitating precise instance segmentation and becoming widely adopted for urban roof segmentation due to its ability to accurately delineate individual roofs in dense urban settings [10].
The development of transformers marked the next significant leap. Originally designed for natural language processing, transformers utilize self-attention mechanisms to capture long-range dependencies within an image, particularly benefiting the segmentation of complex structures like roofs where global context is crucial [9].
This approach was refined by Vision Transformers (ViTs), which effectively process images as sequences of patches to capture both local and global data [11].
Recent studies have continued to push the boundaries of roof segmentation. For instance, Roof-Former introduced a deep learning model based on vision transformers that uses structural reasoning and edge-based refinement to accurately segment planar roof geometries, outperforming prior state-of-the-art methods [11].
Additionally, transformer-based approaches have shown the ability to capture both macro and micro-level features in urban images, leading to more precise segmentation outcomes and underscoring the growing importance of transformers in handling the intricate details required for effective roof segmentation [12].
The latest advancements, such as MaskFormer, combine the strengths of transformers with CNNs to enhance both semantic and instance segmentation tasks. MaskFormer integrates a unified query-based framework that excels in complex urban environments, particularly where conventional CNNs fall short [12].
3. Study Area
The study focuses on Ben Guerir City, situated in the Rhamna Province of the Marrakesh-Safi region in central Morocco. Geographically, Ben Guerir is located at approximately 32.23° north latitude and 7.95° west longitude, encompassing an area of around 45 square kilometers [13] (see Figure 1).
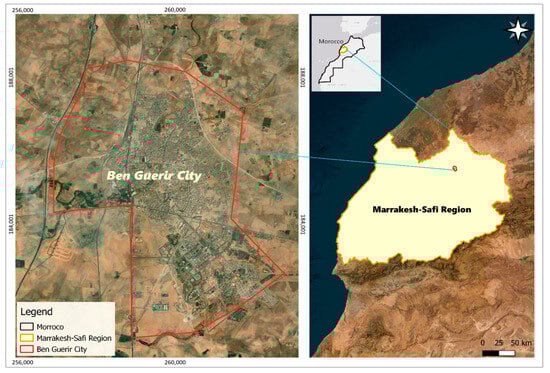
Figure 1.
Location of Ben Guerir City within Morocco and the Marrakesh-Safi Region.
Ben Guerir serves as a strategic urban center due to its proximity to major economic hubs and its position along the transportation corridor connecting Casablanca and Marrakesh. The city has experienced significant growth, partly due to the establishment of the Mohammed VI Polytechnic University (UM6P), a research-intensive institution promoting innovation in science and technology [14].
Economically, Ben Guerir is known for its phosphate mining industry and hosts one of the largest deposits managed by the OCP Group, a key contributor to Morocco’s phosphate exports and national economy [15].
The city’s population is estimated to be over 100,000 residents, reflecting its rapid urban expansion and demographic dynamism. Urban development efforts, including eco-districts and solar energy projects, have made Ben Guerir an important case for sustainable urban planning [16].
Climatically, Ben Guerir experiences a semi-arid climate, with hot, dry summers and mild, wet winters. The average annual temperature is around 19 °C, and total annual precipitation is about 300 mm, making the region suitable for solar energy development [13].
The surrounding landscape features a mix of agriculture, native vegetation, and growing industrial zones. This heterogeneity supports research on urban–environmental interactions, and the city’s combination of rapid growth, environmental constraints, and energy innovation makes it a prime location for spatial analysis using advanced roof segmentation and solar planning models.
4. Methodology
The methodology for the study involves an end-to-end workflow for roof segmentation and georeferencing, utilizing deep learning techniques and advanced architectures such as Mask R-CNN and MaskFormer. This process includes data acquisition, preparation, annotation, training, testing, and the final generation of a georeferenced map of Ben Guerir’s roofs, as summarized in Figure 2.
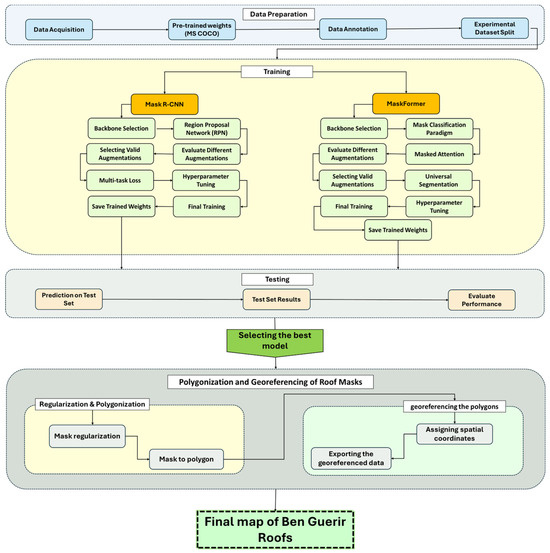
Figure 2.
End-to-end workflow for roof segmentation and georeferencing using deep learning and advanced architectures.
4.1. Data Collection and Sources
The spatial boundary of Ben Guerir City utilized in this study was derived from the “Administrative Division 2015” of Morocco, which provides the most recent and accurate delineation of administrative boundaries in the country. This administrative boundary data is essential for ensuring that the analysis is confined strictly within the city’s official limits, thereby enhancing the precision and relevance of the study’s findings [17].
To obtain high-resolution satellite imagery for the study area, we used Google Earth imagery accessed through the QGIS software platform. The imagery for the Marrakesh-Safi region, with a specific focus on Ben Guerir, was acquired at a resolution of 0.3 m. This high-resolution data is crucial for capturing detailed features of the urban landscape, particularly the roofs, which are the primary focus of this research [13]. The choice of QGIS as the software tool allows for efficient handling and manipulation of the imagery, thanks to its powerful geospatial data processing capabilities [13].
Once the imagery was acquired, the data was split into manageable patches of 512 × 512 pixels using a combination of Rasterio, NumPy, Pandas, and Shutil libraries. This step is essential for preparing the data for model training, as it allows the large images to be broken down into smaller, more uniform pieces that can be processed more efficiently by the segmentation models. The images, originally in TIFF format, were then converted to JPEG format using the Python Imaging Library (PIL). The conversion to JPEG is necessary to facilitate compatibility with the image annotation tools and to reduce the file size, making it easier to handle large datasets [13].
The annotation process involved manually labeling the roofs in the images using Roboflow and makesense.ai, which are platforms designed for efficient and accurate image annotation. These tools provide user-friendly interfaces for drawing bounding boxes, polygons, and other shapes around objects of interest, in this case, roofs. The labels were then exported in COCO format, a popular format for object detection and segmentation tasks that includes metadata such as the location and size of each labeled object.
High-resolution imagery was tiled into 512 × 512 px patches using a sliding window with 20% overlap (stride = 409 px in both axes). Overlap reduces edge artifacts, preserves objects that straddle tile boundaries, and improves downstream polygonization consistency. At inference, we applied the same tiling strategy and merged overlapping predictions by averaging mask logits prior to thresholding and vectorization.
To prepare these annotations for use in segmentation models, the labels were converted from the original text format into mask images using NumPy. This step involves creating binary mask images where each pixel belonging to a roof is marked, providing a ground truth for model training. The conversion process is critical for ensuring that the annotations are in a format compatible with deep learning frameworks, which typically require pixel-wise label information.
The resulting corpus comprised 2990 image tiles before augmentation. This count is consistent with the Ben Guerir urban extent (≈45 km2) at 0.30 m GSD and the 20%-overlap tiling scheme. We adopted a 70/10/20 split by tiles, yielding 2093/299/598 tiles for train/validation/test, respectively. As described in Section 4.2.3, only the training set was augmented (×5); validation and test counts refer to the original, non-augmented tiles.
The input to the models consists of RGB tiles at 0.30 m GSD; each 512 × 512 px patch covers approximately 153.6 m × 153.6 m (≈0.0236 km2). The corpus spans typical urban fabrics of Ben Guerir, including (i) dense residential blocks with predominantly flat concrete roofs and frequent rooftop parapets, water tanks, and small HVAC units; (ii) industrial and logistics zones characterized by very large sheet-metal roofs with rectilinear footprints; (iii) institutional/planned neighborhoods displaying irregular roof appendages, skylights, and internal courtyards; and (iv) peri-urban edges where small detached buildings are interspersed with bare soil and vegetation. Common imaging conditions include cast shadows, partial vegetation occlusions, and high-reflectance surfaces. For each tile, the corresponding binary roof mask (roof = 1, background = 0) is derived from manual polygon annotation and is used for model training and evaluation.
4.2. Image Preprocessing
4.2.1. Noise Reduction
To ensure the quality and accuracy of the roof segmentation process, it is essential to first address any noise present in the satellite images. Noise in satellite imagery can result from various sources, including sensor anomalies, atmospheric conditions, or compression artifacts. To mitigate these effects, techniques such as Gaussian filtering and Median filtering are employed. Gaussian filtering smooths the image by averaging the pixel values with their neighbors, effectively reducing random noise while preserving important edges. Median filtering, on the other hand, replaces each pixel’s value with the median value of the surrounding pixels, which is particularly effective for removing salt-and-pepper noise without significantly blurring the image [18]. These noise reduction techniques are crucial for enhancing the clarity of the images, thereby improving the accuracy of subsequent segmentation tasks.
4.2.2. Georeferencing and Resampling
After converting the satellite images from GeoTIFF to JPEG, we preserved georeferencing by exporting accompanying worldfiles (JGW) and retaining the original projection metadata. These files were then used to georeference the images and corresponding masks in QGIS, ensuring consistent coordinates and pixel size across the dataset. Georeferencing involves aligning the images to a common coordinate system, which is critical for ensuring that the spatial relationships within the imagery are accurate and consistent across the dataset. This is done by associating the pixel coordinates in the image with real-world coordinates, typically using Geographic Information Systems (GIS) tools such as QGIS. Once georeferenced, the images and masks are resampled to ensure they share a consistent resolution and projection, which is vital for maintaining the spatial integrity of the data during analysis. Resampling techniques such as nearest-neighbor interpolation or bilinear interpolation are often used to adjust the image resolution while preserving as much detail as possible [13].
4.2.3. Data Augmentation
To enhance the robustness of the segmentation models and improve their ability to generalize across various scenarios, data augmentation is applied to the training dataset. Data augmentation involves generating additional training samples by applying random transformations to the original images, thereby increasing the diversity of the dataset without the need for additional labeled data. In this study, the application of data augmentation techniques results in a fivefold (×5) increase in the effective size of the training dataset. Common augmentation techniques include rotation, flipping, scaling, cropping, and brightness adjustments. These transformations help the model learn to recognize roofs under different orientations, lighting conditions, and scales, making the model more versatile and effective when applied to real-world images [19]. Augmentation is particularly important in deep learning tasks where the available labeled data is limited, as it artificially increases the size of the dataset and helps prevent overfitting, ultimately leading to a significant expansion in training data, which is crucial for the success of the segmentation models [20].
We applied stochastic data augmentation only to the training set, with all geometric transforms applied identically to images and masks (masks resampled with nearest-neighbor to preserve labels). Transforms were applied in the following order with the indicated probabilities and ranges: random horizontal and vertical flips (each p = 0.5); random rotation sampled uniformly in [−20°, +20°] (p = 0.7) and with an additional right-angle rotation (one of {0°, 90°, 180°, 270°}, p = 0.3); random scaling with isotropic factor s ∈ [0.90, 1.10] and aspect-ratio jitter a ∈ [0.90, 1.10], followed by resize back to 512 × 512 px; random crop retaining ≥90% of the tile area with reflection padding to restore 512 × 512 px when needed; photometric jitter with brightness, contrast, and saturation adjustments δ ∈ [−0.15, 0.15] and hue shift |ΔH| ≤ 0.05; optional Gaussian blur with σ ∈ [0, 1.0] px (p = 0.2); optional additive Gaussian noise (0, 0.01) (p = 0.2); and Cutout with up to two square holes of size 16–48 px (p = 0.3), constrained to remove ≤30% of any roof mask. Finally, images were normalized using the Detectron2 defaults (mean [103.53, 116.28, 123.675], std [57.375, 57.12, 58.395]).
For each original training tile, we materialized four additional augmented views (×5 effective size), while validation and test tiles remained unaltered. We fixed the random seed to 42 and logged the augmentation parameters to ensure experiment reproducibility.
Before preprocessing, raw tiles ingested via QGIS may show minor reprojection/resampling blur from Web-Mercator mosaics, occasional no-data borders at mosaic seams, small label–image misalignments (polygon vertices not snapped to the pixel grid), and illumination variability across scenes. After the pipeline steps—reprojection to WGS 84/UTM Zone 29N, clipping to the official Ben Guerir boundary, and tiling with 20% overlap (stride 409 px)—adjacent tiles retain roofs that straddle edges and eliminate seam artifacts. Labels exported in COCO format are rasterized to 512 × 512 binary masks with nearest-neighbor resampling and snapped to the tiling grid, removing tiny slivers and ensuring pixel-accurate alignment with imagery. Finally, per-channel normalization (Detectron2 defaults) standardizes brightness/contrast across tiles, yielding inputs with a consistent dynamic range; in practice, this reduces sensitivity to local illumination changes and stabilizes training.
4.3. Segmentation Models
4.3.1. Training and Validation
The training and validation process forms the backbone of the model development pipeline, ensuring that the deep learning models are not only well-fitted to the training data but also capable of generalizing to new, unseen images. In this study, the dataset is meticulously split into three parts: 70% for training, 10% for validation, and 20% for testing. This distribution is chosen to maximize the model’s exposure to a diverse range of scenarios during training while retaining a separate validation set to tune hyperparameters and prevent overfitting. The final testing set, which is entirely unseen during training, provides an unbiased assessment of the model’s performance.
For training the segmentation models, the binary cross-entropy loss is employed for binary segmentation tasks, where each pixel is classified as either roof or non-roof. For multi-class segmentation tasks, categorical cross-entropy loss is used, enabling the model to handle more complex scenarios involving multiple classes [21]. Additionally, Intersection over Union (IoU) loss is integrated to refine the segmentation accuracy by focusing on the overlap between the predicted and actual roof areas, which is crucial for precise urban applications [21].
Hyperparameters are carefully selected to optimize model training. A learning rate of 0.001 ensures that the model converges efficiently without overshooting the optimal solution. A batch size of 16 is used, striking a balance between computational feasibility and model performance. The models are trained over 50 epochs, with early stopping implemented to halt training if the validation loss plateaus, thereby avoiding overfitting [22].
For the implementation details, both models used Detectron2 with ResNet-50-FPN backbones pretrained on COCO: optimizer AdamW (lr = 1 × 10⁻³, weight decay = 0.01), cosine decay schedule, batch size = 16, early stopping on validation loss with patience = 8, random seed = 42. Code used for preprocessing, training, and evaluation is available from the corresponding author upon request.
4.3.2. Model Selection
In this study, two state-of-the-art deep learning models, Mask R-CNN and MaskFormer, are selected for roof segmentation due to their proven effectiveness in complex image segmentation tasks. These models are chosen based on their architecture and their ability to accurately segment roofs in urban environments, which present unique challenges due to the variability in roof shapes, sizes, and materials.
- Mask R-CNN: Mask R-CNN extends Faster R-CNN by adding a branch for predicting segmentation masks on each Region of Interest (RoI) in parallel with the existing branch for classification and bounding box regression. This architecture is particularly advantageous for roof segmentation, as it allows the model to simultaneously detect roofs and delineate their boundaries with high precision [23]. The model’s ability to generate high-quality masks at the instance level makes it ideal for tasks where accurate roof delineation is essential, such as in urban planning and solar panel installation (see Figure 3).
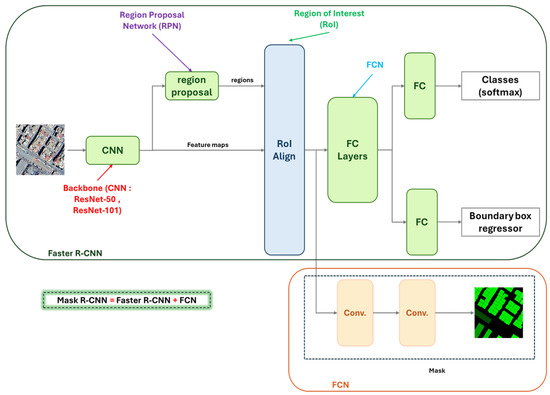 Figure 3. Architecture of Mask R-CNN for roof segmentation.
 - MaskFormer: MaskFormer represents a shift towards using transformers for segmentation tasks. Instead of relying on region proposals, MaskFormer treats image segmentation as a mask classification task, where each pixel is assigned to a specific class by leveraging attention mechanisms (see Figure 4). This model excels in capturing global context and fine details, making it particularly effective for roof segmentation in dense urban environments where roofs can be obscured or only partially visible [22].
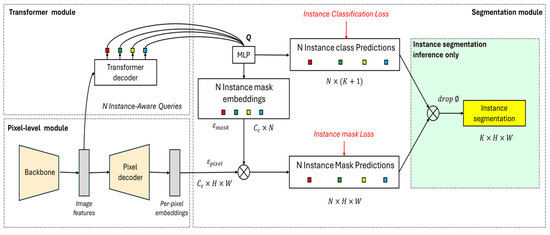 Figure 4. Architecture of MaskFormer for instance segmentation.
These models are selected not only for their cutting-edge architectures but also for their adaptability to the specific challenges posed by urban roof segmentation. Their integration into the study allows for a comprehensive analysis of their strengths and limitations in real-world applications.
4.4. Testing
After training, the models are evaluated on a separate test set to measure their performance. Predictions on the test data are compared to ground truth labels, and several performance metrics, including Intersection over Union (IoU), precision, recall, and F1-score, are calculated to assess model accuracy. These metrics follow standard practices in image segmentation and are widely adopted in remote sensing evaluations [22]. Based on these evaluations, the model with the best performance—Mask R-CNN or MaskFormer—is selected for further use.
4.5. Post-Processing and Accuracy Assessment
After the initial segmentation process, raw segmentation outputs often require refinement to enhance the accuracy and usability of the results. This refinement is crucial for applications like urban planning and infrastructure management, where precise delineation of roofs is necessary.
4.5.1. Segmentation Refinement
To improve the quality of the segmentation outputs, post-processing techniques such as morphological operations and contextual filtering are employed. Morphological operations, including dilation and erosion, are used to clean up the segmentation masks by removing small artifacts and smoothing the boundaries of the segmented roofs [24]. Dilation helps expand the boundaries of detected regions, connecting disjointed segments, while erosion shrinks the boundaries to remove noise. These operations are typically applied in sequence to achieve a balanced refinement of the segmentation output.
Contextual filtering further enhances segmentation by leveraging spatial information, ensuring that the segmented regions align with the expected shapes and sizes of roofs in the urban landscape. This process involves analyzing the spatial relationships between neighboring pixels and regions, refining the segmentation to better match real-world roof structures [25]. By applying these techniques, model predictions are adjusted to produce more coherent and accurate roof segments, especially important in dense and complex urban scenes.
In a representative residential tile, the raw mask contained small interior holes and “stair-step” edges along parapets. We applied a hole-filling step that removed interior voids smaller than ≈10–15 m2, followed by a light morphological opening (3 × 3 kernel) to smooth serrations while preserving corners. Next, small isolated components below ≈0.8 m2 (e.g., noise near vegetation) were removed. Using contextual filtering, roof fragments within ≤1 m and with compatible orientations were merged to restore plausible footprints. The cleaned raster mask was then vectorized and simplified with a Douglas–Peucker tolerance of ~0.30 m (≈one pixel at 0.30 m GSD), and near-orthogonal edges were snapped when angles deviated by ≤12°, producing a single, coherent polygon suitable for GIS analysis. In an industrial tile with a very large sheet-metal roof spanning two overlapping patches, the same workflow merged seam-adjacent fragments during vectorization, yielding a single georeferenced footprint with topologically valid geometry.
4.5.2. Accuracy Assessment
To quantitatively assess the performance of the segmentation models, several key metrics are used, including Intersection over Union (IoU), precision, recall, and F1-score.
- Intersection over Union (IoU):
is simply the average across all categories or regions:
where is the number of classes or regions, and is the for each individual class or region.
Mean IoU: This is the average of the IoU scores across all classes or regions. If there is only one class or region, Mean IoU would be the same as IoU.
- ii.
- Precision:
- iii.
- Recall:
- iv.
- F1-Score:
These metrics ensure that the models are evaluated not only on their ability to segment roofs accurately but also on their capacity to minimize errors, which is especially important when dealing with complex urban scenes. By applying these refinement techniques and accuracy metrics, the segmentation outputs are optimized, delivering reliable and precise results that are essential for practical applications in urban planning and related fields.
4.6. Polygonization and Georeferencing of Roof Masks
The next step is the polygonization and georeferencing of the predicted roof masks. The masks are regularized to ensure smooth boundaries, a common post-processing step in segmentation tasks [29]. These regularized masks are then converted into polygons, which represent the roof outlines.
The polygons are georeferenced by assigning them spatial coordinates, allowing the results to be mapped back onto their real-world geographic locations. This process is essential for integrating the segmented data into Geographic Information Systems (GIS), a standard practice in remote sensing and geographic studies [30].
The georeferenced polygons are exported in formats such as shapefiles or GeoJSON, enabling further spatial analysis or integration with GIS tools. This vectorization step ensures compatibility with downstream urban analytics and planning pipelines, where precise geometry and spatial accuracy are required [31].
5. Results
5.1. Quantitative Evaluation
To assess the performance of the segmentation models, we evaluated Average Precision (AP) and Average Recall (AR) across different Intersection over Union (IoU) thresholds and object sizes (small, medium, and large). The evaluation is based on key metrics that reflect the model’s ability to accurately detect and segment rooftops in Ben Guerir.
We use two complementary evaluation protocols: (i) COCO-style instance-level AP/AR (AP@[0.50:0.95], AR@[0.50:0.95]), reported by size with MaxDet constraints (Figure 5 and Figure 6); and (ii) pixel-level, micro-averaged precision, recall, F1, and mIoU at IoU = 0.50 on the full test set (Figure 7).
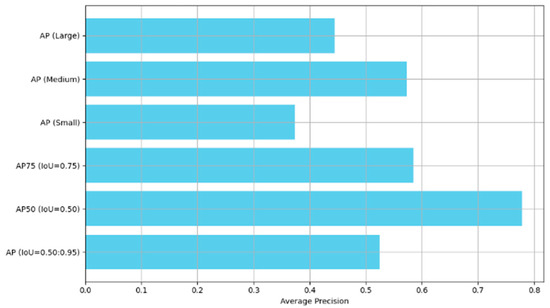
Figure 5.
COCO average precision AP@[0.50:0.95] for Mask R-CNN and MaskFormer, reported by object size (small, medium, large) with MaxDet constraints.
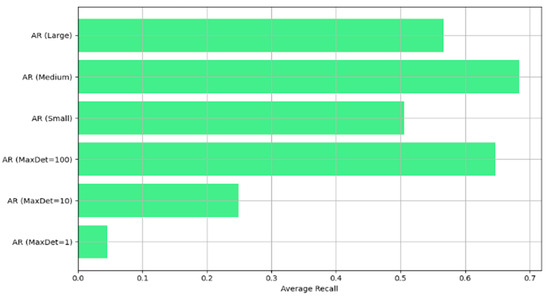
Figure 6.
COCO average recall AR@[0.50:0.95] for Mask R-CNN and MaskFormer, reported by object size (small, medium, large) with MaxDet constraints.
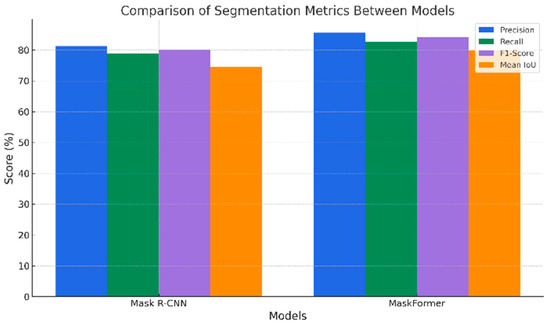
Figure 7.
Pixel-level (micro-averaged) precision, recall, F1-score, and mean IoU (mIoU) for Mask R-CNN and MaskFormer on the full test set at IoU = 0.50. Note: These metrics are not directly comparable to the COCO AP@[0.50:0.95]/AR@[0.50:0.95] by size reported in Figure 5 and Figure 6 (instance-level, size-stratified, MaxDet-constrained).
COCO size bins follow area in pixels: small < 322, medium 322–962, large > 962; with 0.30 m GSD, these correspond approximately to <92 m2, 92–829 m2, and >829 m2, respectively.
5.1.1. Average Precision (AP)
Figure 5 shows the Average Precision (AP) results across various IoU thresholds and object sizes for both Mask R-CNN and MaskFormer. As expected, the precision decreases for small roofs due to their limited pixel representation and higher sensitivity to occlusions or noise. Interestingly, medium-sized roofs achieve slightly higher precision values than larger ones. This trend can be explained by the fact that medium roofs often represent an optimal balance: they provide sufficient pixels to capture relevant geometric details while avoiding the complexity of very large roofs, which frequently include multiple substructures, skylights, or shading elements that can confuse the models and reduce precision.
It is important to emphasize that these results correspond to separate evaluations of Mask R-CNN and MaskFormer rather than a combined or ensemble approach. Thus, the term “the model” refers to the specific architecture under evaluation in each case, with performance metrics reported independently.
5.1.2. Average Recall (AR)
Figure 6 presents the Average Recall (AR) results across different IoU thresholds and object sizes for both Mask R-CNN and MaskFormer. Consistent with the AP findings, recall values are lowest for small roofs because their limited pixel representation makes them difficult to consistently detect. Interestingly, medium-sized roofs again outperform large ones. This can be explained by the fact that medium roofs generally provide clearer, well-defined boundaries without the structural complexity that often characterizes large roofs. In dense urban contexts, large roofs may include multiple annexes, irregular shapes, or shadowed sub-regions, which can fragment the predicted masks. Such structural variability increases the chance of partial detections and lowers recall, whereas medium roofs—being less complex but sufficiently large—are more consistently captured by the models.
As with the AP evaluation, these recall results are reported individually for Mask R-CNN and MaskFormer, not as an ensemble. The use of the term “the model” here refers to each architecture under evaluation in its respective test run.
5.1.3. Comparative Metrics: Precision, Recall, F1-Score, and Mean IoU
To contextualize these results relative to Figure 5 and Figure 6, note that the metrics there follow the COCO protocol at the instance level: AP and AR are averaged across IoU thresholds 0.50–0.95 (AP@[0.50:0.95], AR@[0.50:0.95]), reported by size bin (small/medium/large), and subject to MaxDet constraints. This protocol is intentionally stringent and penalizes boundary localization errors, duplicate detections, and partial misses, which depresses scores—especially in size-restricted subsets. By contrast, Figure 7 reports pixel-level (micro-averaged) precision, recall, F1-score, and mIoU computed on the entire test set (all sizes combined) at a fixed IoU threshold (0.50). Because pixel-level micro-averaging is dominated by large-area rooftops and is less sensitive to instance multiplicity and fine boundary errors, these values are not directly comparable to COCO AP/AR by size and will typically be higher. The underlying sample is the same test set; only the aggregation level and protocol differ.
To quantify uncertainty, we computed 95% confidence intervals via nonparametric bootstrap over test tiles (1000 resamples); across all reported metrics, MaskFormer’s improvements over Mask R-CNN were statistically significant (paired bootstrap on per-tile scores, p < 0.05).
To further benchmark the models, Figure 7 presents a comparative evaluation based on four key metrics: precision, recall, F1-score, and mean IoU. MaskFormer consistently achieves superior results, especially in precision (+4.3%) and mIoU (+5.2%), compared to Mask R-CNN, highlighting its enhanced ability to capture complex rooftop geometries.
5.1.4. Training and Validation Loss Curves
The training and validation loss curves, shown in Figure 8, illustrate the models’ convergence over 50 epochs. Both loss curves indicate stable and effective learning, demonstrating the robustness and generalization capability of the proposed segmentation models.
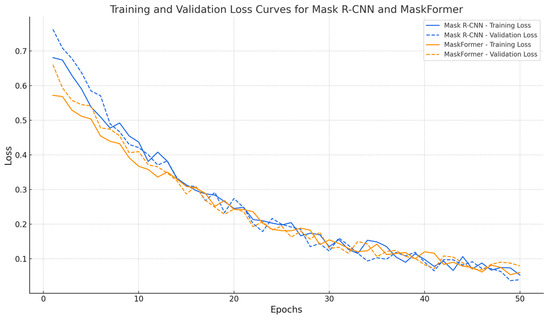
Figure 8.
Training and validation loss curves for Mask R-CNN and MaskFormer models over 50 epochs.
Figure 8 illustrates the training and validation loss curves for both Mask R-CNN and MaskFormer models. Both models demonstrate a steady decrease in training and validation loss, indicating effective learning. MaskFormer achieves a slightly smoother and lower validation loss compared to Mask R-CNN, suggesting better generalization capabilities on unseen satellite imagery. No significant overfitting was observed for either model.
Additionally, Figure 8 presents the evolution of training and validation loss across 50 epochs. The gradual decline and stabilization of both losses without significant divergence indicate effective learning and minimal overfitting. The final convergence of validation loss near the training loss suggests that the models generalize well to unseen data, further validating the robustness of the training process.
5.2. Qualitative Results
Qualitative analysis is organized to mirror the operational pipeline. We first present Mask R-CNN outputs as a strong baseline to illustrate typical instance segmentation artifacts in dense urban blocks. We then explain how the regularization stage addresses those artifacts and converts masks into GIS-ready vector footprints. Finally, we show MaskFormer results as the model-of-record for mapping, highlighting the final georeferenced outputs used in downstream urban analyses.
5.2.1. Mask R-CNN
Figure 9 illustrates representative Mask R-CNN predictions on a dense urban tile. As expected for an instance segmentation baseline, most medium and large rooftops are correctly delineated, while typical artifacts are visible at small scales and along complex boundaries (e.g., minor under-segmentation at roof appendages, slight boundary smoothing near shadows, and occasional fragmentations where façades or vegetation interfere). These behaviors are consistent with the quantitative patterns reported in Section 5.1 and motivate a second-stage refinement to improve boundary fidelity and polygon quality prior to GIS integration.
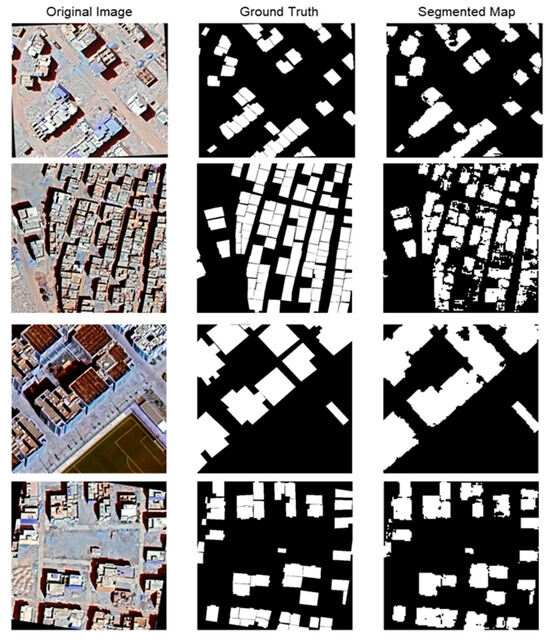
Figure 9.
Baseline qualitative results with Mask R-CNN on Ben Guerir (0.30 m imagery). Left: original image. Center: ground truth mask. Right: predicted mask illustrating typical baseline artifacts (minor boundary smoothing, partial misses on small appendages) that the subsequent regularization stage is designed to correct.
In the operational workflow, these baseline predictions are not used directly for mapping. Instead, they are passed to a regularization stage (Section 5.3) that sharpens boundaries, removes spurious fragments, and prepares masks for polygonization and georeferencing.
5.2.2. MaskFormer
Although MaskFormer outperforms Mask R-CNN across all metrics, the absolute gaps are moderate. Three factors help explain this. First, the baseline is strong: Mask R-CNN with a high-capacity backbone and FPN remains highly competitive for binary rooftop extraction, where much of the signal is conveyed by rectilinear edges and high-contrast boundaries. Second, the aggregate figures in Figure 7 are pixel-level, micro-averaged over the full test set; as large rooftops dominate pixel counts, micro-averaging attenuates gains that arise primarily on medium and small roofs. Third, a dataset-level ceiling; driven by annotation uncertainty on 0.3 m imagery, cast shadows, mixed roofing materials, and minor co-registration errors; limits attainable IoU for both models and compresses separations. Consistent with these explanations, differences become more pronounced under stricter localization criteria and stratification: at higher IoU thresholds (e.g., AP@0.75) and in the medium/small object subsets (cf. Figure 5 and Figure 6), MaskFormer exhibits a clearer relative advantage, and qualitative side-by-sides show sharper boundaries and fewer partial misses.
Figure 10 shows final, georeferenced outputs produced by the full pipeline with MaskFormer as the segmentation backbone. The model captures narrow appendages and irregular roof outlines with high fidelity; after regularization and polygonization, the resulting vector footprints exhibit clean, topologically consistent geometry suitable for GIS. This end-to-end result underscores why MaskFormer serves as the model-of-record for map production and downstream spatial analytics.
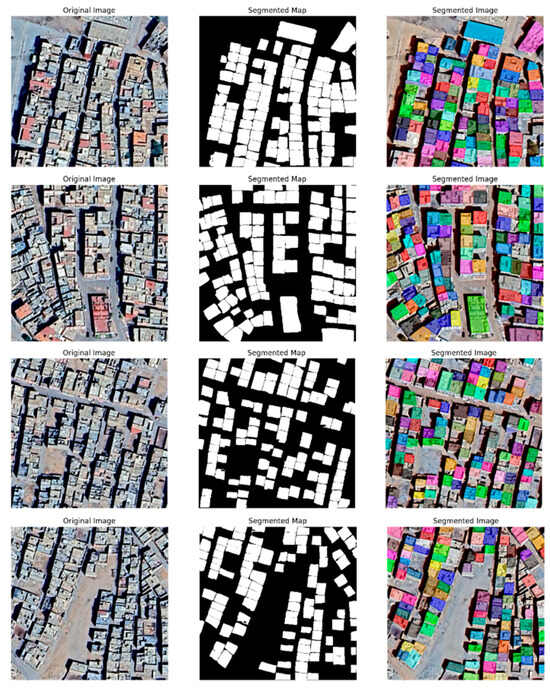
Figure 10.
Final pipeline outputs with MaskFormer on a dense urban scene in Ben Guerir. Left: original image. Center: predicted segmentation map (post-regularization) with sharp roof delineation, including small/irregular structures. Right: georeferenced, polygonized roof footprints ready for GIS integration.
5.3. Regularization Network for Roof Refinement
The regularization stage is applied to all segmentation masks prior to mapping and is pivotal for converting raw predictions (from either backbone) into GIS-ready vectors. This additional step is critical to generate geometrically realistic and visually pleasing building masks, especially in dense urban environments where segmentation noise can degrade polygon extraction quality.
The regularization network is based on a modified version of the approach proposed by Zorzi and Fraundorfer [32]. As illustrated in Figure 11, the network architecture consists of a residual autoencoder that receives as input both the satellite intensity image and the predicted segmentation mask. It produces a refined mask by learning to align the segmentation more accurately with real building boundaries.
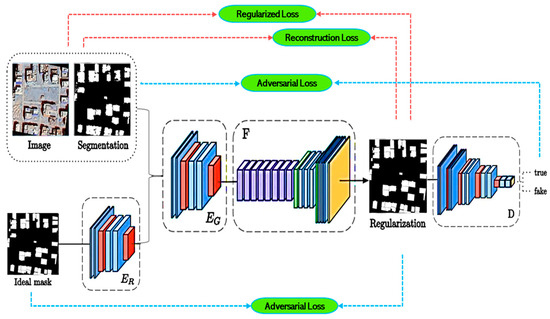
Figure 11.
Schematic overview of the regularization network for roof refinement. The architecture combines a residual encoder–decoder, a discriminator network, and a common decoder to refine initial segmentation masks using a combination of adversarial, reconstruction, and regularization losses.
To train the regularization network, a combination of adversarial loss, reconstruction loss, and regularization loss is used:
- The reconstruction loss ensures that the refined mask closely resembles the initial segmentation.
- The regularization loss encourages the mask to align with the intensity patterns of the original image, promoting geometrically plausible structures.
- The adversarial loss is applied through a discriminator network, which forces the refined masks to be visually indistinguishable from ideal masks derived from OpenStreetMap data.
To address the mismatch between soft (0–1) regularized masks and binary (0 or 1) ideal masks, both real and fake masks are propagated through a common decoder (F) before being passed to the discriminator (D). This design stabilizes the adversarial training and ensures fair comparison between samples.
Encoders EG (for generated masks) and ER (for real masks) extract latent representations, which are jointly reconstructed by the common decoder F to produce the refined segmentation. This strategy helps mitigate format inconsistencies and enhances the overall stability and quality of training.
Finally, the refined regularized masks are used to extract building corners via a secondary lightweight CNN, followed by polygonization and filtering, resulting in clean, georeferenced building footprints ready for urban analysis.
While both backbones benefit from regularization, MaskFormer was adopted as the model-of-record for map production because, in practice, it yields (i) cleaner boundaries after refinement, (ii) fewer residual fragments at small scales, and (iii) more stable polygonization across tiles, properties that directly improve GIS interoperability and downstream analytics. This operational choice aligns with the quantitative trends in Section 5.1 and is reflected in all georeferenced products (Figure 10 and Figure 12).
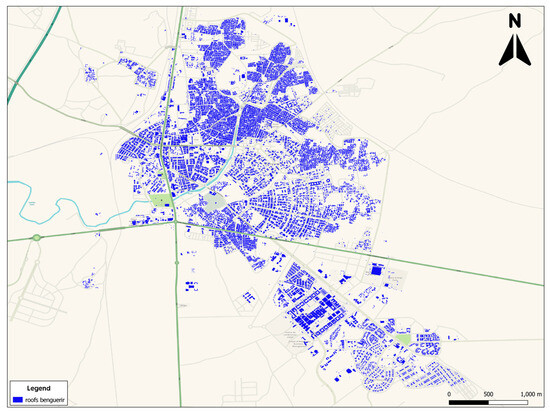
Figure 12.
Citywide rooftop map for Ben Guerir. Blue polygons denote georeferenced roof footprints produced by the full pipeline (MaskFormer + regularization + polygonization).
This refinement stage significantly improves the quality and usability of the segmented outputs, enabling precise urban mapping applications such as building inventory, energy estimation, and urban resilience studies.
5.4. Final Rooftop Map Generation
All rooftop maps reported here were generated using MaskFormer + regularization + polygonization and exported as georeferenced vectors. The final output of this study is a detailed rooftop map of Ben Guerir, generated through the segmentation of high-resolution satellite imagery and subsequent georeferencing of the detected rooftops (see Figure 12). The citywide layer in Figure 12 renders only regularized, topologically valid roof polygons produced by the pipeline (MaskFormer → regularization → polygonization). To ensure GIS quality and legibility, we apply post-processing rules (see Section 4.5.1), including minimum-area filtering (~0.8 m2), hole filling, removal of tiny fragments, and topology fixes. Consequently, areas that may look “building-like” in the basemap but are not colored blue typically correspond to (i) interior courtyards and open patios within blocks (non-roof surfaces); (ii) paved yards/parking areas, awnings/temporary canopies, or other non-roof hardscapes; and (iii) very small outbuildings or narrow appendages that fall below the minimum-area/width criteria or are removed during topology cleaning. In scenes with deep shadow, raw predictions can fragment into tiny pieces; fragments below the small-component threshold are intentionally filtered out to avoid cartographic clutter. These choices are cartographic and quality-control decisions, not model omissions, and are consistent with the refinement rules described in Section 4.5.1. This map provides a precise visualization of the spatial distribution and arrangement of roof structures across the urban landscape. The blue polygons represent the extracted rooftops, offering a comprehensive and accessible overview of the built environment.
This spatially accurate rooftop inventory constitutes a critical tool for urban planning, infrastructure management, and future development initiatives. By providing high-resolution spatial data, the map supports more efficient decision-making processes related to land use optimization, building management, and public services planning. Furthermore, the rooftop map serves as a foundational dataset for solar energy deployment studies, enabling researchers and planners to assess the solar potential of identified rooftops and to design targeted renewable energy strategies.
The segmentation and georeferencing approach adopted in this work demonstrates the scalability and automation potential of deep learning-based urban mapping methodologies. By leveraging convolutional and transformer-based models for segmentation, followed by regularization and polygon extraction techniques, the methodology ensures both high spatial precision and automation readiness.
Previous studies have highlighted the importance of rooftop mapping for sustainable urban development. For example, Castello in 2019 used CNNs to detect rooftop solar panels and demonstrated the feasibility of automated mapping at a national scale [33]. Similarly, Qian et al. (2024) proposed a unified deep learning framework for large-scale rooftop segmentation and classification to support citywide urban studies and policy development [34].
The results presented here extend these efforts to the rapidly growing city of Ben Guerir. With its spatial accuracy and detailed coverage, the generated map offers a valuable resource for guiding future urban sustainability initiatives and renewable energy projects in the region.
6. Discussion
The evaluation of segmentation models through both quantitative metrics and qualitative analysis provides deep insights into their strengths and limitations when applied to rooftop extraction from high-resolution satellite imagery.
From the quantitative evaluation (Section 5.1), MaskFormer consistently outperforms Mask R-CNN across all metrics, achieving higher precision, recall, F1-score, and mean Intersection over Union (mIoU). The superiority of transformer-based architectures is particularly evident in their ability to better capture global context, leading to improved delineation of complex roof structures. Additionally, training and validation loss curves reveal that MaskFormer converges more smoothly and reaches lower final loss values compared to Mask R-CNN, suggesting better generalization capabilities and robustness to overfitting.
The qualitative analysis (Section 5.2) confirms these trends visually. MaskFormer generates cleaner and more accurate roof segmentations, with sharper boundary delineation and improved detection of small, irregularly shaped roofs. In contrast, Mask R-CNN performs adequately on larger rooftops but shows minor segmentation errors, such as boundary smoothing and under-segmentation, particularly in dense or shadowed areas.
While initial segmentation outputs are of high quality, especially for MaskFormer, the post-processing step introduced through the regularization network (Section 5.3) significantly enhances the final results. By leveraging a residual autoencoder and adversarial training, the regularization network refines the masks to produce geometrically plausible, visually coherent building footprints. The integration of regularization, reconstruction, and adversarial losses allows the model to align the predicted masks closely with the real building boundaries visible in the satellite images. Moreover, by using a common decoder to process both real and generated masks before discrimination, the architecture effectively handles the mismatch between soft and binary mask formats, improving training stability.
Overall, the two-stage segmentation and regularization framework demonstrates strong performance, successfully addressing common challenges in rooftop extraction tasks, such as occlusions, variable building scales, and urban density. Nonetheless, certain limitations persist, such as slight inaccuracies in extremely small or heavily occluded buildings, highlighting avenues for future improvement through more advanced boundary refinement techniques or multimodal data fusion like combining optical imagery with elevation data.
These findings underscore the potential of deep learning and regularization techniques to advance large-scale urban mapping from satellite imagery, paving the way for more accurate, efficient, and automated building inventory generation.
7. Limitations and Future Work
Limitations. While the proposed pipeline delivers accurate, georeferenced rooftop footprints and strong performance across object sizes, several limitations merit consideration. First, the study relies on 0.30 m GSD RGB basemap imagery for a single city (Ben Guerir); sensor/source characteristics and urban morphology may differ elsewhere, affecting generalization. In addition, temporal mismatch within mosaics (construction phases, seasonal shadows) and annotation uncertainty at roof boundaries (parapets, awnings, rooftop equipment) introduce noise that likely compresses the attainable IoU for all models. Second, the refinement stage uses a small set of hand-tuned morphological and topological rules (e.g., minimum area, hole filling, small-component removal). These choices improve GIS quality but may suppress very small appendages and over-smooth intricate boundaries in edge cases. Third, our quantitative analysis emphasizes pixel-level, micro-averaged metrics (Figure 7) alongside COCO instance-level AP/AR (Figure 5 and Figure 6); although complementary, these protocols weigh errors differently and do not yet provide object-level uncertainty for individual footprints. Finally, the study focuses on RGB imagery; challenging conditions such as deep shadow, specular roofing materials, or dense tree occlusion remain difficult, and we did not evaluate multi-sensor fusion.
Extension to other areas. The approach is designed to transfer with minimal changes by decoupling three layers: (i) the segmentation backbone (MaskFormer), (ii) regularization/polygonization, and (iii) cartographic filtering. In practice, extension requires acquiring high-resolution imagery comparable to 0.30 m GSD (or adjusting tile size and thresholds to the local GSD), applying the same preprocessing (reprojection, clipping, 20% overlap tiling), and running the trained backbone to produce masks. Because refinement rules are metric-based, parameters are scaled in meters rather than pixels when GSD differs (e.g., minimum polygon area, simplification tolerance, orthogonality snapping), preserving geometry across sensors. A short pilot calibration on a few representative tiles (dense residential, industrial, peri-urban) is usually sufficient to set thresholds and validate topology; thereafter, city-scale maps can be generated and exported as georeferenced vectors using the same GIS schema. Where roof materials, colors, or illumination conditions depart markedly from Ben Guerir, light fine-tuning on a small seed of annotated tiles (optionally guided by active learning/uncertainty sampling, or complemented by self-training) further improves robustness.
Future work. (i) External validation and transferability: evaluate additional Moroccan cities representing diverse morphologies (industrial platforms, historical cores, peri-urban fringes), quantify domain shift, and explore unsupervised/self-training and domain-adaptation to reduce re-labeling costs. (ii) Richer sensing: integrate NIR/LiDAR or stereo-derived height cues, where available, to increase robustness under shadow and occlusion. (iii) Learned regularization and uncertainty: replace hand-tuned post-processing with learning-based vectorization/skeletonization and report object-level confidence (calibrated scores and/or intervals) for footprint acceptance. (iv) Reproducibility and openness: release derived masks and train/val/test splits (subject to base-imagery licensing) and provide code for preprocessing, training, and refinement to facilitate benchmarking and operational uptake.
8. Conclusions
This study addresses the challenges of rooftop segmentation from satellite imagery by leveraging cutting-edge deep learning architectures and a two-stage processing pipeline. While traditional methods often struggle with complex roof geometries, occlusions, and dense urban settings, advanced instance segmentation models like Mask R-CNN and MaskFormer demonstrate superior performance. Through a comprehensive evaluation using metrics such as precision, recall, F1-score, and mean Intersection over Union (mIoU), MaskFormer emerged as the most effective, providing accurate delineation of rooftop structures across diverse urban landscapes.
Qualitative analysis further confirmed these results, with MaskFormer producing visually cleaner and more precise roof masks than Mask R-CNN, particularly in detecting small and irregular roofs. To enhance these results, a regularization network was introduced to refine the raw segmentation outputs. Based on a modified version of Zorzi’s framework, the refinement stage employed adversarial, reconstruction, and regularization losses to produce masks that are not only geometrically plausible but also visually consistent with real building footprints. A common decoder was used to handle soft versus binary format mismatches during training, resulting in stable and accurate outputs.
The final result of this workflow is a high-resolution rooftop map of Ben Guerir, representing segmented, regularized, and georeferenced roof polygons. This map holds significant value for urban planning, infrastructure management, and renewable energy deployment, offering a scalable and automated solution for urban analysis. The approach also establishes a foundation for replicable mapping across other cities using minimal manual intervention.
In summary, the integration of transformer-based segmentation, regularization refinement, and spatial mapping demonstrates a robust pipeline for accurate and scalable urban imaging. These advancements offer meaningful contributions to geospatial intelligence, smart city planning, and sustainable development.
Future work will expand this pipeline to include rooftop height estimation and 3D visualization of the urban environment. Integrating elevation models with segmented roofs will enable the generation of realistic 3D city models, essential for evaluating solar panel feasibility, understanding building morphology, and enhancing decision-making processes in urban development.
Author Contributions
Conceptualization, H.S.; Data curation, S.F. and A.G.; Funding acquisition, H.L.; Methodology, S.F.; Project administration, H.S. and H.R.; Resources, H.L.; Software, S.F.; Supervision, H.R.; Validation, H.S., H.L. and A.G.; Writing—original draft, S.F.; Writing—review & editing, H.S. and H.R. All authors have read and agreed to the published version of the manuscript.
Funding
This research received no external funding.
Institutional Review Board Statement
Not applicable.
Informed Consent Statement
Note applicable.
Data Availability Statement
The dataset comprises high-resolution satellite imagery (0.30 m) obtained via Google Earth within QGIS for annotation and evaluation, together with manually annotated rooftop masks for Ben Guerir. Due to licensing restrictions on the base imagery, derived masks and train/val/test tiles (without raw imagery) can be shared by the corresponding author upon reasonable request for academic, non-commercial use.
Acknowledgments
The authors would like to thank Green Energy Park (GEP) and Mohammed VI Polytechnic University (UM6P) for their technical support and access to computational resources. We also acknowledge the use of open-source libraries and platforms including Detectron2, Hugging Face Transformers, and Mapbox for visualization. During the preparation of this manuscript, the authors used ChatGPT (OpenAI GPT-4) for language enhancement and formatting assistance. The authors have thoroughly reviewed and edited the output and take full responsibility for the content of this publication.
Conflicts of Interest
The authors declare no conflicts of interest.
References
- Chaweewat, P. Solar photovoltaic rooftop detection using satellite imagery and deep learning. In Proceedings of the Asia-Pacific Power and Energy Engineering Conference, APPEEC, Chiang Mai, Thailand, 6–9 December 2023. [Google Scholar] [CrossRef]
- Liu, G.; Peng, B.; Liu, T.; Zhang, P.; Yuan, M.; Lu, C.; Cao, N.; Zhang, S.; Huang, S.; Wang, T. Fine-Grained Building Roof Instance Segmentation Based on Domain Adapted Pretraining and Composite Dual-Backbone. arXiv 2023, arXiv:2308.05358. [Google Scholar] [CrossRef]
- Batchu, V. Satellite Sunroof: High-res Digital Surface Models and Roof Segmentation for Global Solar Mapping. arXiv 2024, arXiv:2408.14400. [Google Scholar] [CrossRef]
- Sariturk, B.; Kumbasar, D.; Seker, D.Z. Comparative Analysis of Different CNN Models for Building Segmentation from Satellite and UAV Images. Photogramm. Eng. Remote Sens. 2023, 89, 97–105. [Google Scholar] [CrossRef]
- Lin, L.; Liang, X.; Shu, R.; Chen, H.; Tan, Y.; Ma, Y.; Guo, F. A Dynamic Identification Algorithm for Large Urban Rooftop Solar Energy. In Proceedings of the Chinese Control Conference, CCC, Kunming, China, 28–31 July 2024; pp. 6363–6368. [Google Scholar] [CrossRef]
- Gibril, M.B.A.; Al-Ruzouq, R.; Bolcek, J.; Shanableh, A.; Jena, R. Building Extraction from Satellite Images Using Mask R-CNN and Swin Transformer. In Proceedings of the 34th International Conference Radioelektronika, RADIOELEKTRONIKA, Zilina, Slovakia, 17–18 April 2024; pp. 1–5. [Google Scholar] [CrossRef]
- Vaswani, A.; Shazeer, N.; Parmar, N.; Uszkoreit, J.; Jones, L.; Gomez, A.N.; Kaiser, Ł.; Polosukhin, I. Attention Is All You Need. arXiv 2017. Available online: https://arxiv.org/pdf/1706.03762 (accessed on 7 July 2025). [CrossRef] [PubMed]
- Carion, N.; Massa, F.; Synnaeve, G.; Usunier, N.; Kirillov, A.; Zagoruyko, S. End-to-End Object Detection with Transformers. In Computer Vision—ECCV 2020; Lecture Notes in Computer Science (including subseries Lecture Notes in Artificial Intelligence and Lecture Notes in Bioinformatics); Springer: Cham, Switzerland, 2020; Volume 12346, pp. 213–229. [Google Scholar] [CrossRef]
- Chetia, D. Image Segmentation with transformers: An Overview, Challenges and Future. arXiv 2025, arXiv:2501.09372. [Google Scholar]
- He, Z.; Cai, Y.; He, H.; Xian, X.; Barrett, B. An Enhanced Trans-Involution Network for Building Footprint Extraction from High Resolution Orthoimagery. In Proceedings of the International Geoscience and Remote Sensing Symposium (IGARSS), Athens, Greece, 7–12 July 2024; Volume 75, pp. 10030–10034. [Google Scholar] [CrossRef]
- Zhao, W.; Persello, C.; Lv, X.; Stein, A.; Vergauwen, M. Vectorizing planar roof structure from very high resolution remote sensing images using transformers. Int. J. Digit. Earth 2023, 17, 1–15. [Google Scholar] [CrossRef]
- Zhang, Q. Research of Land Surface Segmentation based on Convolutional Netword and Transformer Network. In Proceedings of the 2022 IEEE 2nd International Conference on Mobile Networks and Wireless Communications, ICMNWC 2022, Tumakuru, India, 2–3 December 2022; pp. 1–8. [Google Scholar] [CrossRef]
- Saadaoui, H.; Ghennioui, A.; Ikken, B.; Rhinane, H.; Maanan, M. Using GIS and Photogrammetry for Assessing Solar Photovoltaic Potential on Flat Roofs in Urban Area Case of the City of Ben Guerir/Morocco. ISPRS—Int. Arch. Photogramm. Remote Sens. Spat. Inf. Sci. 2019, 4212, 155–166. [Google Scholar] [CrossRef]
- Rharbi, N.; İNceoğlu, M. Moroccan New Green Cities, Towards a Green Urban Transition. J. Islam. Archit. 2022, 7, 296–305. [Google Scholar] [CrossRef]
- Rharbi, N.; Demirkol, H.G. Impact of Sustainability Transition in Moroccan Cities Identity: The Case of Benguerir. Iconarp Int. J. Archit. Plan. 2023, 11, 88–106. [Google Scholar] [CrossRef]
- Azmi, R.; Tekouabou Koumetio, C.S.; Diop, E.B.; Chenal, J. Exploring the relationship between urban form and land surface temperature (LST) in a semi-arid region case study of Ben Guerir city—Morocco. Environ. Chall. 2021, 5, 100229. [Google Scholar] [CrossRef]
- Rivet, D.; Mlih, A.B. La articulación de la Administración Territorial del Protectorado francés en Marruecos. Rev. Estud. Int. Mediterráneos 2010, 9, 46. [Google Scholar] [CrossRef]
- Pal, N.; Ramkrishna, S.; Patil, H.; Choudhary, N.; Soman, R. TerraGrid: Harnessing Deep Learning Models for Satellite Image Segmentation. Int. J. Comput. Appl. 2024, 186, 14–21. [Google Scholar] [CrossRef]
- Yuan, Y.; Lin, L.; Xin, Q.; Zhou, Z.G.; Liu, Q. An Empirical Study on Data Augmentation for Pixel-Wise Satellite Image Time Series Classification and Cross-Year Adaptation. IEEE J. Sel. Top. Appl. Earth Obs. Remote Sens. 2025, 18, 5172–5188. [Google Scholar] [CrossRef]
- Ghaffar, M.A.A.; McKinstry, A.; Maul, T.; Vu, T.T. Data Augmentation Approaches for Satellite Image Super-Resolution. ISPRS Ann. Photogramm. Remote Sens. Spat. Inf. Sci. 2019, 4, 47–54. [Google Scholar] [CrossRef]
- Soujanya, T.; Alsalami, Z.; Srinath, S.; Sengupta, J.; Das, A. Rooftop Photovoltaic Panel Segmentation using Improved Mask Region-based Convolutional Neural Network. In Proceedings of the 2nd IEEE International Conference on Data Science and Information System, ICDSIS 2024, Hassan, India, 17–18 May 2024. [Google Scholar] [CrossRef]
- Kolibarov, N.; Wästberg, D.; Naserentin, V.; Petrova-Antonova, D.; Ilieva, S.; Logg, A. Roof Segmentation Towards Digital Twin Generation in LoD2+ Using Deep Learning. IFAC-PapersOnLine 2022, 55, 173–178. [Google Scholar] [CrossRef]
- Amo-Boateng, M.; Sey, N.E.N.; Amproche, A.A.; Domfeh, M.K. Instance segmentation scheme for roofs in rural areas based on Mask R-CNN. Egypt. J. Remote Sens. Space Sci. 2022, 25, 569–577. [Google Scholar] [CrossRef]
- Chen, D.; Zhang, L.; Li, J.; Liu, R. Urban building roof segmentation from airborne lidar point clouds. J. Remote Sens. 2012, 33, 6497–6515. [Google Scholar] [CrossRef]
- Zhao, C.; Guo, H.; Lu, J.; Yu, D.; Zhou, X.; Lin, Y. A new approach for roof segmentation from airborne LiDAR point clouds. Remote Sens. Lett. 2021, 12, 377–386. [Google Scholar] [CrossRef]
- Shi, R.; Ngan, K.N.; Li, S. Jaccard index compensation for object segmentation evaluation. In Proceedings of the 2014 IEEE International Conference on Image Processing, ICIP 2014, Paris, France, 27–30 October 2014; pp. 4457–4461. [Google Scholar] [CrossRef]
- Müller, D.; Soto-Rey, I.; Kramer, F. Towards a guideline for evaluation metrics in medical image segmentation. BMC Res. Notes 2022, 15, 210. [Google Scholar] [CrossRef]
- Giraldo, O. Precision, Recall and F1 Score. November 2018. Available online: https://data.niaid.nih.gov/resources?id=zenodo_1753519 (accessed on 6 July 2025).
- Maggiori, E.; Tarabalka, Y.; Charpiat, G.; Alliez, P. Polygonization of remote sensing classification maps by mesh approximation. In Proceedings of the 2017 IEEE International Conference on Image Processing (ICIP), Beijing, China, 17–20 September 2017; pp. 560–564. [Google Scholar] [CrossRef]
- Girard, N.; Smirnov, D.; Solomon, J.; Tarabalka, Y. Polygonal Building Segmentation by Frame Field Learning. arXiv 2020, arXiv:2004.14875. Available online: https://arxiv.org/pdf/2004.14875 (accessed on 8 July 2025).
- Pettinati, M.R. (PDF) The Role of Digital Generalization in Image Segmentation. Available online: https://www.researchgate.net/publication/220913321_The_Role_of_Digital_Generalization_in_Image_Segmentation (accessed on 8 July 2025).
- Zorzi, S.; Fraundorfer, F. Regularization of Building Boundaries in Satellite Images using Adversarial and Regularized Losses. In Proceedings of the 2019 IEEE International Geoscience and Remote Sensing Symposium, Yokohama, Japan, 28 July–2 August 2019; pp. 5140–5143. [Google Scholar] [CrossRef]
- Castello, R.; Roquette, S.; Esguerra, M.; Guerra, A.; Scartezzini, J.L. Deep learning in the built environment: Automatic detection of rooftop solar panels using Convolutional Neural Networks. J. Phys. Conf. Ser. 2019, 1343, 012034. [Google Scholar] [CrossRef]
- Qian, Z.; Chen, M.; Sun, Z.; Zhang, F.; Xu, Q.; Guo, J.; Xie, Z.; Zhang, Z. Simultaneous extraction of spatial and attributional building information across large-scale urban landscapes from high-resolution satellite imagery. Sustain. Cities Soc. 2024, 106, 105393. [Google Scholar] [CrossRef]


Disclaimer/Publisher’s Note: The statements, opinions and data contained in all publications are solely those of the individual author(s) and contributor(s) and not of MDPI and/or the editor(s). MDPI and/or the editor(s) disclaim responsibility for any injury to people or property resulting from any ideas, methods, instructions or products referred to in the content. |
© 2025 by the authors. Licensee MDPI, Basel, Switzerland. This article is an open access article distributed under the terms and conditions of the Creative Commons Attribution (CC BY) license (https://creativecommons.org/licenses/by/4.0/).