Article

Design, Simulation, Construction and Experimental Validation of a Dual-Frequency Wireless Power Transfer System Based on Resonant Magnetic Coupling

Department of Electrotechnics and Measurements, Faculty of Electrical Engineering, Technical University of Cluj-Napoca, 26-28 G. Baritiu Street, 400027 Cluj-Napoca, Romania
*
Authors to whom correspondence should be addressed.
Technologies 2025, 13(10), 442; https://doi.org/10.3390/technologies13100442
Submission received: 24 July 2025 / Revised: 15 September 2025 / Accepted: 25 September 2025 / Published: 1 October 2025

Abstract

Wireless power transfer (WPT) has emerged as a compelling solution for delivering electrical energy without physical connectors, particularly in applications requiring reliability, mobility, or encapsulation. This work presents the modeling, simulation, construction, and experimental validation of an optimized dual-frequency WPT system using magnetically coupled resonant coils. Unlike conventional single-frequency systems, the proposed architecture introduces two independently controlled excitation frequencies applied to distinct transistors, enabling improved resonance behavior and enhanced power delivery across a range of coupling conditions. The design process integrates numerical circuit simulations in PSpice and three-dimensional electromagnetic analysis in ANSYS Maxwell 3D, allowing accurate evaluation of coupling coefficient variation, mutual inductance, and magnetic flux distribution as functions of coil geometry and alignment. A sixth-degree polynomial model was derived to characterize the coupling coefficient as a function of coil separation, supporting predictive tuning. Experimental measurements were carried out using a physical prototype driven by both sinusoidal and rectangular control signals under varying load conditions. Results confirm the simulation findings, showing that specific signal periods (e.g., 8 µs, 18 µs, 20 µs, 22 µs) yield optimal induced voltage values, with strong sensitivity to the coupling coefficient. Moreover, the presence of a real load influenced system performance, underscoring the need for adaptive control strategies. The proposed approach demonstrates that dual-frequency excitation can significantly enhance system robustness and efficiency, paving the way for future implementations of self-adaptive WPT systems in embedded, mobile, or biomedical environments.

1. Introduction

The increasing demand for flexible, safe, and efficient power delivery systems in both consumer and industrial applications has accelerated the development of wireless power transfer (WPT) technologies. Compared with conventional wired systems, WPT offers several advantages, including improved reliability, elimination of connector wear and corrosion, and enhanced user convenience. These benefits have generated widespread interest in applications ranging from mobile device charging to biomedical implants, electric vehicles, and industrial automation.
Among the various WPT architectures, systems based on magnetically coupled resonant coils have received particular attention for their ability to achieve mid-range energy transfer with relatively high efficiency. Their operation relies on resonant inductive coupling, where both the transmitter and receiver coils are tuned to a common or harmonically related resonance frequency. By exploiting resonance effects, these systems can transfer significant amounts of energy while minimizing losses.
However, their performance is strongly influenced by several parameters, including coil alignment, separation distance, the coupling coefficient, load impedance, and the characteristics of the control signals. Even small variations in coil geometry or operating conditions can result in detuning, reduced efficiency, and unstable power delivery. These challenges highlight the importance of developing advanced design methods and control strategies that can ensure stable operation under realistic, variable conditions.
A critical limitation of many existing WPT systems is their dependency on a single operating frequency, which can lead to suboptimal performance under dynamic or mismatched conditions. In real-world scenarios, such as wearable electronics or moving robotic platforms, variations in the spatial configuration between transmitter and receiver coils can cause detuning and significant efficiency loss. To address these limitations, recent research has explored adaptive control methods, impedance-matching networks, and multi-frequency excitation schemes. Reviews have further highlighted advances in WPT technologies and control strategies [1], providing additional context for the proposed dual-frequency approach.
This study investigates a novel approach for enhancing the performance of WPT systems by employing dual-frequency control signals applied to a pair of magnetically coupled resonant coils. The proposed architecture aims to improve system flexibility and voltage induction across the receiver by exploiting frequency diversity. By alternating or superimposing two control signals at different frequencies, the system can dynamically compensate for non-idealities such as coil misalignment or suboptimal coupling.
The research presented in this paper encompasses both numerical simulation and experimental validation of the dual-frequency WPT system. A detailed parametric analysis is carried out to study the influence of the coupling coefficient, waveform type, and frequency variation on the voltage induced in the receiver coil. The simulations are performed using both equivalent electrical circuits and three-dimensional finite element modeling in ANSYS Maxwell 3D version 2023R2, enabling accurate representation of the electromagnetic behavior. The simulation results are subsequently validated through laboratory experiments on a physical prototype, confirming the feasibility and performance advantages of the proposed design.
The main contributions of this paper are as follows:
  • development and simulation of a WPT system using two control frequencies to improve power transfer under varying coupling conditions;
  • derivation of a sixth-degree polynomial to model the coupling coefficient as a function of coil distance, enabling predictive tuning;
  • experimental construction and validation of the proposed system, demonstrating consistent agreement with simulation results;
  • identification of optimal control signal periods that maximize the induced voltage for a given range of coupling coefficients.
This work contributes to the ongoing efforts to create more robust, adaptive, and efficient wireless power systems and lays the foundation for future research into intelligent control and real-time tuning mechanisms in WPT architecture.
Fundamental research has demonstrated wireless power transfer through strongly coupled magnetic resonances [2], and recent studies have extended the field to electromagnetic power capture through hollow cylinders [3] and to methods for compensating radiation losses for medium-range transfer [4]. In addition, the role of reactive energy in the radiation of dipole antennas [5] highlights the importance of subtle electromagnetic effects in WPT design. In this context, the novelty and contributions of this study are distinguished by several aspects:
  • the use of dual-frequency control applied independently on two transistors, which allows the dynamic adaptation of the system to variations in coupling factors and different load conditions;
  • the derivation of a sixth-degree polynomial model that describes the variation in the coupling coefficient as a function of the distance between the coils, providing a predictive tool for parameter tuning;
  • the experimental validation of the constructed prototype, which confirms the numerical results as well as the advantages of the proposed method. Unlike existing studies, which are mainly based on a single frequency or passive compensation methods, the proposed approach demonstrates greater robustness and flexibility in wireless energy transfer.
In addition to applications in consumer electronics and electric vehicles, wireless power transfer has recently been extended to aerial platforms. For instance, several studies have investigated in-flight wireless charging of drones, either by estimating the mutual inductance in dynamic conditions [6] or by expanding the constant power range of self-oscillating systems [7]. These works emphasize the broad applicability of WPT systems in innovative energy delivery and charging solutions.
In contrast to existing approaches such as Wu et al. [8], who introduced dual-frequency routing on a 2D surface with efficiency up to 93.3%, Narayanamoorthi [9], who developed dual-frequency Class E converters with rigorous mathematical modeling, Song et al. [10], who proposed a dual-band RF WPT system with a shared-aperture antenna, Tang [11], who presented a simple dual-frequency modulation strategy without detailed experimental validation, and Zhang et al. [12], who applied pseudo-Hermitian theory to achieve frequency stability and constant power without receiver feedback, this work introduces an actively controlled dual-frequency excitation applied independently to two transistors.
This enables dynamic adaptation to variations in coupling factor and load conditions, a capability not previously demonstrated. Additionally, a sixth-degree polynomial model is derived to predict the coupling coefficient as a function of coil separation, enabling predictive tuning—an analytical tool rarely addressed in prior studies.
Comprehensive experimental validation using both sinusoidal and rectangular driving signals under varied load conditions further distinguishes this work. Notably, we identify specific optimal signal periods (e.g., 8 µs, 18 µs, 20 µs, 22 µs) that maximize induced voltage in practical scenarios.

2. Materials and Methods

This section describes the simulation environments, modeling approaches, and experimental setup used to design, optimize, construct, and validate the wireless power transfer (WPT) system under study.

2.1. Numerical Modeling and Circuit Simulations

The initial design of the WPT system was developed using equivalent circuit models implemented in PSpice. Three different operating scenarios were considered:
  • dual-frequency excitation applied to both control transistors;
  • single-frequency excitation applied to the upper transistor (M3) only;
  • single-frequency excitation applied to the lower transistor (M4) only.
Parametric simulations were carried out to evaluate the influence of the coupling coefficient (k), control signal waveform, and excitation frequency on the induced voltage in the receiver coil. The equivalent circuit incorporated realistic values of inductance, resistance, and capacitance, based on manufacturer specifications for the coils used.

2.2. Electromagnetic Field Simulation

To further refine the system design, three-dimensional finite element analysis (FEA) was carried out in ANSYS Maxwell 3D. This enabled accurate evaluation of the magnetic field distribution, mutual and self-inductance, and power transfer efficiency under varying spatial configurations.
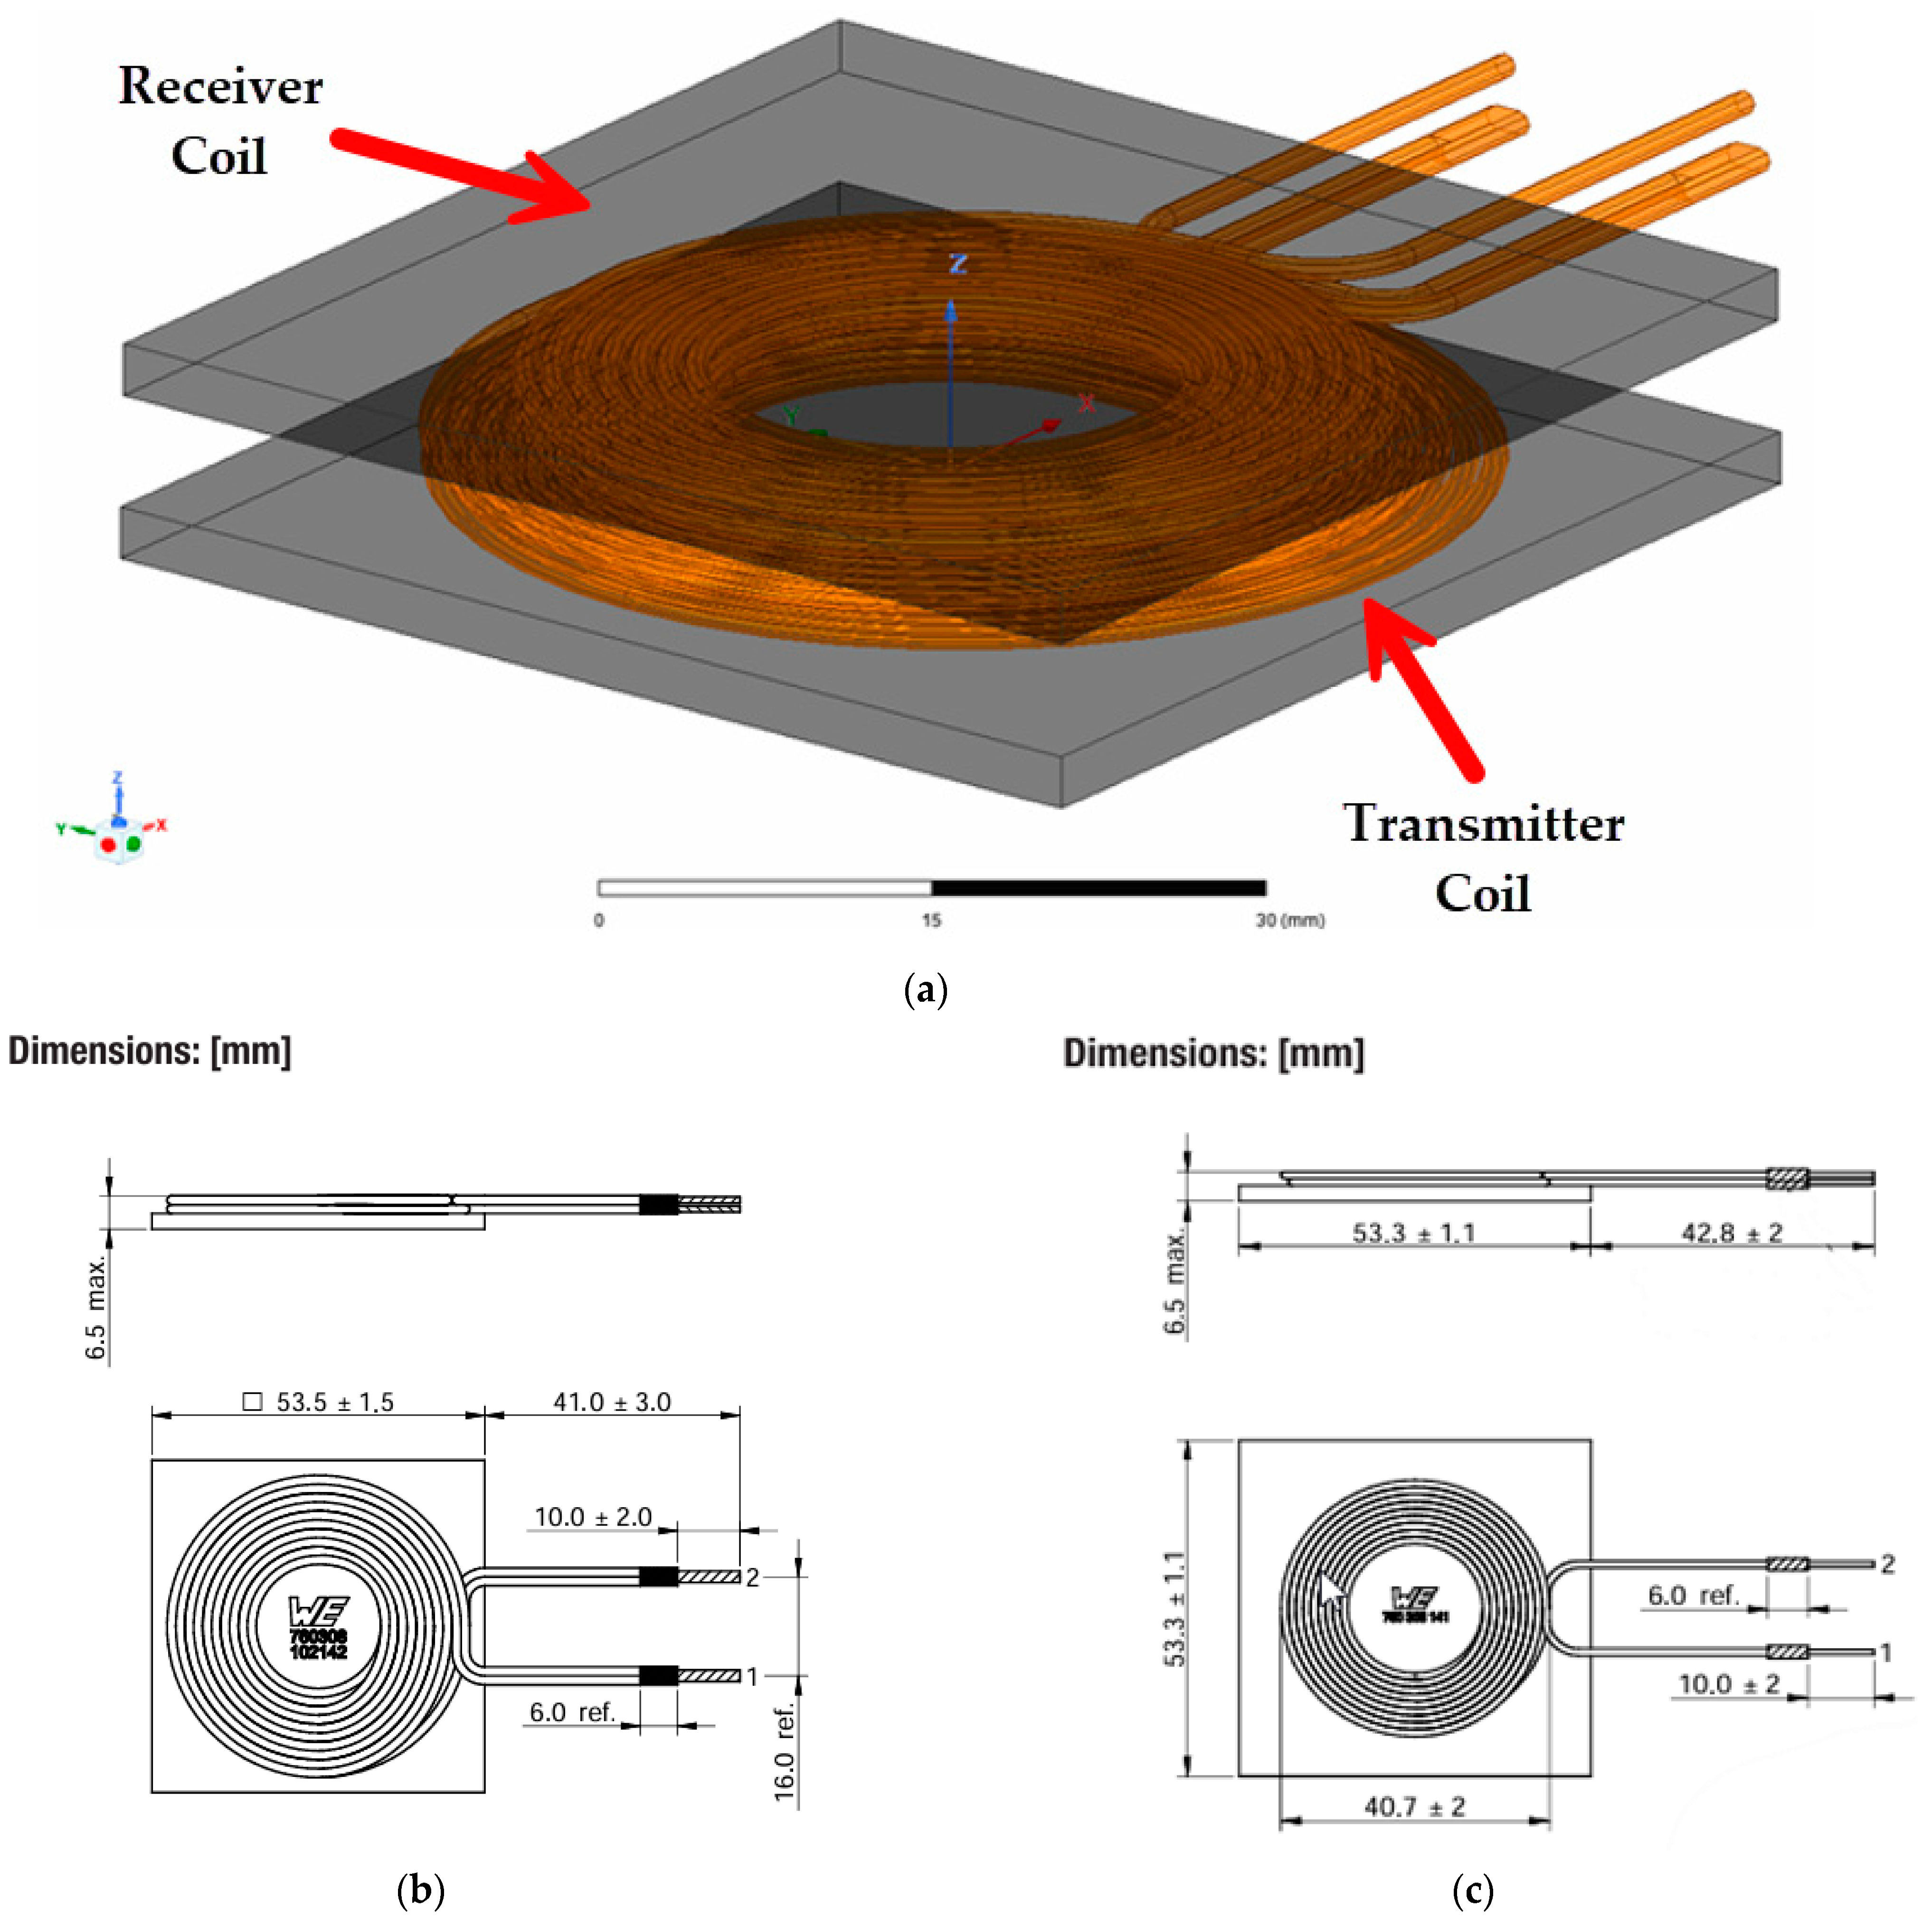
The physical models of the transmitter and receiver coils were constructed using the manufacturer’s geometric and material specifications (WE 760308102142 and WE 760308141). Simulations were performed for coil separations ranging from 0 mm to 20 mm, in 1 mm increments, to determine the variation in the coupling coefficient. The results were then used to derive a sixth-degree polynomial expressing k as a function of distance.

2.3. Construction of the WPT Prototype

Based on the simulation results, a physical prototype of the WPT system was constructed. The transmitter circuit consisted of two IRLR3410 MOSFETs, three 500 µH coils, two 100 µH coils, two 15 nF capacitors, two 1.3 Ω resistors, one 100 ηF capacitor and one 68 nF capacitor. The receiver circuit employed the same coil model as used in the simulations.
The system was powered by a variable DC power supply (0–30 V), while the control signals were generated using two function generators. Both sinusoidal and rectangular waveforms were tested. The induced voltage at the receiver was measured with a digital voltmeter. Measurements were repeated under no-load conditions and with a fan connected as the load, in order to evaluate performance under practical operating conditions.

2.4. Data Availability

All simulation files (OrCAD PSpice and ANSYS Maxwell), circuit schematics, and raw measurement data are available from the corresponding author upon request. The data are not currently deposited in a public repository due to size constraints but can be freely shared for academic and research purposes.

3. Results

This section may be organized into subheadings. It should present a concise and precise description of the experimental results, their interpretation, and the conclusions that can be drawn from them.

3.1. Numerical Modeling of the Electric Circuit

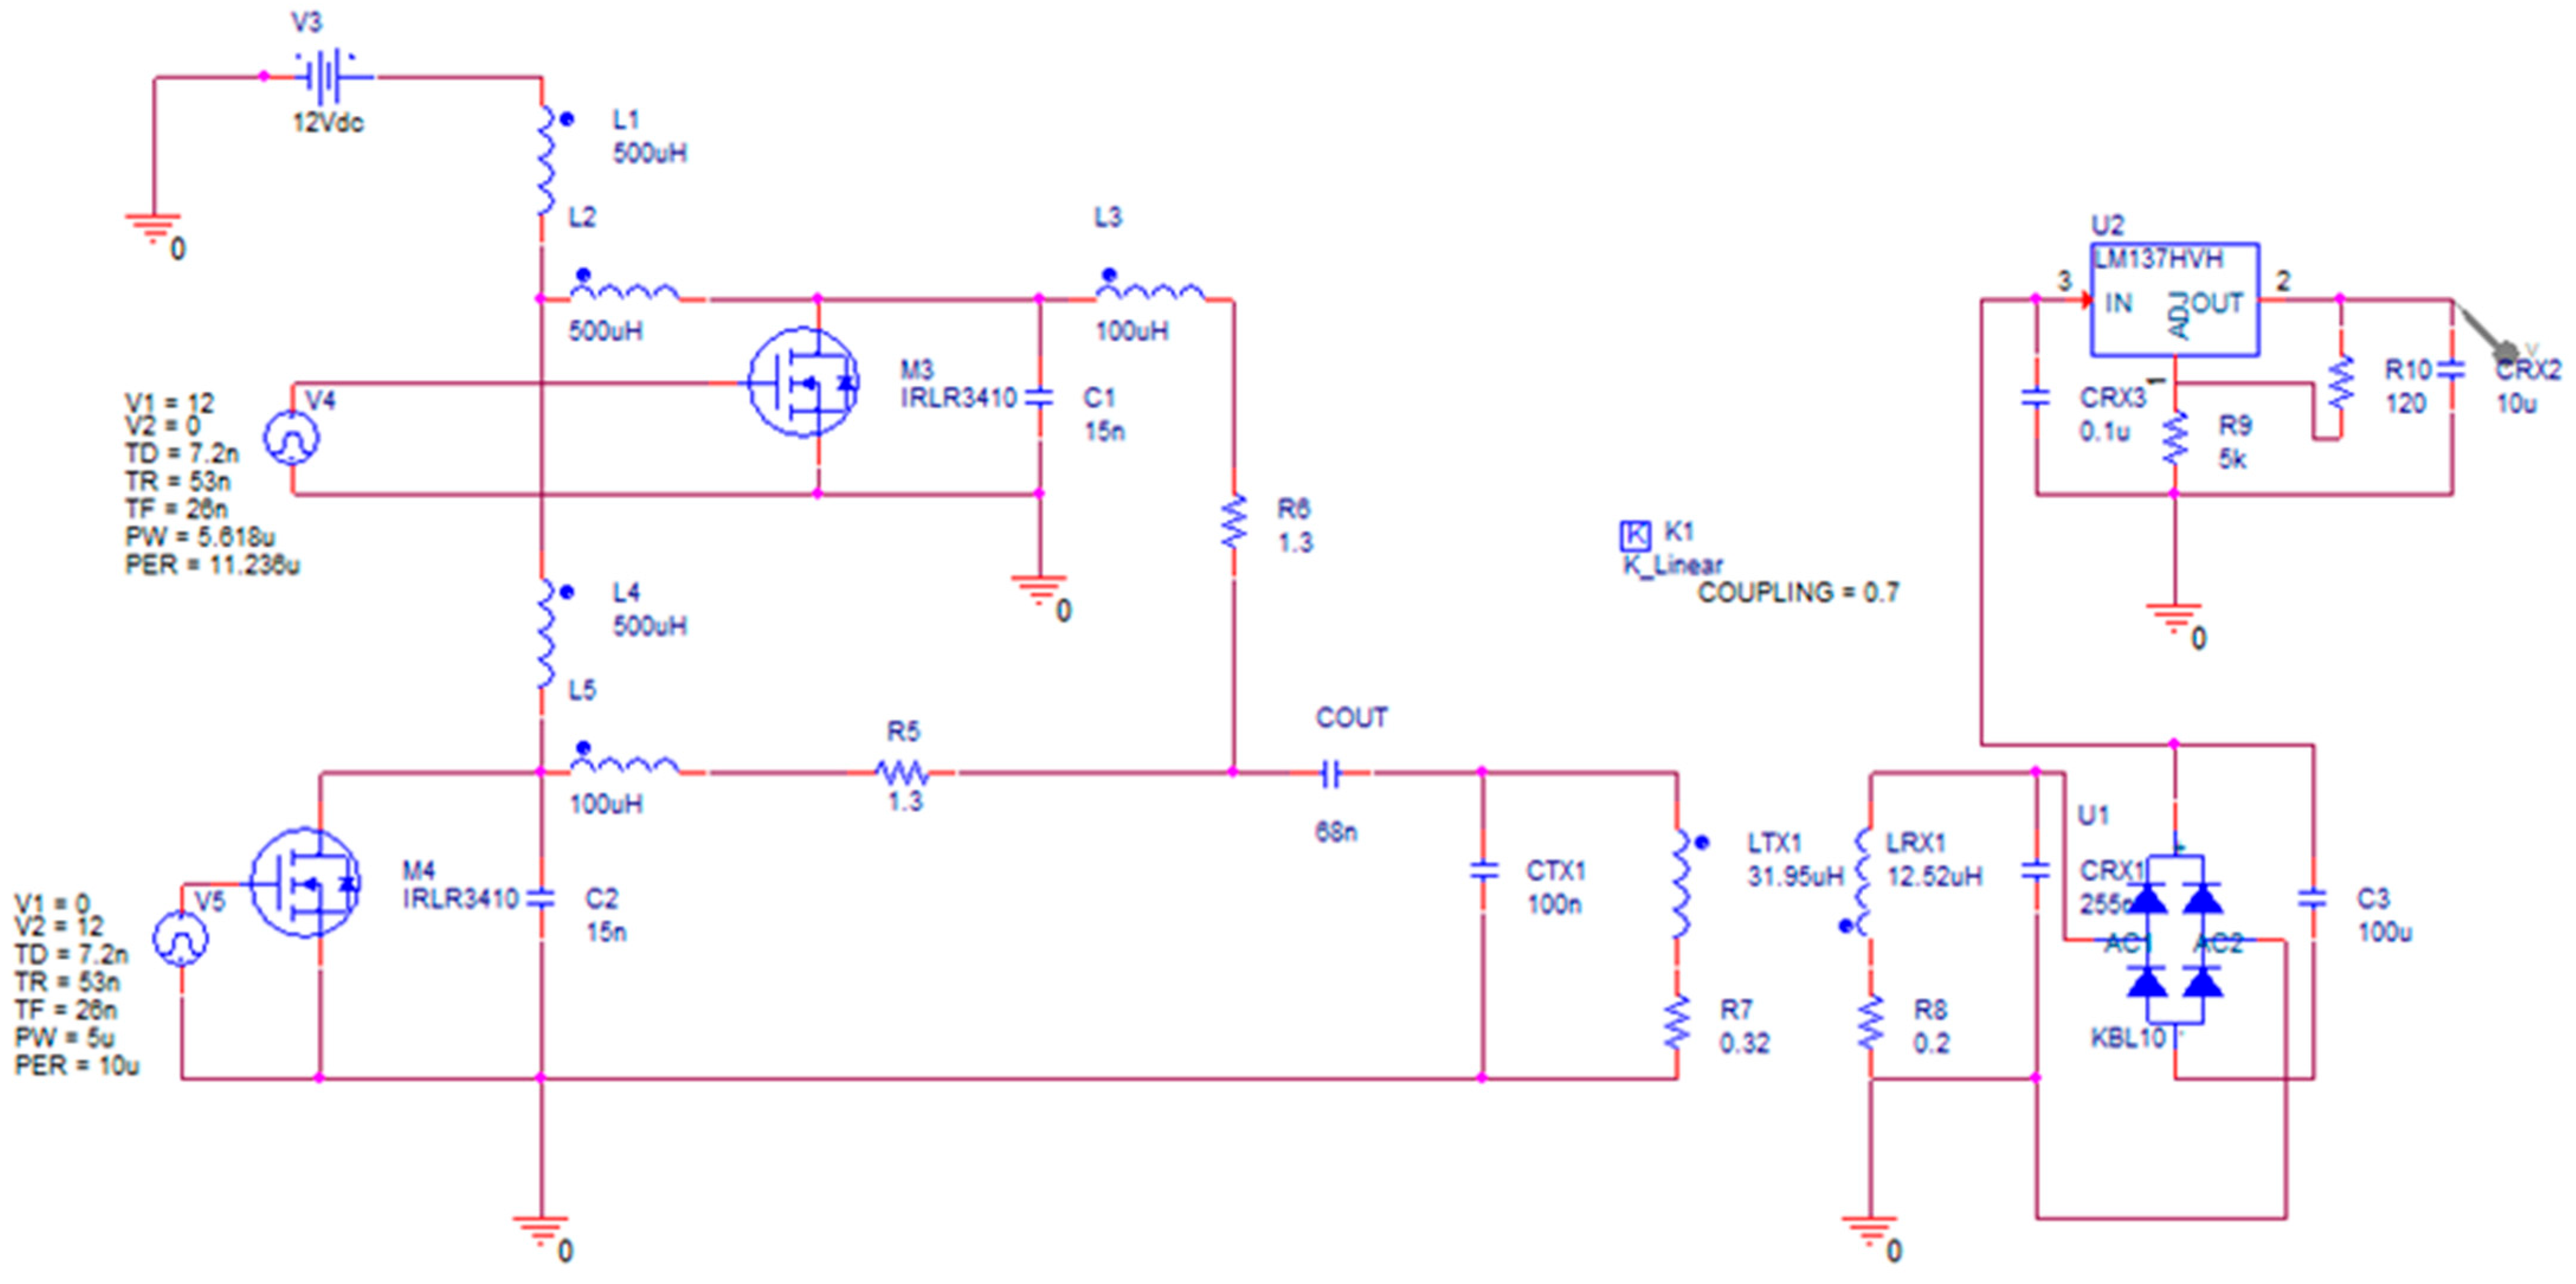
Figure 1 illustrates the structure of the wireless power transfer (WPT) system, which employs two control frequencies and incorporates a pair of magnetically coupled resonant coils. A detailed study was carried out to optimize both the efficiency and the transferred power of the system, with the coils serving as its key functional components.
To achieve this, parametric studies were conducted to evaluate the influence of the coupling coefficient, the control signal waveform, and the control signal frequency on the voltage induced in the receiver coil.
Three operating modes were considered for the proposed wireless power transfer system:
(a)
operation with two control frequencies;
(b)
operation with a single control frequency applied to the upper transistor (M3);
(c)
operation with a single control frequency applied to the lower transistor (M4).
The WPT circuit used to determine the optimal parameters is shown in Figure 2. A rectifier bridge and a voltage regulator were included in the receiver to supply a filtered DC voltage at the output terminals.
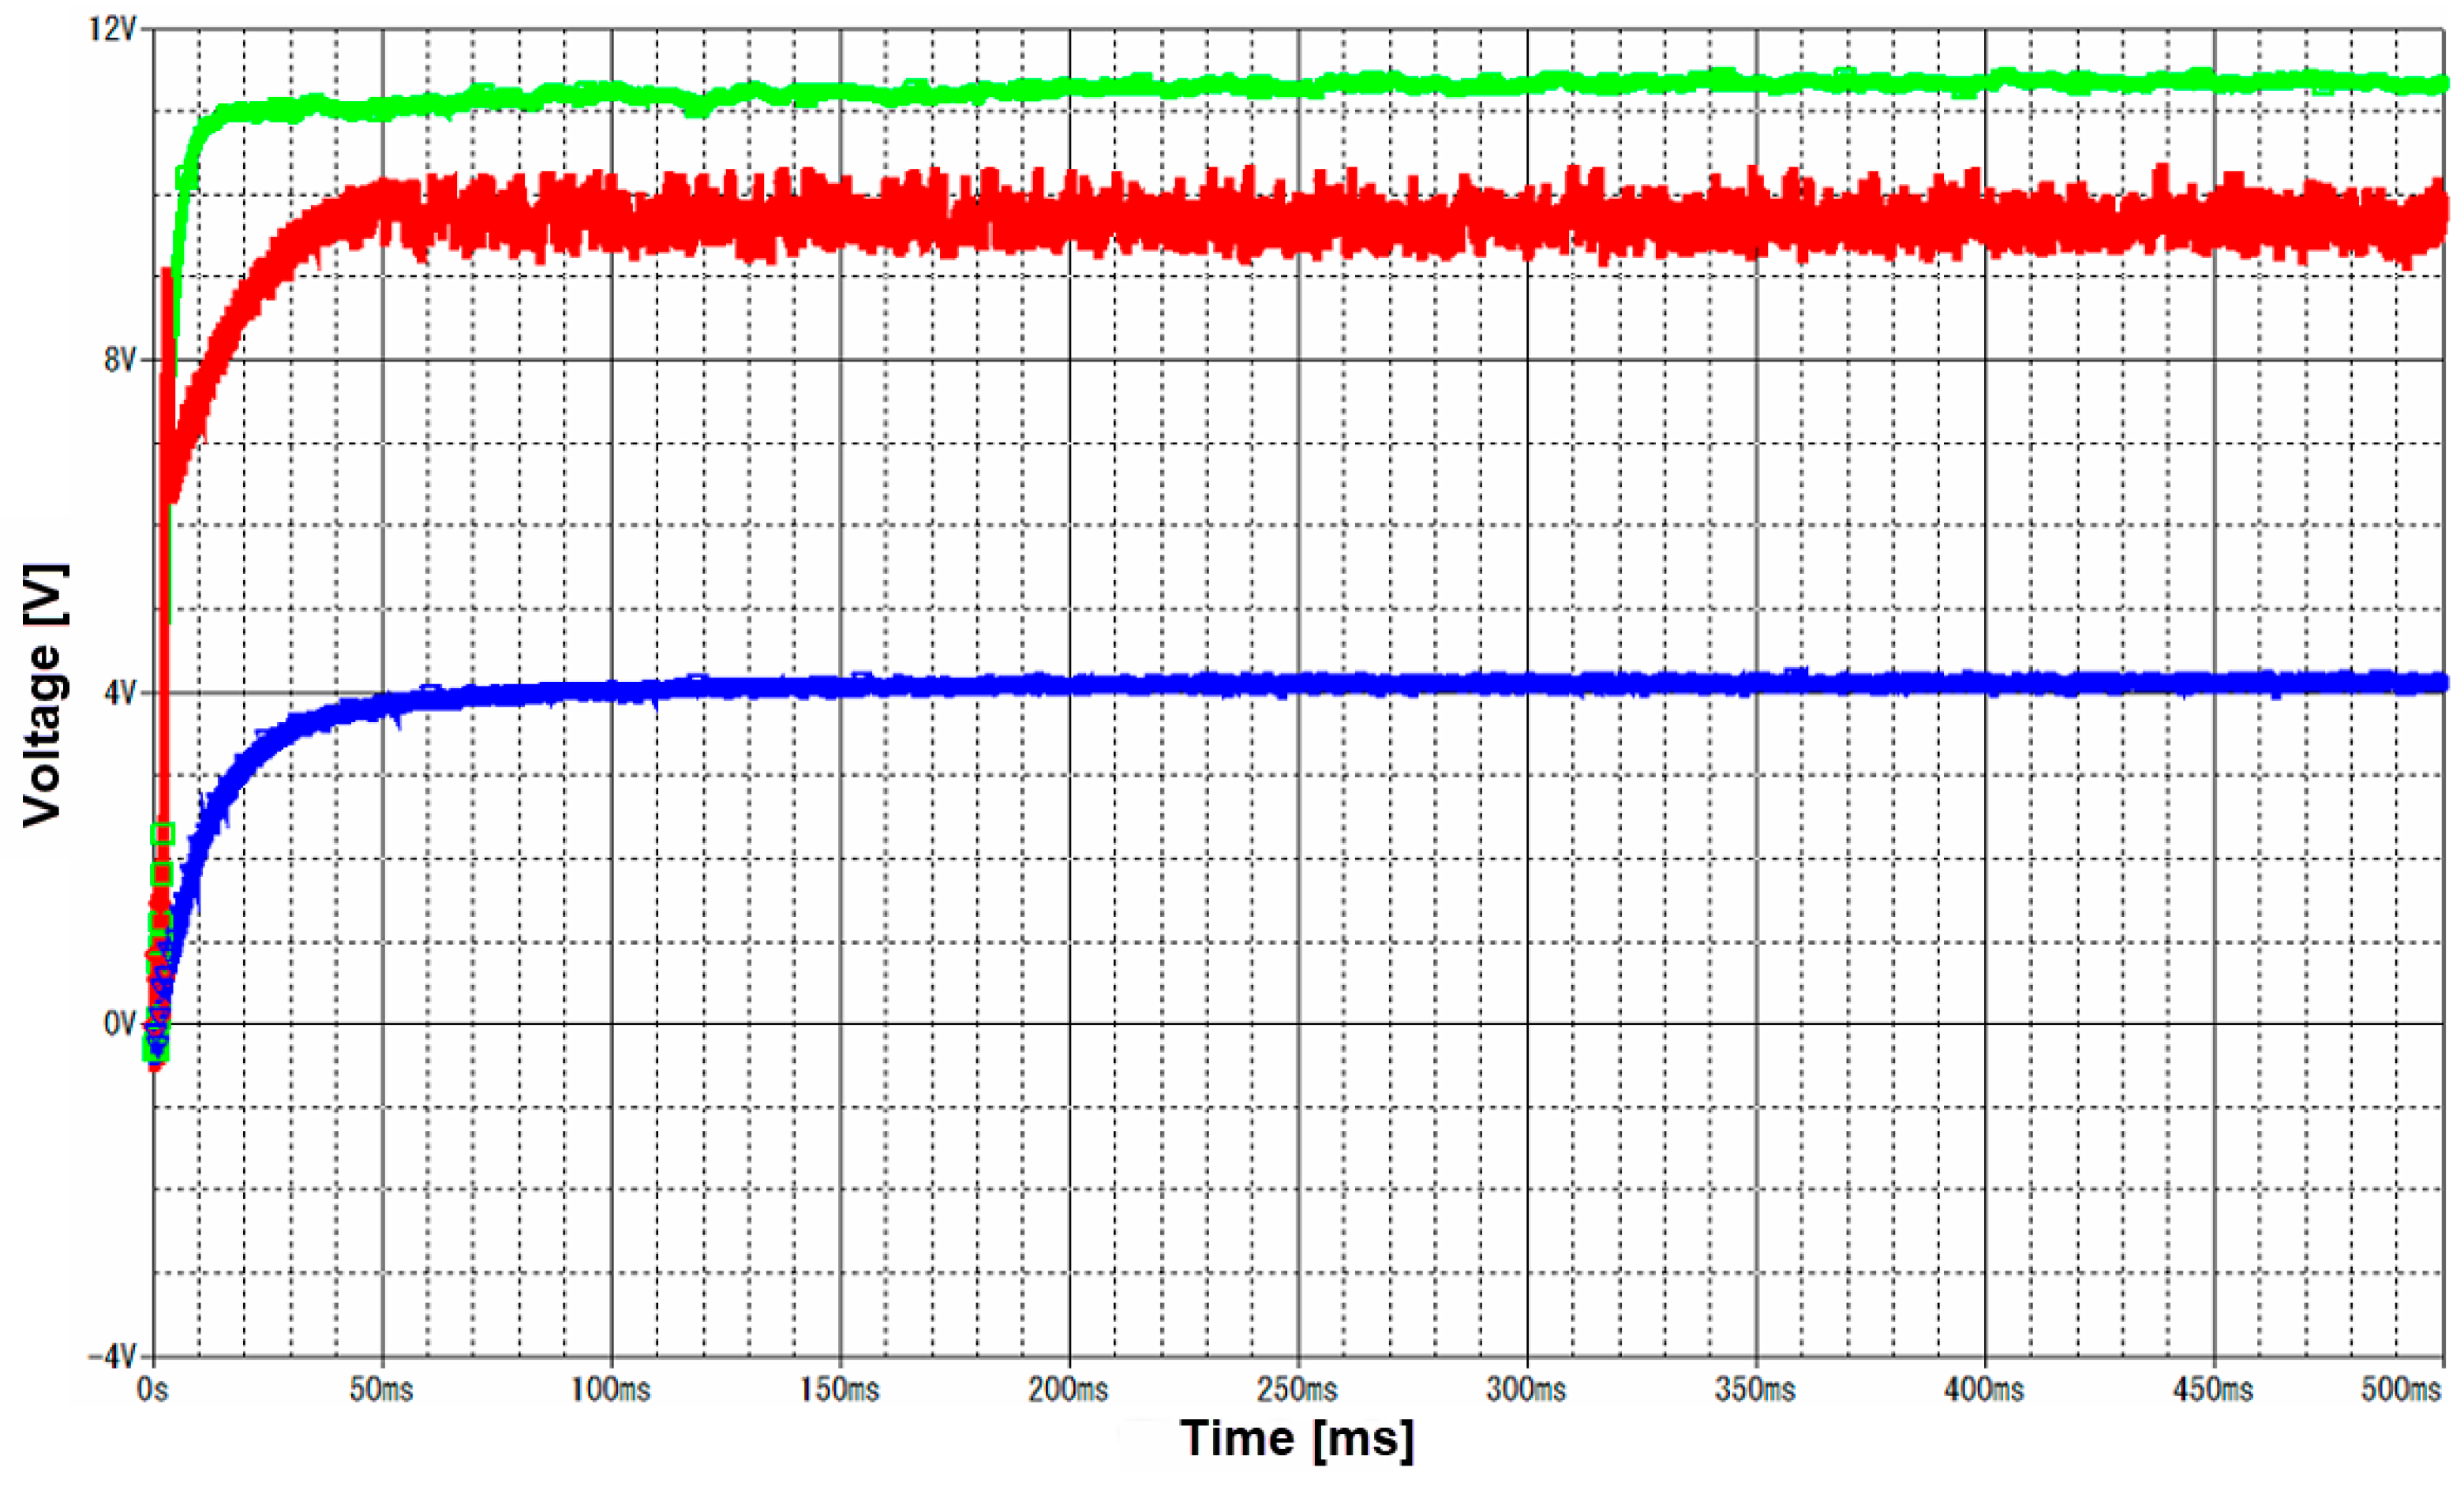
Analysis of the simulation results shows that when two control frequencies are applied, the output voltage at the rectifier terminals reaches 11 V (green curve). When the control signal is applied only to transistor M3, with M4 left uncontrolled, the voltage decreases to 9.5 V (red curve). Conversely, when the control signal is applied only to transistor M4, with M3 left uncontrolled, the voltage further drops to 4 V (blue curve), as illustrated in Figure 3.

Analysis of the Optimized Wireless Power Transfer System Using Real Coil Parameters

For the optimized circuit, simulations were repeated by varying the frequency of the second control signal for coupling coefficient values ranging from 0.1 to 1.0, in increments of 0.1 [13,14,15]. In this case, the real construction parameters of both the transmitter and receiver coils were used.
The characteristics of the transmitter and receiver coils (manufacturer-provided values) are summarized in Table 1, while the updated circuit employed for the subsequent studies is illustrated in Figure 4.
To determine the frequency of the circuit, the following formula was used:
ω r = 1 L C L C R L 2 L C R C 2    
where ω r = angular resonance frequency [rad/s] (ωr = 2πfr);
  • fr = resonance frequency [Hz];
  • L = inductance of the coil [H]; (LTX1, LRX1)
  • C = capacitance of the capacitor [F]; (CTX1, CRX1)
  • RL = resistance of the coil [Ω]; (R7, R8)
  • RC = resistance of the capacitor [Ω];
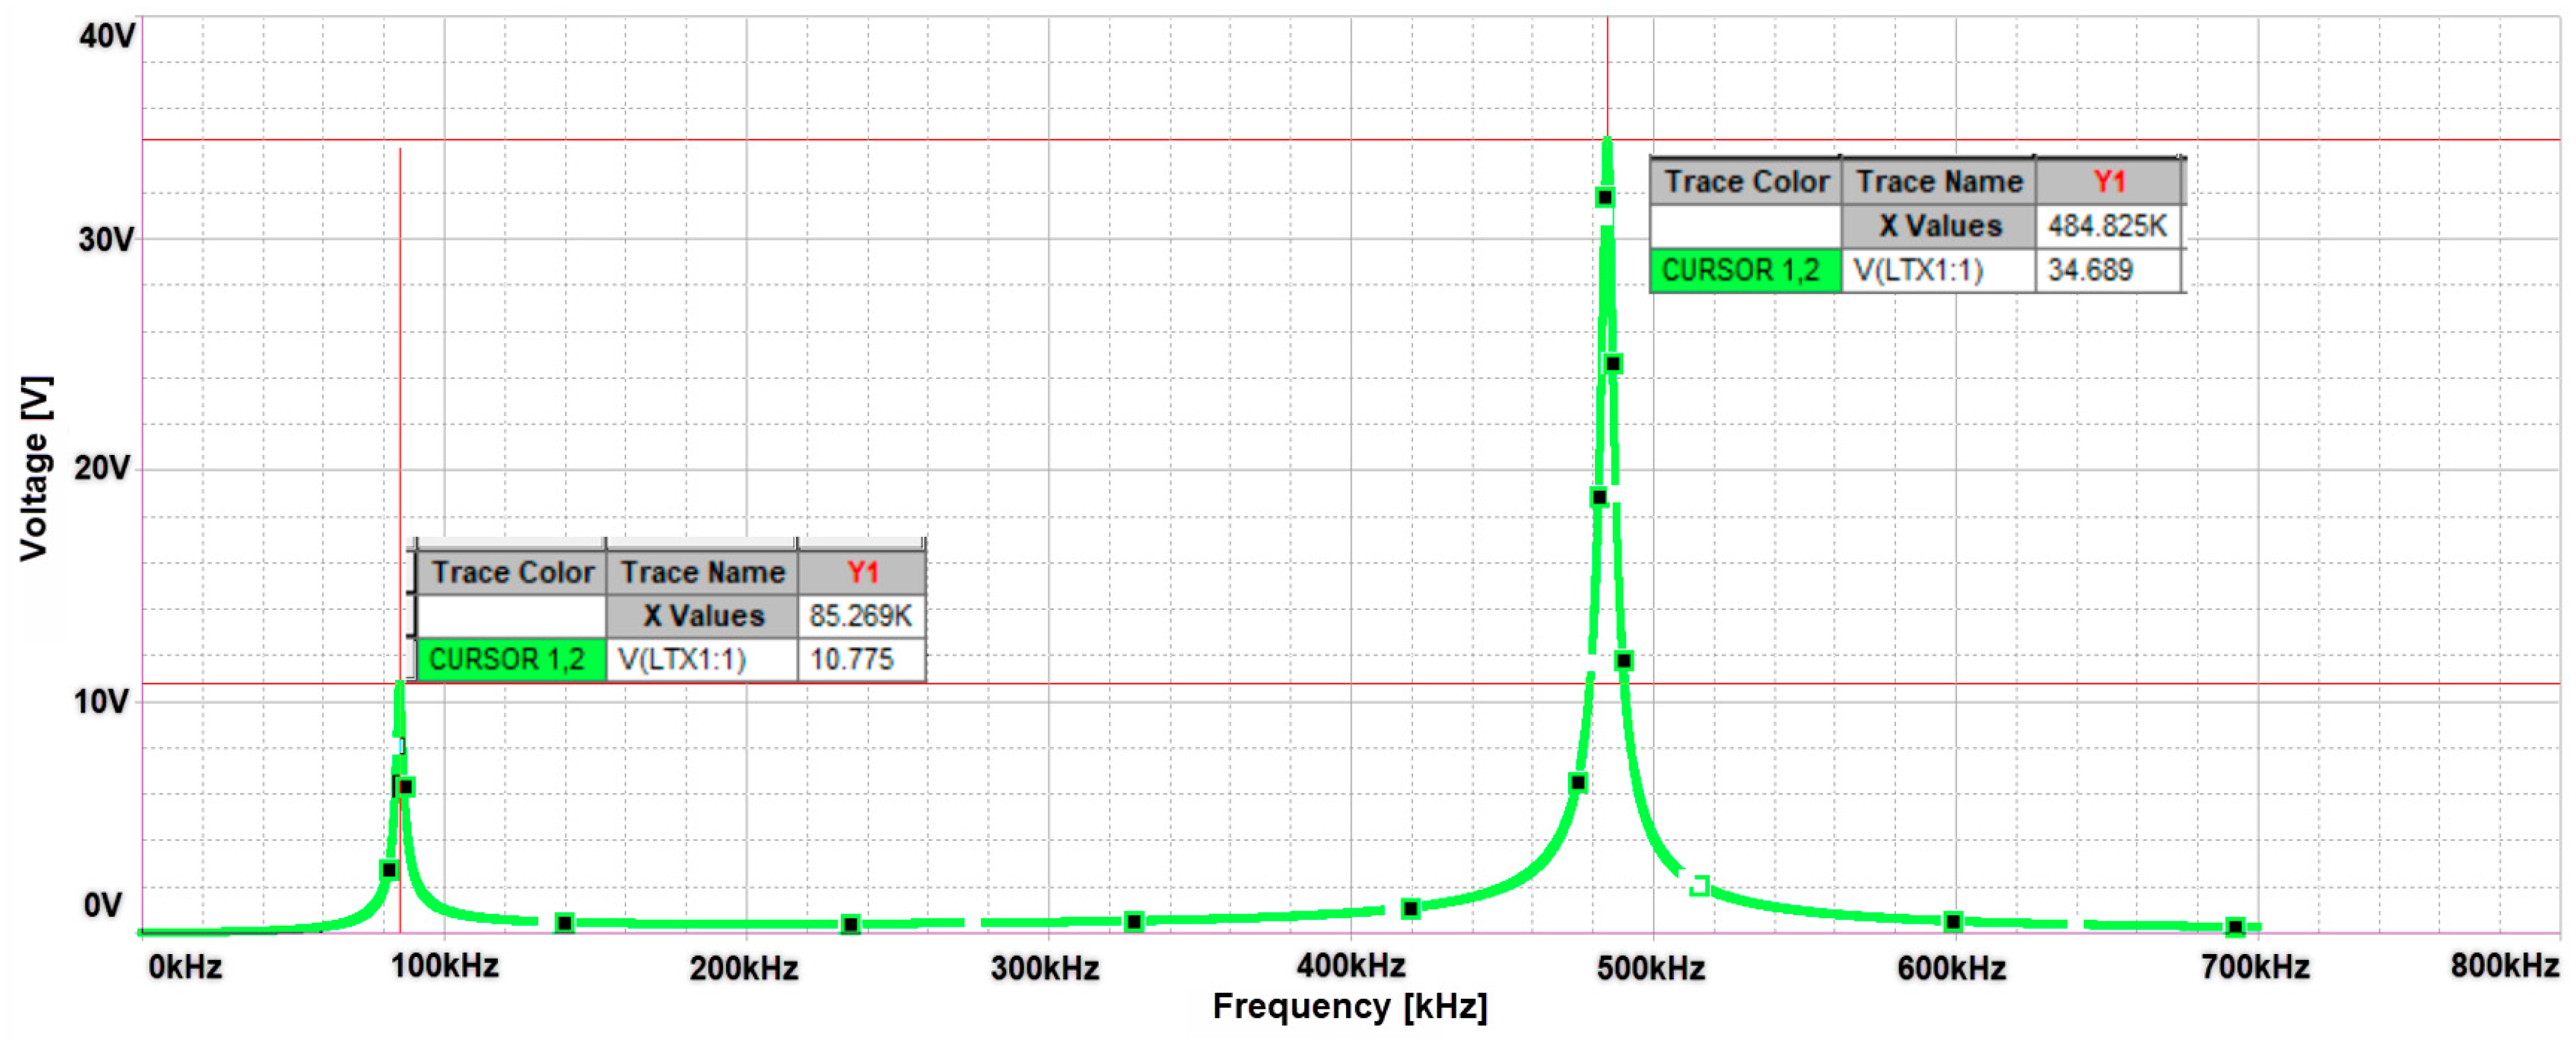
Analysis of the frequency response of the proposed circuit reveals two distinct resonance peaks: one at 85.269 kHz and another at 484.852 kHz, as illustrated in Figure 5.
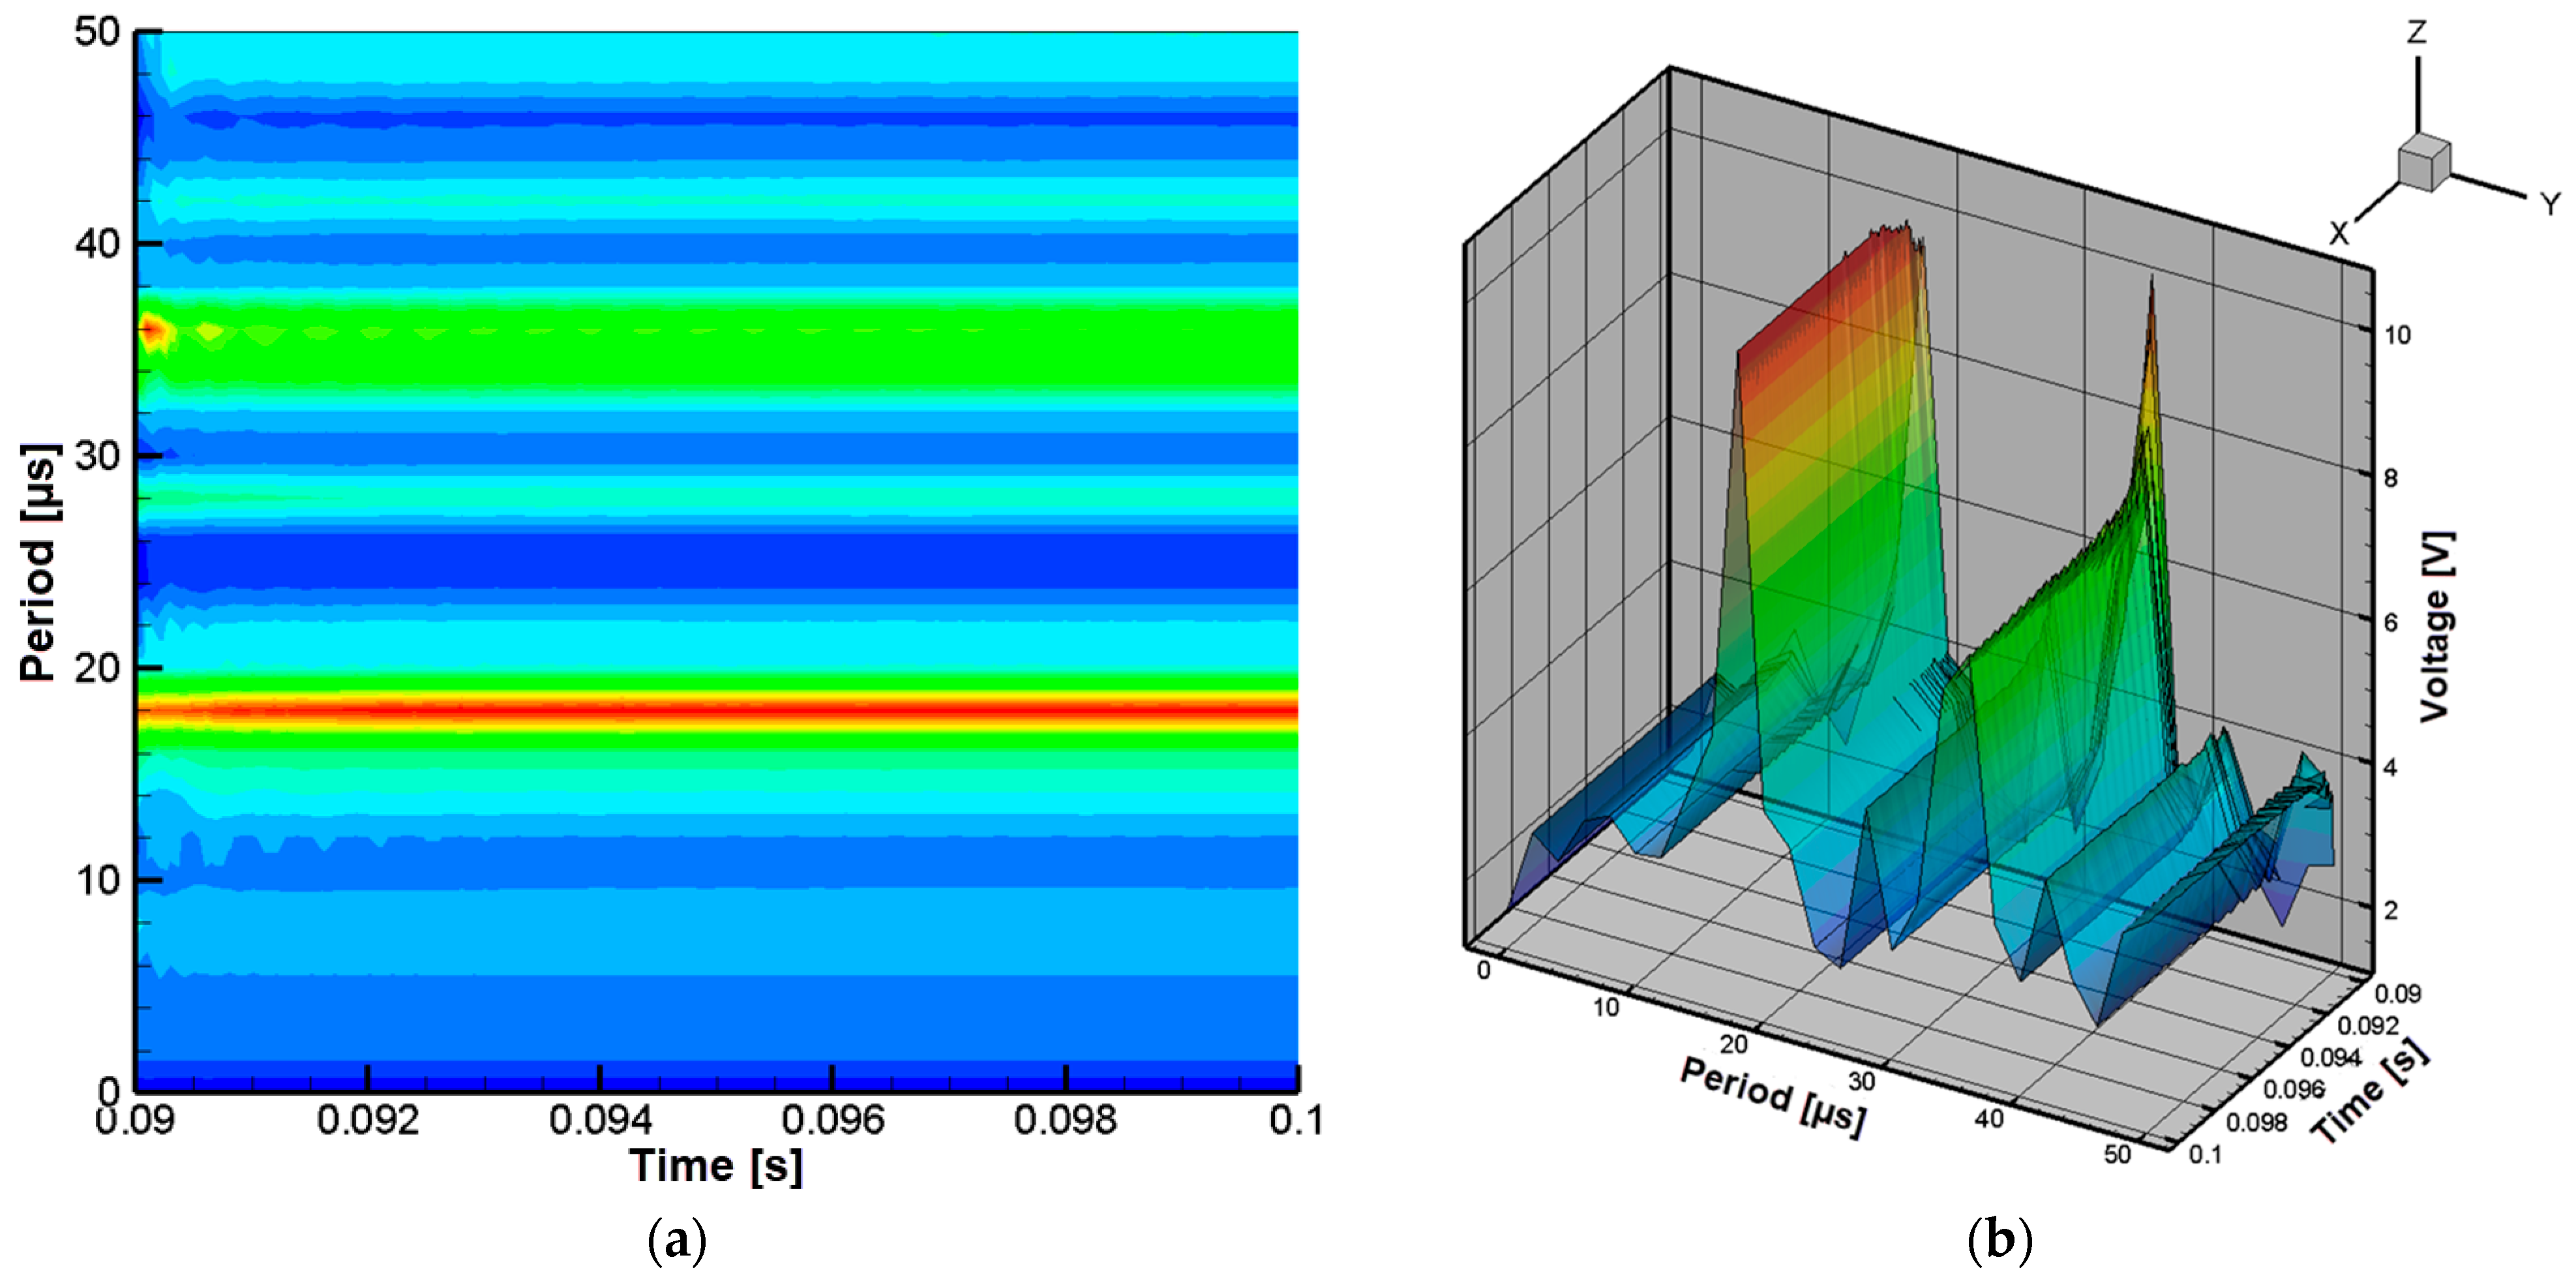
Next, the variation in the receiver voltage over time is analyzed as a function of the control signal period for different values of the coupling coefficient. To enable a more comprehensive interpretation, the results are presented in both two-dimensional and three-dimensional formats. In the subsequent studies, the resonant frequency was selected for controlling transistor M3, while the control frequency of transistor M4 was varied.
According to the graph in Figure 6a, the voltage amplitude reaches its maximum value at a control signal period of approximately 18 µs, corresponding to a coupling coefficient of 0.1. Figure 6b provides a three-dimensional representation of the results, showing that the maximum voltage is about 12 V at a period of around 18 µs.
From the graph in Figure 7a, it can be observed that the maximum voltage is reached at a control signal period of approximately 18 µs, corresponding to a coupling coefficient of 0.2. Analysis of the results in Figure 7b shows that at the same period, the voltage attains a peak value of about 24 V.
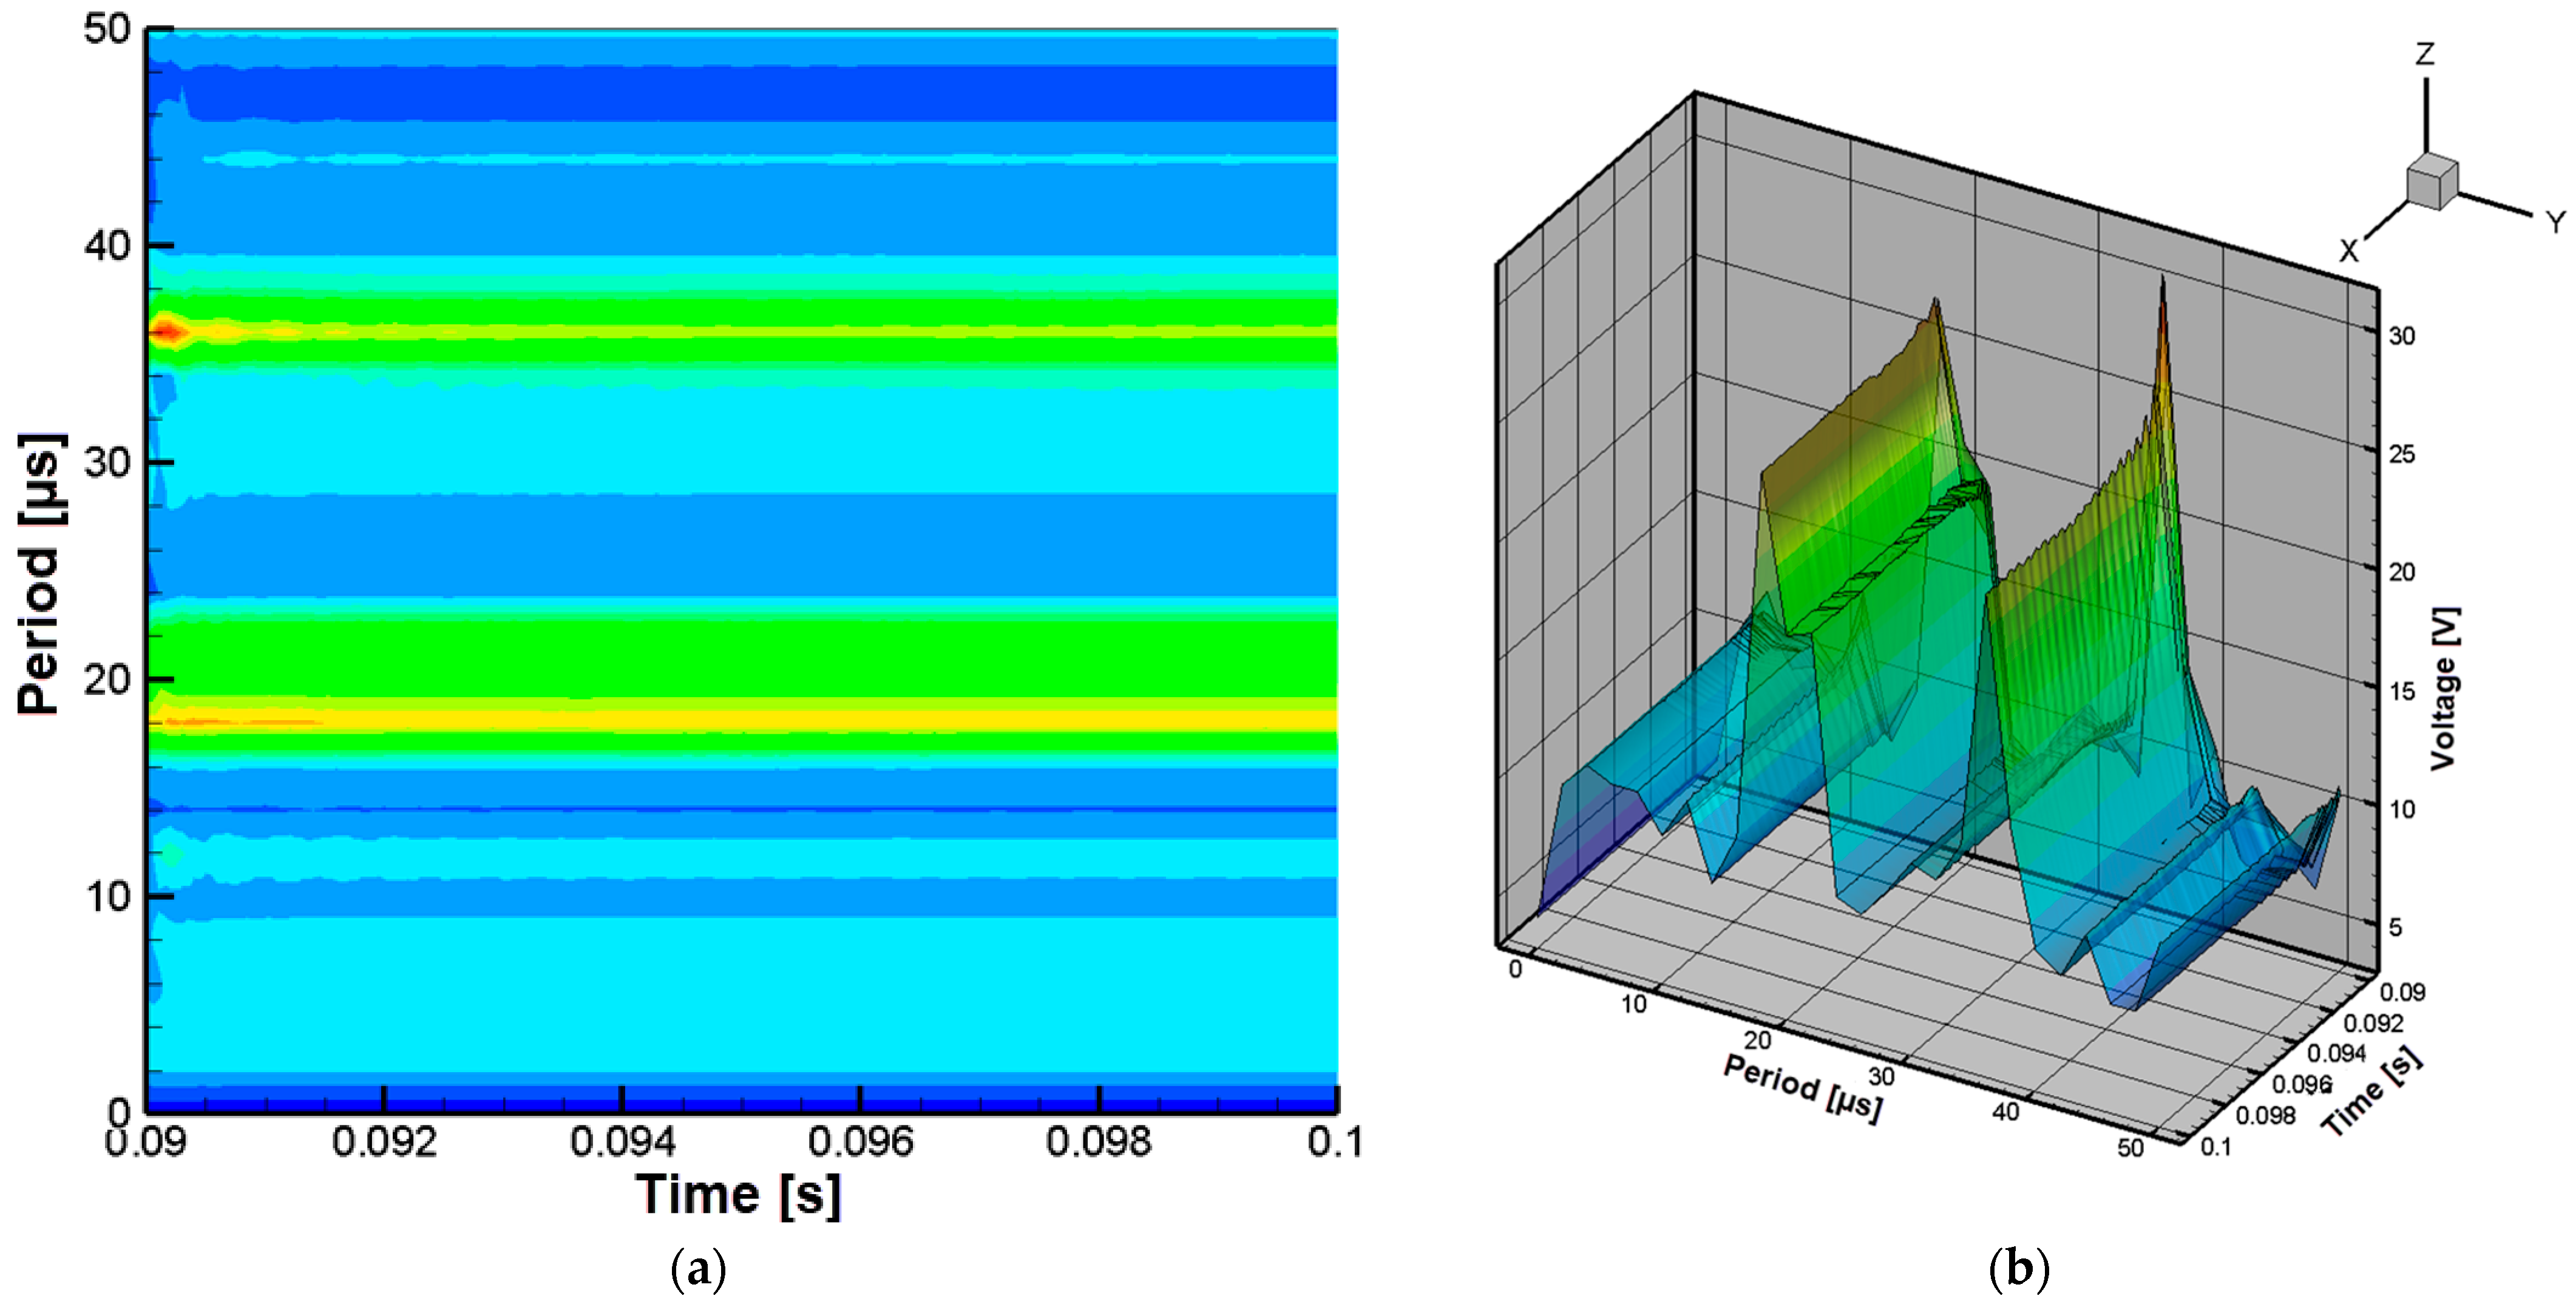
For a coupling coefficient of 0.3, the graph in Figure 8a shows that the voltage reaches its maximum at a control signal period of approximately 18 µs. Analysis of Figure 8b indicates that in the three-dimensional representation, the maximum voltage is about 32 V at the same period.
The graph in Figure 9a shows that a voltage peak occurs at a control signal period of approximately 18 µs, corresponding to a coupling coefficient of 0.4. Examination of Figure 9b reveals that the maximum voltage reaches about 26 V at the same period.
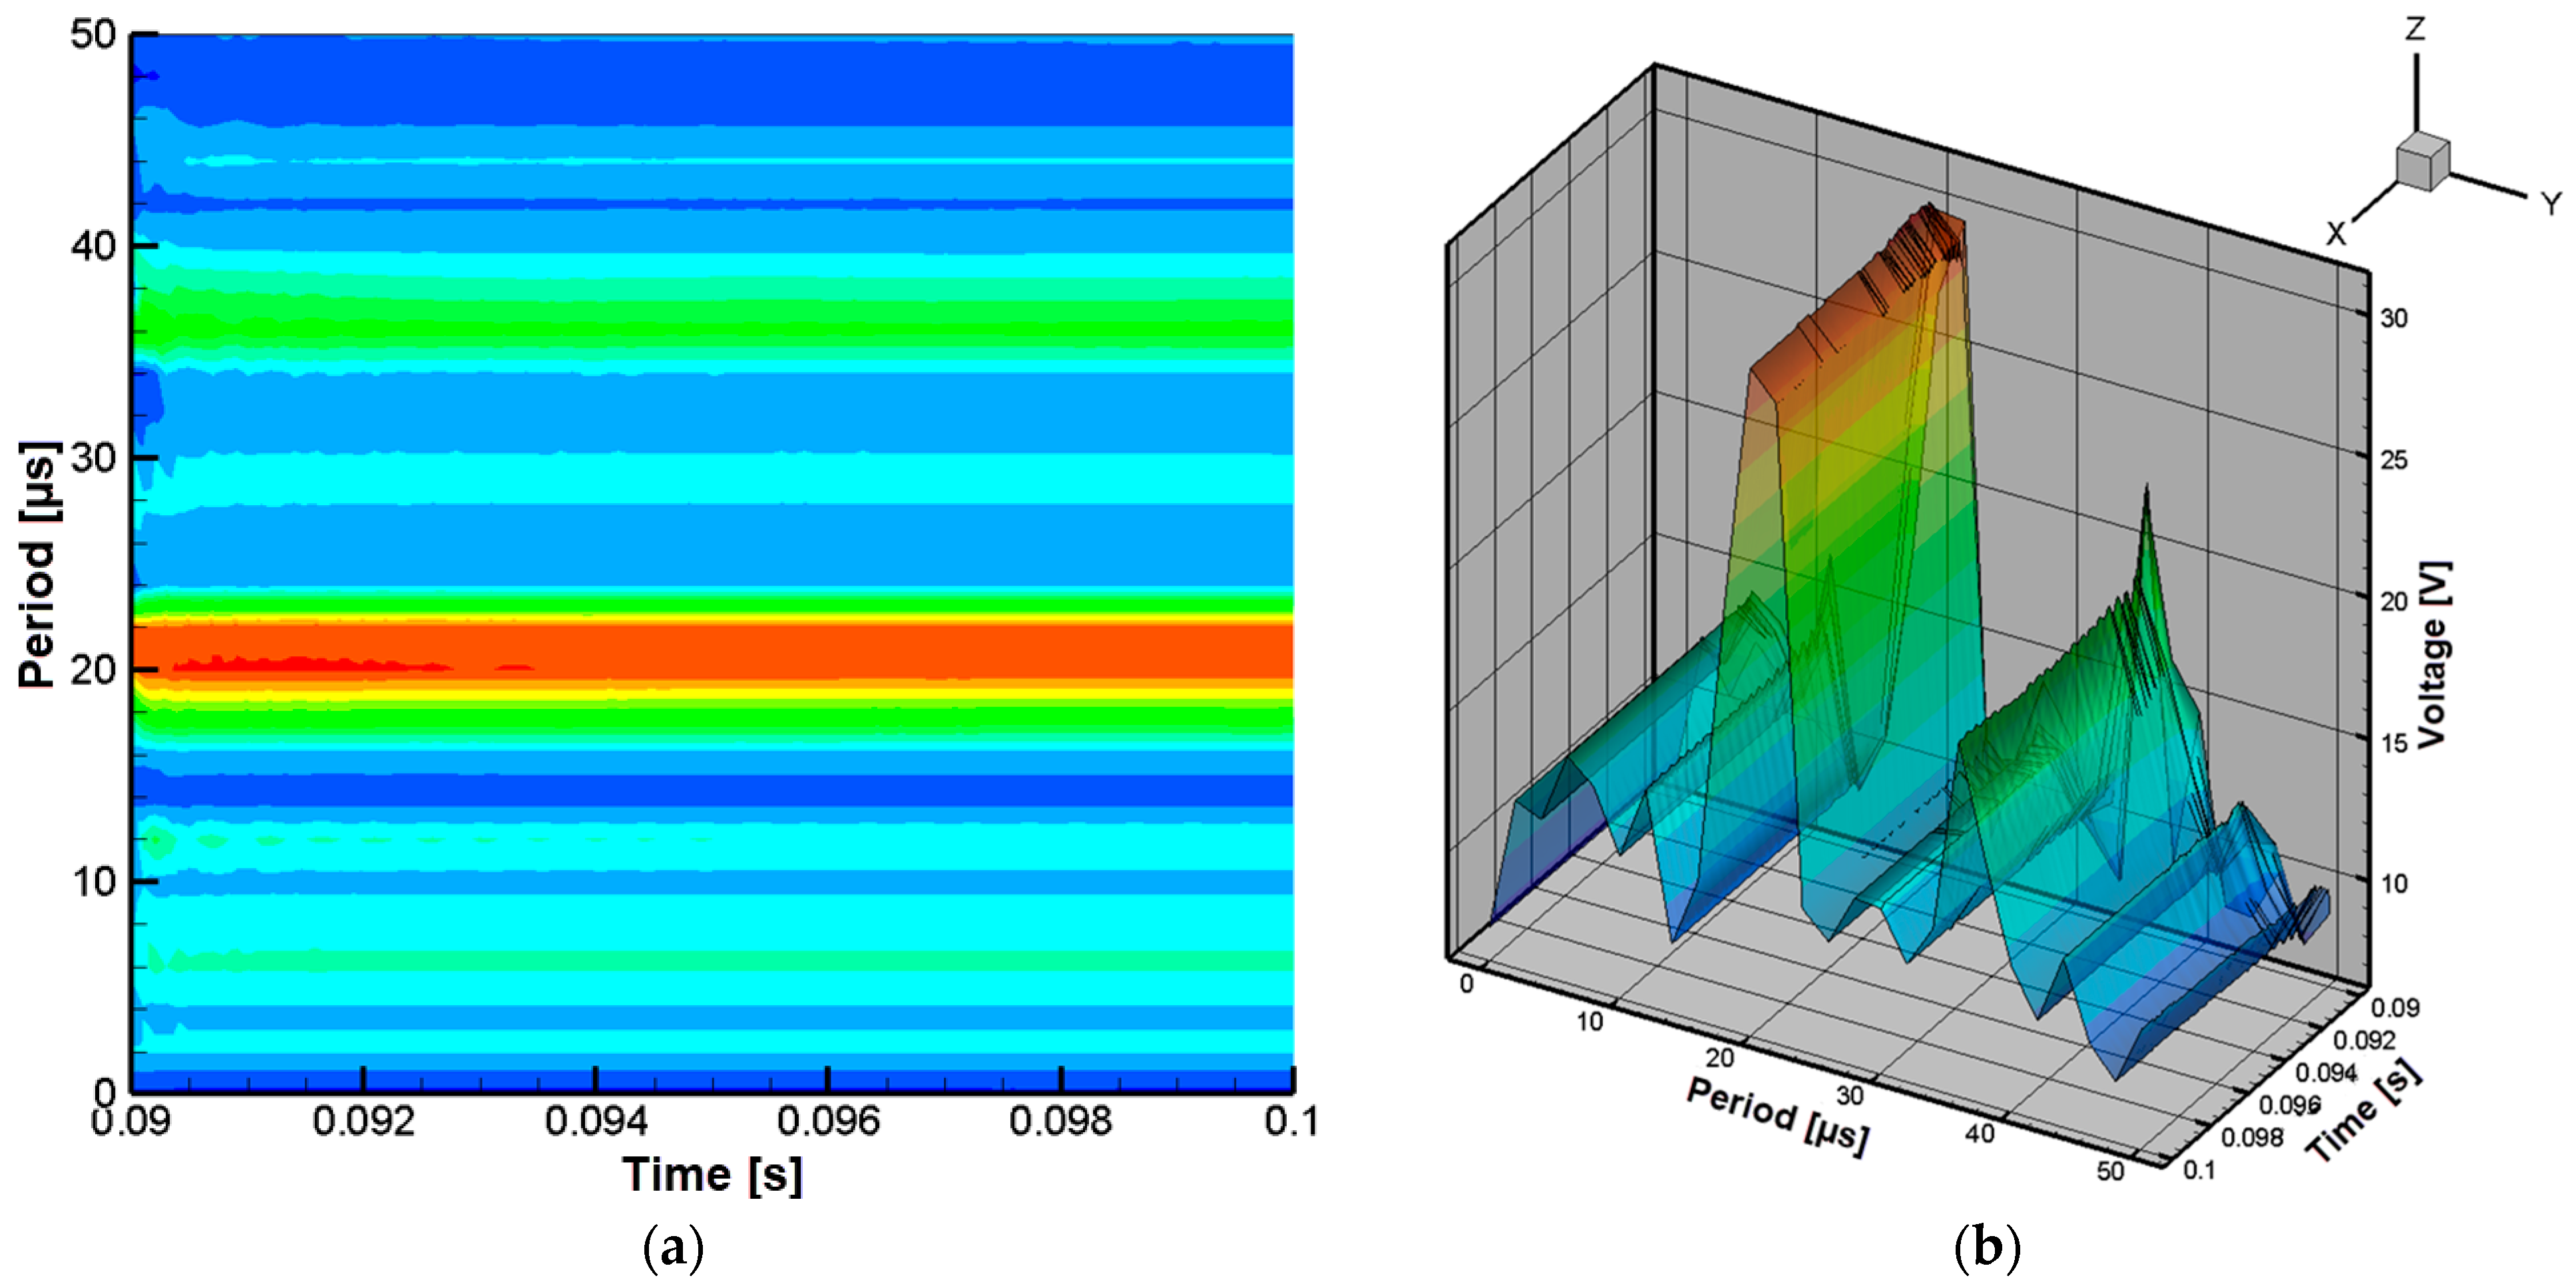
The graph in Figure 10a shows that the voltage reaches a peak at a control signal period of approximately 20 µs, corresponding to a coupling coefficient of 0.5. For the same coupling coefficient, Figure 10b indicates that the maximum voltage is about 30 V at a period of around 20 µs.
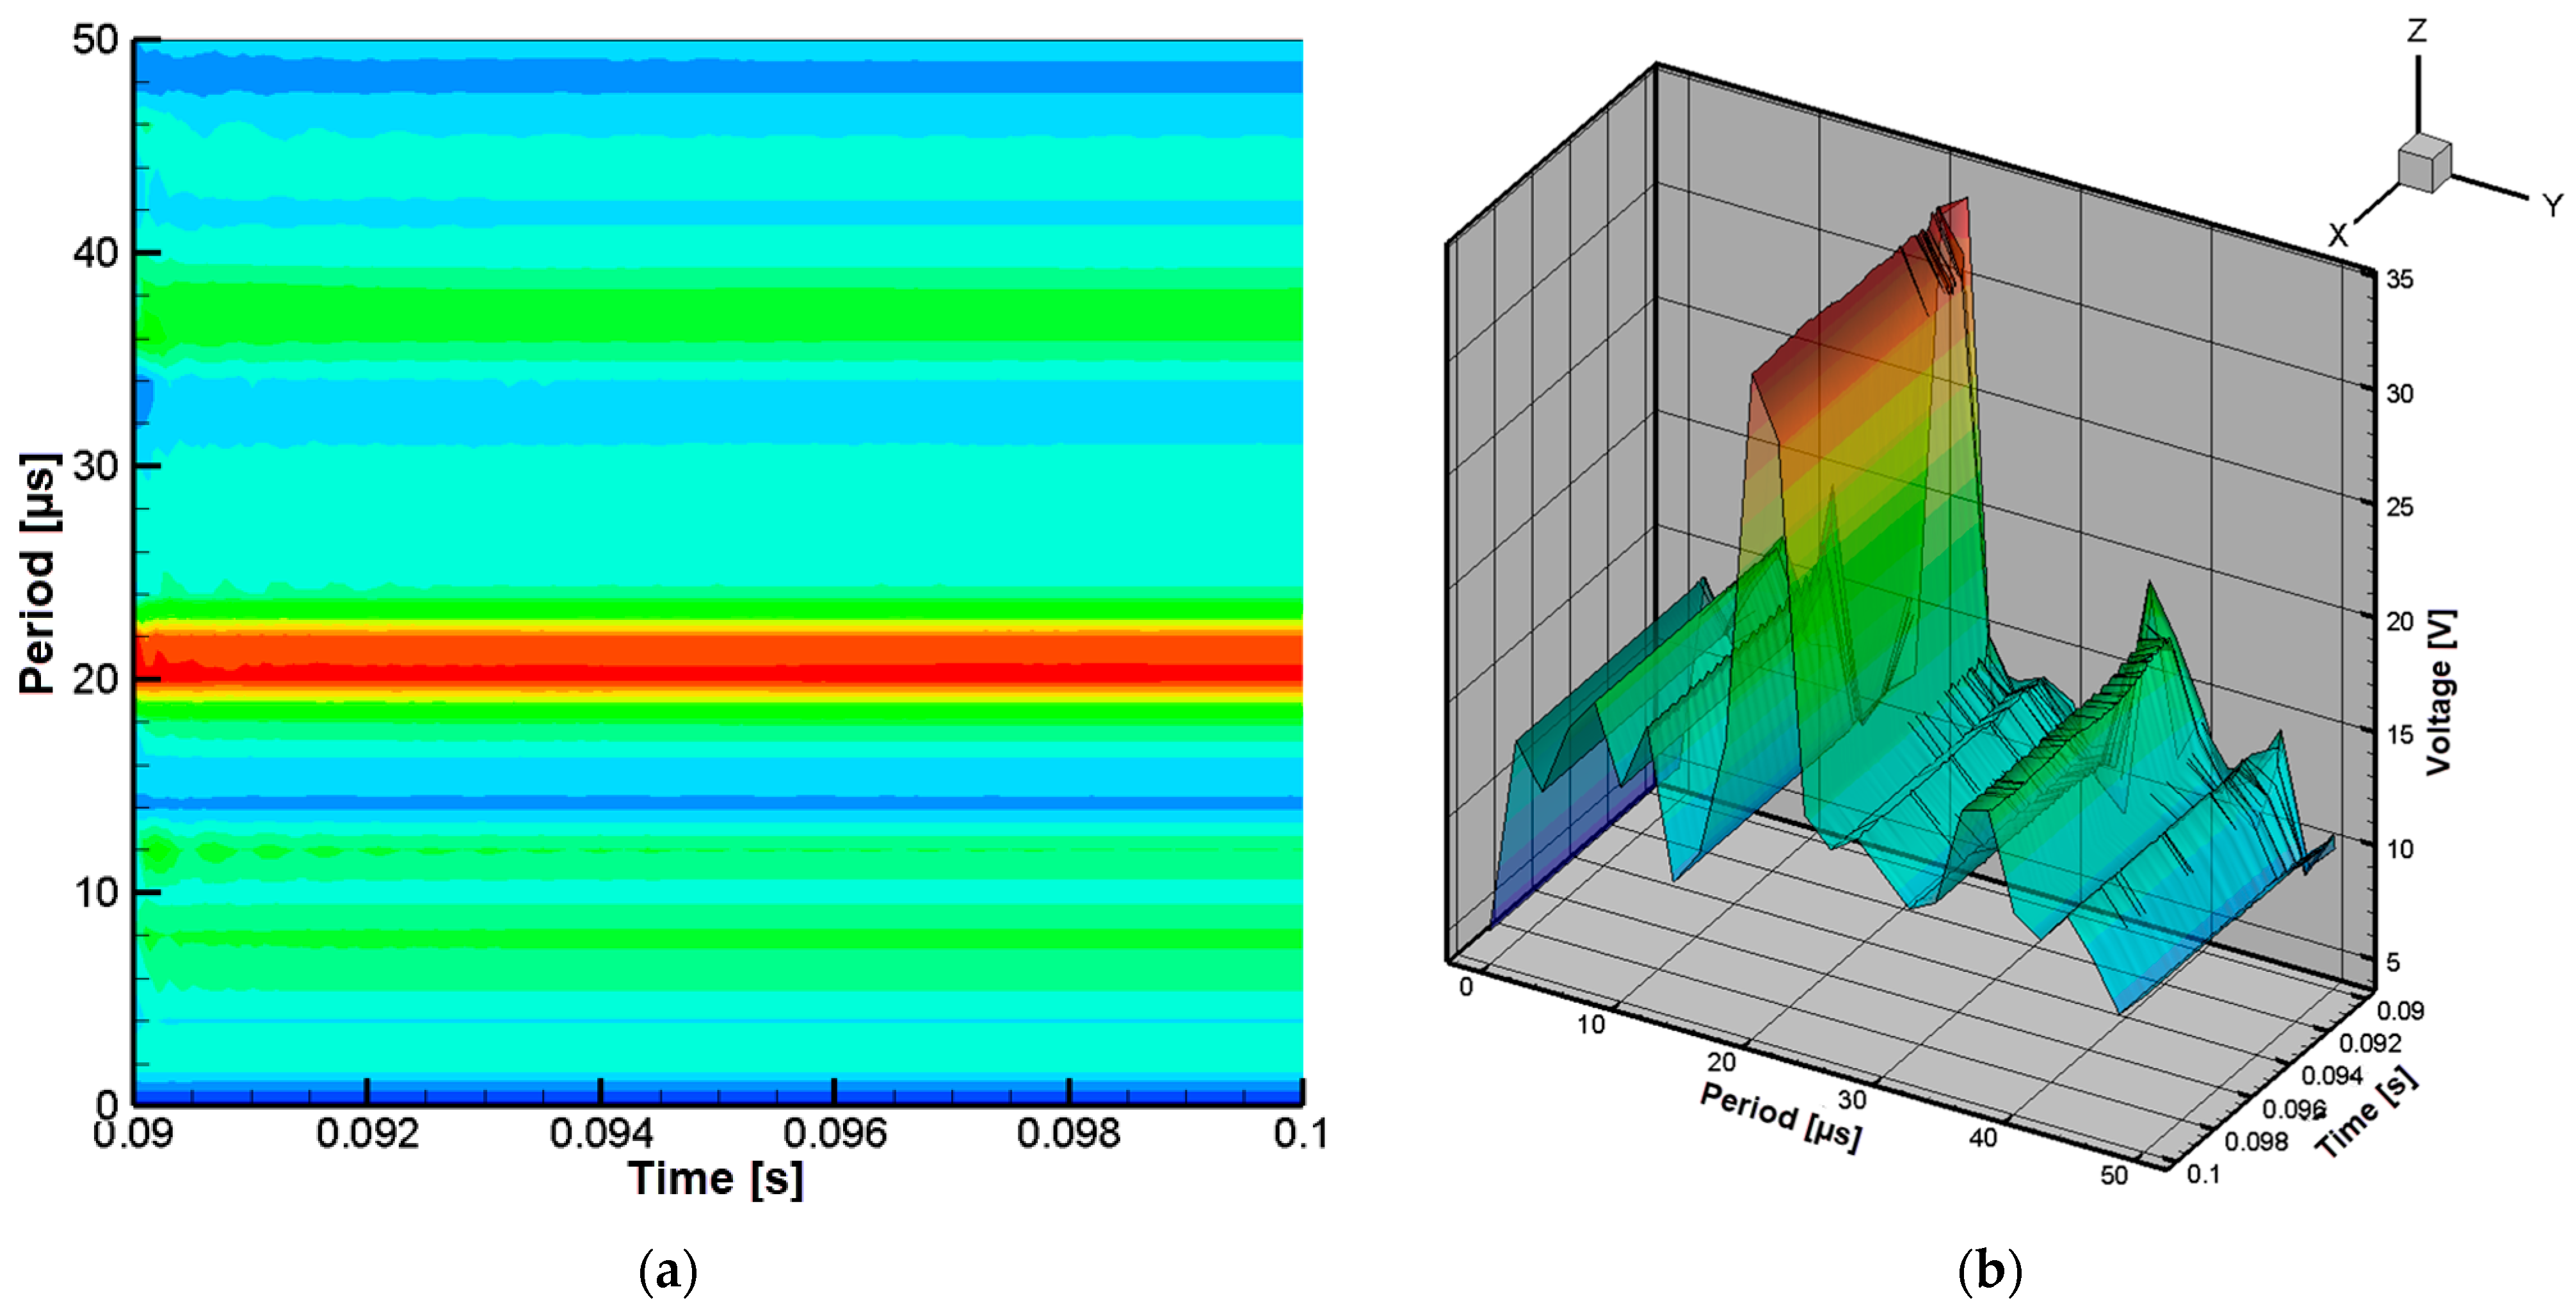
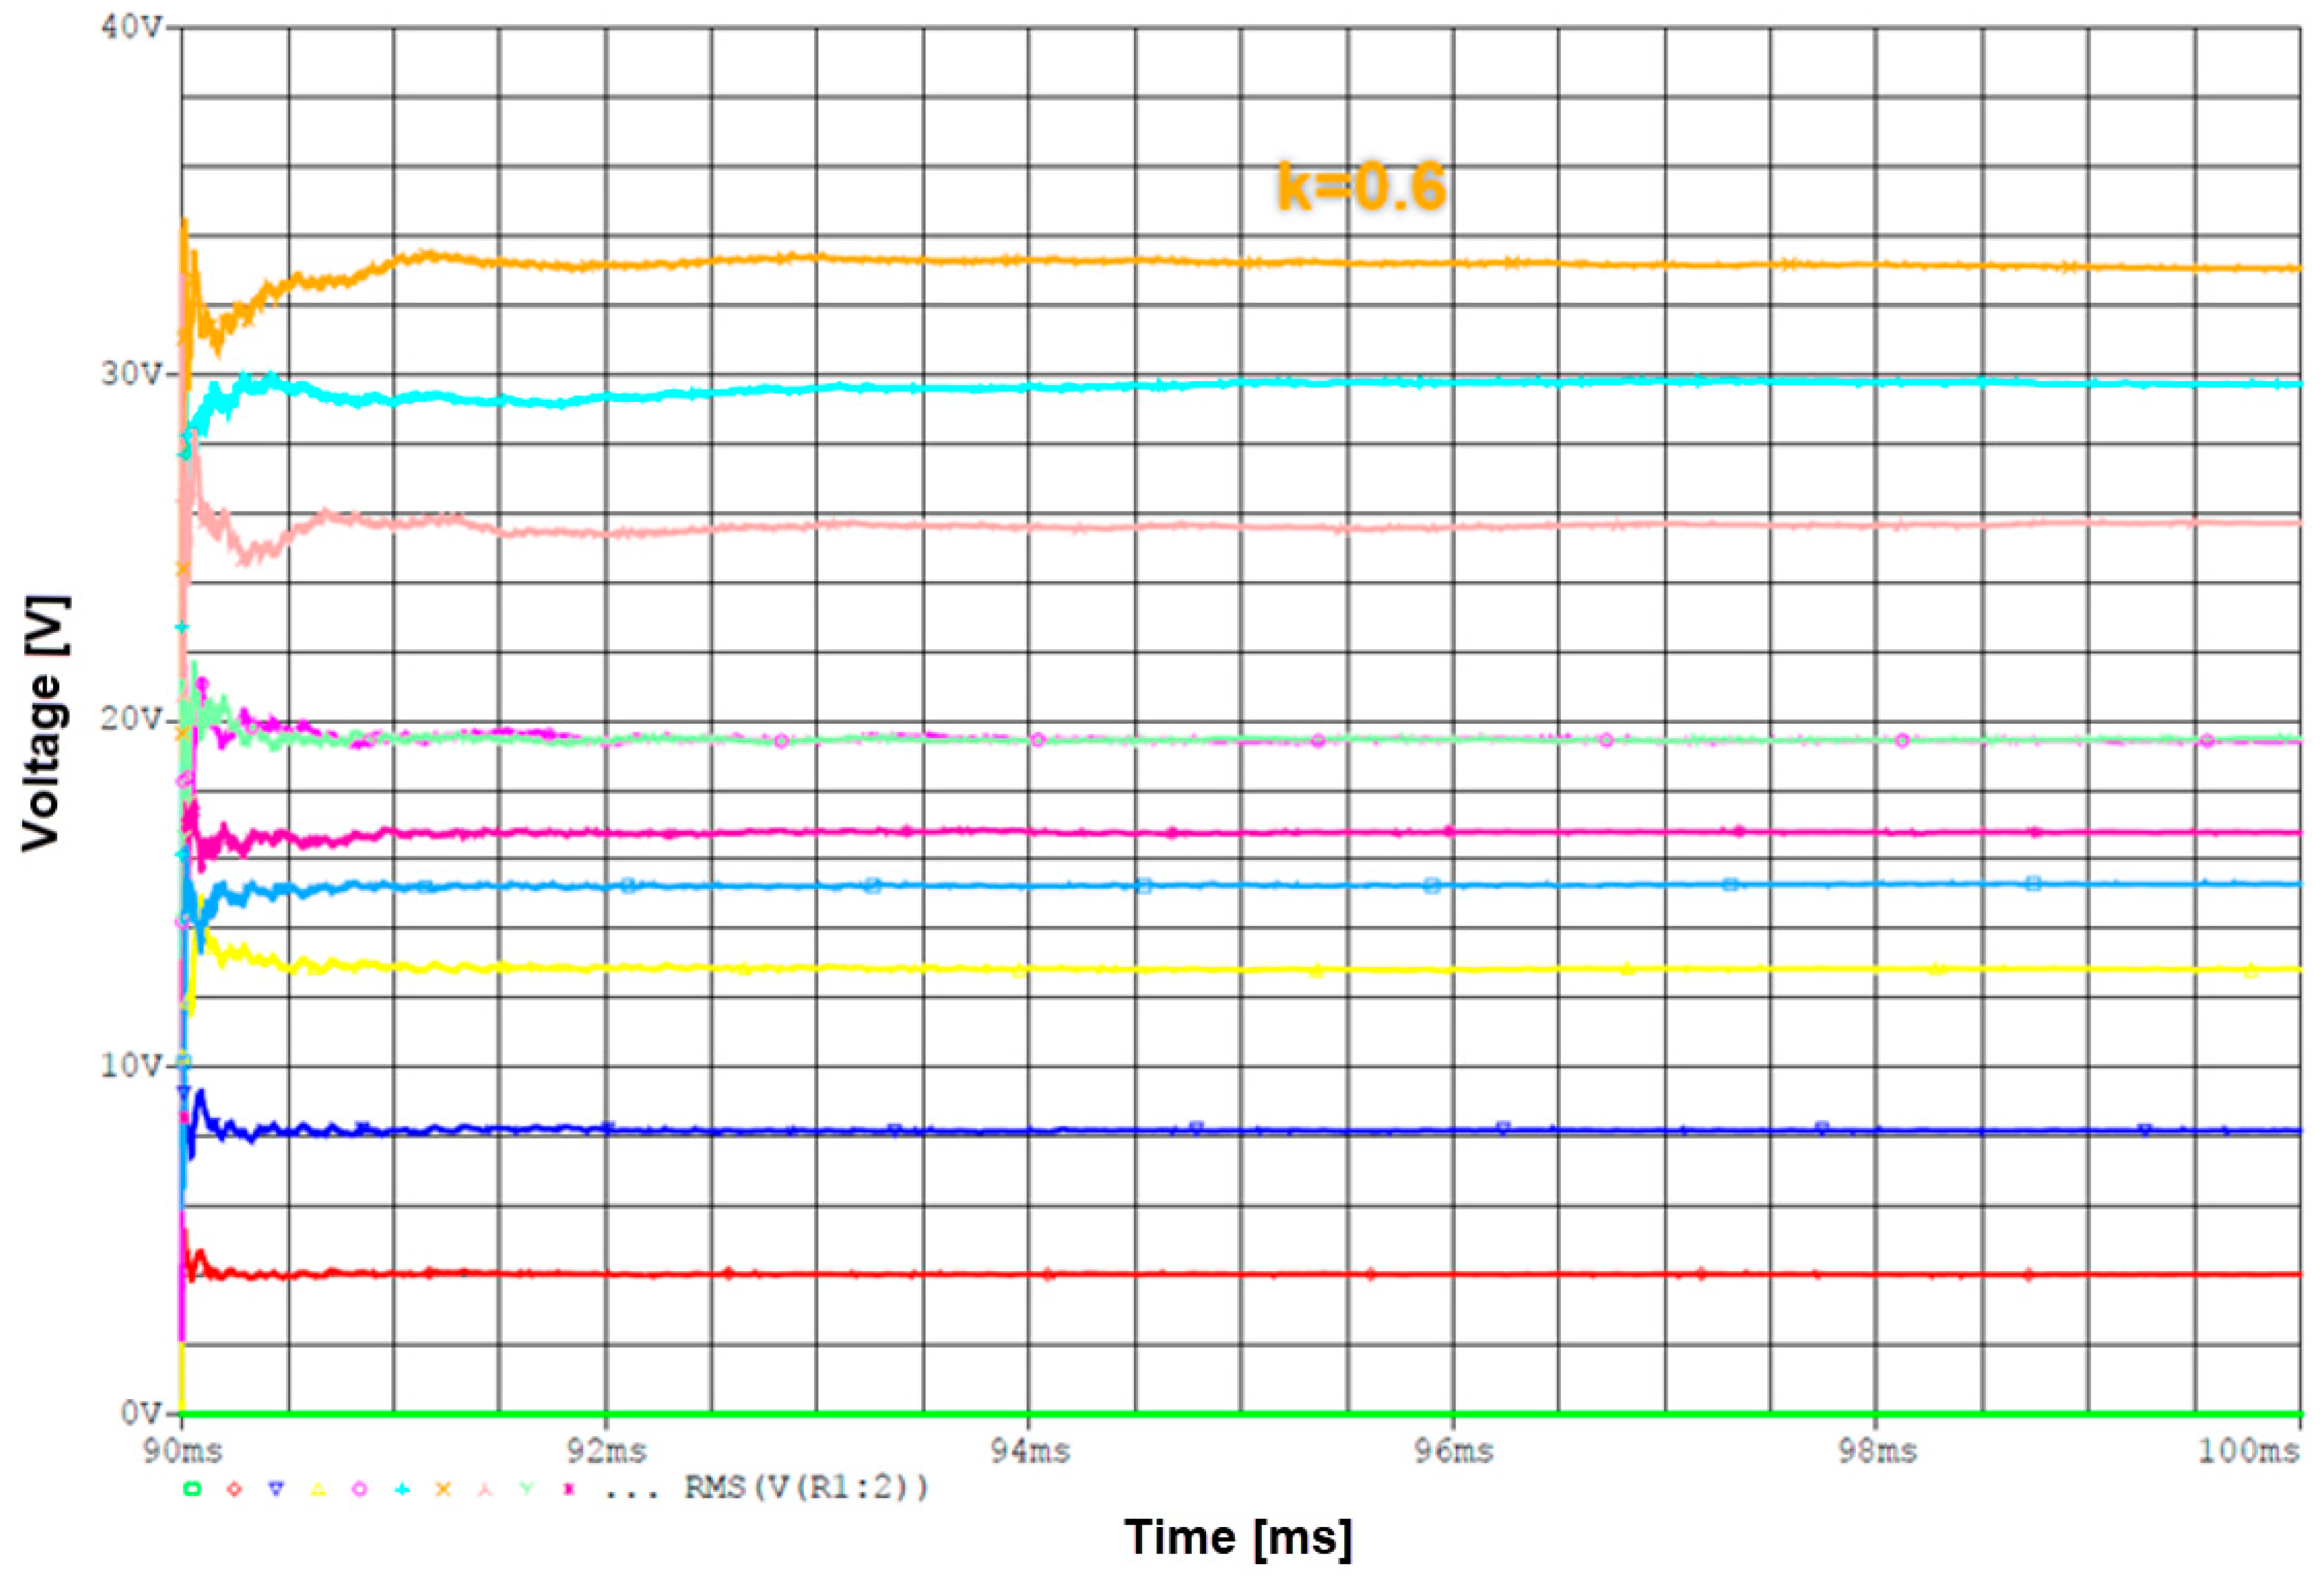
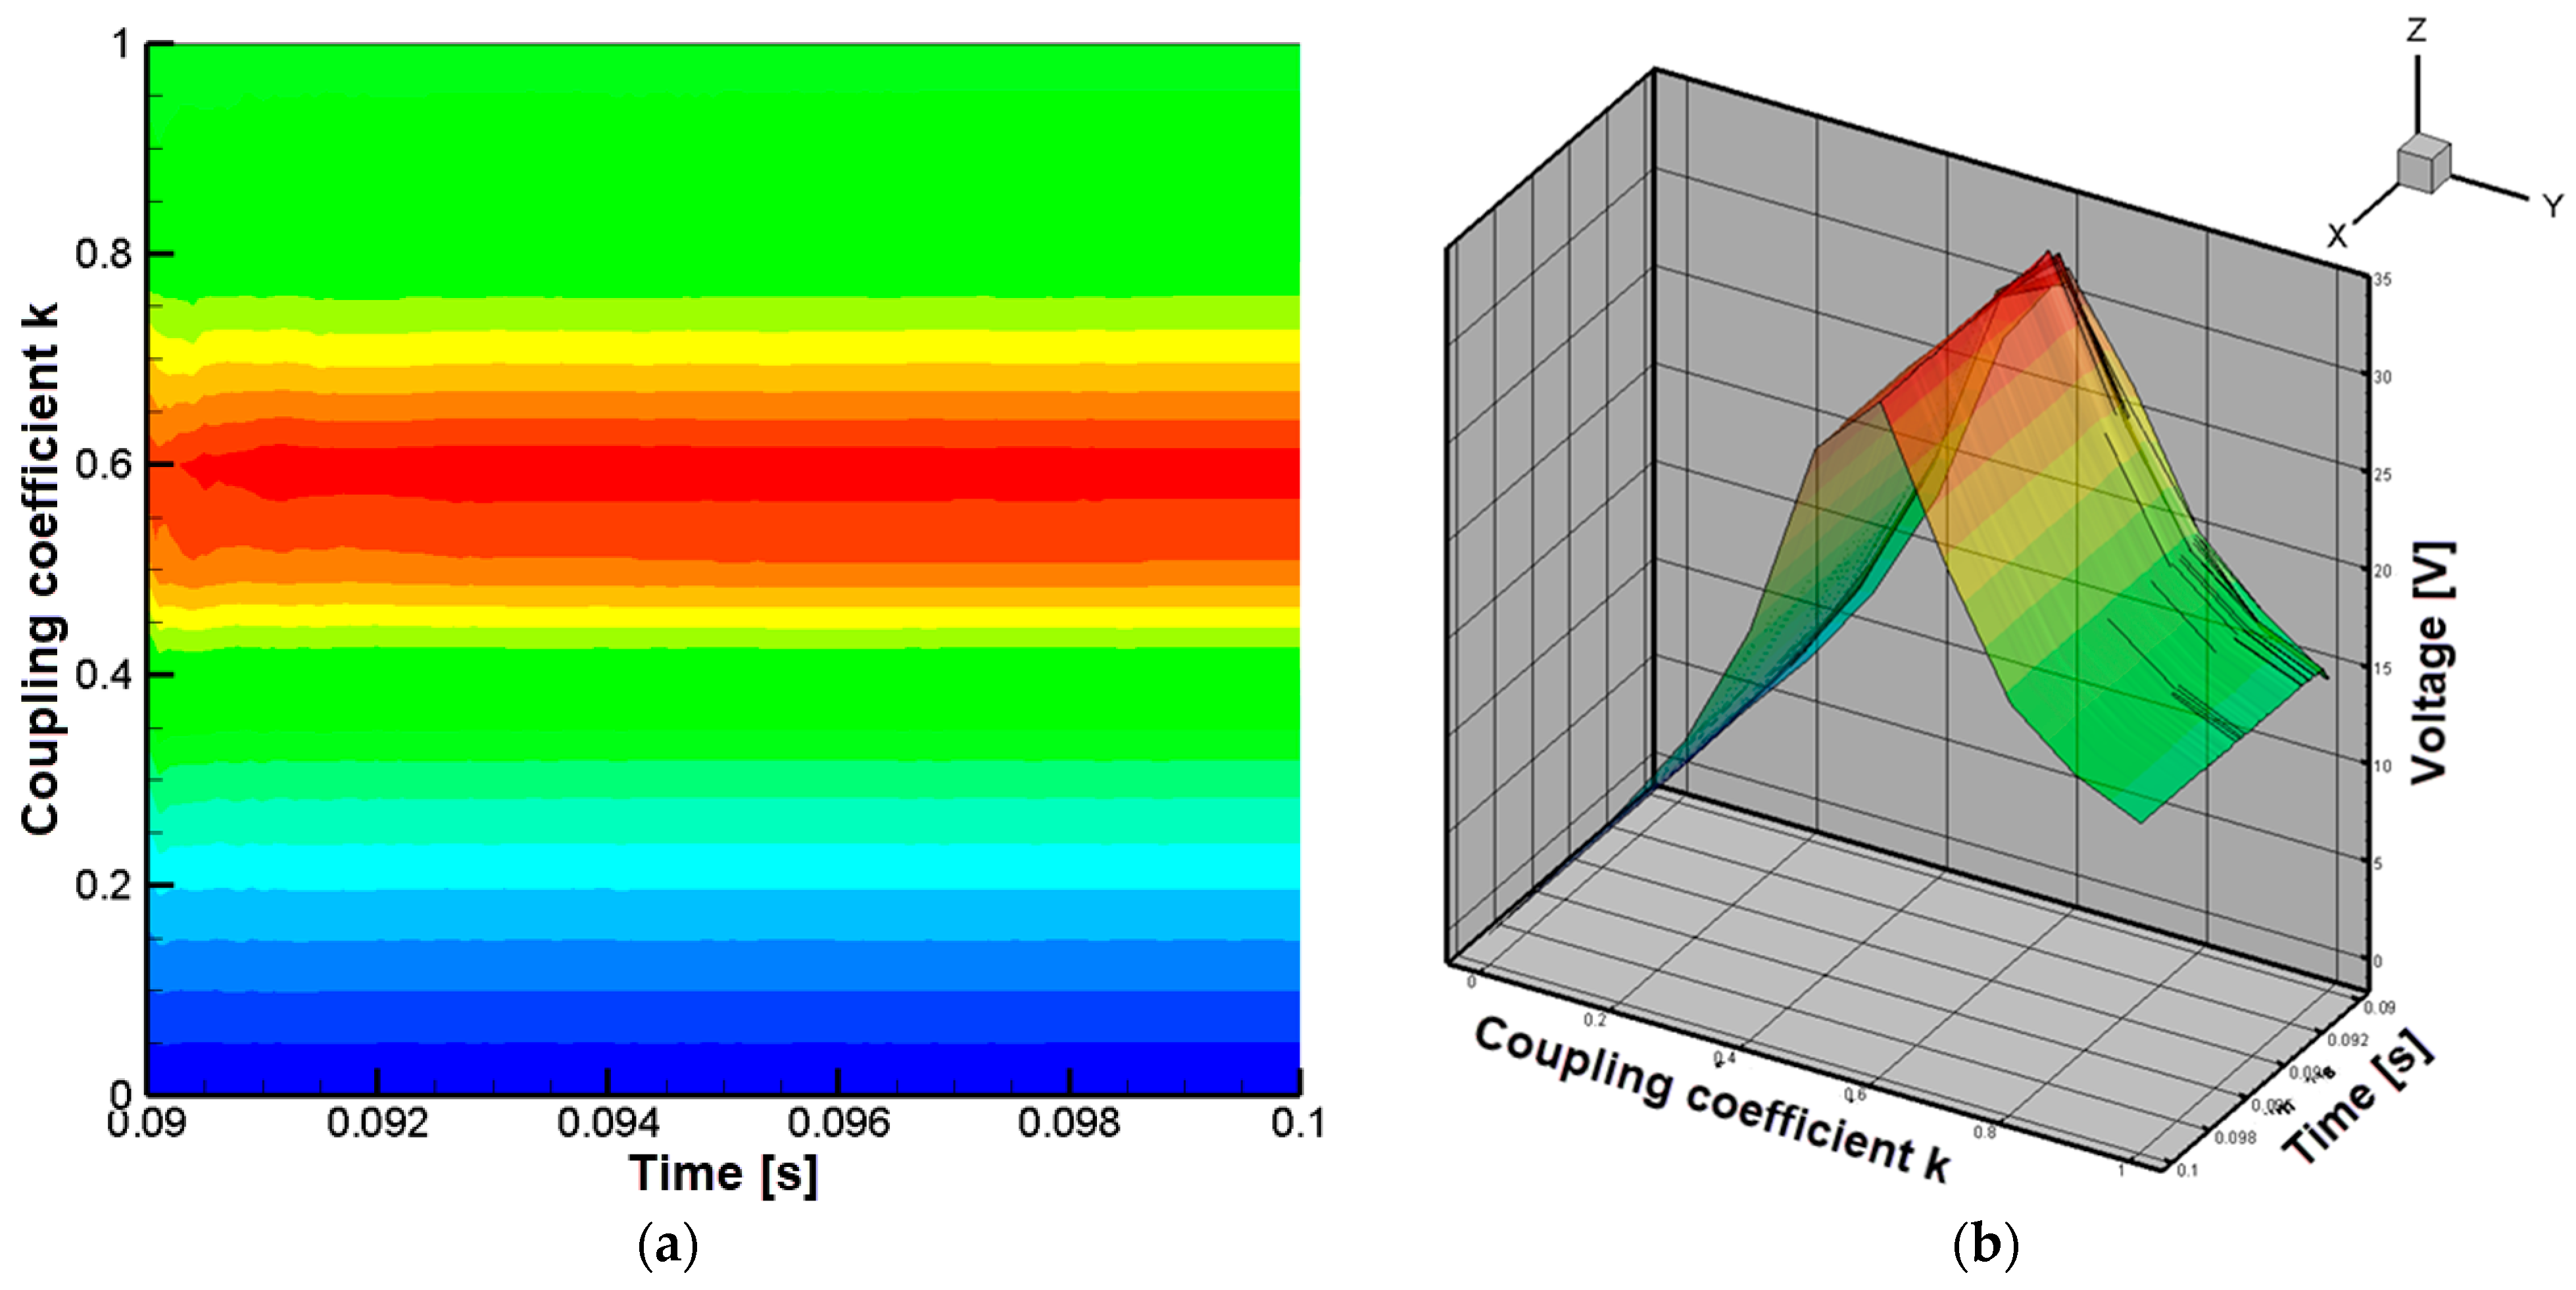
The graph in Figure 11a shows that the peak voltage occurs at a control signal period of approximately 20 µs, corresponding to a coupling coefficient of 0.6. Analysis of Figure 11b reveals that in the three-dimensional representation, the maximum voltage is about 33 V at the same period.
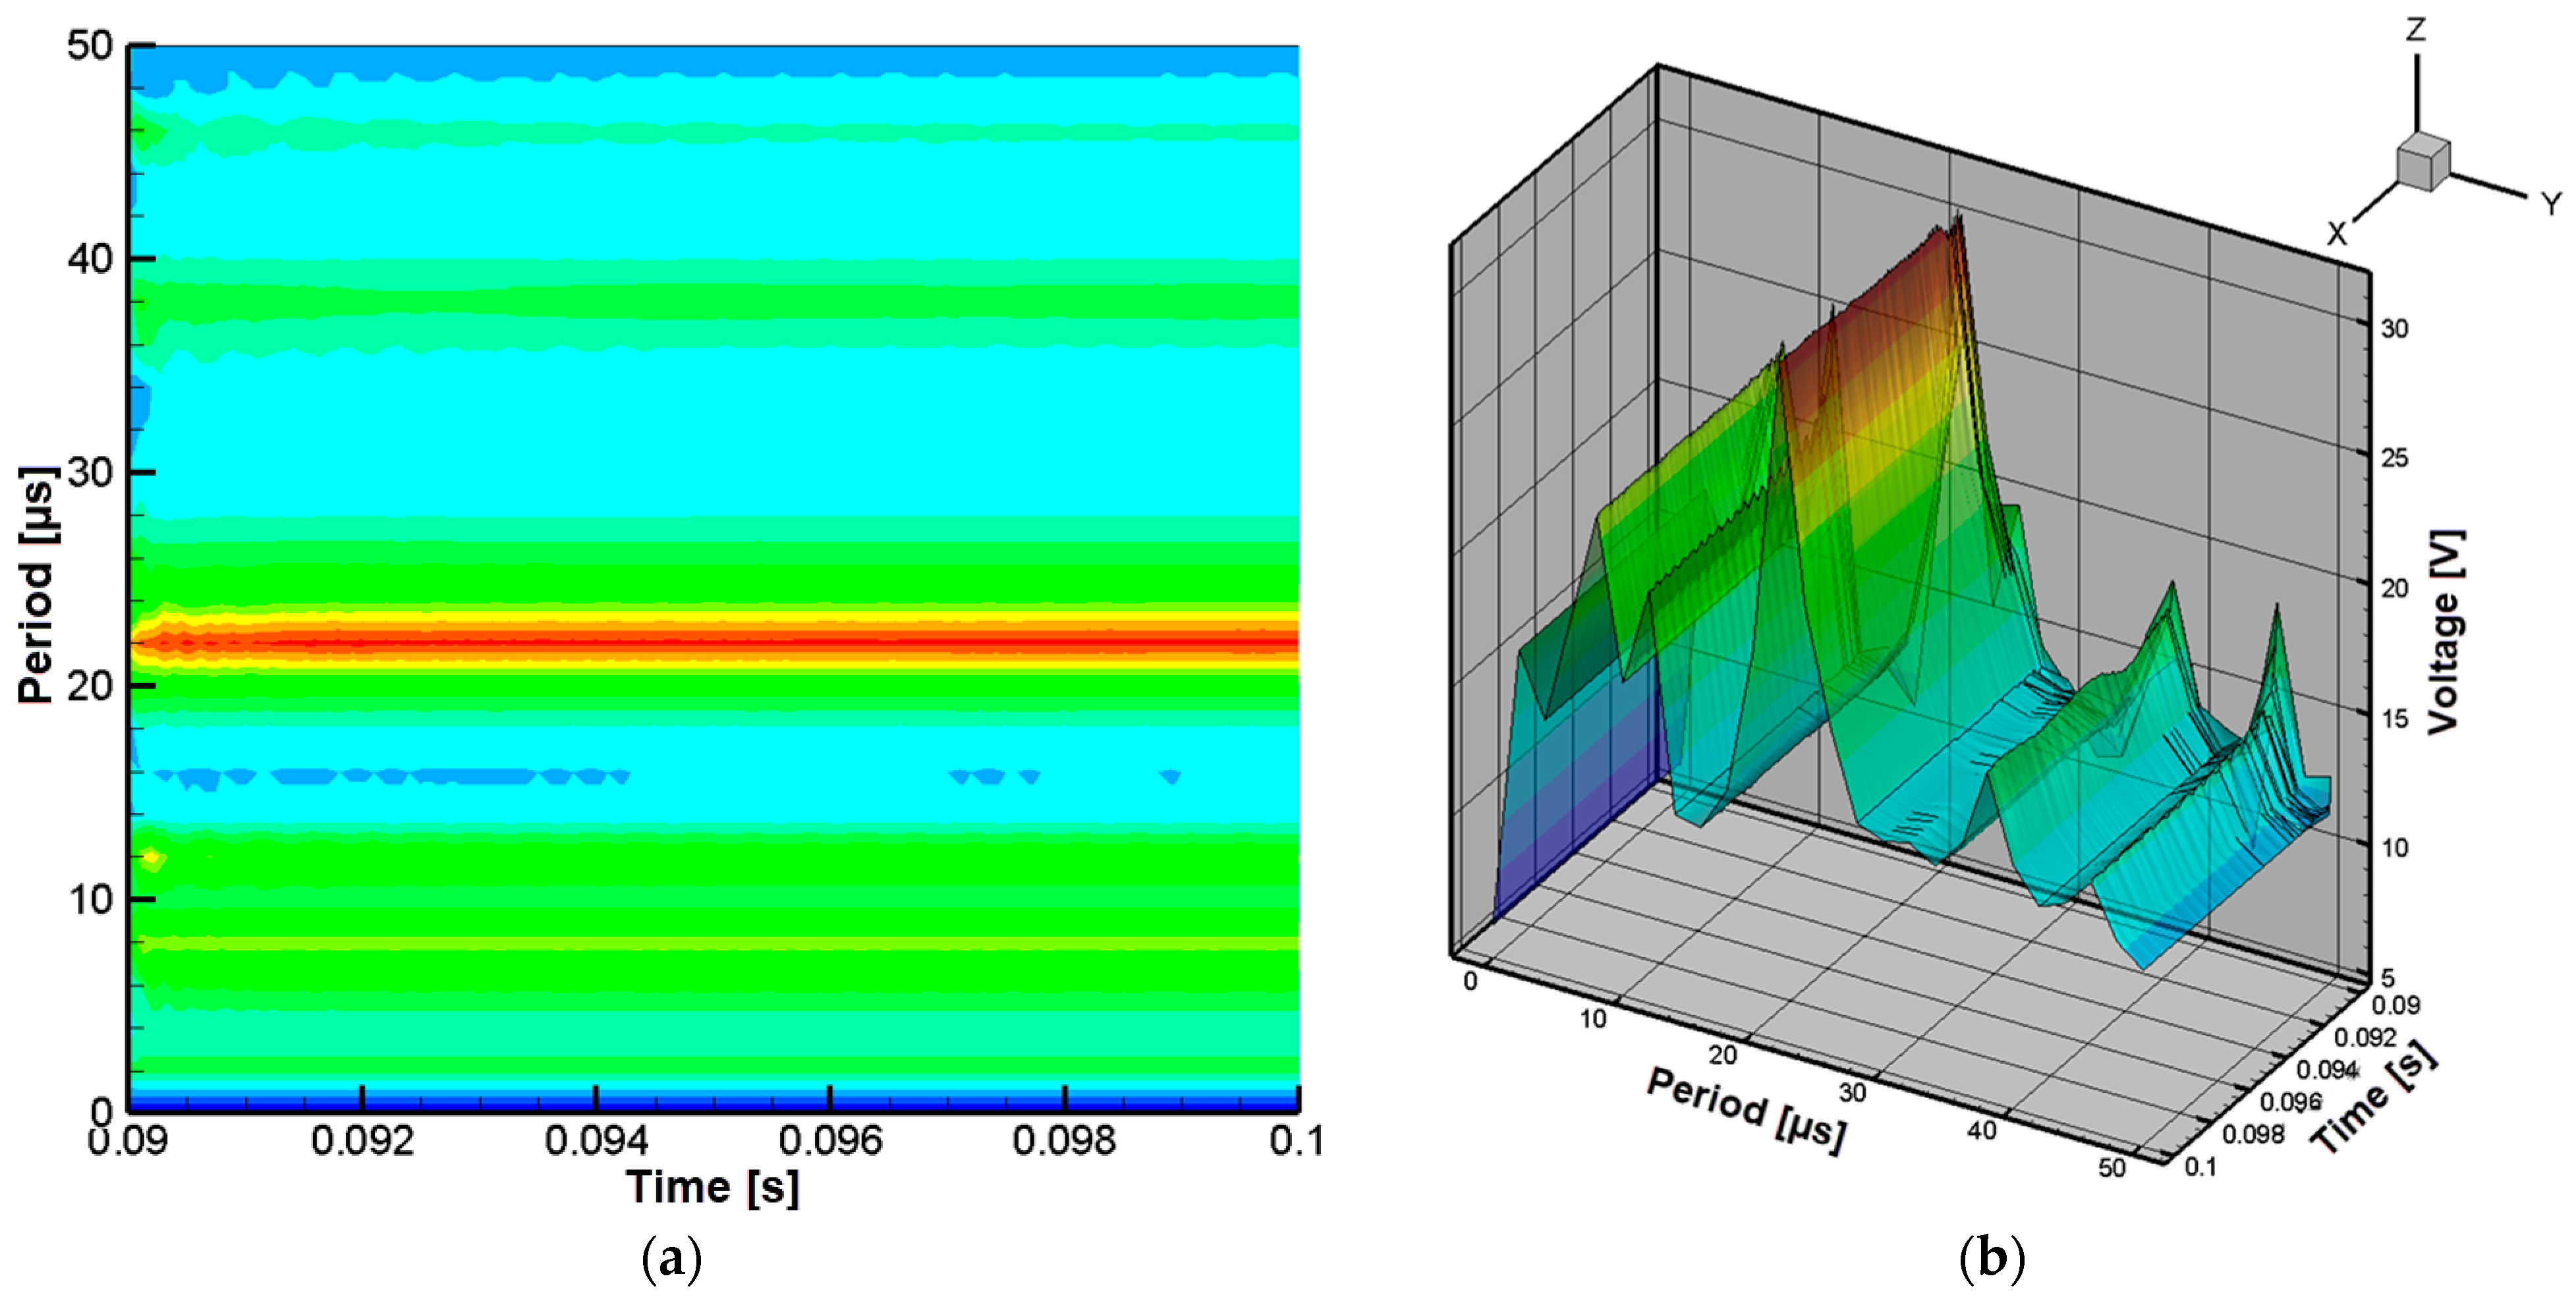
The graph in Figure 12a shows that the voltage reaches a peak at a control signal period of approximately 22 µs, corresponding to a coupling coefficient of 0.7. Figure 12b indicates that at the same period, the peak voltage is about 30 V, a behavior that is visually emphasized in the three-dimensional representation.
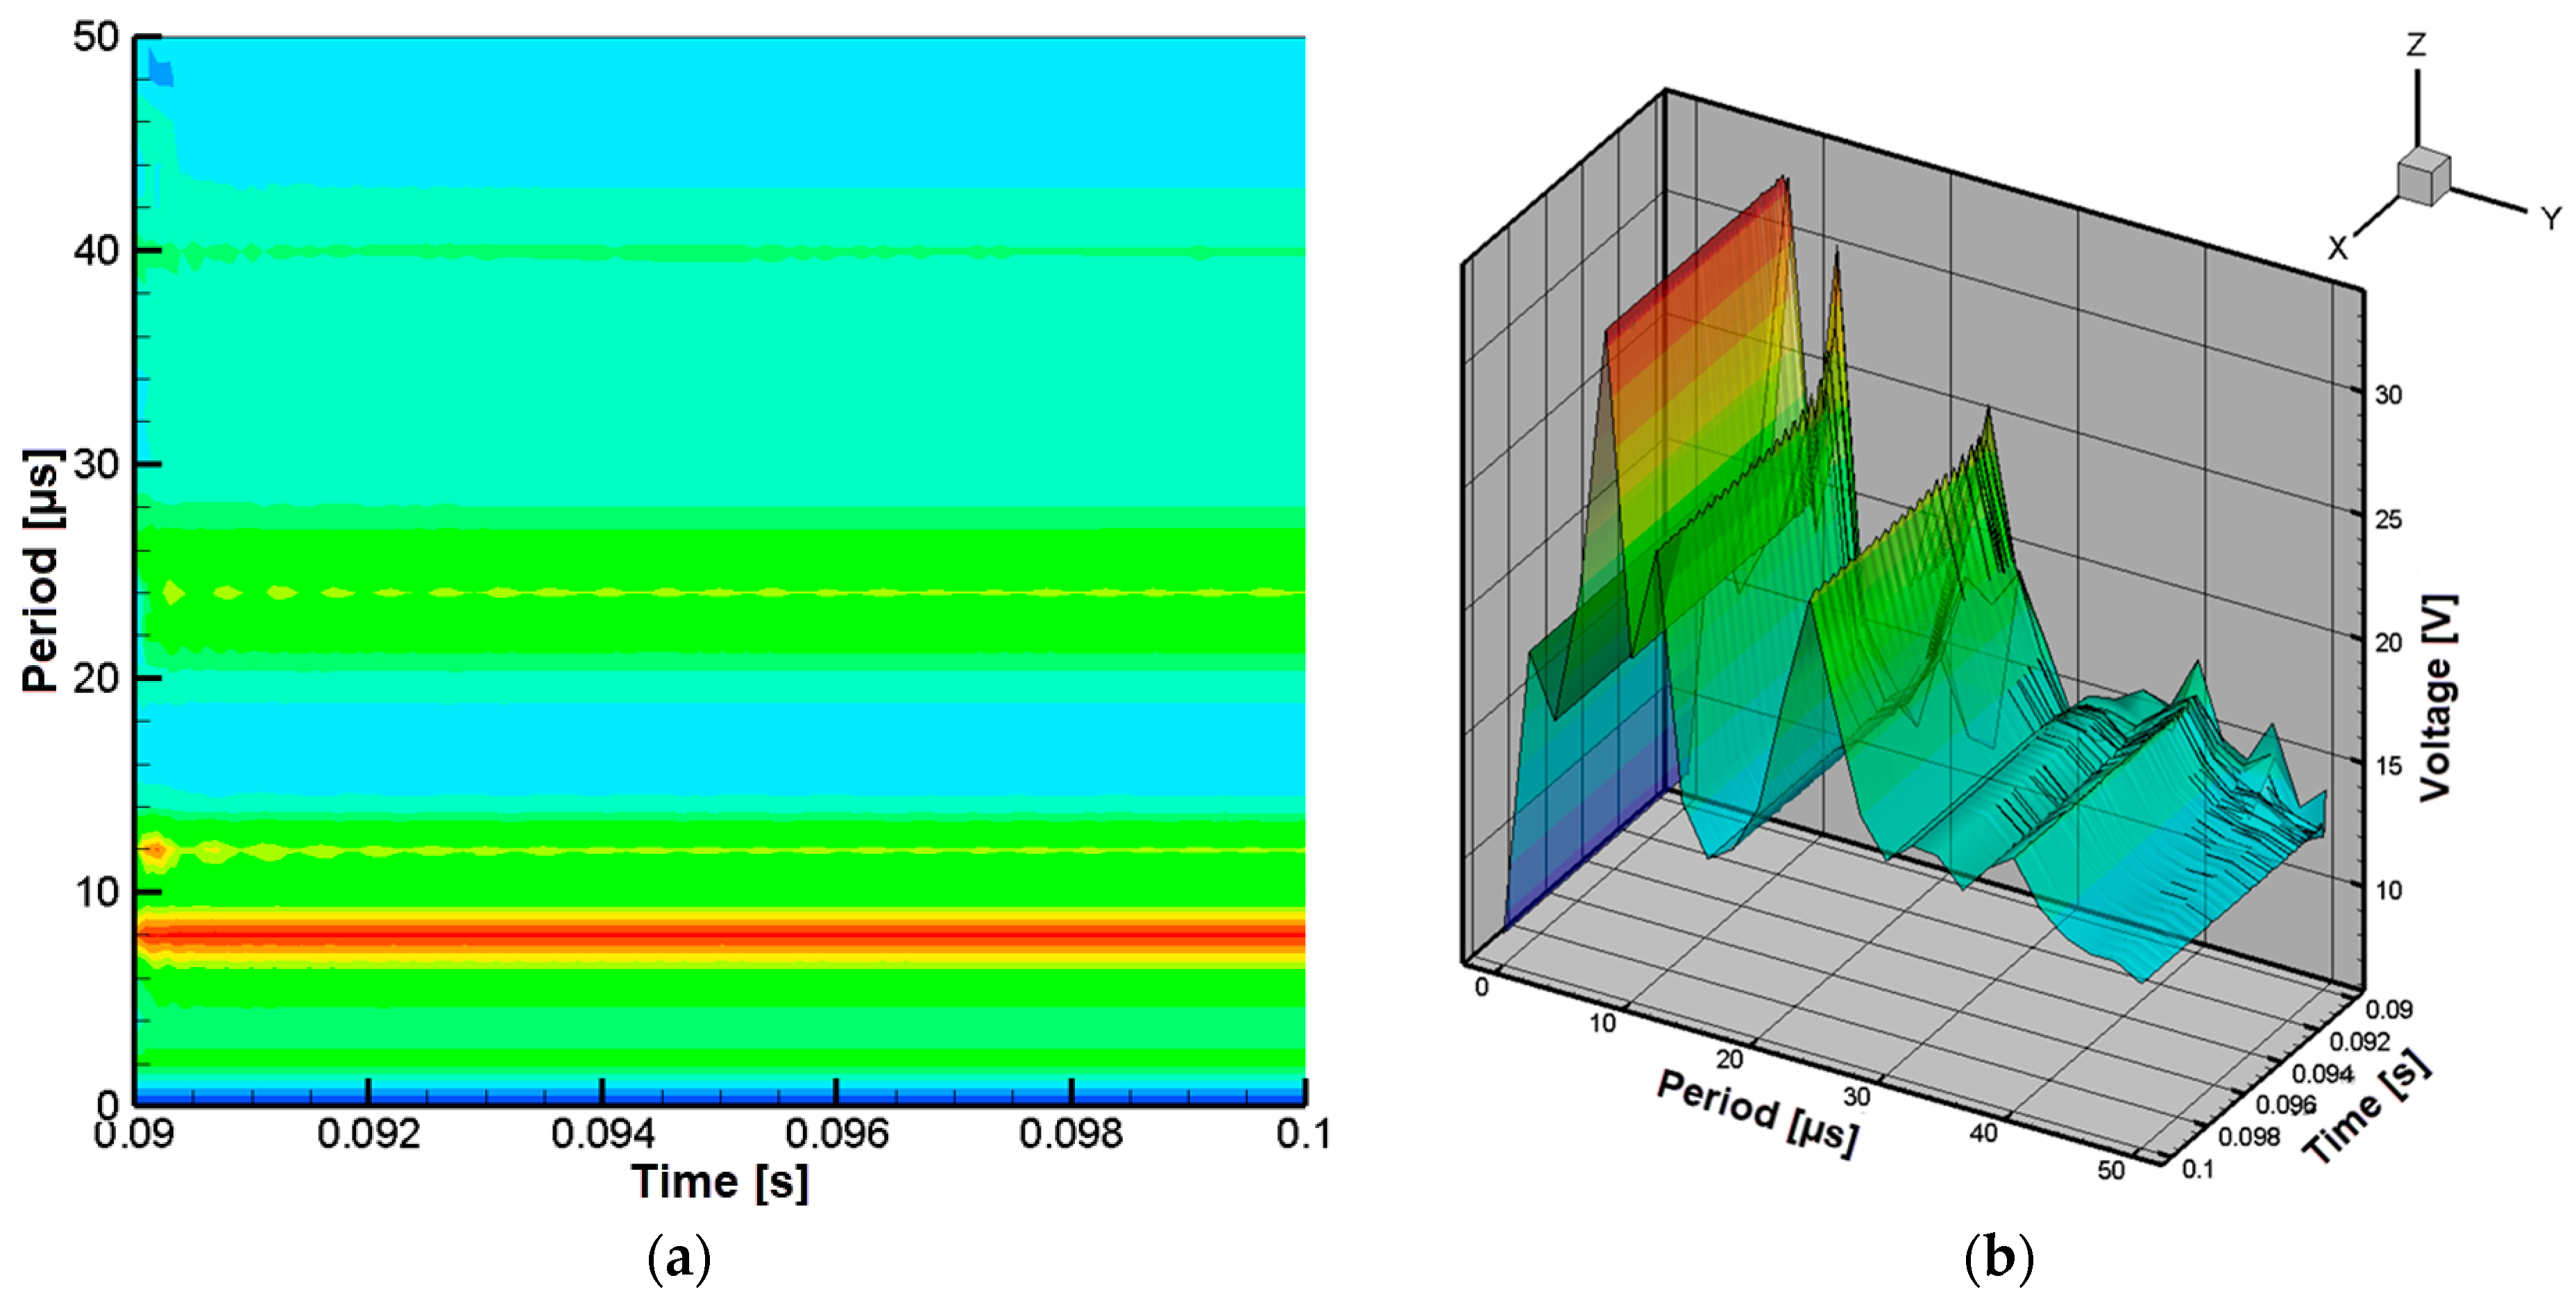
The graph in Figure 13a shows that at a control signal period of approximately 22 µs, the voltage reaches a maximum value corresponding to a coupling coefficient of 0.8. Figure 13b presents the three-dimensional representation, confirming that the maximum voltage is about 30 V at the same period.
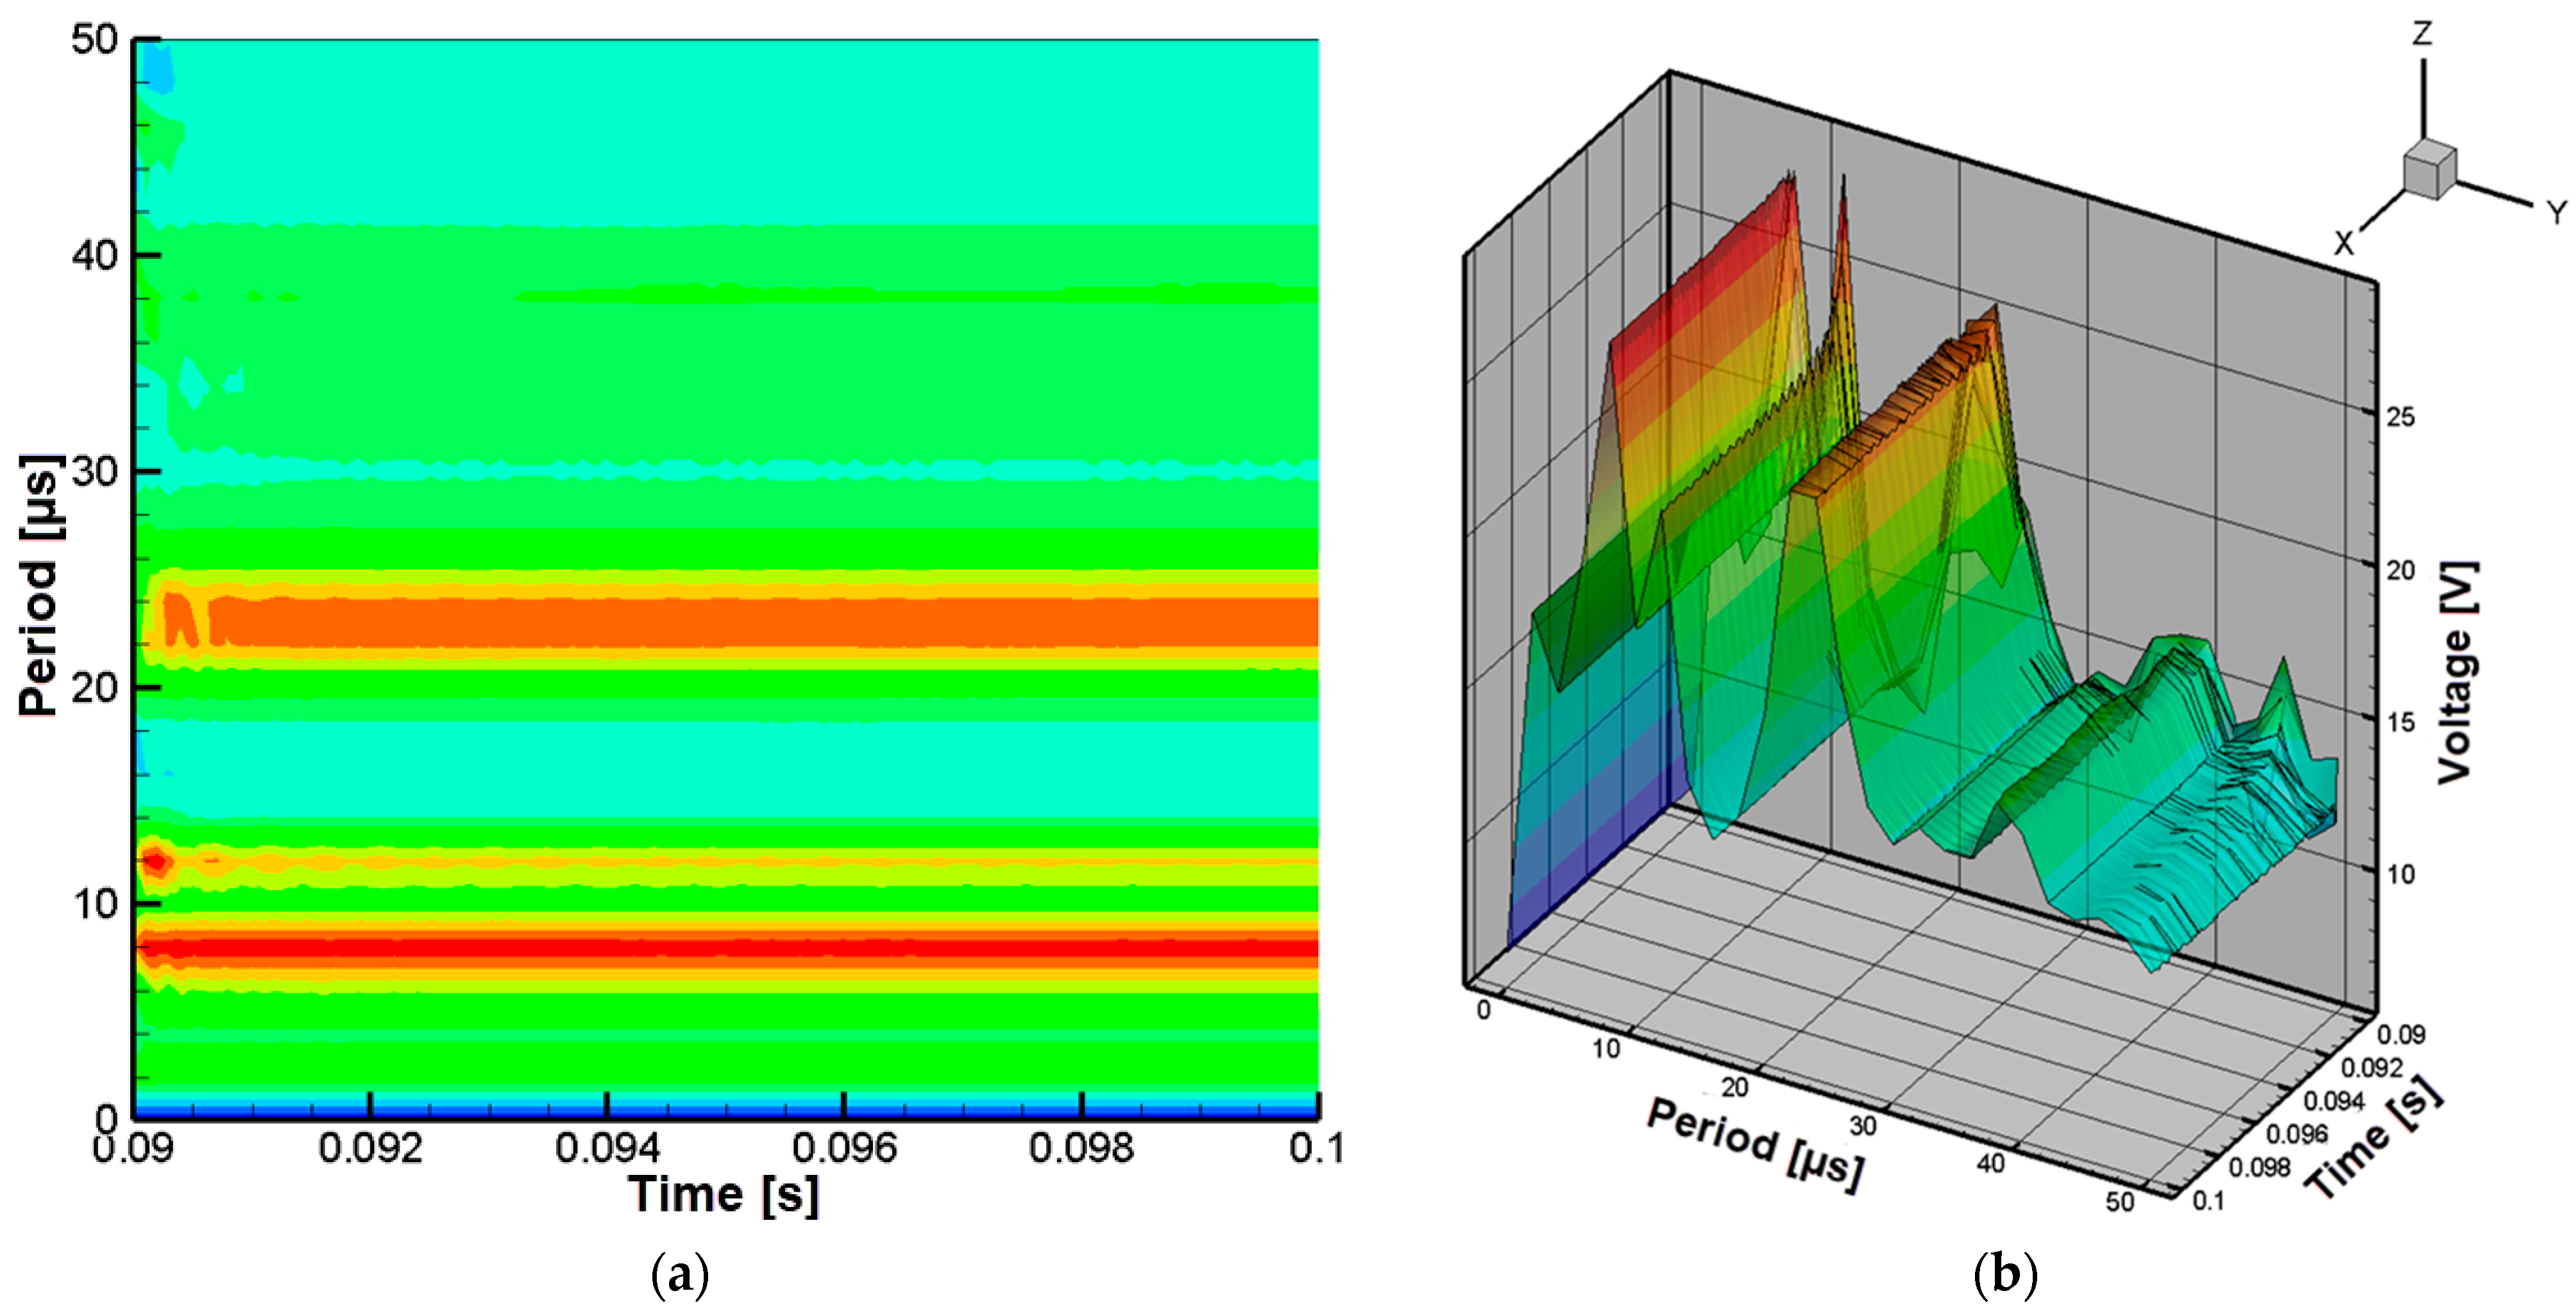
The graph in Figure 14a shows that the voltage reaches its highest values at control signal periods of approximately 8 µs, 12 µs, and 22–24 µs, corresponding to a coupling coefficient of 0.9. Figure 14b presents the three-dimensional representation, confirming that the voltage stabilizes at peak values of about 28 V at 8 µs, 22 V at 12 µs, and 25 V between 20–22 µs.
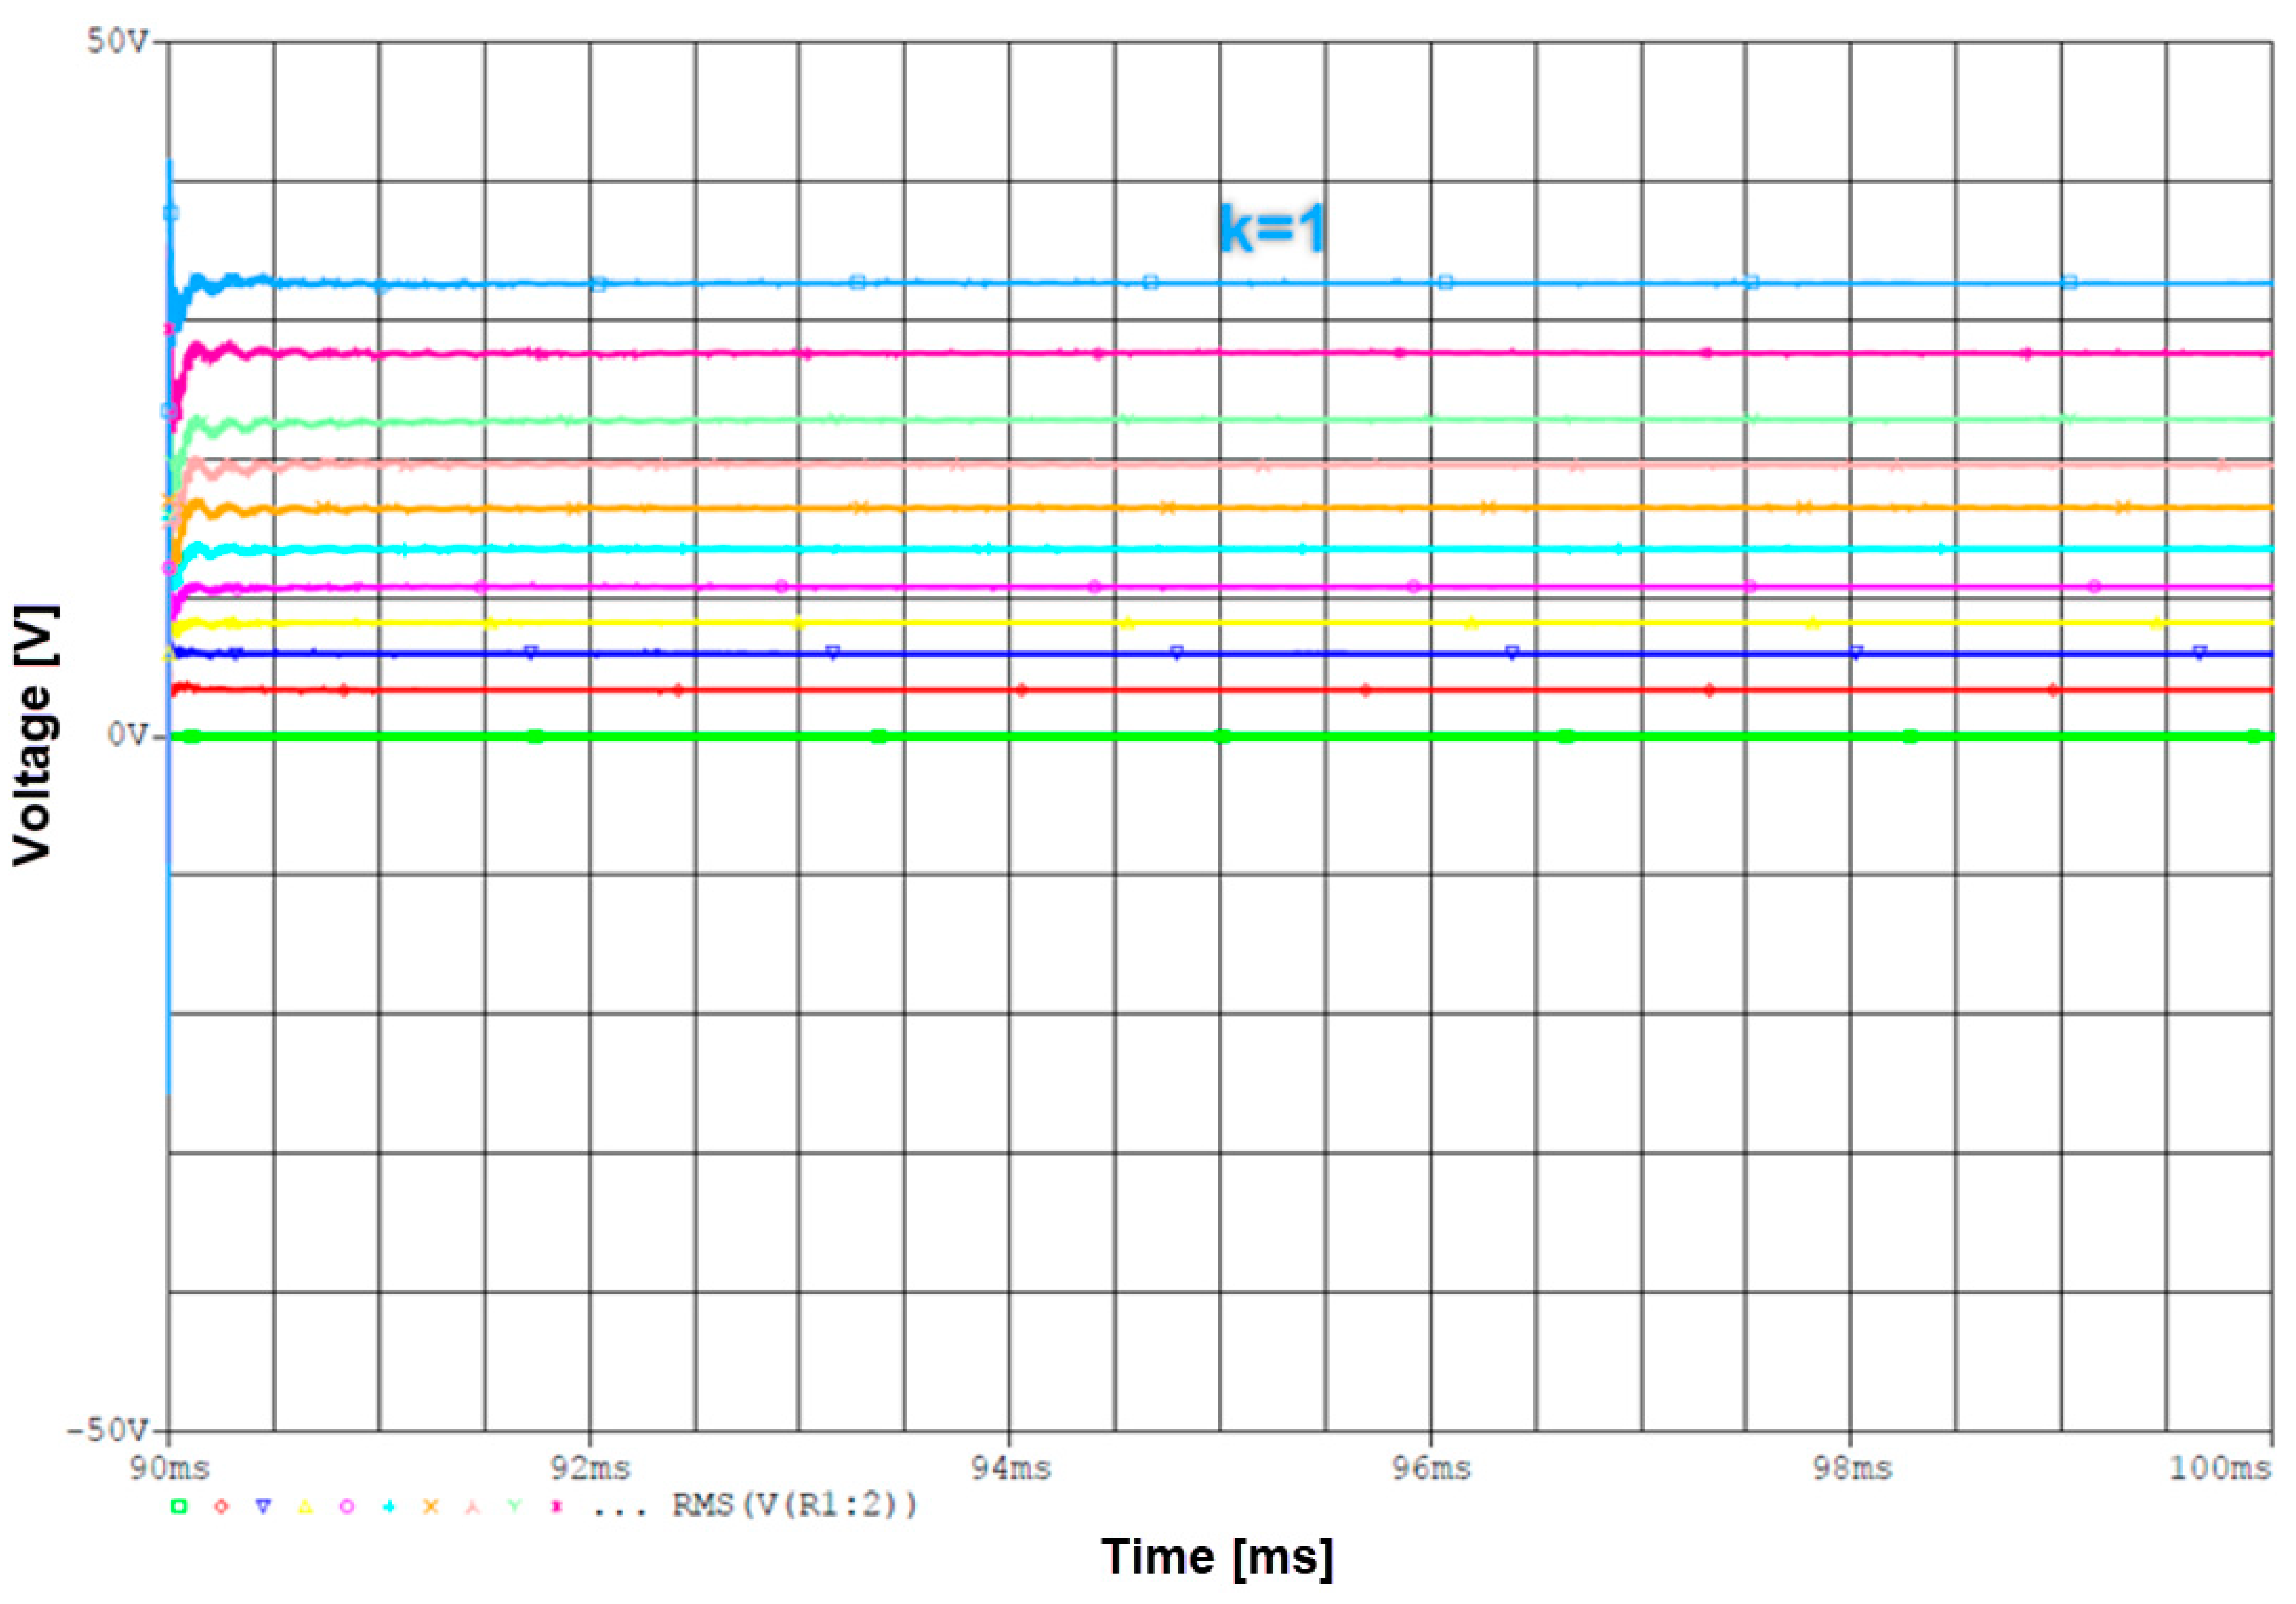
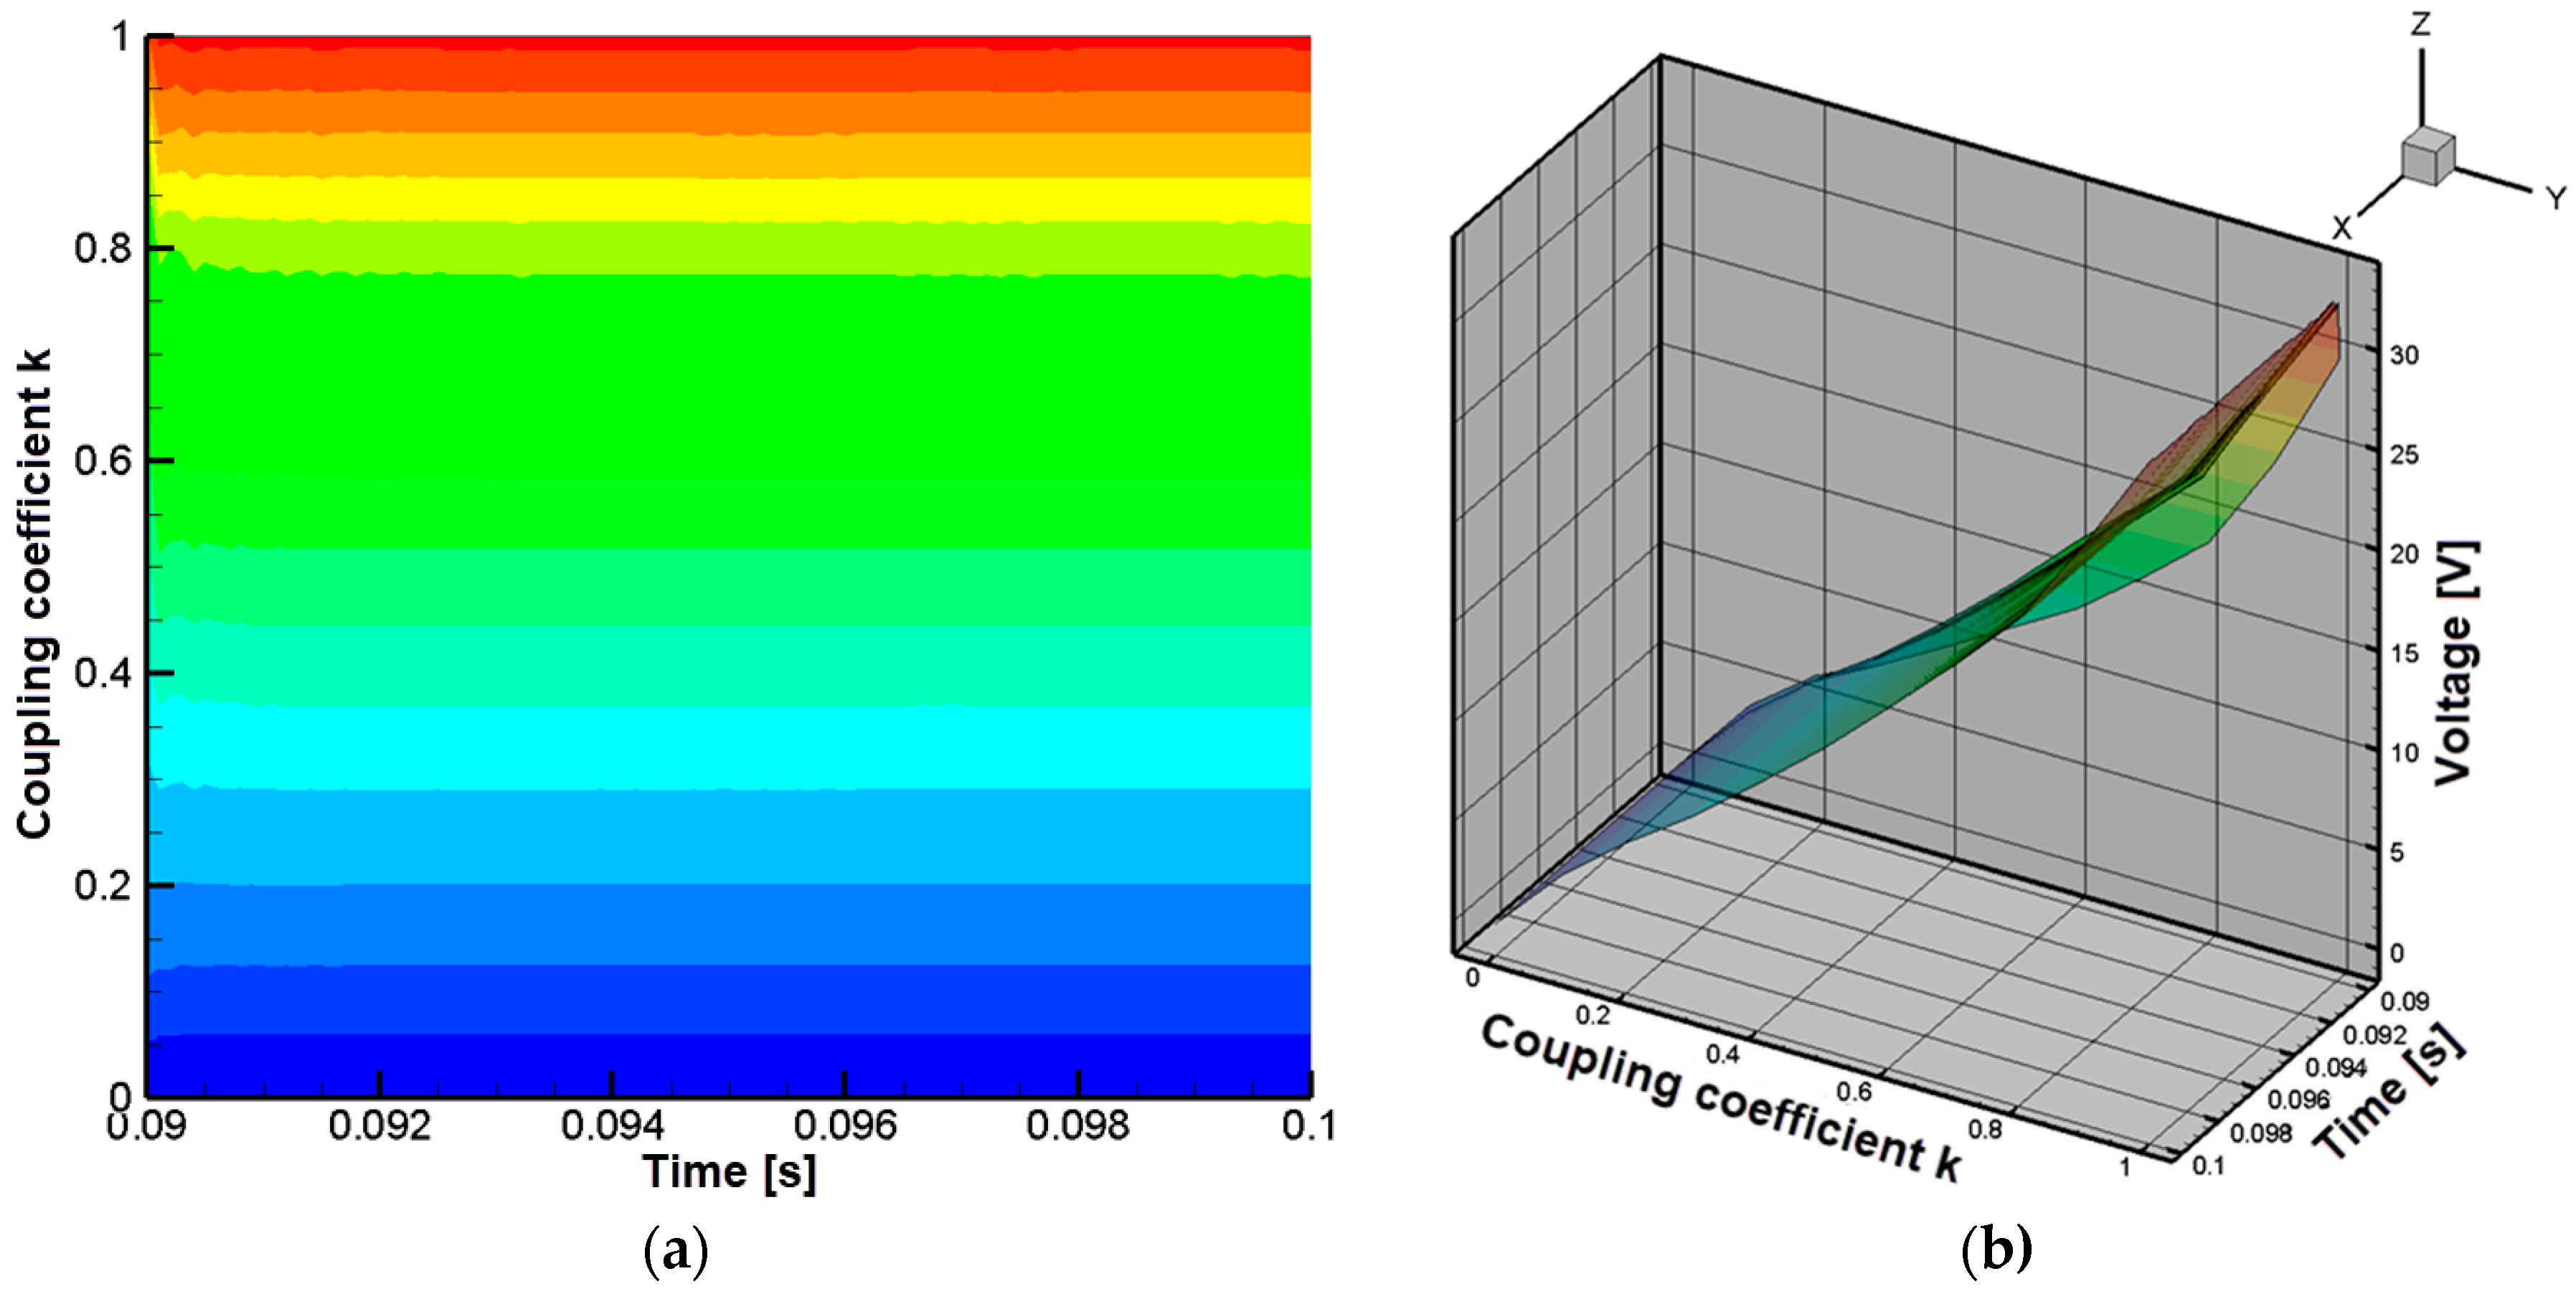
Figure 15a shows that the voltage reaches its maximum value at a control signal period of approximately 8 µs, corresponding to a coupling coefficient of 1. Analysis of the three-dimensional results in Figure 15b reveals that the maximum voltage is about 33 V, occurring at the same period.
In conclusion, analysis of the ten studied cases shows that the highest induced voltage values for the control period of the second transistor occurred as follows: in four cases at 18 µs, in two cases at 22 µs, in two cases at 20 µs, and in two cases at 8 µs.
Based on these findings, the circuit in Figure 16 was configured with the second transistor’s control signal period set to 8 µs, 18 µs, 20 µs, and 22 µs, in order to identify the coupling coefficient value that yields the highest induced voltage for each of the four selected control periods.
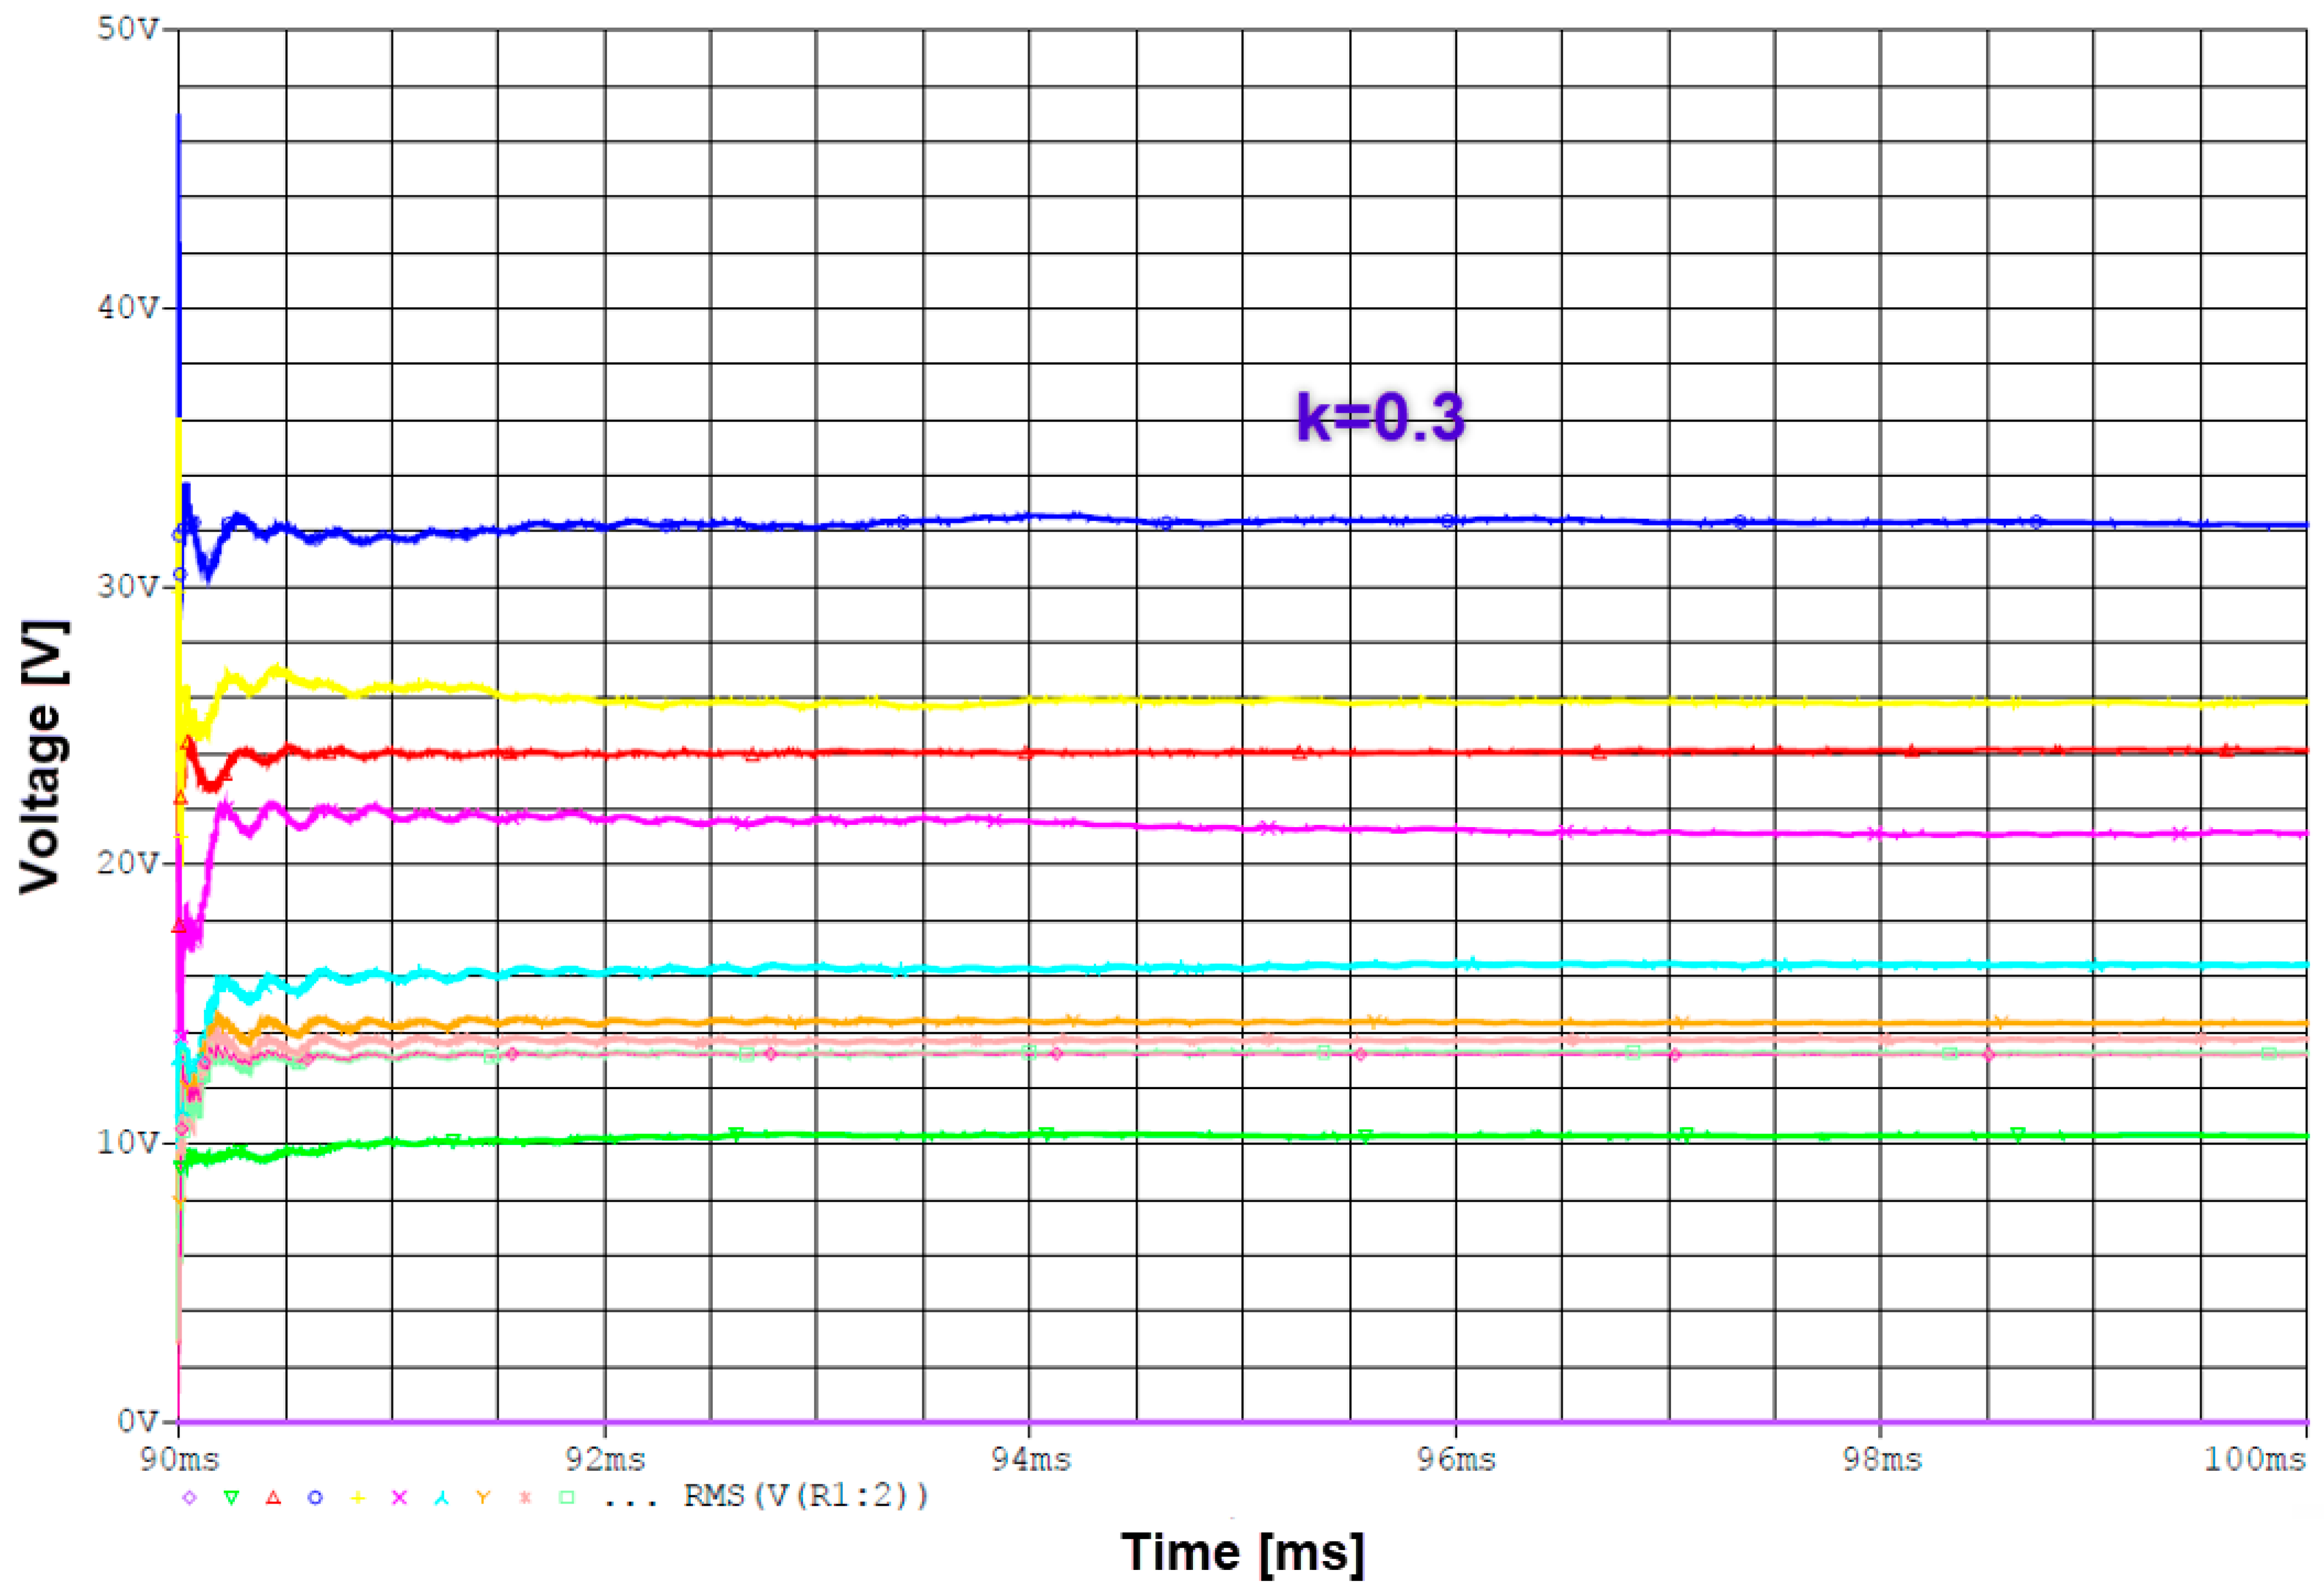
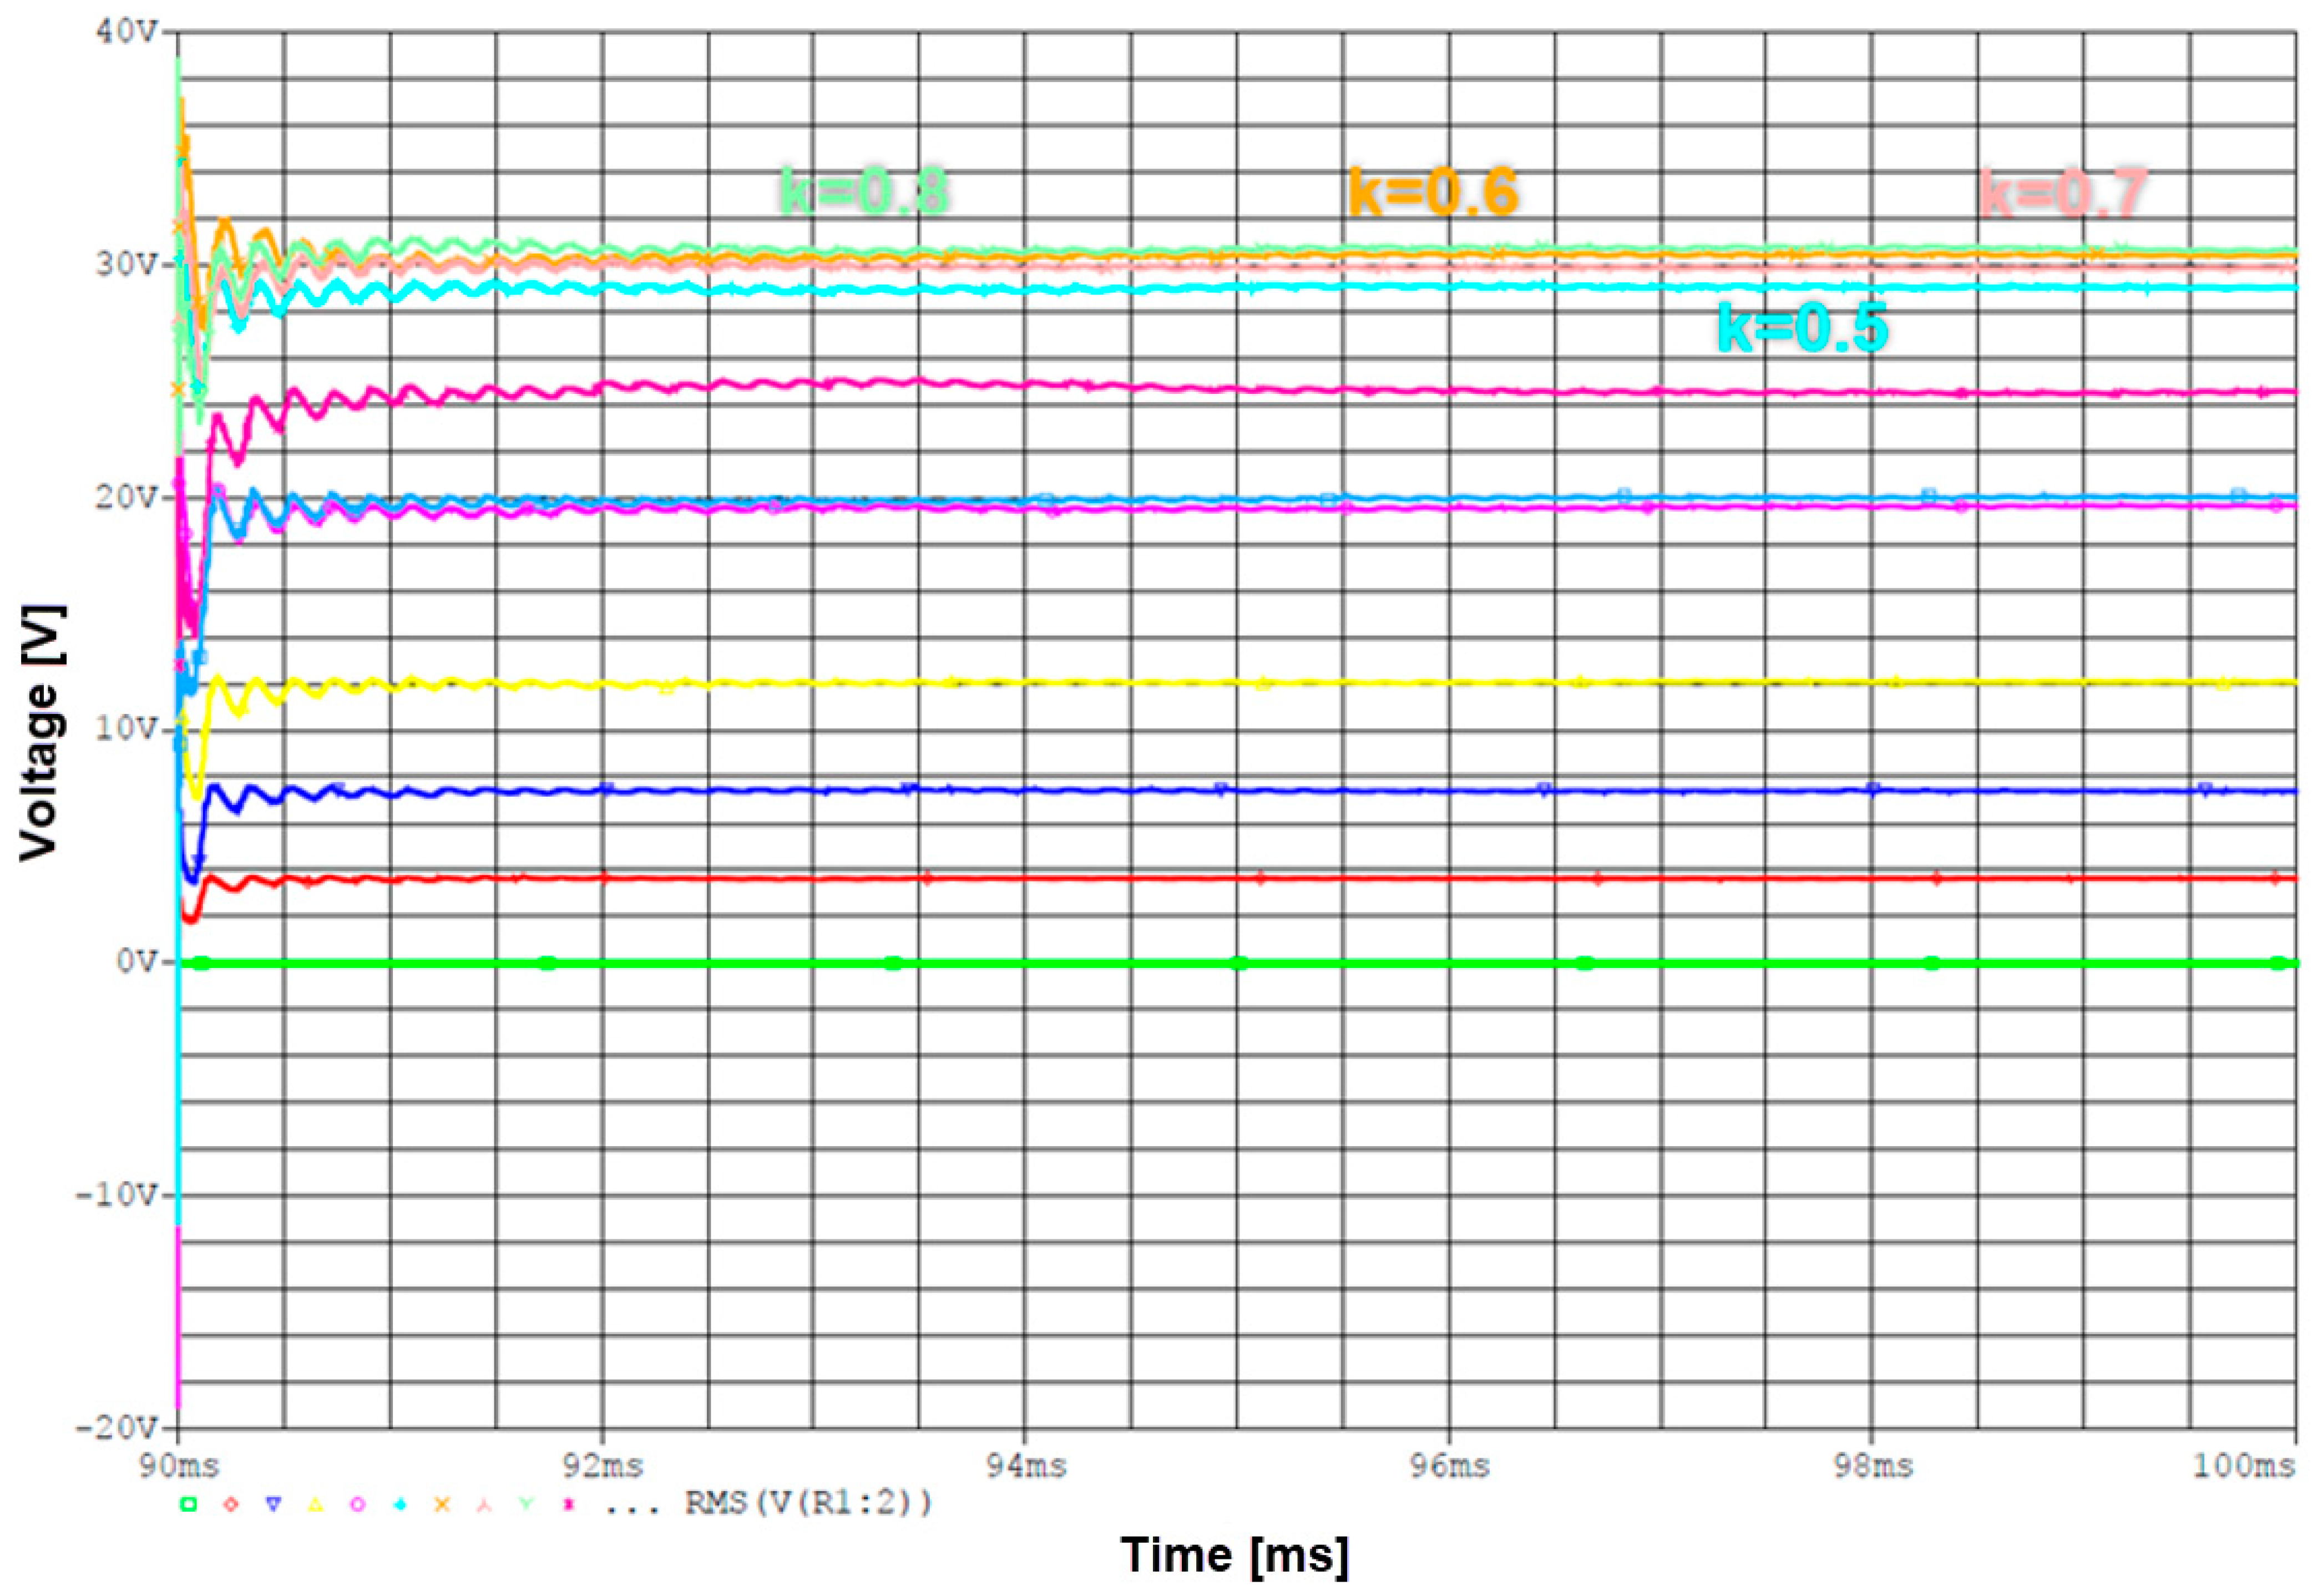
Based on the simulation results shown in Figure 17, the maximum induced voltage is obtained at a coupling coefficient of 0.3.
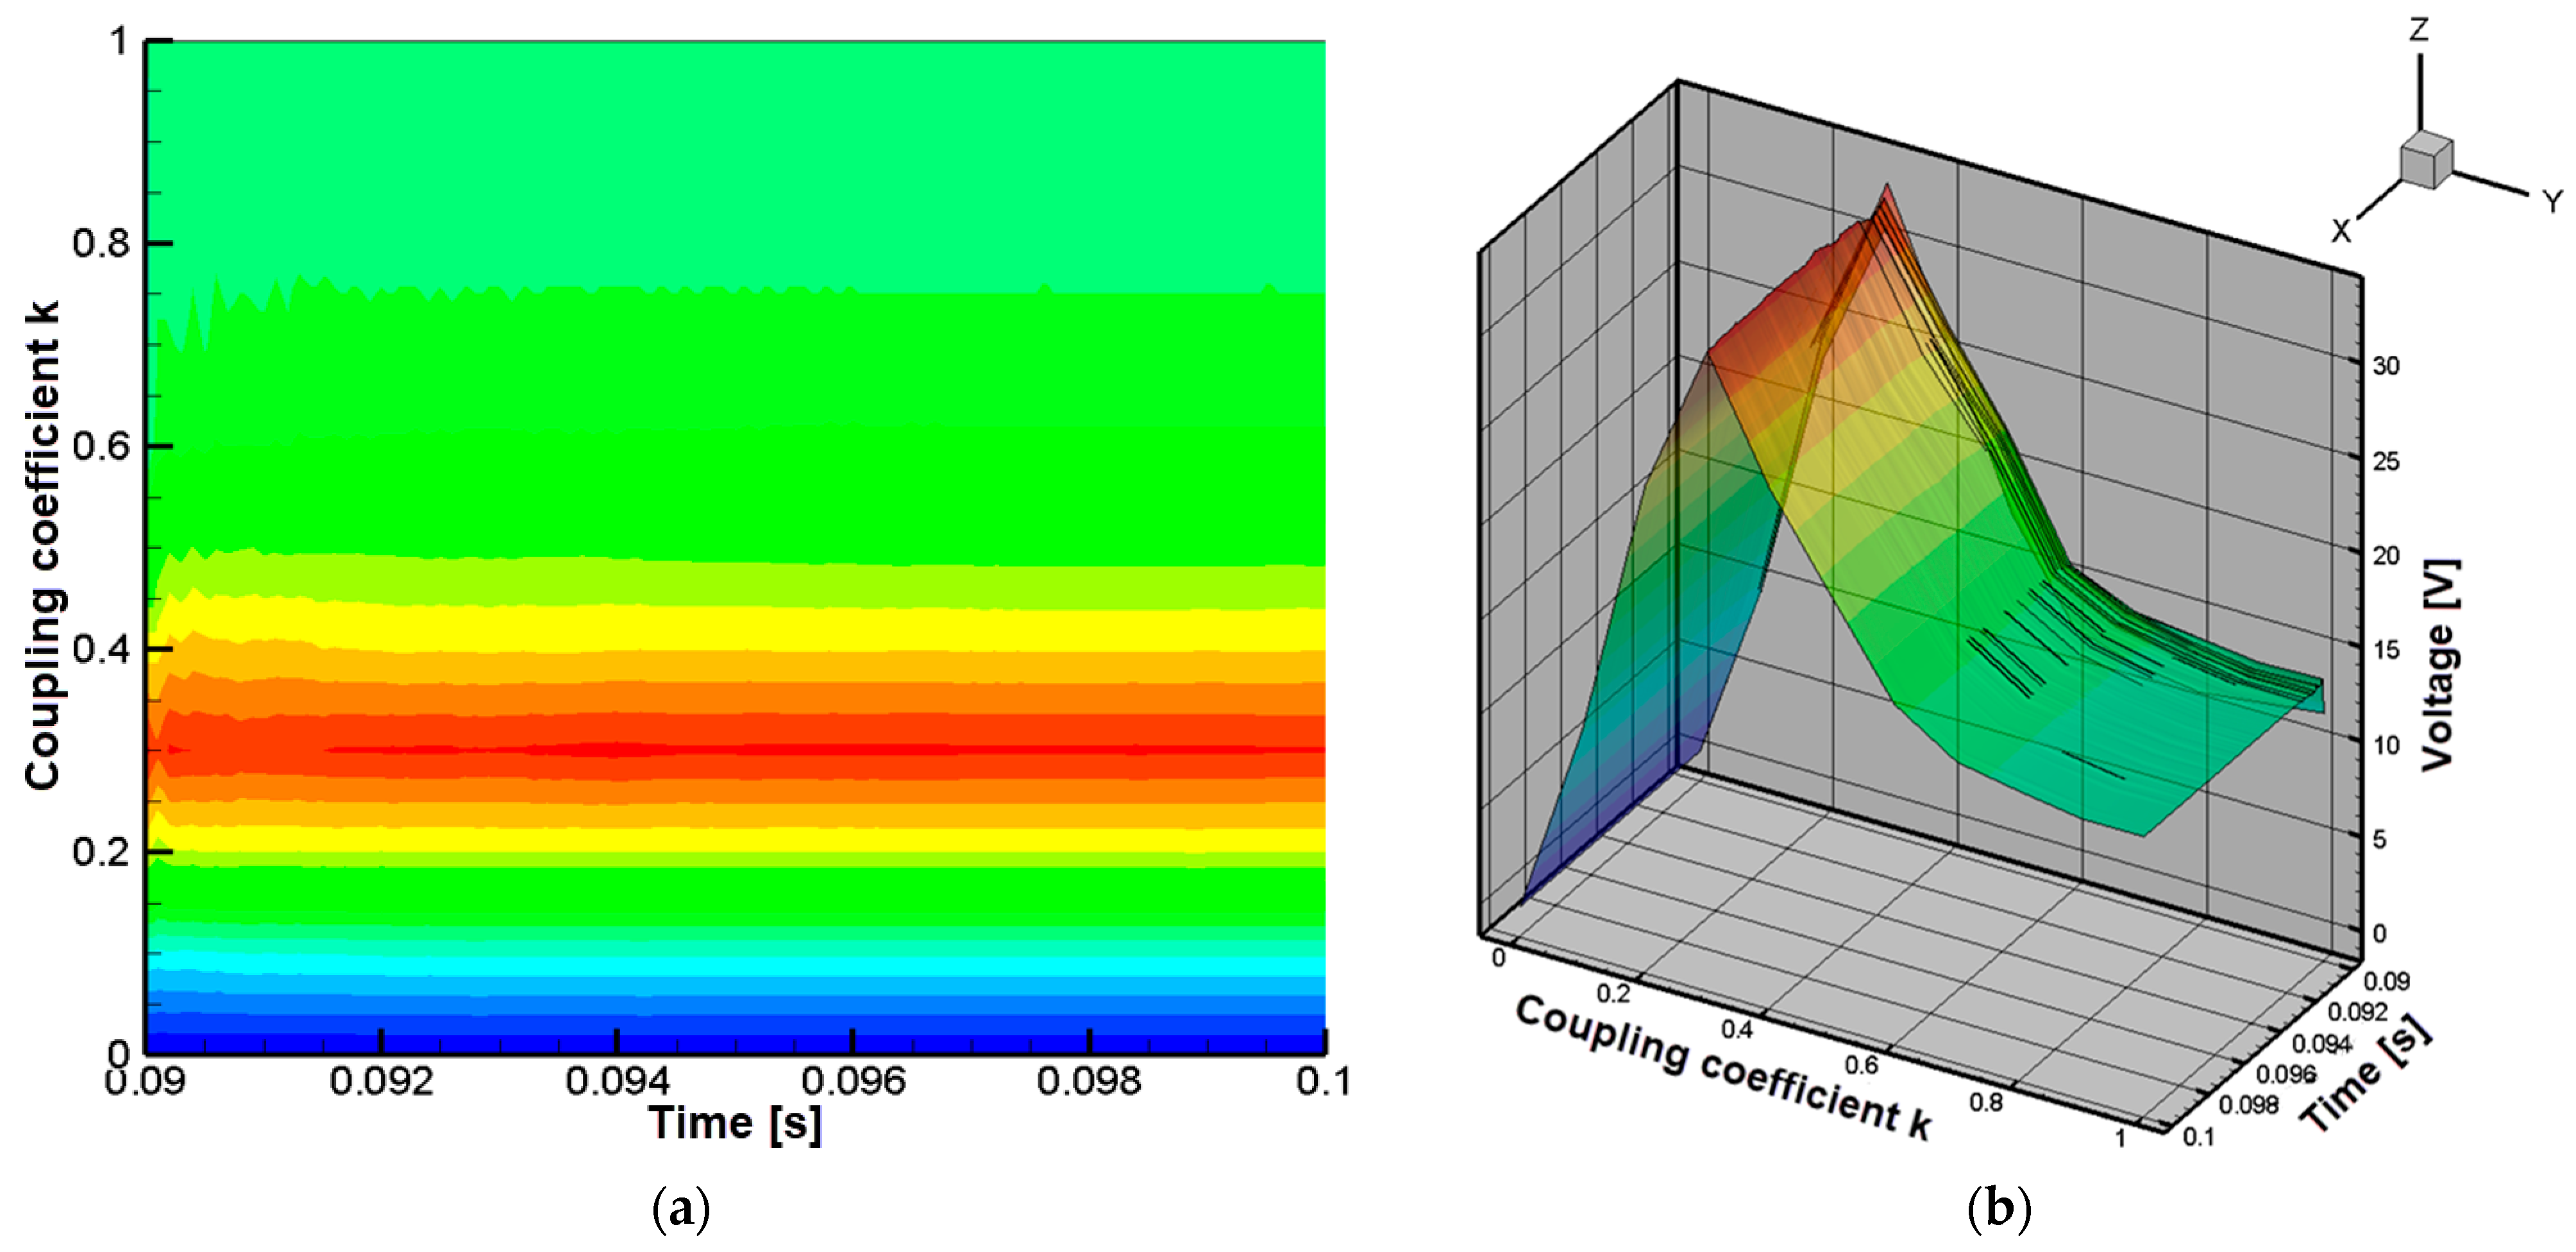
Figure 18a further confirms that the maximum induced voltage occurs at a coupling coefficient of approximately 0.3. Figure 18b illustrates that at the same coupling coefficient, the induced voltage reaches about 32 V.
For the case where the control signal period is set to 8 µs, Figure 19 shows that the maximum induced voltage occurs at a coupling coefficient of 1.
Figure 20a shows that the induced voltage reaches its peak at a coupling coefficient of 1. Figure 20b confirms that at the same coupling coefficient, the induced voltage is approximately 32 V.
For the case where the control signal period is 20 µs, Figure 21 shows that the maximum induced voltage is achieved at a coupling coefficient of 0.6.
Figure 22a shows that the induced voltage reaches its maximum at a coupling coefficient of 0.6. Figure 22b confirms this result, indicating that at the same coupling coefficient, the induced voltage approaches approximately 32 V.
In the final case analyzed, namely when the control signal period is 22 µs, Figure 23. shows that the maximum induced voltage is obtained for a coupling coefficient ranging between 0.5 and 0.8.
In Figure 24a, it can be observed that the induced voltage reaches its highest value within this coupling coefficient range. Furthermore, Figure 24b indicates that around a coupling coefficient between 0.5 and 0.8, the induced voltage approaches approximately 30 V.

3.2. Impact of the Receiver Coil Position on the Parameters of the Wireless Power Transfer System

The design and analysis of the wireless power transfer system were carried out through numerical modeling using the ANSYS software package version 2023R2, specifically the Maxwell 3D Design program [16,17]. This research focuses on evaluating the influence of the distance between the two coils on the coupling coefficient [18,19,20]. For these studies, the same real coils described in the previous chapter were used [21,22,23]. Figure 25 presents an overview of the wireless power transfer system implemented in ANSYS, based on the two coils.
The following section presents the impact of the receiver coil position on the coupling coefficient, the mutual and self-inductances of the two coils, the coil resistances, the magnetic flux, and the power losses [24,25,26].
(a)
Coupling coefficient
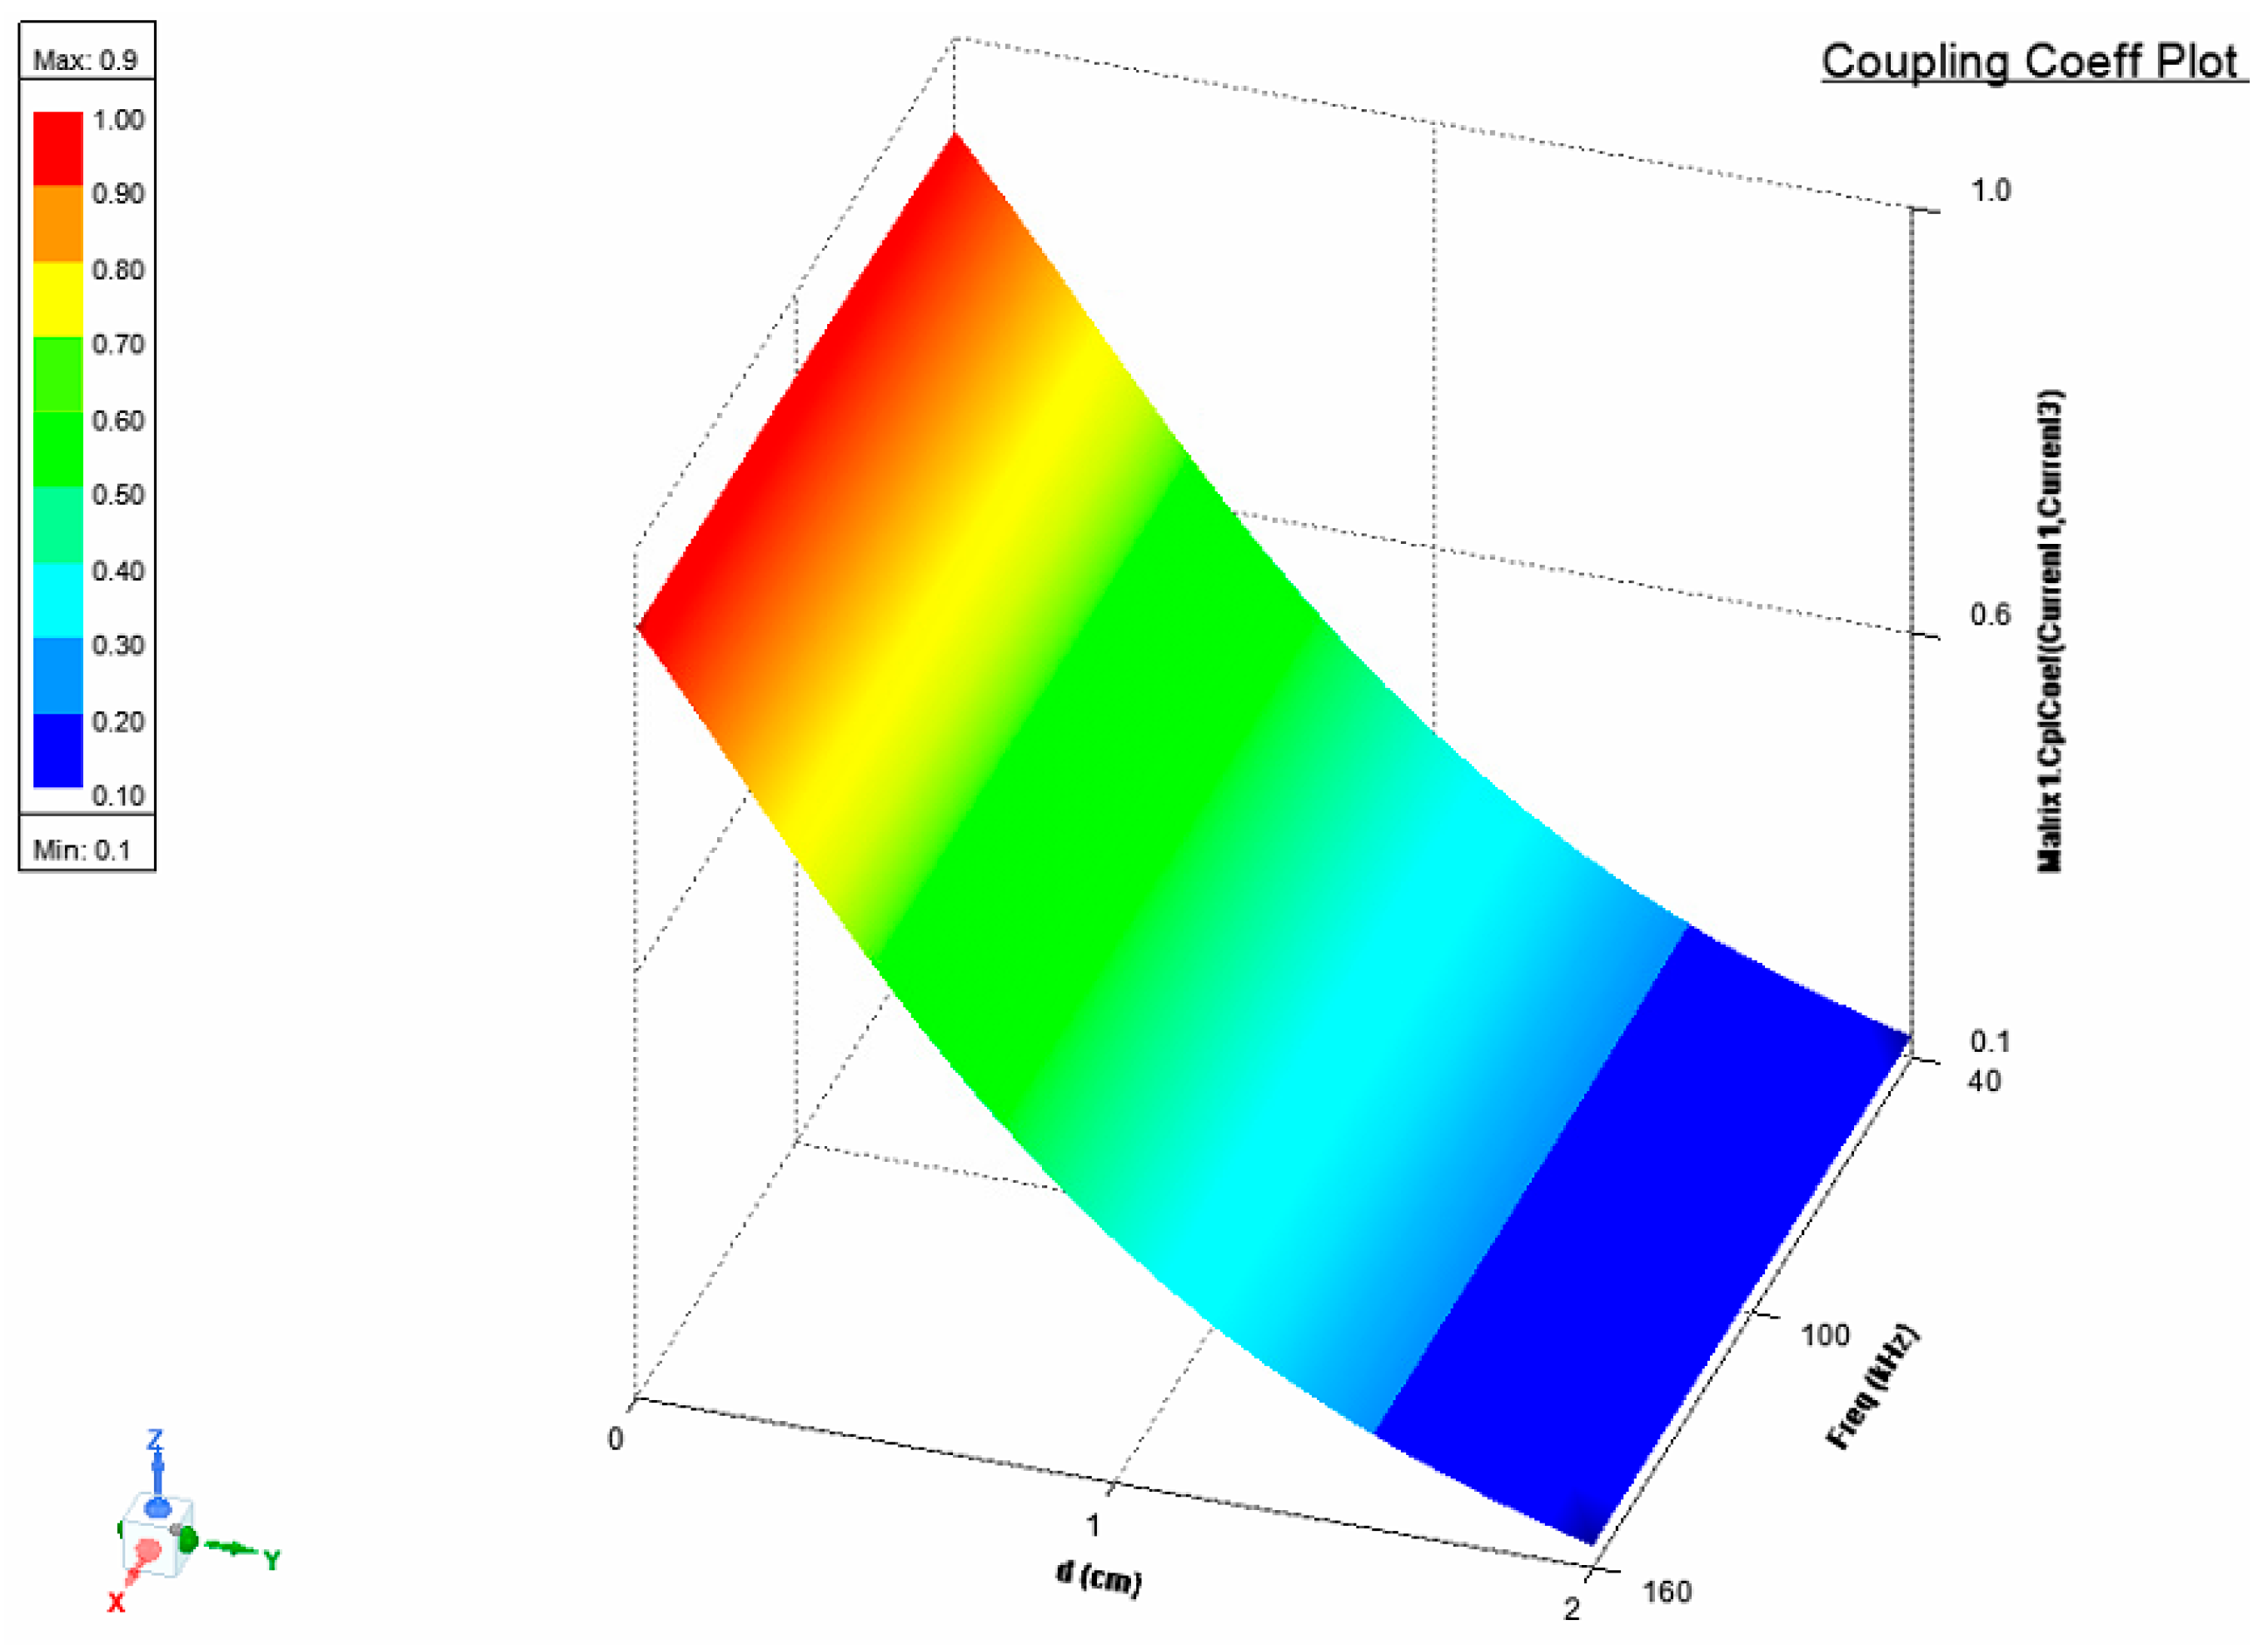
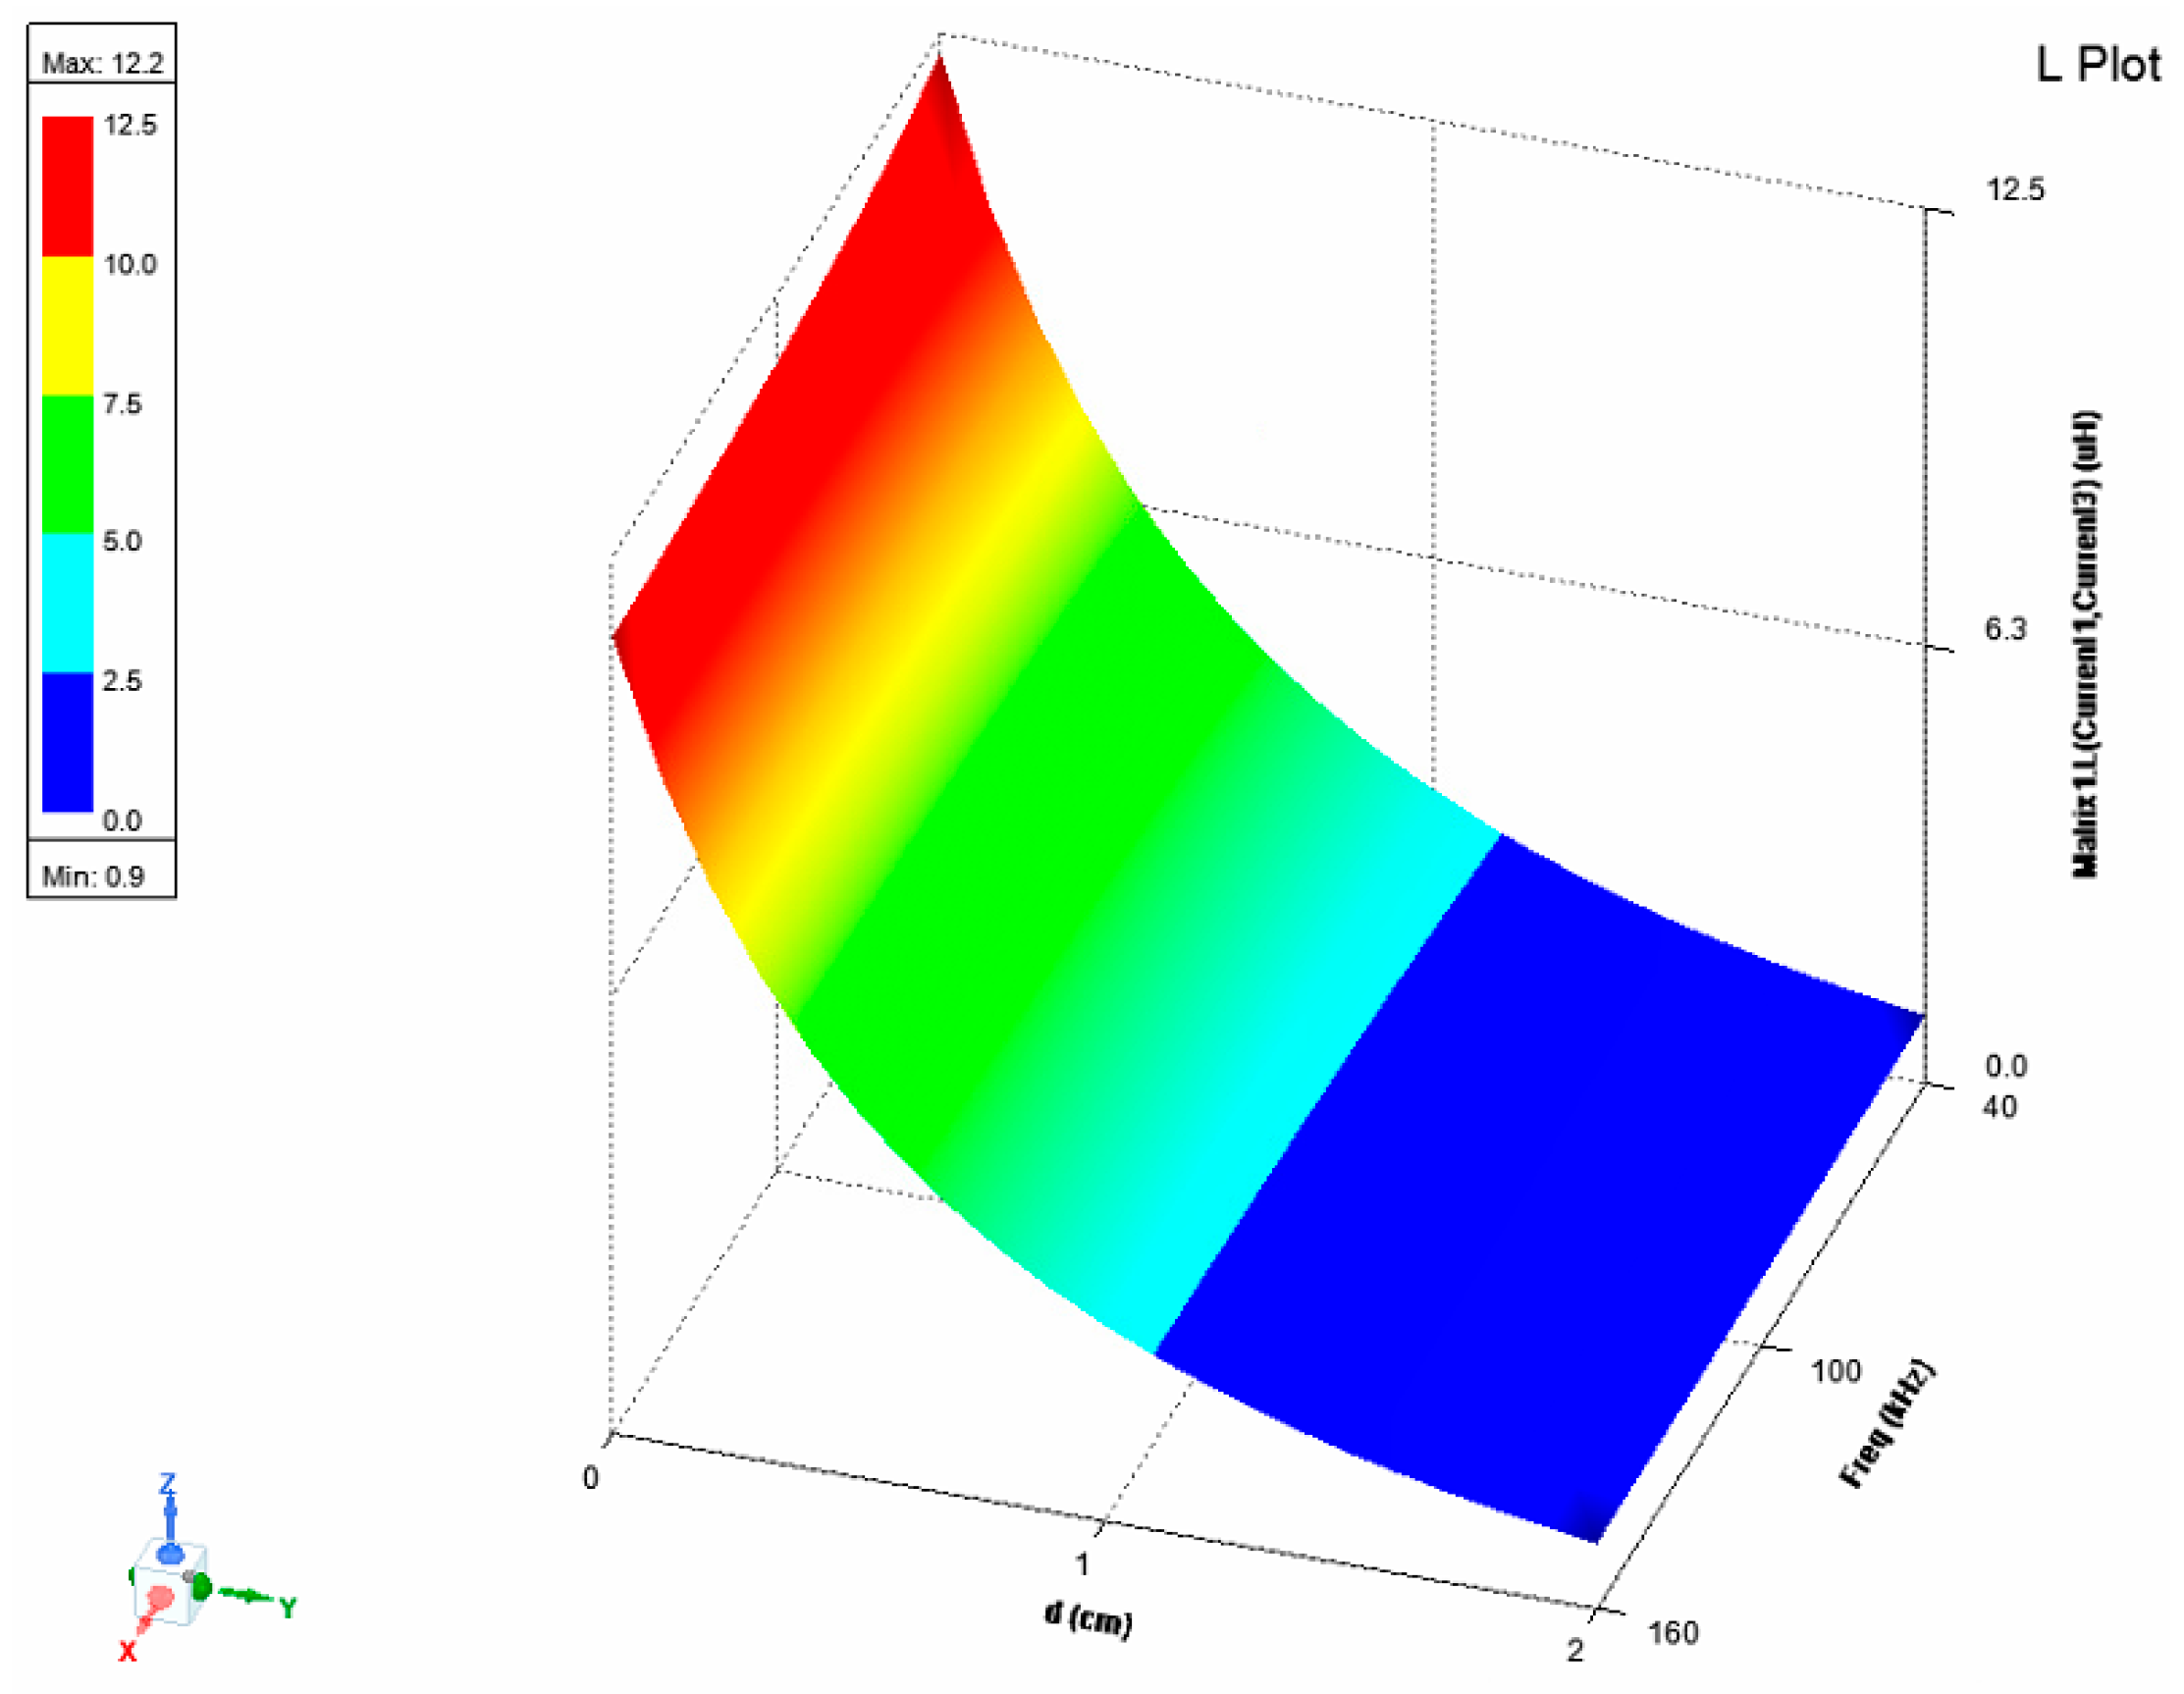
From Figure 26 and the data presented in Table A1, it can be concluded that the coupling coefficient is inversely proportional to the distance between the coils [27,28,29]. This trend is evident from the first analyzed case, where the distance was 0 mm and the coupling coefficient was 0.915, to the final case, where the distance increased to 20 mm and the coupling coefficient decreased to 0.123 (Table A1).
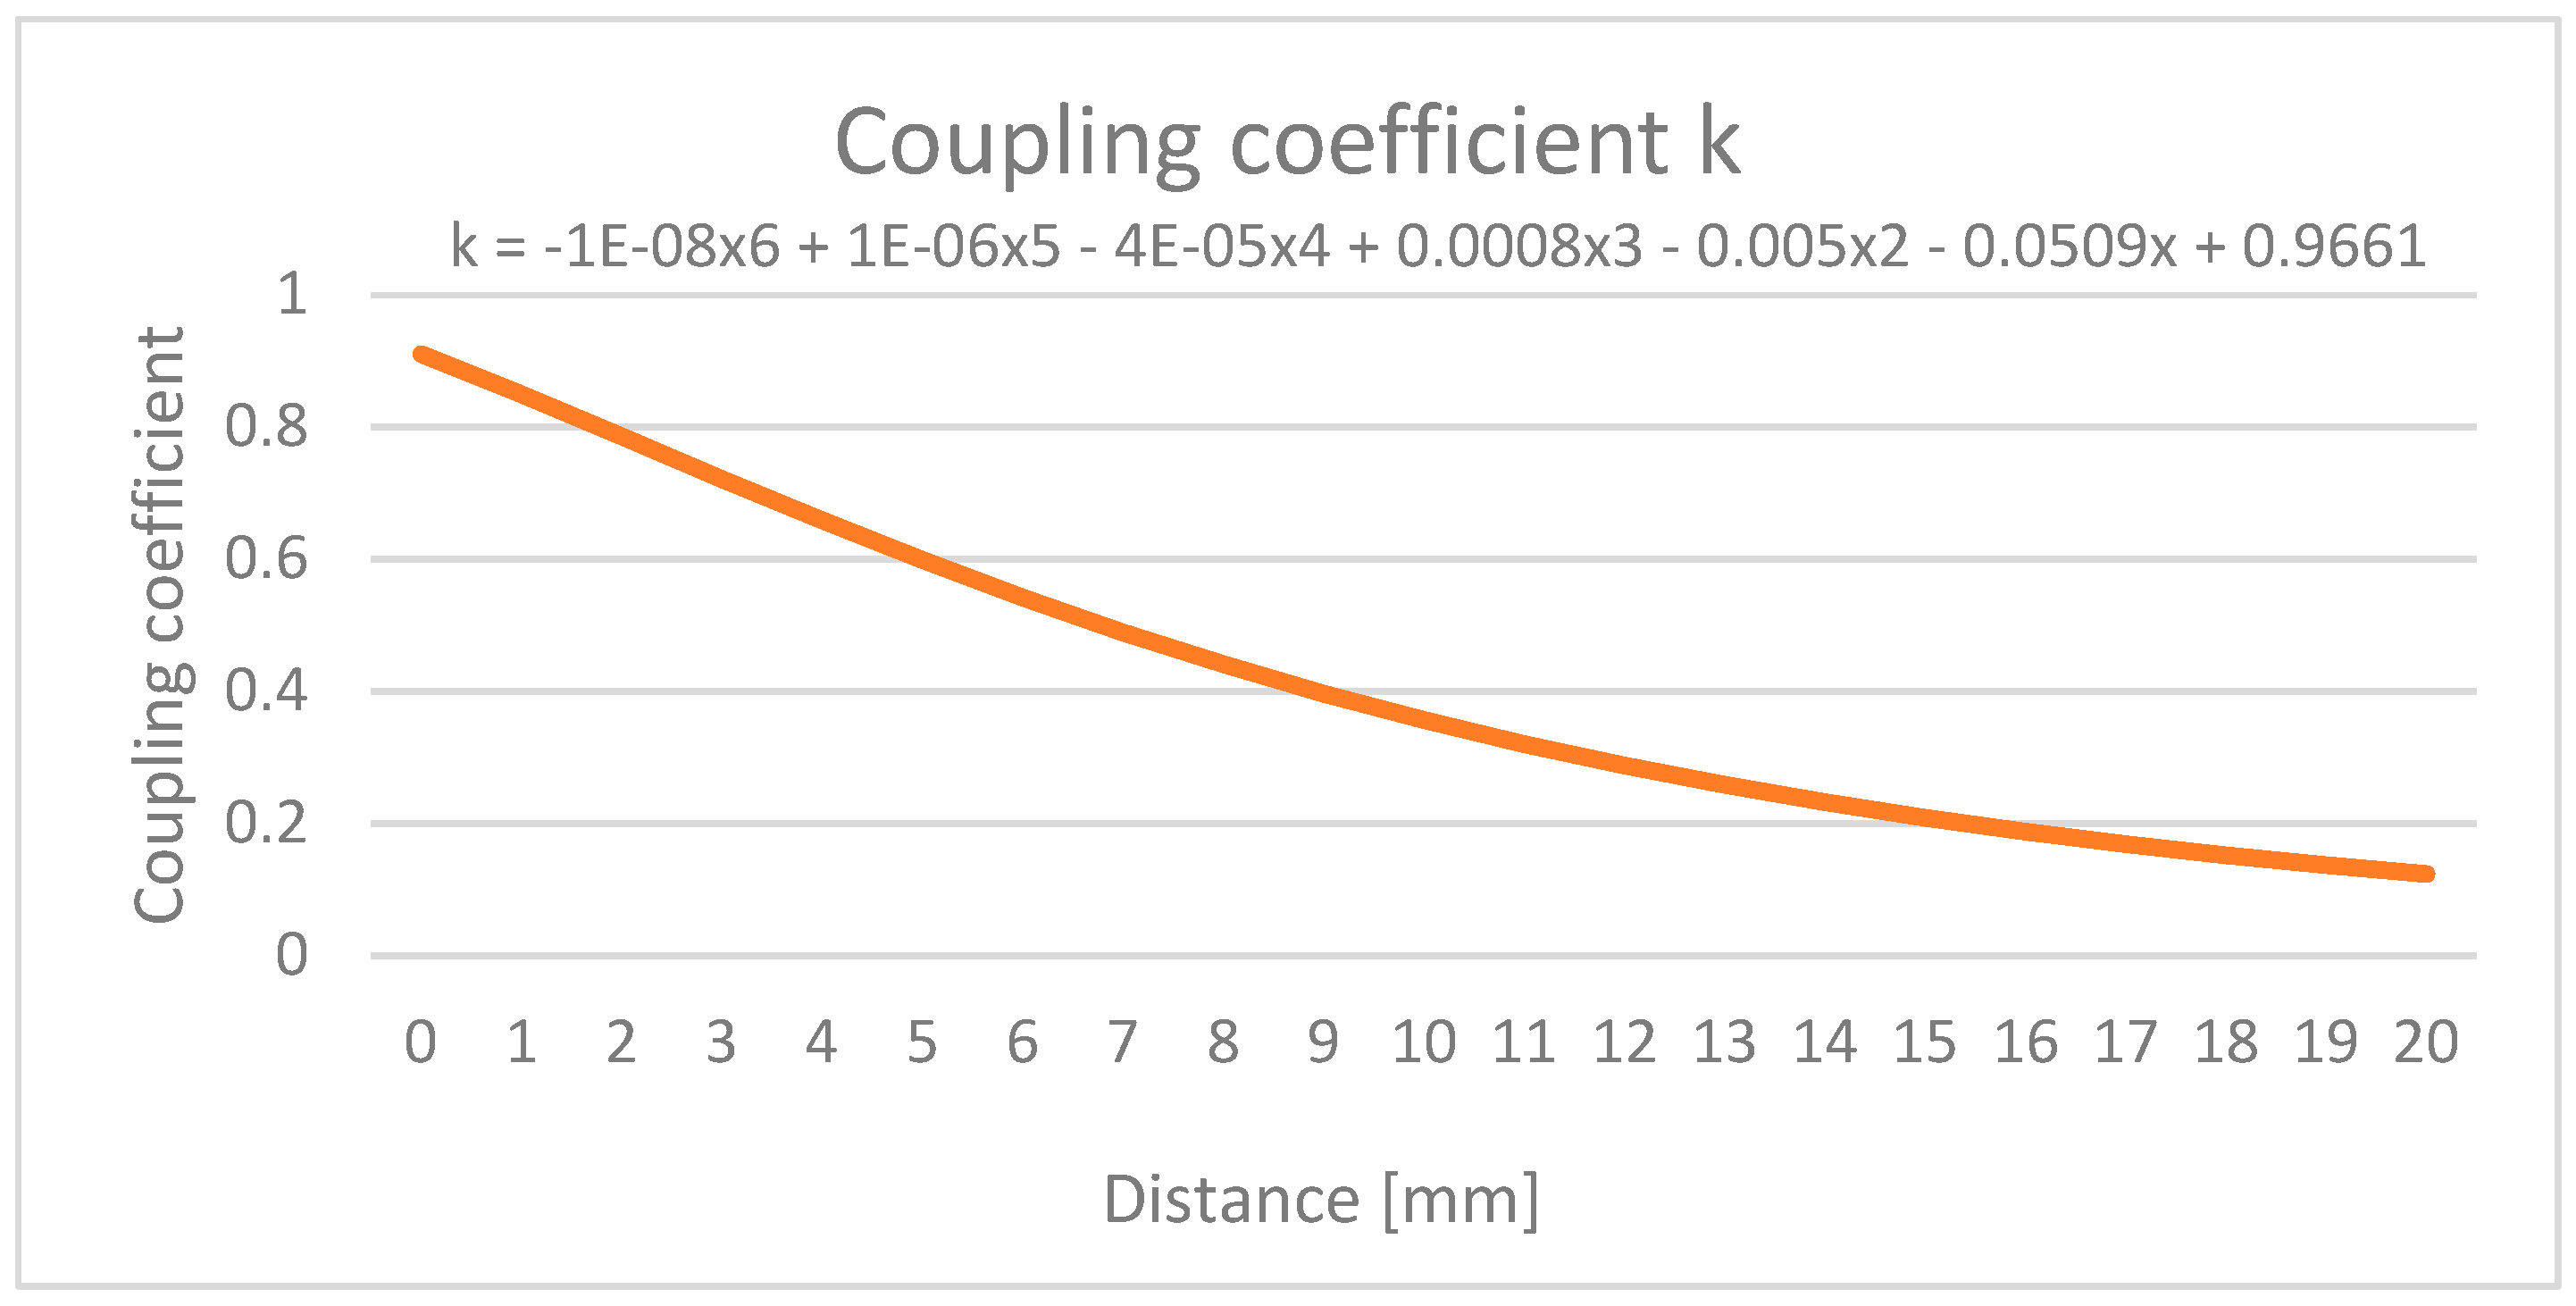
For clearer visualization and interpretation of the results, the simulation data were imported into Excel, where a graph of the coupling coefficient (k) as a function of distance was generated for frequencies ranging from 40 to 160 kHz. This graph is shown in Figure 27.
Using this representation, an analytical expression was sought to closely fit the curve describing the variation in the coupling coefficient with distance between the transmitter and receiver coils. As a result, a sixth-degree polynomial was obtained, expressed by Equation (2):
k = 1 E 8 x 6 + 1 E 6 x 5 4 E 5 x 4 + 0.0008 x 3 0.005 x 2 0.0509 x + 0.9661
(b)
Mutual inductance
Analyzing the results of the mutual inductance as a function of the distance between the two coils, the same trend observed for the coupling coefficient is confirmed—namely, the inductance decreases as the distance increases (Table A2).
In this case, the specific values for different coil separations are also of interest. From the graphical representation, it can be seen that at a distance of 0 mm, the mutual inductance reaches a maximum value of 297.07 ηH, while at the opposite end, with a distance of 20 mm, it decreases to 10.69 ηH (Figure 28).
Based on the obtained results, it can be concluded that the magnetic flux density is inversely proportional to the distance between the transmitter and receiver coils. The self-inductance exhibits little variation with frequency but decreases as the distance increases. Both the mutual inductance and the coupling coefficient are inversely proportional to the coil separation. In contrast, the resistance of the two coils varies with both frequency and distance.

4. Construction and Experimental Testing of the Designed Wireless Power Transfer System

4.1. Experimental Construction of the Wireless Power Transfer System

Considering the results obtained from the analyses performed for the design and construction of a dual-frequency wireless power transfer system—based on numerical modeling using both equivalent circuits and 3D CAD models—the optimized prototype was built and tested experimentally.
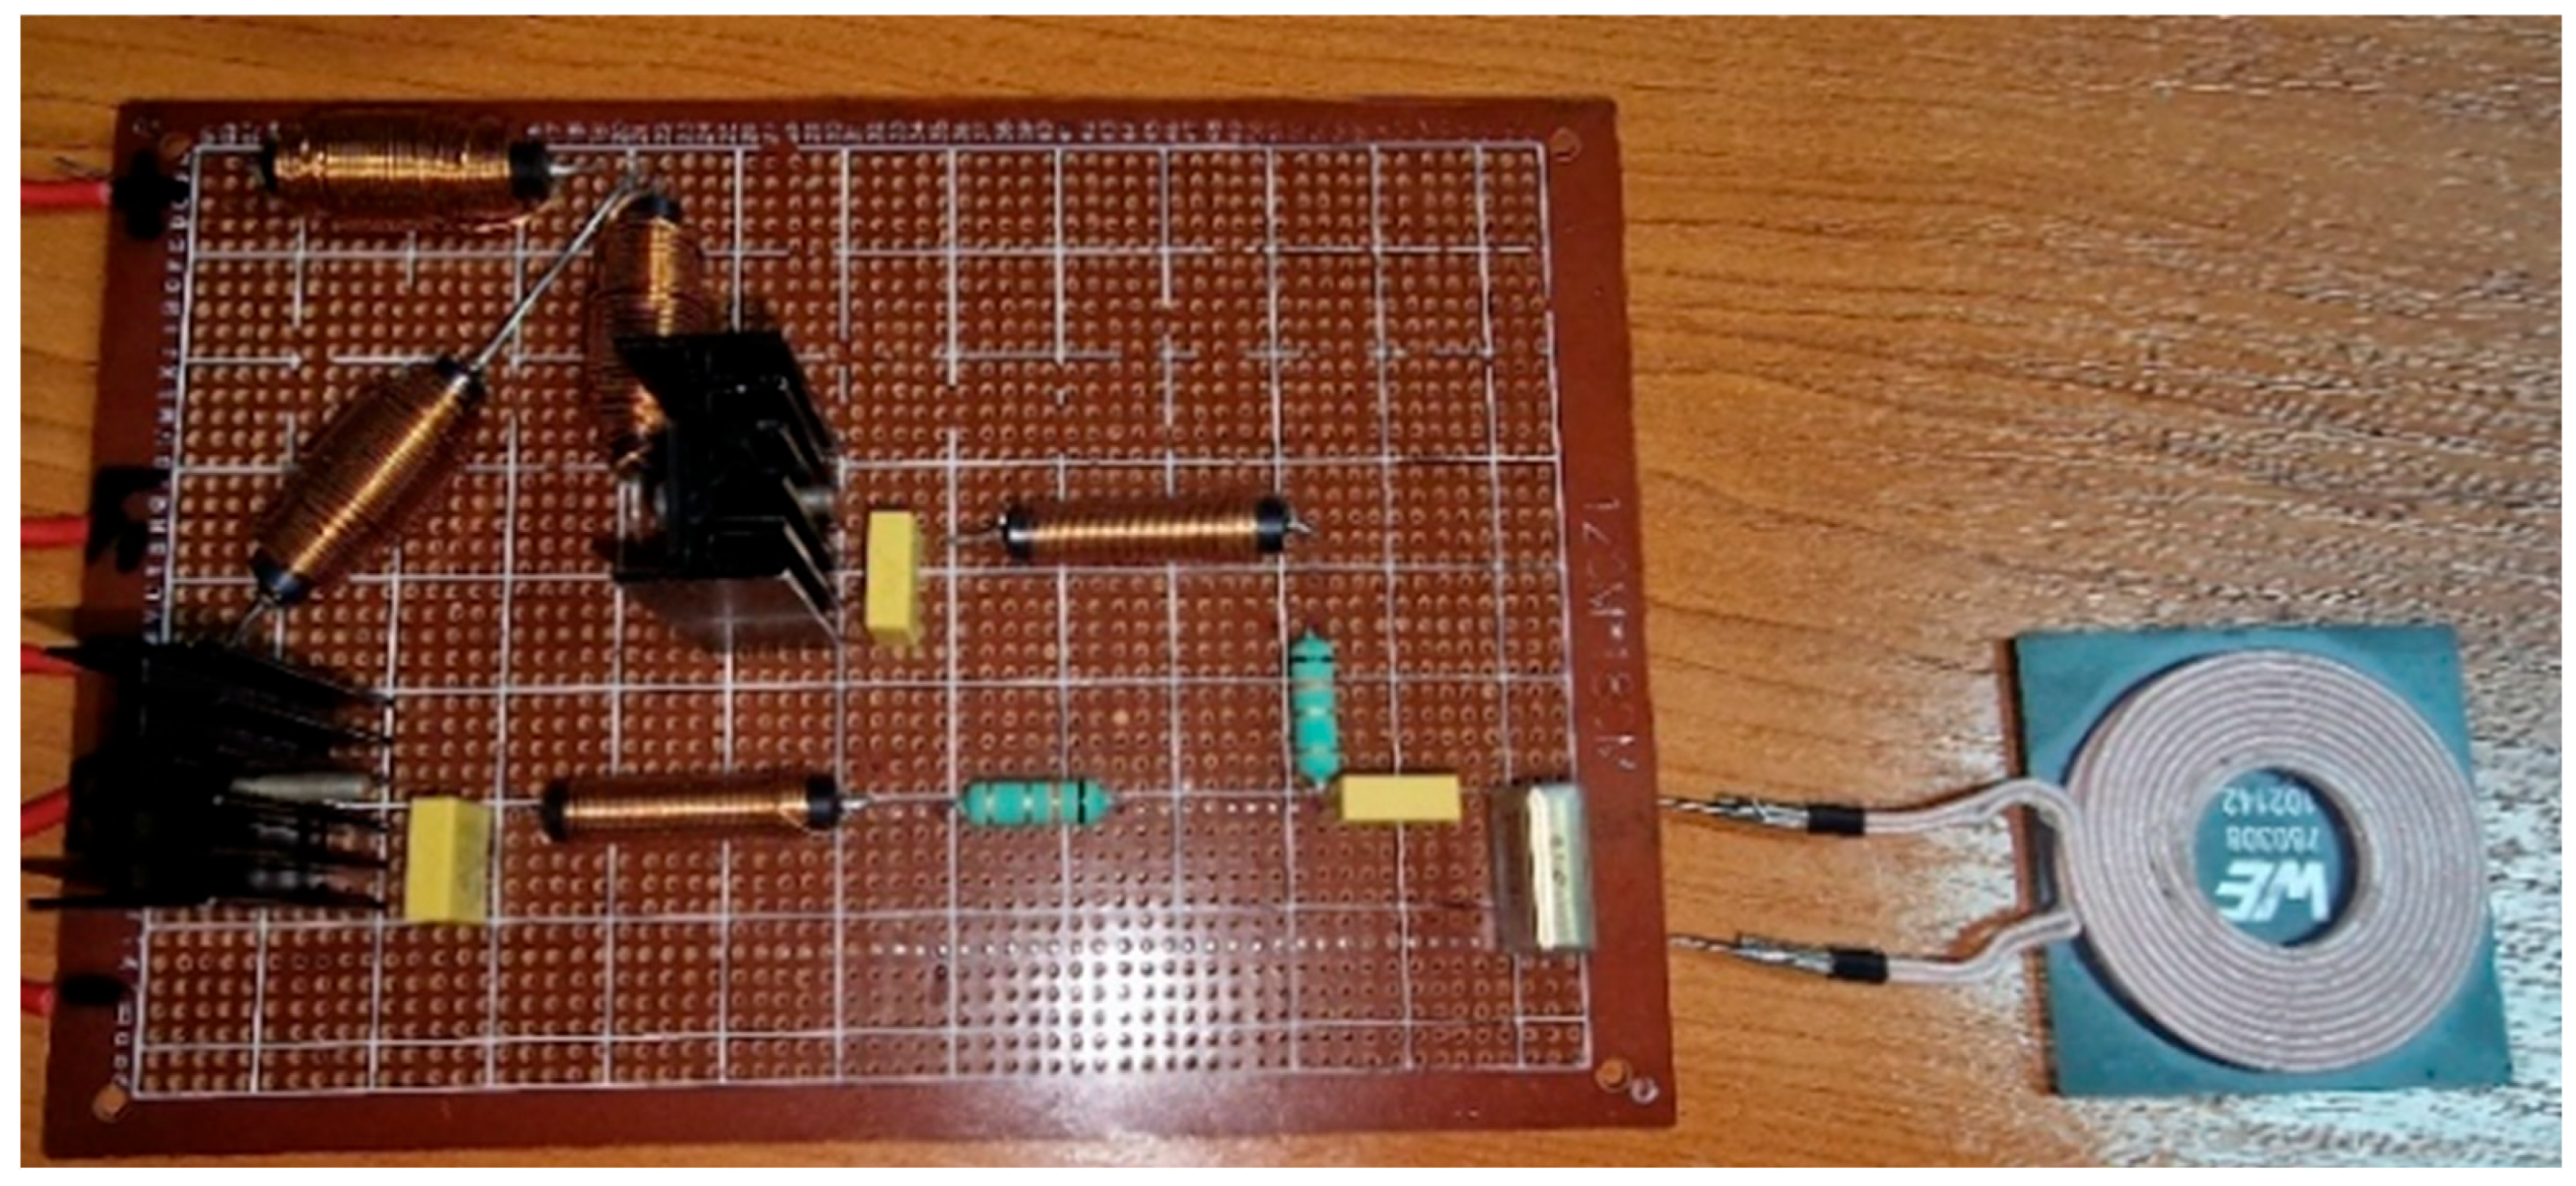
The proposed optimized wireless system, developed according to the equivalent circuit described in Section Analysis of the Optimized Wireless Power Transfer System Using Real Coil Parameters and shown in Figure 4, consists of two IRLR3410 transistors, three 500 µH coils, two 100 µH coils, two 15 ηF capacitors, two 1.3 Ω resistors, one 68 ηF capacitor, one 100 ηF capacitor, and the transmitter and receiver coils modeled in Section 3 [30,31,32,33]. Figure 29 presents the transmitter circuit of the wireless power transfer system, constructed according to the design from Section 3.1 and illustrated in Figure 1.
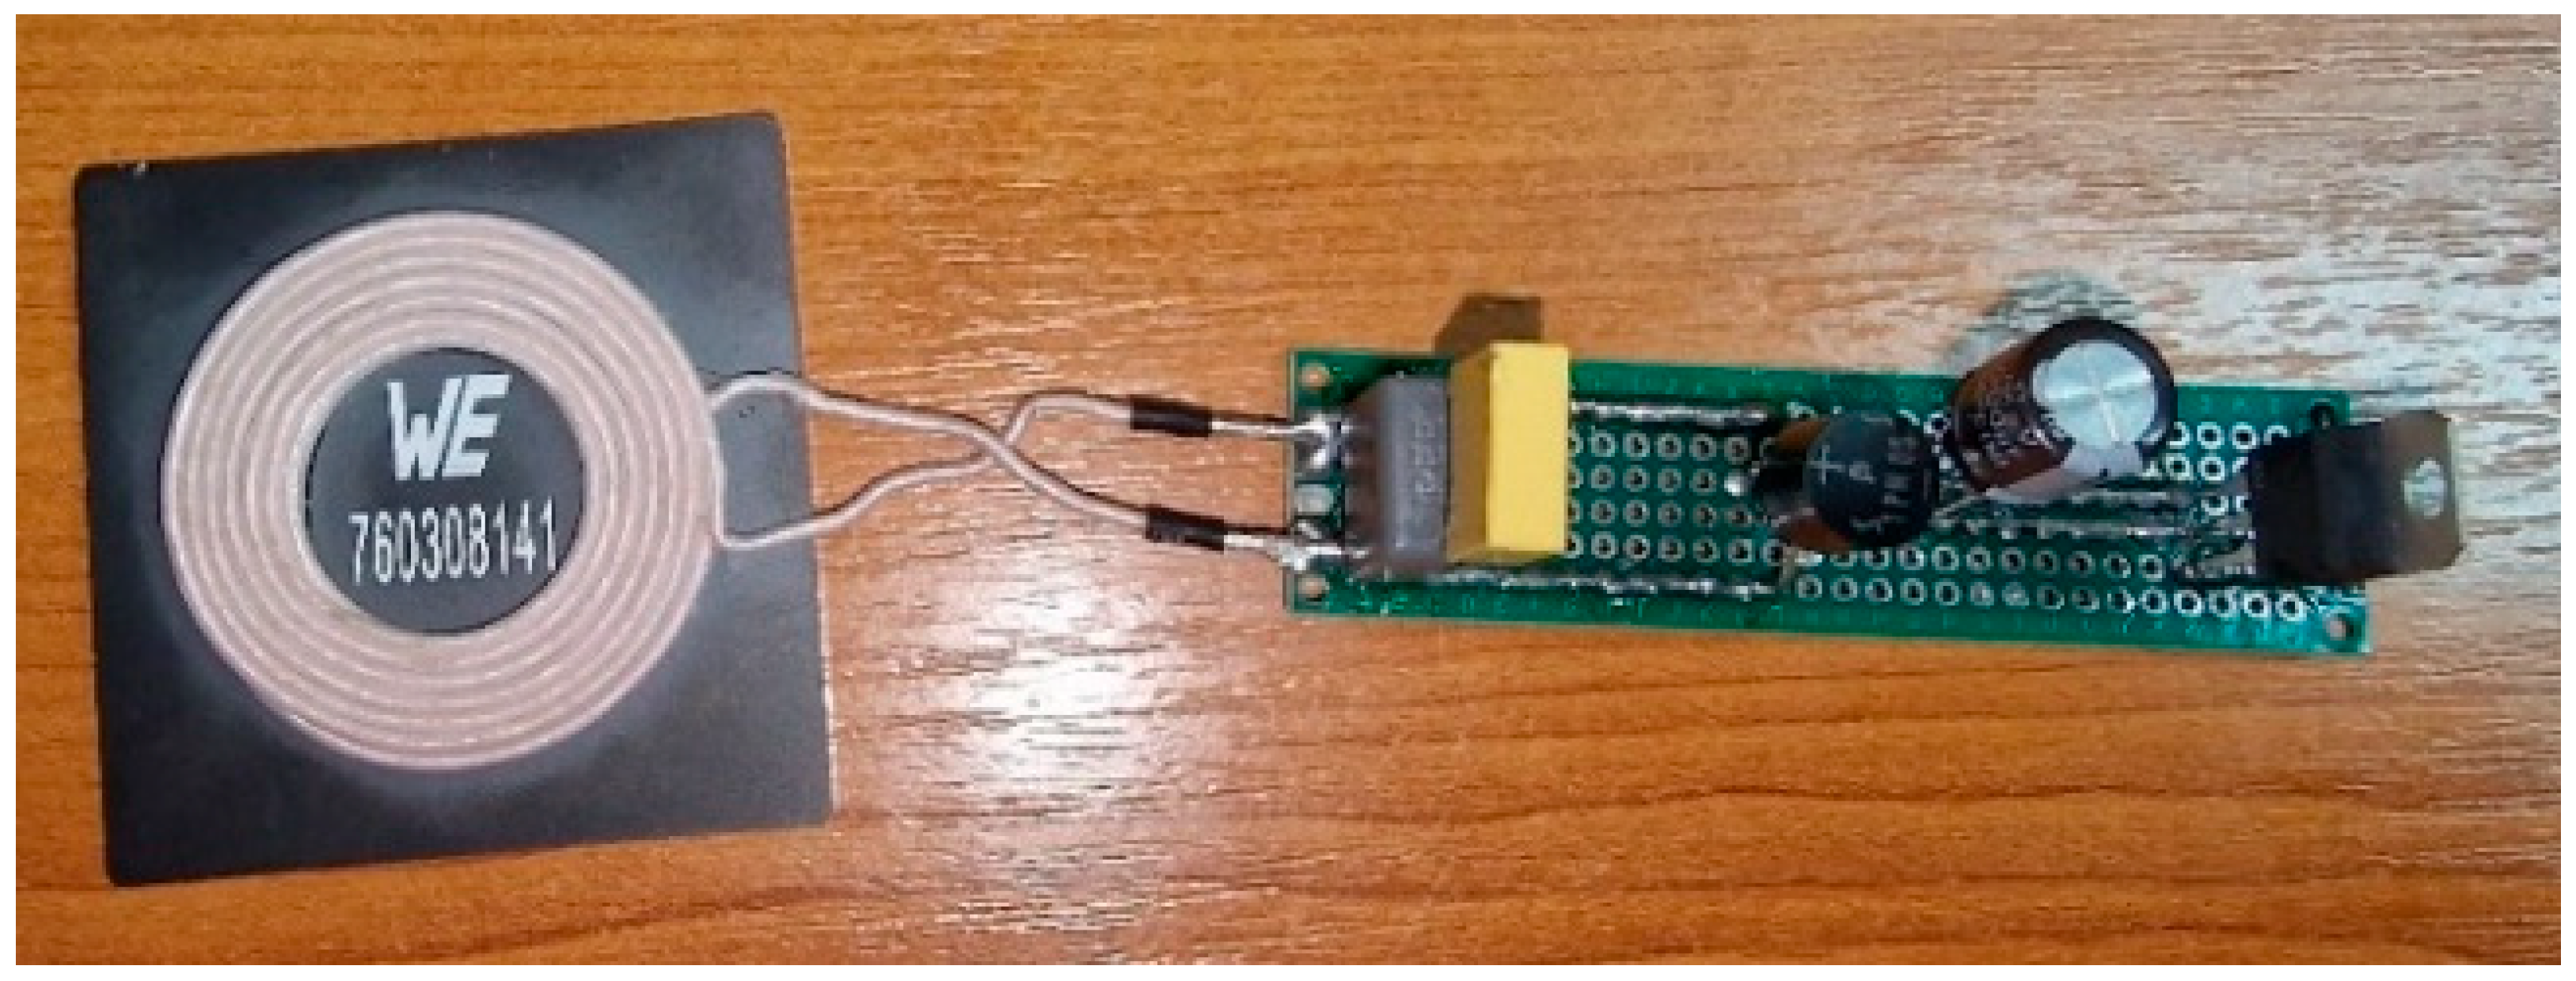
Figure 30 presents the receiver circuit of the constructed wireless power transfer system, built in accordance with the design described in Section 3.1 and illustrated in Figure 1.

4.2. Experimental Testing of the Constructed Wireless Power Transfer System

To power the transmitter circuit, a variable DC power supply (0–30 V) was used, and two signal generators provided the control signals [34,35]. Initially, two sinusoidal signals were applied—one at the resonance frequency of the circuit, while the second frequency was varied. The induced voltage was measured using a digital voltmeter.
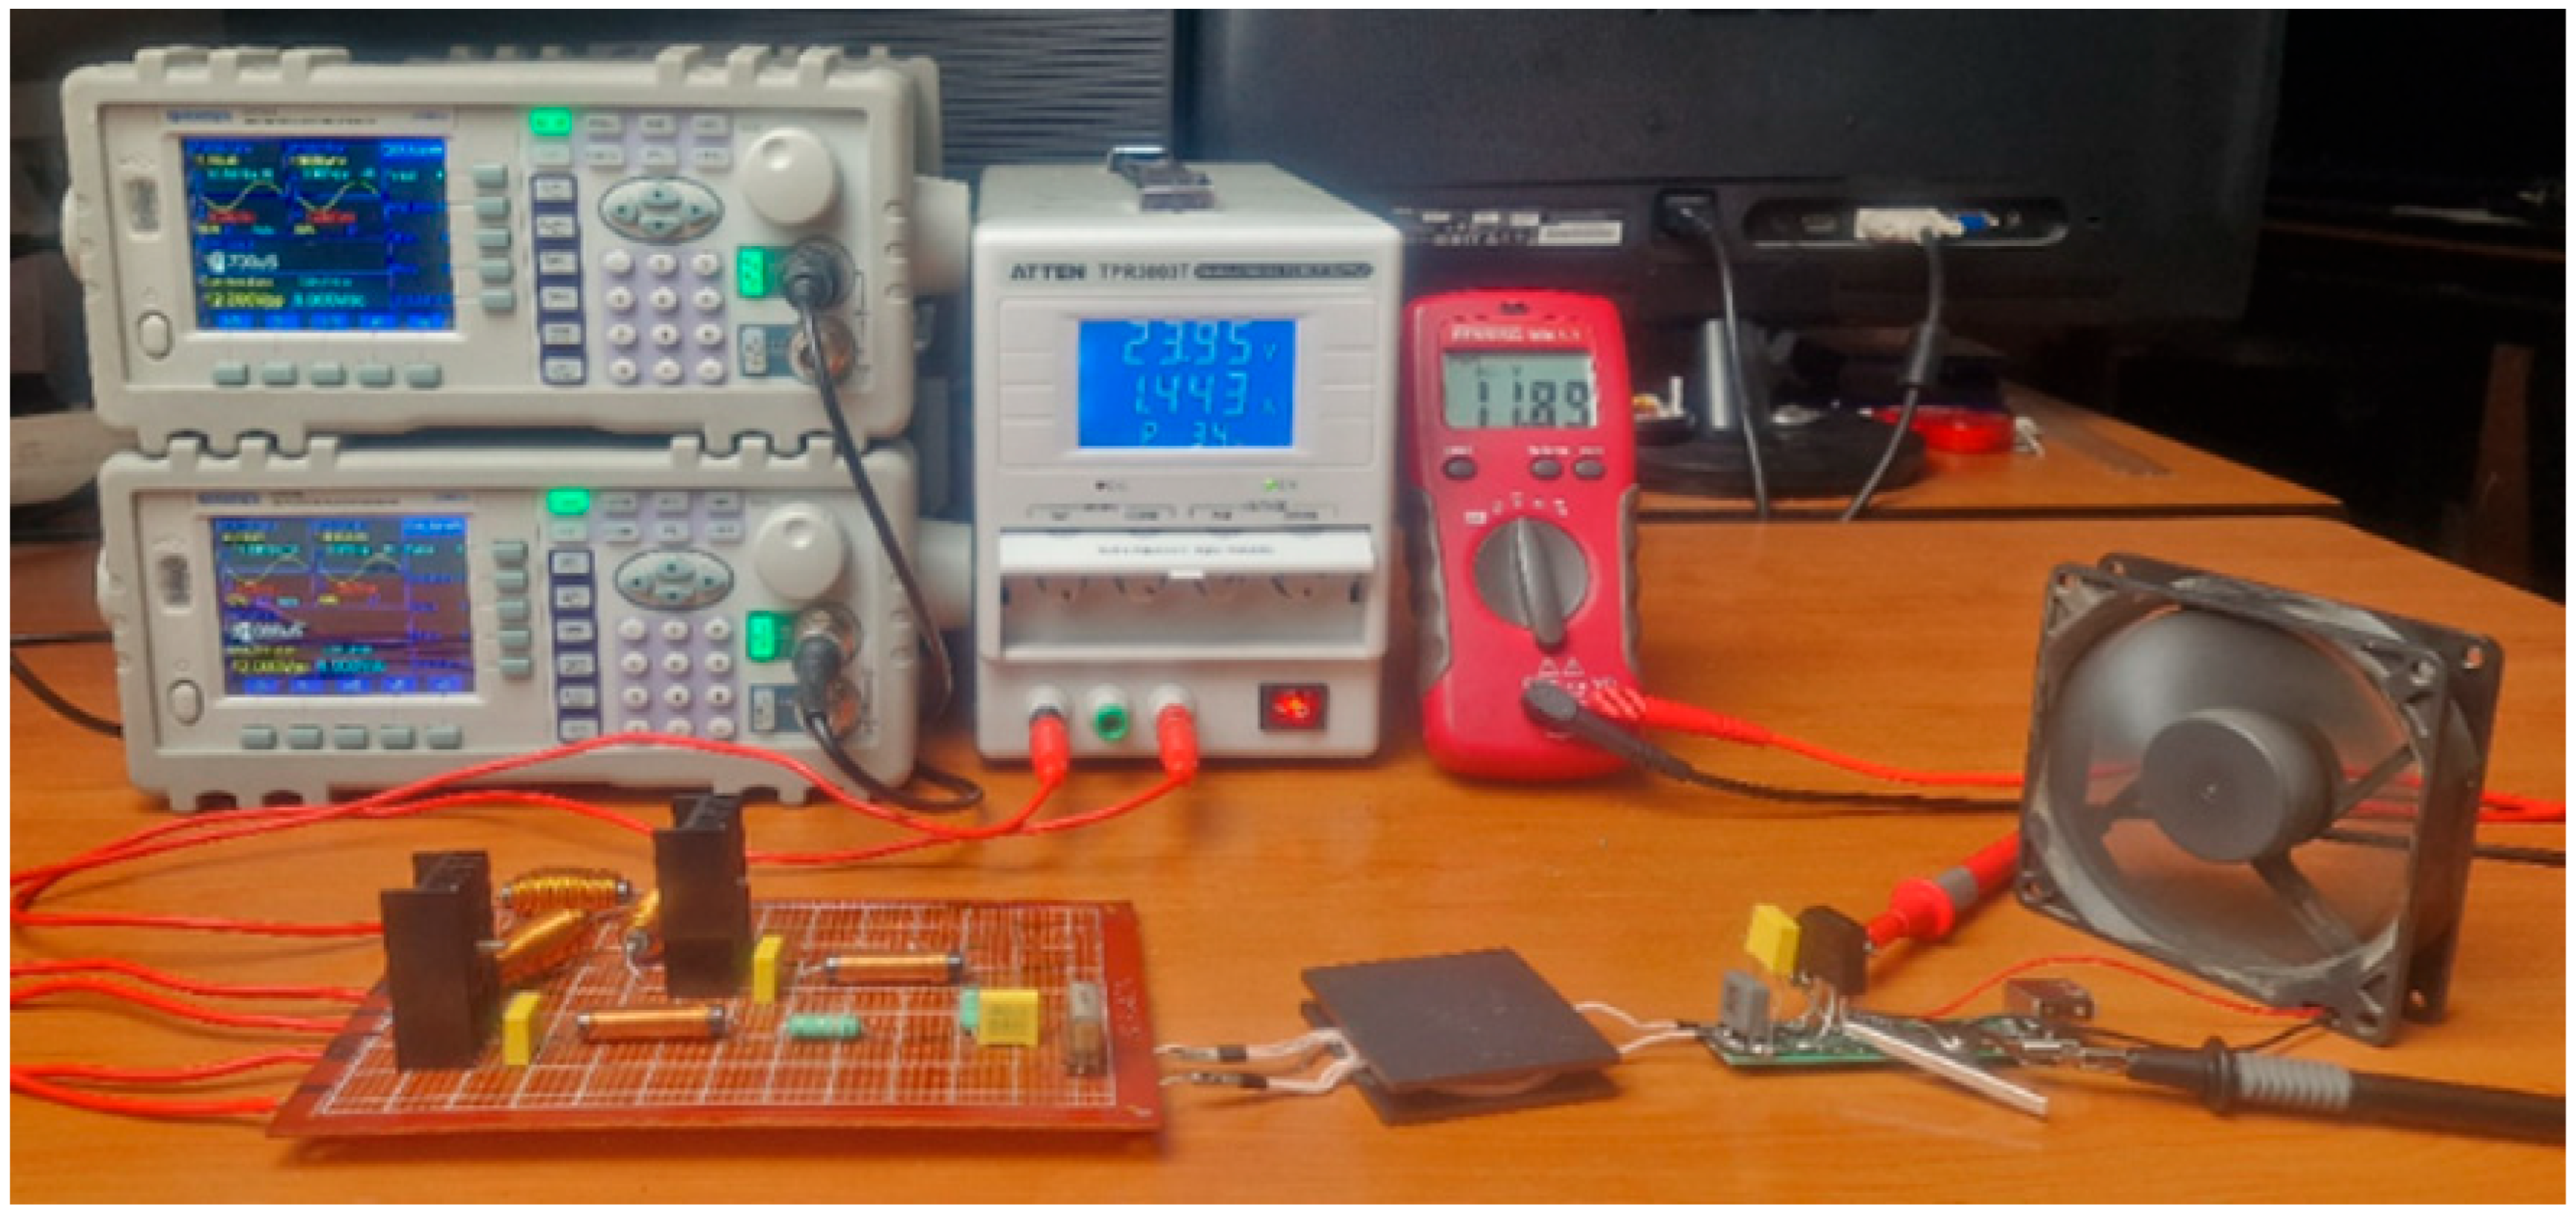
Figure 31 presents the measurement setup for the induced voltage at a control signal period of 18 µs.
Table 2 presents the measured values of the induced voltage in the receiver for control signal periods ranging from 2 to 50 µs, in steps of 2 µs.
To observe the influence of the load, additional tests were conducted using the setup shown in Figure 32, where the induced voltage at the receiver terminals was measured. The supply and control parameters remained unchanged.
Table 3 presents the measured values of the induced voltage in the receiver for control signal periods ranging from 2 to 50 µs, in steps of 2 µs.
To determine the influence of the control signal waveform, two rectangular signals were applied in the next test case: one at the circuit’s resonance frequency, while the second frequency was varied. The induced voltage was measured using a digital voltmeter.
Figure 33 presents the measurement of the induced voltage at a control signal period of 10 µs.
Table 4 presents the measured values of the induced voltage for control signal periods ranging from 2 to 50 µs, in steps of 2 µs.
In this case, the influence of the load was also investigated by adding a consumer to the system. Figure 34 shows the induced voltage measured at the receiver terminals. The supply and control parameters remained unchanged.
Table 5 presents the measured values for control signal periods ranging from 2 to 50 µs, in steps of 2 µs.
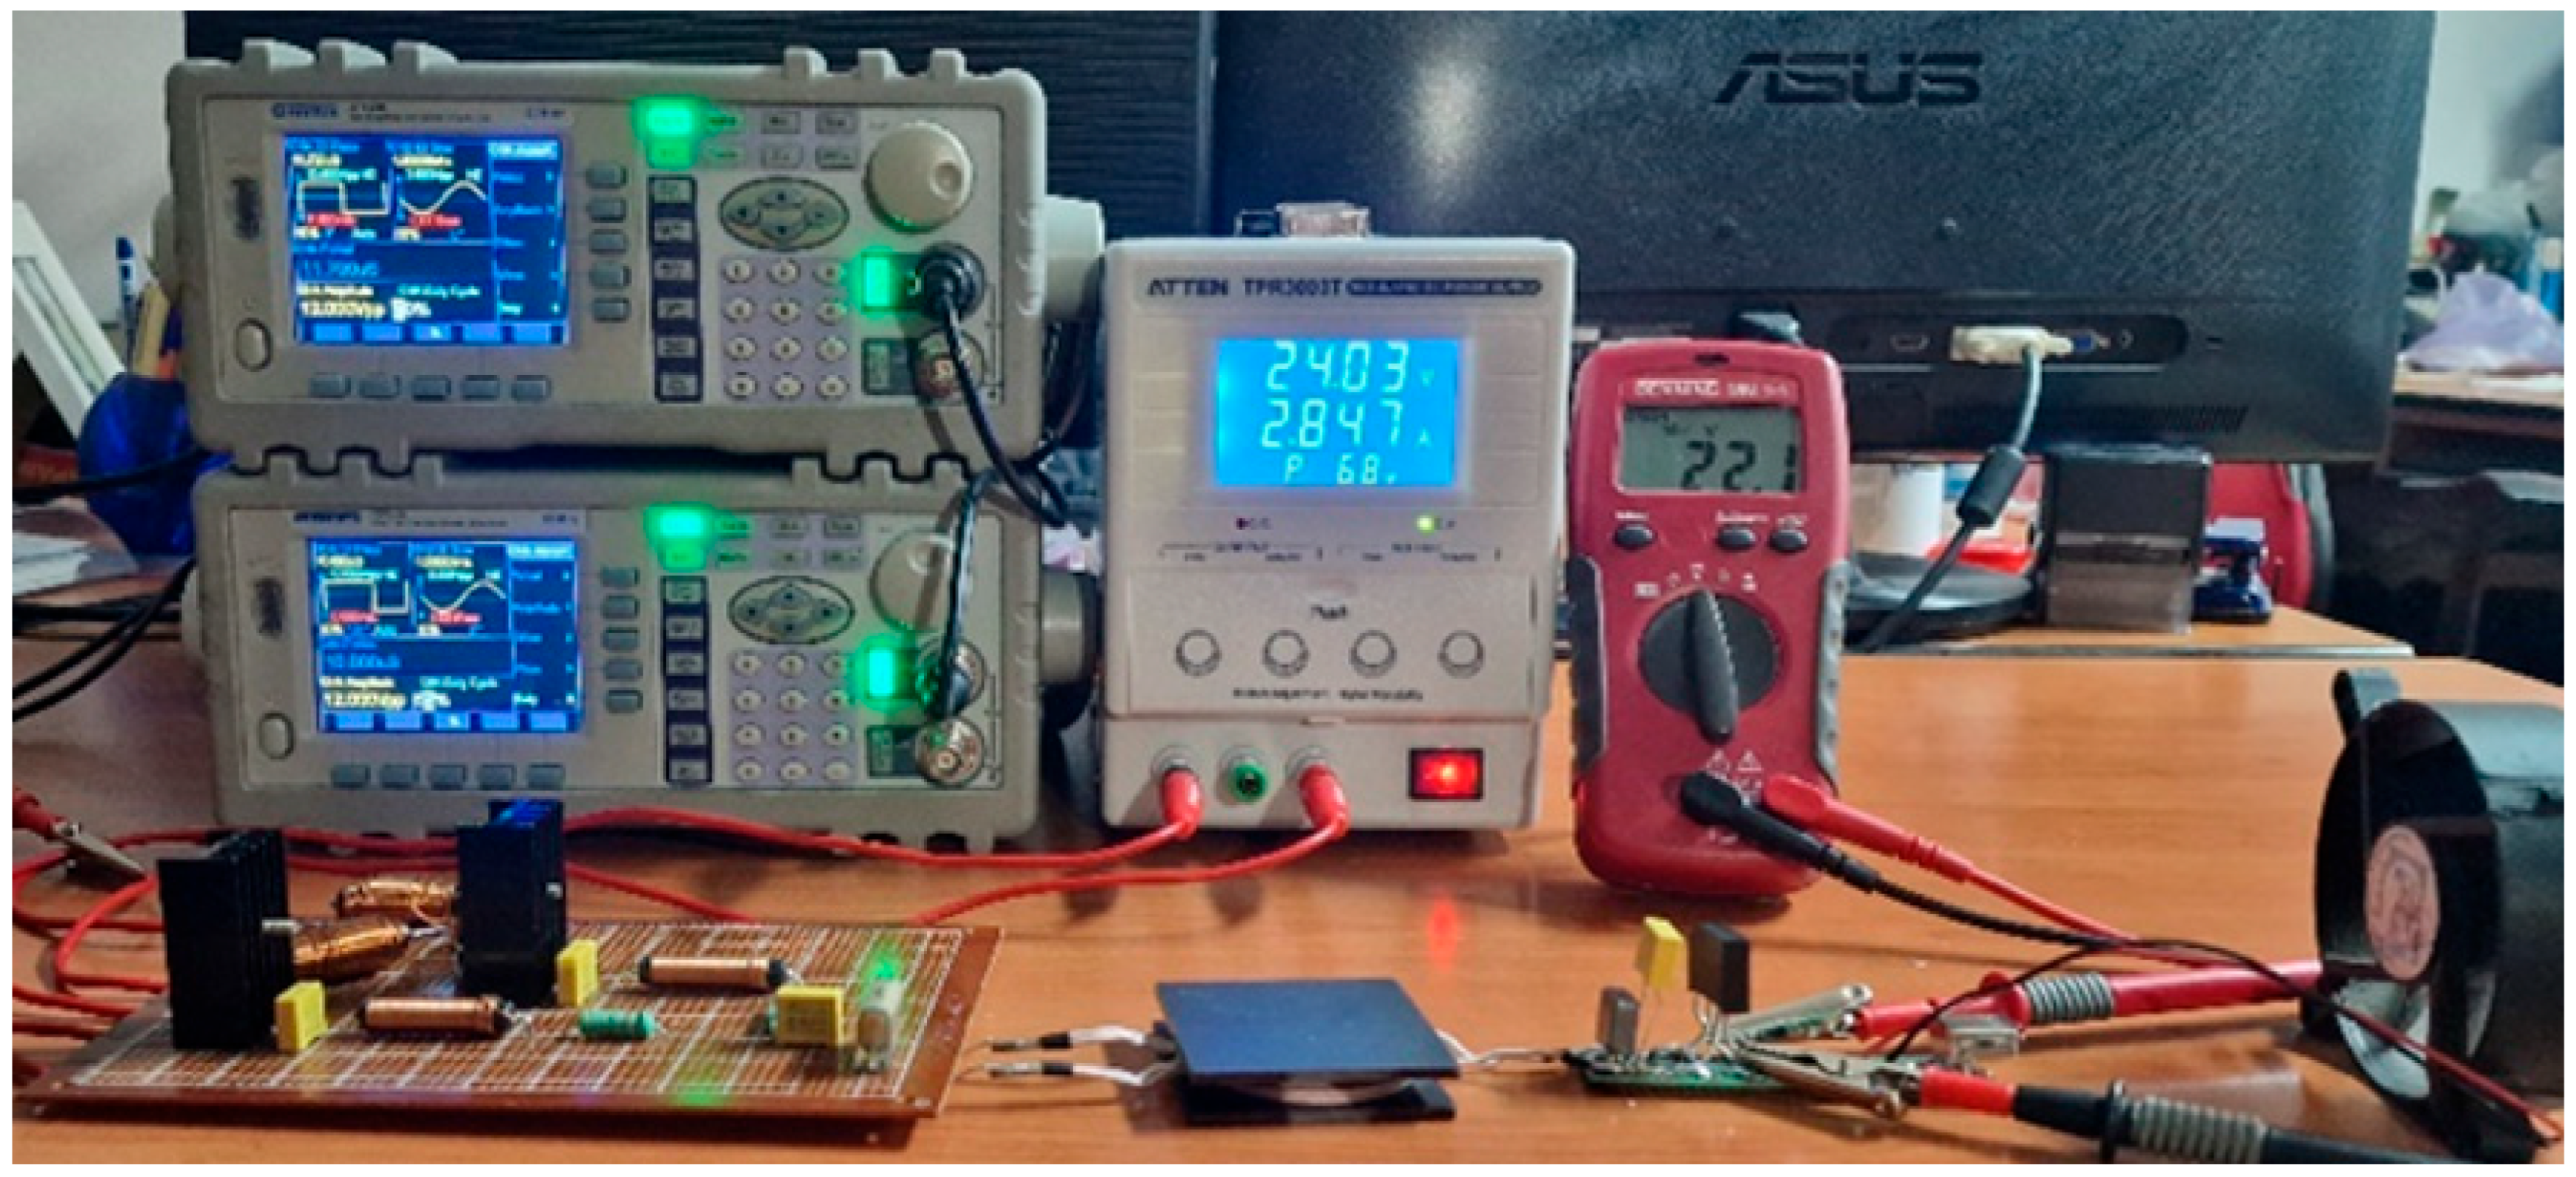
In the next analysis, two rectangular signals were selected: one at the circuit’s resonance frequency and the other corresponding to a period of 10 µs, as chosen from the previous table. In this case, the duty cycle was set to 50% for the first signal and 60% for the second. Figure 35 shows that by modifying the duty cycle of the control signal, the measured induced voltage increased from 15.69 V to 22.1 V.

5. Discussion

The results obtained in this study confirm the initial hypothesis that the performance of a wireless power transfer (WPT) system can be significantly enhanced through the simultaneous use of dual control frequencies and an optimized coil configuration. Simulation data demonstrated a strong correlation between the coupling coefficient, the period of the secondary control signal, and the induced voltage at the receiver.
Compared with prior studies in the field [36,37,38], the findings show that introducing a second strategically tuned control signal enables a more flexible resonance response and improved energy transfer efficiency. This not only supports earlier theoretical models on the benefits of frequency diversity in WPT systems but also advances them by providing empirical evidence across a wide range of coupling coefficients (0.1 to 1.0).
Furthermore, 3D electromagnetic simulations provided detailed insights into how coil geometry and separation affect magnetic flux coupling. The derivation of a sixth-degree polynomial describing the coupling coefficient as a function of distance represents a novel contribution, offering system designers a predictive tool for adaptive tuning.
Experimental validation reinforced the numerical results. Sinusoidal excitation consistently outperformed rectangular waveforms in terms of induced voltage, particularly under no-load conditions. The presence of a fan load introduced measurable voltage drops, underscoring the importance of load-aware control strategies.
From a broader perspective, these findings demonstrate the applicability of dual-frequency WPT systems in real-world scenarios where load variability and spatial constraints are significant, such as wireless charging platforms, biomedical implants, and embedded IoT devices.
Nonetheless, several challenges remain. System performance is sensitive to coil misalignment and variations in separation, which may affect reliability in dynamic environments. Moreover, efficiency under high-power transfer and longer distances was not addressed in this work and remains an open area for investigation.
It is also important to note that recent literature has proposed more general Domino WPT architectures, which exhibit bifurcation characteristics and quasi-load-independent outputs [39,40]. In contrast, the present dual-coil, dual-frequency control system focuses on optimizing the induced voltage and adapting to the coupling factor, without explicitly targeting quasi-load-independent behavior. However, the results highlight the potential to extend this approach to more complex configurations, where dual-frequency principles could be combined with Domino topologies to mitigate bifurcation effects and enhance system stability. This constitutes a promising direction for future research.

6. Conclusions and Future Work

This paper presented the design, numerical modeling, and experimental validation of a dual-frequency wireless power transfer (WPT) system. The study combined circuit-level simulations, electromagnetic field analysis, and laboratory measurements to evaluate and optimize system performance across a broad range of operating conditions.
The simulations highlighted the critical influence of the coupling coefficient, control signal waveform, and signal period on the induced voltage in the receiver. The highest induced voltages were obtained for specific control periods—particularly around 8 µs, 18 µs, 20 µs, and 22 µs—depending on the coupling coefficient, which was found to exhibit an optimal range near 0.3 in many scenarios.
Electromagnetic modeling in ANSYS Maxwell 3D confirmed a nonlinear inverse relationship between the coupling coefficient and the coil separation distance. A sixth-degree polynomial function was derived to characterize this dependency, providing a predictive tool for adaptive tuning and coil geometry optimization.
Experimental validation reinforced the simulation results, showing that sinusoidal control signals consistently produced higher induced voltages than rectangular ones. Moreover, tests with a real load (a fan) demonstrated the system’s ability to deliver stable power under practical operating conditions.
Future Works:
  • The findings from this study open several promising directions for future research:
  • Adaptive Control Algorithms: Integration of feedback-based control to dynamically adjust the signal period and frequency based on load and coupling conditions.
  • Miniaturization and Integration: Development of compact, PCB-integrated coil designs for applications in biomedical implants or consumer electronics.
  • Efficiency Optimization: Exploration of resonant impedance matching techniques and energy harvesting circuits to further improve power transfer efficiency.
  • Multi-Coil Architectures: Investigation of multi-coil or array-based systems to extend transmission range or improve spatial flexibility.
  • Robustness to Misalignment: Study of alignment-tolerant topologies and compensation techniques for variable receiver positions.
  • By combining numerical modeling, real-time tuning, and experimental validation, future work can lead to the development of high-efficiency, self-adaptive WPT systems suitable for a wide range of industrial and consumer applications.

Author Contributions

Conceptualization, M.-R.G. and C.P.; methodology, M.-R.G. and A.G.; software, M.-R.G., A.G. and C.M.; validation, M.-R.G., C.C. and S.A.; formal analysis, C.M.; investigation, M.-R.G. and A.G.; resources, S.A. and C.C.; data curation, A.G.; writing—original draft preparation, M.-R.G., C.P. and A.G.; writing—review and editing, C.P. and C.C.; visualization, C.M. and S.A.; supervision, C.P.; project administration, C.P.; funding acquisition, C.P. All authors have read and agreed to the published version of the manuscript.

Funding

This research was funded by the Technical University of Cluj-Napoca by National Grant Competition—GNaC ARUT 2023, grant Development and Optimization of MIMO Antennas and Evaluation of Human Exposure to the Radiation Emitted by Them, number 18/01.07.2024.

Institutional Review Board Statement

Not applicable.

Informed Consent Statement

Not applicable.

Data Availability Statement

Data are contained within the article.

Acknowledgments

This work was supported by the Development and Optimization of MIMO Antennas and Evaluation of Human Exposure to the Radiation Emitted by Them, grant funded by the National Grant Competition—GNaC ARUT 2023, grant number 18/01.07.2024.

Conflicts of Interest

The authors declare no conflicts of interest.

Abbreviations

WPTWireless Power Transfer
FEMFinite Element Method
PCBPrinted Circuit Board
DCDirect Current
ACAlternating Current
MOSFETMetal–Oxide–Semiconductor Field-Effect Transistor
kHzKiloHertz
µsMicrosecond
VVolt
CADComputer-Aided Design
RMSRoot Mean Square
LInductance
CCapacitance
RLInductor resistance
RCCapacitor resistance
ωrResonant Angular
M3, M4Transistors MOSFET
TxTransmitter
RxReceiver
kCoupling Coefficient
frResonant Frequency
µHMicroHenry
MilliOhm
ηFnanoFarad

Appendix A

Table A1. Variation in the Coupling Coefficient with Frequency and Distance.
d
[mm]
Freq
40 [kHz]
Freq
50 [kHz]
Freq
60 [kHz]
Freq
70 [kHz]
Freq
80 [kHz]
Freq
89 [kHz]
Freq
90 [kHz]
Freq
100 [kHz]
Freq
110 [kHz]
Freq
120 [kHz]
Freq
130 [kHz]
Freq
140 [kHz]
Freq
150 [kHz]
Freq
160 [kHz]
00.9010.9040.9060.9080.9100.9110.9110.9120.9130.9130 9140.9150.9150.915
10 8420.8450.8460.8480.8490.8500.8500.8500.8510.8520 8520.8520.8530.853
20.7800.7820.7840.7850.7850.7860.7860.7860.7870.7870.7880.7880.7880.788
30.7170.7180.7190.7200.7210.7210.7210.7220.7220.7220.7220.7230.7230.723
40.6550.6560.6570.6580.6590.6590.6590.6590.6590.6500.6500.6600.6500.650
50.5950.5960.5970.5980.5980.5980.5990.5990.5990.5990.5990.5990.5990.599
60.5390.5400.5410.5410.5410.5420.5420.5420.5420.5420.5420.5420.5420.542
70.4860.4880.4880.4890.4890.4890.4890.4890.4900.4900.4900.4900.4900.490
80.4380.4390.4400.4400.4410.4410.4410.4410.4410.4410.4410.4410.4410.441
90.3940.3950.3960.3960.3960.3960.3960.3970.3970.3970.3970.3970.3970.397
100.3540.3550.3560.3560.3570.3570.3570.3570.3570.3570.3570.3570.3570.357
110.3180.3190.3200.3200.3200.3200.3200.3200.3210.3210.3210.3210.3210.321
120.2860.2860.2870.2870.2870.2880.2880.2880.2880.2880.2880.2880.2880.288
130.2570.2570.2580.2580.2580.2580.2580.2580.2580.2590.2590.2590.2590.259
140.2300.2310.2310.2320.2320.2320.2320.2320.2320.2320.2320.2320.2320.232
150.2070.2080.2080.2080.2080.2080.2080. 2080.2080.2080.2080.2080.2080.208
160.1860.1870.1870.1870.1870.1870.1870.1880.1880.1880.1880.1880.1880.188
170.1680.1680.1680.1690.1690.1690.1690.1690.1690.1690.1690.1690.1690.169
180.1510.1510.1520.1520.1520.1520.1520.1520.1520.1520.1520.1520.1520.152
190.1360.1360.1360.1370.1370.1370.1370.1370.1370.1370.1370.1370.1370.137
200 1230.1230.1230.1230.1230.1230.1230.1230 1230.1230.1230.1230.1230.123
Table A2. Evolution of Mutual Inductance as a Function of Frequency and Distance.
d
[mm]
Freq
40 [kHz]
Freq
50 [kHz]
Freq
60 [kHz]
Freq
70 [kHz]
Freq
80 [kHz]
Freq
89 [kHz]
Freq
90 [kHz]
Freq
100 [kHz]
Freq
110 [kHz]
Freq
120 [kHz]
Freq
130 [kHz]
Freq
140 [kHz]
Freq
150 [kHz]
Freq
160 [kHz]
012.22412.02211.86811.75211.66311.60111.59511.54211.49911.46511.43711.41411.39511.378
110.16510.0149.8959.8039.7339.6839 6789.6349.6009.5729.5499.5299.5139.499
28.5928.4758.3828.3098.2528.2118.2078.1728.1438.1208.1018.0858.0718.060
37.3587.2687.1947.1357.0897.0567.0527.0236.9996.9806.9646.9505.9395.929
46.3446.2596.2086.1596.1216.0936.0906.0566.0456.0306.0166.0055.9955.987
55.5185.4575.4055.3665.3345.3105.3085.2875.2705.2565.2455.2355.2275.220
64.8344.7844.7434.7094.6824.6624.6604.6424.6274.6154.6044.5964.5884.582
74.2484.2074.1724.1434.1204.1034.1014.0864.0734.0624.0534.0464.0394.034
83.7503.7153.6853.6613.6413.6263.6253.6113.6003.5903.5833.5763.5703.565
93.3163.2863.2613.2403.2233.2103.2093.1973.1873.1793.1723.1663.1613.156
102.9452.9202.8992.8812.8662.8552.8532.8432.8342.8272.8212.8152.8112.807
112.6172.5952.5762.5612.5482.5382.5372.5282.5202.5142.5082.5032.4992.496
122.3302.3112.2942.2812.2692.2602.2602.2512.2452.2392.2342.2302.2262.223
132.0812.0642.0502.0382.0282.0212.0202.0132.0072.0021.9971.9931.9901.987
141.8571.8421.8301.8191.8101.8031.8021.7961.7911.7861.7821.7791.7761.774
151.6621.6491.6381.6281.6201.6141.6131.6081.6031.5991.5951.5921.5901.587
161.4911.4791.4591.4611.4541.4481.4481.4421.4381.4351.4311.4291.4251.424
171.3381.3271.3181.3111.3051.3001.2991.2951.2911.2881.2851.2821.2801.278
181.2021.1931.1851.1781.1721.1681.1581.1541.1601.1571.1551.1521.1511.149
191.0811.0731.0651.0601.0551.0511.0501.0471.0441.0411.0391.0371.0351.034
200.9740.9670.9610.9550.9500.9470.9470.9430.9400.9380.9360.9340.9330.931

References

  1. Pahlavan, S.; Shooshtari, M.; Jafarabadi Ashtiani, S. Star-Shaped Coils in the Transmitter Array for Receiver Rotation Tolerance in Free-Moving Wireless Power Transfer Applications. Energies 2022, 15, 8643. [Google Scholar] [CrossRef]
  2. Kurs, A.; Karalis, A.; Moffatt, R.; Joannopoulos, J.D.; Fisher, P.; Soljačić, M. Wireless power transfer via strongly coupled magnetic resonances. Science 2007, 317, 83–86. [Google Scholar] [CrossRef] [PubMed]
  3. Zhao, Y.; Liu, X.; Chen, T. Electromagnetic power harvesting using hollow cylinders. IEEE Trans. Microw. Theory Tech. 2023, 71, 5055–5065. [Google Scholar]
  4. Huang, M.; Chen, L.; Wu, Q. Efficient mid-range wireless energy transfer with radiation-loss compensation. Phys. Rev. Appl. 2023, 19, 024011. [Google Scholar]
  5. Balanis, C.A.; Konstantinou, K. The role of reactive power in the radiation of a dipole antenna. IEEE Trans. Antennas Propag. 2015, 63, 2022–2031. [Google Scholar]
  6. Chen, K.; Zhang, Z. Rotating-Coordinate-Based Mutual Inductance Estimation for Drone In-Flight Wireless Charging Systems. IEEE Trans. Power Electron. 2023, 38, 11685–11693. [Google Scholar] [CrossRef]
  7. Gu, Y.; Wang, J.; Liang, Z.; Zhang, Z. Flexible Constant-Power Range Extension of Self-Oscillating System for Wireless In-Flight Charging of Drones. IEEE Trans. Power Electron. 2024, 39, 15342–15355. [Google Scholar] [CrossRef]
  8. Wu, Z.; Yu, H.; Schreurs, D.; Huangfu, J. Wireless power transfer based on 2D routing. Sci. Rep. 2022, 12, 17345. [Google Scholar] [CrossRef] [PubMed]
  9. Narayanamoorthi, R.; Ramachandaramurthy, V.K.; Dominic, S.A.; Gono, R.; Bernat, P.; Kacor, P. Design of Dual Frequency Class E Resonant Converters for Simultaneous Wireless Power and Data Transfer in Low Power Applications. Results Eng. 2024, 24, 103558. [Google Scholar] [CrossRef]
  10. Song, C.-M.; Lim, H.-J.; Trinh-Van, S.; Lee, K.-Y.; Yang, Y.; Hwang, K.-C. Dual-Band RF Wireless Power Transfer System with a Shared-Aperture Dual-Band Tx Array Antenna. Energies 2021, 14, 3803. [Google Scholar] [CrossRef]
  11. Tang, Y.; Wang, H.; Shi, Z.; Guo, Y.; Sun, H. Research on dual-frequency modulation strategy of wireless power transfer system. Int. J. Circ. Theor. Appl. 2022, 50, 4342–4356. [Google Scholar] [CrossRef]
  12. Zhang, Z.; Lai, J.; Huang, Y.; Hao, X.; Yin, K.; Jiang, Z.; Wang, C.; Ma, X.; Huang, M.; Dong, T. Communication-free robust wireless power transfer with constant output power and stable frequency. Phys. Rev. Appl. 2025, 23, 014029. [Google Scholar] [CrossRef]
  13. Liu, Z.; Tao, C.; Wang, L.; Zhang, Y.; Li, F. A Research on Characteristics of Wireless Power Transfer System Based on LCC/N Magnetic Integration Compensation Circuit. In Proceedings of the Emerging Technologies: Wireless Power Transfer (WoW), San Diego, CA, USA, 1–4 June 2021. [Google Scholar]
  14. Qiao, X.; Niu, S.; Lin, J.; Chen, M.; Wu, Y. A Novel Magnetically Coupled Resonant Wireless Power Transfer Technique Used in Rotary Ultrasonic Machining Process. In Proceedings of the 2021 IEEE Wireless Power Transfer Conference (WPTC), San Diego, CA, USA, 1–4 June 2021. [Google Scholar]
  15. Stillig, J.; Enssle, A.; Parspour, N. Modular Wireless Power Transfer System for the Supply of Mobile Industrial Production Equipment. In Proceedings of the Emerging Technologies: Wireless Power Transfer (WoW), San Diego, CA, USA, 1–4 June 2021. [Google Scholar]
  16. Pacurar, C.; Topa, V.; Giurgiuman, A.; Munteanu, C.; Constantinescu, C.; Gliga, M.; Andreica, S. The Construction of a Wireless Power Supply System using Planar Spiral Inductors. In Proceedings of the 2019 8th International Conference on Modern Power Systems (MPS), Cluj-Napoca, Romania, 21–23 May 2019; pp. 1–6. [Google Scholar] [CrossRef]
  17. Gliga, M.; Racasan, A.; Munteanu, C.; Pacurar, C.; Constantinescu, C.; Andreica, S. The influence of ferrite on the spiral inductors inductance used for the design of wireless power systems. In Proceedings of the 2017 International Conference on Modern Power Systems (MPS), Cluj-Napoca, Romania, 6–9 June 2017; pp. 1–5. [Google Scholar] [CrossRef]
  18. Giurgiuman, A.; Pacurar, C.; Constantinescu, C.; Munteanu, M.G.C.; Andreica, S. Analysis and Optimal Design of a Wireless Power Transfer System for Electrical Vehicles. In Proceedings of the Electrical and Power Engineering (EPE), Iasi, Romania, 20–22 October 2022. [Google Scholar]
  19. Kim, J.; Kim, H.; Kim, D.; Jeong, D.; Ahn, S. Analysis of Efficiency According to the Design of Transmitter Coil for Wireless Power Transfer Implantable Medical Device. In Proceedings of the 2020 IEEE Wireless Power Transfer Conference (WPTC), Seoul, Republic of Korea, 15–19 November 2020. [Google Scholar]
  20. Mohamed, N.F.A.; Agbinya, J.I.; Okaf, A. Magnetic Field Tuning and Control for Wireless Power Transfer Using Inductive Tuning Plunger and Conical Coils. In Proceedings of the Emerging Technologies: Wireless Power Transfer (Wow), Montreal, QC, Canada, 3–7 June 2018. [Google Scholar]
  21. Gliga, M.; Munteanu, C.; Andreica, S.; Giurgiuman, A.; Pacurar, C.; Contantinescu, C.; Mociran, B.; Morar, D. The influence of the distance between the transmitter and the receiver of a wireless power system on the coupling factor and the voltage induced. In Proceedings of the Modern Power Systems (MPS), Cluj-Napoca, Romania, 21–23 June 2023. [Google Scholar]
  22. Pacurar, C.; Topa, V.; Racasan, A.; Munteanu, C.; Hebedean, C. Spiral inductors analysis and modelling. In Proceedings of the 2014 International Conference on Optimization of Electrical and Electronic Equipment (OPTIM), Bran, Romania, 22–24 May 2014; pp. 210–215. [Google Scholar] [CrossRef]
  23. Mototani, S.; Yamamoto, R.; Doki, K.; Torii, A. Possibility of the Undersea Wireless Power Transfer Using a Cone Spiral Coil. In Proceedings of the 2020 IEEE Wireless Power Transfer Conference (WPTC), Seoul, Republic of Korea, 15–19 November 2020. [Google Scholar]
  24. Zhaksylyk, Y.; Hanke, U.; Azadmehr, M. Impedance Matching using Interspiraled Coils for Wireless Power Transfer. In Proceedings of the 2020 IEEE PELS Workshop on Emerging Technologies: Wireless Power Transfer (WoW), Seoul, Republic of Korea, 15–19 November 2020. [Google Scholar]
  25. Racasan, A.; Munteanu, C.; Pacurar, C.; Topa, V.; Constantinescu, C.; Pop, F.; Andreica, S.; Cislariu, M. Analysis, identification and minimization the parasitic effects of the multilayer spiral inductors. In Proceedings of the Electrical and Power Engineering (EPE), Iasi, Romania, 20–22 October 2016. [Google Scholar]
  26. Hwang, K.; Chung, S.; Yoon, U.; Lee, M.; Ahn, S. Thermal analysis for temperature robust wireless power transfer systems. In Proceedings of the 2013 IEEE Wireless Power Transfer (WPT), Perugia, Italy, 15–16 May 2013. [Google Scholar]
  27. Andreica, S.; Munteanu, C.; Gliga, M.; Pacurar, C.; Giurgiuman, A.; Constantinescu, C. Design of Multilayer Spiral Coils with Different Geometries to Determine the Inductance. In Proceedings of the Electrical and Power Engineering (EPE), Iasi, Romania, 20–23 October 2020. [Google Scholar]
  28. Gliga, M.; Pacurar, C.; Munteanu, C.; Andreica, S.; Constantinecu, C.; Giurgiuman, A. Analysis of Different Type of Ring Permanent Magnets in Order to Achieve an Uniform Magnetic Field Around Them. In Proceedings of the Electrical and Power Engineering (EPE), Iasi, Romania, 20–23 October 2020. [Google Scholar]
  29. Utschick, C.; Merz, C.; Som, C. AC Loss Behavior of Wireless Power Transfer Coils. In Proceedings of the Wireless Power Transfer Conference (WPTC), London, UK, 17–21 June 2019. [Google Scholar]
  30. Lee, S.; Jung, G.; Shin, S.; Kim, Y.; Song, B.; Shin, J.; Cho, D. The optimal design of high-powered power supply modules for wireless power transferred train. In Proceedings of the 2012 Electrical Systems for Aircraft, Railway and Ship Propulsion, Bologna, Italy, 16–18 October 2012. [Google Scholar]
  31. Mohamed, N.F.A.; Agbinya, J.I. Magnetic Power Tuning Architectures in Wireless Power Transfer System. In Proceedings of the Emerging Technologies: Wireless Power Transfer (Wow), Montreal, QC, Canada, 3–7 June 2018. [Google Scholar]
  32. Shin, S.; Shin, J.; Song, B.; Lee, S.; Kim, Y.; Jung, G.; Jeon, S. Wireless power transfer system for high power application and a method of segmentation. In Proceedings of the 2013 IEEE Wireless Power Transfer (WPT), Perugia, Italy, 15–16 May 2013. [Google Scholar]
  33. Song, J.; Liu, M.; Fu, M.; Ma, C. High Power Density Stacked-Coils Based power Receiver for MHz Wireless Power Transfer. In Proceedings of the Emerging Technologies: Wireless Power Transfer (WoW), London, UK, 17–21 June 2019. [Google Scholar]
  34. Zhang, Z.; Li, X.; Pang, H.; Komurcugil, H.; Liang, Z.; Kennel, R. Multiple-Frequency Resonating Compensation for Multichannel Transmission of Wireless Power Transfer. IEEE Trans. Power Electron. 2021, 36, 5169–5180. [Google Scholar] [CrossRef]
  35. Koran, A.; Badran, K. Adaptive Frequency Control of a Sensorless-Receiver Inductive Wireless Power Transfer System Based on Mixed-Compensation Topology. IEEE Trans. Power Electron. 2020, 36, 978–990. [Google Scholar] [CrossRef]
  36. Stielau, O.H.; Covic, G.A. Design of loosely coupled inductive power transfer systems. In Proceedings of the PowerCon 2000. 2000 International Conference on Power System Technology. Proceedings (Cat. No.00EX409), Perth, WA, Australia, 4–7 December 2000; Volume 1, pp. 85–90. [Google Scholar] [CrossRef]
  37. Huang, Y.; Liu, C.; Zhou, Y.; Xiao, Y.; Liu, S. Power Allocation for Dynamic Dual-Pickup Wireless Charging System of Electric Vehicle. IEEE Trans. Magn. 2019, 1–6. [Google Scholar] [CrossRef]
  38. Zhang, L.; Yang, Y.; Jiang, Z.; Chen, Q.; Yan, Q.; Wu, Z.; Zhang, B.; Huangfu, J.; Chen, H. Demonstration of topological wireless power transfer. Sci. Bull. 2021, 66, 974–980. [Google Scholar] [CrossRef] [PubMed]
  39. Wang, K.; Zeng, J.; Yang, Y.; Hui, S.Y.R. A General Maximum Efficiency Tracking Scheme for Domino Wireless Power Transfer Systems with Quasi-Load-Independent Outputs. IEEE Trans. Power Electron. 2024, 39, 1840–1852. [Google Scholar] [CrossRef]
  40. Wang, K.; Yang, J.; Sun, Z.; Zeng, J.; Yang, Y. Analysis and Design of Domino Inductive Power Transfer System with Enhanced Quasi-Load-Independent Constant Current Output. In Proceedings of the IEEE Wireless Power Technology Conference and Expo (WPTCE), Kyoto, Japan, 8–11 May 2024; pp. 385–389. [Google Scholar]
Figure 1. The equivalent electrical circuit of the wireless power transfer system used for analyzing the influence of the coupling coefficient k on the induced voltage.
Technologies 13 00442 g001
Figure 2. Equivalent circuit used for optimization studies.
Technologies 13 00442 g002
Figure 3. Induced Voltage Using the Optimized Circuit for the Study.
Technologies 13 00442 g003
Figure 4. The optimized circuit with the construction parameters of the transmitter and receiver coils.
Technologies 13 00442 g004
Figure 5. Result of the frequency analysis of the circuit.
Technologies 13 00442 g005
Figure 6. Time variation in the voltage as a function of the period, for k = 0.1: (a) 2D; (b) 3D.
Technologies 13 00442 g006
Figure 7. Time variation in the voltage as a function of the period, for k = 0.2: (a) 2D; (b) 3D.
Technologies 13 00442 g007
Figure 8. Time variation in the voltage as a function of the period, for k = 0.3: (a) 2D; (b) 3D.
Technologies 13 00442 g008
Figure 9. Time variation in the voltage as a function of the period, for k = 0.4: (a) 2D; (b) 3D.
Technologies 13 00442 g009
Figure 10. Time variation in the voltage as a function of the period, for k = 0.5: (a) 2D; (b) 3D.
Technologies 13 00442 g010
Figure 11. Time variation in the voltage as a function of the period, for k = 0.6: (a) 2D; (b) 3D 6.
Technologies 13 00442 g011
Figure 12. Time variation in the voltage as a function of the period, for k = 0.7: (a) 2D; (b) 3D.
Technologies 13 00442 g012
Figure 13. Time variation in the voltage as a function of the period, for k = 0.8: (a) 2D; (b) 3D.
Technologies 13 00442 g013
Figure 14. Time variation in the voltage as a function of the period, for k = 0.9: (a) 2D; (b) 3D.
Technologies 13 00442 g014
Figure 15. Time variation in the voltage as a function of the period, for k = 1: (a) 2D; (b) 3D.
Technologies 13 00442 g015
Figure 16. Circuit Used in the Analysis of Coupling coefficient Variation.
Technologies 13 00442 g016
Figure 17. Variation of Voltage over Time for a Control Signal Period of 18 µs.
Technologies 13 00442 g017
Figure 18. Variation in Voltage over Time for a Control Signal Period of 18 µs: (a) 2D; (b) 3D.
Technologies 13 00442 g018
Figure 19. Variation in Voltage over Time for a Control Signal Period of 8 µs.
Technologies 13 00442 g019
Figure 20. Variation in Voltage over Time for a Control Signal Period of 8 µs: (a) 2D; (b) 3D.
Technologies 13 00442 g020
Figure 21. Variation in Voltage over Time for a Control Signal Period of 20 µs.
Technologies 13 00442 g021
Figure 22. Variation in Voltage over Time for a Control Signal Period of 20 µs: (a) 2D; (b) 3D.
Technologies 13 00442 g022
Figure 23. Variation in Voltage over Time for a Control Signal Period of 22 µs.
Technologies 13 00442 g023
Figure 24. Variation in Voltage over Time for a Control Signal Period of 22 µs: (a) 2D; (b) 3D.
Technologies 13 00442 g024
Figure 25. Geometry Implemented in the ANSYS Package (a), Transmitter Coil dimensions (b), Receiver Coil dimensions (c).
Technologies 13 00442 g025
Figure 26. Evolution of the Coupling coefficient as a Function of Frequency and Distance.
Technologies 13 00442 g026
Figure 27. Variation in the Coupling coefficient as a Function of Distance.
Technologies 13 00442 g027
Figure 28. Variation in Mutual Inductance as a Function of Distance and Frequency.
Technologies 13 00442 g028
Figure 29. Transmitter of the Constructed Wireless Power Transfer System.
Technologies 13 00442 g029
Figure 30. Receiver of the Constructed Wireless Power Transfer System.
Technologies 13 00442 g030
Figure 31. Measurement Stand for Induced Voltage—Sinusoidal Waveform.
Technologies 13 00442 g031
Figure 32. Measurement Setup with Load and Sinusoidal Control Signal.
Technologies 13 00442 g032
Figure 33. Measurement Setup for Rectangular Waveform.
Technologies 13 00442 g033
Figure 34. Measurement Setup with Load and Rectangular Control Signal.
Technologies 13 00442 g034
Figure 35. Impact of Duty Cycle Variation on the Induced Voltage.
Technologies 13 00442 g035
Table 1. Coil Characteristics.
CoilsInductance [µH]Resistance [mΩ]
Transmitter coil,
WE 760308102142
5.812
Receiver coil,
WE 760308141
1030
Table 2. Experimentally Determined Values for the Sinusoidal Waveform.
Signal Period [µs]Supply Voltage [V]Measured Induced Voltage [V]
2241.44
42417.65
62424
82438.3
102447.1
122443.4
142452
162436
182454.9
202436.7
222432.9
242434.1
262445.2
282438.1
302434.6
322435.1
342436.5
362443.8
382443
402439.6
422436.4
442436.9
462431.6
482431.9
502430.8
Table 3. Induced Voltage in the Receiver for the Sinusoidal Waveform with Load.
Signal Period [µs]Supply Voltage [V]Measured Induced Voltage [V]
2248.22
4246.83
6246.11
8246.78
10246.45
12249.28
14248.21
162410.87
182410.97
202410.67
222410.61
242410.8
262411.32
282411.51
302411.71
322411.44
342411.21
362411.89
382411.38
402411.46
422411.04
442411.01
462410.8
482410.52
502410.39
Table 4. Experimentally Determined Values for the Rectangular Waveform.
Signal Period [µs]Supply Voltage [V]Measured Induced Voltage [V]
2243.89
42421.8
62425.5
82438.9
102442.5
122441.7
142441.2
162433.7
182433.7
202431.6
222430.6
242429.8
262438.8
282432.4
302429.4
322429.7
342428.3
362428.9
382430.2
402432.8
422432
442432
462431
482430.4
502430.6
Table 5. Induced Voltage in the Receiver for the Rectangular Waveform with Load.
Signal Period [µs]Supply Voltage [V]Measured Induced Voltage [V]
2241.485
42411.44
62413.18
82413.72
102415.69
122415.2
142418.58
162412.36
182413.69
202414.03
222414.52
242413.55
262414.76
282414.67
302413.95
322413
342412.42
362412.07
382412.09
402412.47
422412.24
442411.47
462410.71
482410.15
502410.26
Disclaimer/Publisher’s Note: The statements, opinions and data contained in all publications are solely those of the individual author(s) and contributor(s) and not of MDPI and/or the editor(s). MDPI and/or the editor(s) disclaim responsibility for any injury to people or property resulting from any ideas, methods, instructions or products referred to in the content.