Abstract
In ultrasonic nondestructive testing (NDT), accurately estimating the time of flight (TOF) of ultrasonic waves is crucial. Traditionally, TOF estimation involves the signal processing of a single measured waveform. In recent years, deep learning has also been applied to estimate the TOF; however, these methods typically process only single waveforms. In contrast, this study acquired fan-beam ultrasonic waveform profile data from 64 paths using an ultrasonic-speed computed tomography (CT) simulation of a circular column and developed a TOF estimation model using two-dimensional convolutional neural networks (CNNs) based on these data. We compared the accuracy of the TOF estimation between the proposed method and two traditional signal processing methods. Additionally, we reconstructed ultrasonic-speed CT images using the estimated TOF and evaluated the generated CT images. The results showed that the proposed method could estimate the longitudinal TOF more accurately than traditional methods, and the evaluation scores for the reconstructed images were high.
1. Introduction
Wooden structures and concrete buildings deteriorate gradually over time. It is necessary to use nondestructive testing (NDT) techniques to assess the presence, precise location, and extent of damage in these buildings as they age. In recent years, various NDT methods, such as acoustic emission, impact echo, ultrasonics, infrared thermography, ground-penetrating radar, and X-ray detection, have been proposed [1]. Ultrasonic testing uses the reflection or transmission of sound waves to identify the size and location of anomalies within a structure. The reflection method involves using the same ultrasonic transducer for both transmission and reception and receiving sound waves that reflect back at the interfaces between materials with different acoustic impedances [2,3]. This method is commonly used in medical ultrasonic examination [4]. Conversely, the transmission method employs separate ultrasonic transducers for transmission and reception, measuring the absorption and speed of sound waves passing through the interior of an object [5,6]. Tomikawa et al. proposed a method that combined transmission-based sound speed measurements with computed tomography (CT) to inspect wood columns for decay [5]. This ultrasonic-speed CT technique reconstructs cross-sectional images by measuring the time of flight (TOF) of ultrasonic waves passing through various propagation paths within an object and utilizing the difference in sound speed between the normal and anomalous sections.
Most ultrasonic tests utilize the TOF and signal strength as data. Several methods are available for estimating the TOF of the received ultrasonic waveforms. These include the threshold detection method, which sets a threshold on the waveform amplitude to estimate the TOF [5,6,7,8]; the cross-correlation method, which estimates the TOF by calculating the similarity between two waveforms [9,10]; and methods that estimate the TOF by taking the envelope of the waveform [11,12]. Cross-correlation and envelope methods have been reported to be used in combination for more accurate TOF estimation [10]. Additionally, some techniques estimate the TOF after separating overlapping ultrasonic echoes in the time and frequency domains [13,14,15,16].
In recent years, in addition to the methods using signal processing described above, approaches utilizing deep learning have been reported [1]. In particular, convolutional neural networks (CNNs) are used in a wide range of applications, including speech synthesis and noise reduction in signals [17,18,19]. In addition, the application of CNNs for estimating the TOF has been advancing. Li et al. constructed two networks using one-dimensional CNNs to automatically separate overlapping ultrasonic echoes and estimate the TOF [20]. Shpigler et al. proposed the US-CNN, which can perform both the separation of ultrasonic echoes and the estimation of end-to-end TOF within a single network, addressing the method proposed by Li et al. [21]. Shi et al. proposed a method using CNNs to perform end-to-end classification of received waveforms that have passed through anomalies and those that have not in a section where two pieces of stainless steel are welded [22]. In the field of seismic research, Ross et al. are automating the estimation of P-wave arrival times and the extraction of initial motion polarity using one-dimensional CNNs and raw seismic waveforms [23].
Numerous methods exist for estimating the TOF using signal processing and deep learning; however, the aforementioned studies primarily focus on processing a single measurement waveform. In contrast, this study estimates TOF by simultaneously processing multiple measurement waveforms received from a speed-of-sound CT system using two-dimensional CNNs. Specifically, the ultrasonic waveform profile data were acquired through an ultrasonic propagation simulation in a 64-pass fan-beam configuration, and then several amplitudes of white noise were added. These data were used to train a CNN model, which was then trained and tested to estimate TOF. To verify the effectiveness of the proposed method, the TOF was estimated using the traditional signal processing methods, namely the “threshold method” and the “squared amplitude integral method”, and the results were compared [6,8]. CT images were reconstructed using the TOF estimates obtained from the proposed method and the two signal processing methods, and the quality of these images was evaluated using two metrics: peak signal-to-noise ratio (PSNR) and structural similarity index (SSIM). As a result, the maximum error value of TOF was s for the signal processing method, while it was s for the proposed method. In addition, the CT images reconstructed using the TOF estimated by the proposed method showed high evaluation values.
2. Materials and Methods
2.1. Mathematical Modeling
The numerical simulations were conducted using MATLAB 2022b and the k-wave toolbox [24]. The k-wave toolbox provides functions to perform elastic wave simulations. This function is modeled using the Kelvin–Voigt model [25]. The Kelvin–Voigt model can be written using Einstein summation notation as follows
where is the stress tensor, and is the dimensionless strain tensor. and are the Lamé parameters, is the shear modulus, and and are compressional and shear viscosity coefficients. The Lamé parameters are related to the shear and compressional sound speeds by
where is the mass density. In the case of small deformations, where the displacement and strain of the object are small, the relationship between strain and particle displacement can be expressed as follows:
where is the spatial coordinate. Equation (1) can be re-written as a function of the particle velocity , where
Equation (4), combined with the equation for conservation of momentum, can be written as
Equations (4) and (5) are coupled first-order partial differential equations that describe the propagation of linear compressional and shear waves in an isotropic viscoelastic solid.
2.2. Ultrasonic Propagation Simulation
As shown in Figure 1a, the grid points were arranged on the same plane with a size of 256 × 256, and the spacing between the grid points was set to 1 mm. Figure 1a shows that each grid point was categorized as background (gray), normal (yellow), or anomaly (white), and each category was assigned specific acoustic properties. Table 1 presents the simulation conditions, and Table 2 lists the acoustic properties. The normal section was modeled as a wooden column with a radius of 110 mm. The wavelength of the longitudinal wave in the normal section was 11 mm and consisted of 11 grid points per wavelength. The anomaly was modeled as a circular cavity placed within the normal section, and multiple simulations were performed by varying the position and size of the anomaly. The size of the anomaly was set to a radius of 10 mm or 20 mm. The background section was 100 times denser than air and served to prevent ultrasonic waves from propagating outside the normal section. As shown in Figure 1a, an ultrasonic transmitter and 64 receivers were positioned around the perimeter of the normal section. One of the receivers was placed at the same location as the transmitter, designated as CH0, and the receivers were numbered clockwise. For the arrangement of the elements, we calculated the coordinates of the grid points so that the angle formed between two adjacent elements and the center of the normal section is 5.625°, ensuring that all elements are evenly spaced. An impulse wave with a center frequency of 200 kHz was emitted, and the waveforms were captured at each receiver. As shown in Figure 1b, the anomaly was placed at distances of 20 mm, 30 mm, 40 mm, 50 mm, 60 mm, and 70 mm from the center point of the normal section, with only one anomaly being installed. The installed anomaly was rotated by 5.625°. This angle was used to calculate the placement coordinates of the anomaly on the grid points. If there was no grid point at the calculated coordinates, the anomaly was placed on the nearest grid point to the calculated coordinates. Figure 1b illustrates an example in which the anomaly is positioned at a radius of 70 mm from the center point of the normal section. The initial position of the anomaly was near receiver CH48, and this position was set to zero. An ultrasonic propagation simulation was performed once for each rotation of the anomaly, and fan-beam waveform data (profile data) were collected. The installed anomaly was rotated from 0° to 354.375°. In this study, 768 simulations were conducted (6 radius positions from the center point × 64 movements of the anomaly × 2 types of anomaly radii). The k-wave toolbox provides a perfectly matched layer (PML) as a setting item for boundary conditions. In this simulation, PML was used to set the boundary conditions [24,25,26]. The PML thickness was set to 20 grid points, and the absorption coefficient was set to 2, effectively preventing wave reflections at the computational domain boundaries. This simulation did not consider factors such as ultrasonic attenuation, scattering, or mode conversion. Add a program for this simulation to the Supplemental Data. A snapshot of the visualization produced by this program is shown in Figure 2. Figure 2a shows the time variation of normal stress, and Figure 2b shows the time variation of shear stress. Several small black dots arranged in a circular pattern represent receivers. One point with an x position of 0 and a y position near −100 is the transmitter. The colors in Figure 2 represent yellow for positive, white for zero, and blue for negative.
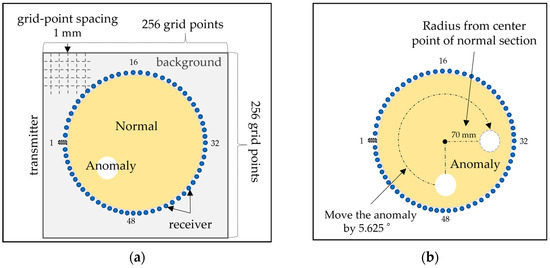
Figure 1.
Detailed diagram of ultrasonic propagation simulation: (a) Background (gray), normal section (yellow), and anomaly (white) placed on a 256 × 256 grid. (b) The anomaly was placed at a distance of 20 mm, 30 mm, 40 mm, 50 mm, 60 mm, and 70 mm from the center point of the normal section, with only one anomaly being installed. This figure shows an example of anomaly placement at 70 mm. The anomaly is rotated every 5.625°.

Table 1.
Conditions for ultrasonic propagation simulation.

Table 2.
Acoustic properties of each section in ultrasonic propagation simulation.
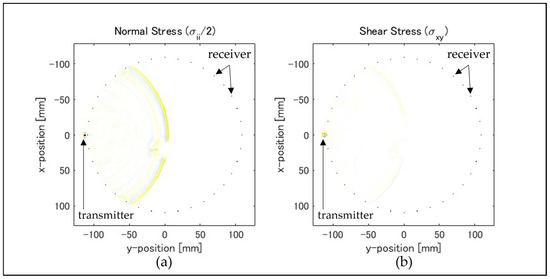
Figure 2.
Snapshot of ultrasonic propagation simulation. (a) Time variation of normal stress was represented by color. (b) Time variation of shear stress was represented by color. The colors yellow represents positive, white represents zero, and blue represents negative.
2.3. Datasets
Figure 3a shows an example of the waveform data obtained from the ultrasonic propagation simulation, in which the absolute values of the waveform amplitudes are displayed. Figure 3b shows the position of the TOF from (a). In this study, label data were created using the threshold method from waveforms obtained through an ultrasonic propagation simulation [6]. Because the waveforms obtained from the simulation contained no noise, the accuracy of TOF estimation using the threshold method was considered high, making it suitable for obtaining accurate TOF label data. The procedure for TOF estimation using this method was as follows: 1. The absolute value of the waveform amplitude was obtained, and the maximum amplitude was determined. 2. The threshold was set to 10% of the maximum amplitude. 3. The sampling point when the absolute value of the waveform first becomes larger than the threshold value is TOF. As shown in Figure 3b, label data are created by assigning the value “1” at the position of the TOF and “0” elsewhere. After creating the labeled data, all waveform data were resampled at 2 MHz, and a bandwidth limitation was applied within approximately 180–220 kHz.
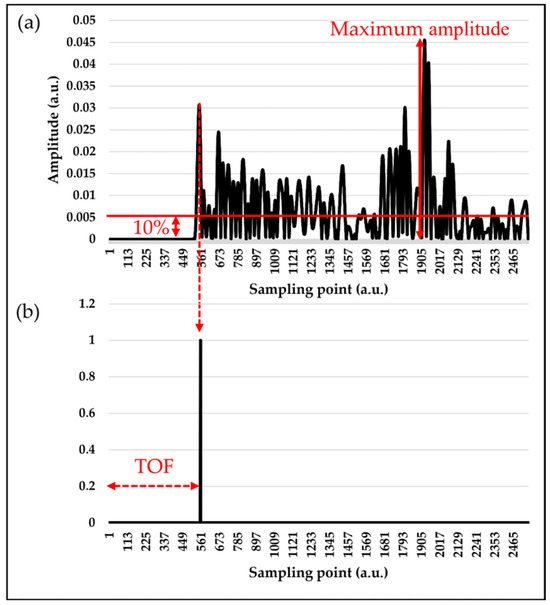
Figure 3.
Creation of label data using threshold processing. (a) Waveform data obtained from ultrasonic propagation simulation showing the absolute values of the waveform amplitudes. (b) The sampling point when the absolute value of the waveform first becomes larger than the threshold value is TOF.
Next, we created the training data. In this study, two sets of training data were prepared, and models were generated for each. The first set consists of waveform data to which white noise has been added (hereafter referred to as “noise data”). The white noise to be added is calculated from the signal-to-noise ratio (SNR) as defined in Equation (6).
where represents the average signal intensity, and represents the average noise intensity. The total number of profile data obtained from the ultrasonic propagation simulation in Section 2.1 is 768. For these data, the operations to add white noise at different SNRs (3 dB, 6 dB, 9 dB, 12 dB, 15 dB, 18 dB, 21 dB, 24 dB, 27 dB, 30 dB) were performed ten times. A total of 7680 training data sets were created. The second set involves applying a lowpass filter to the data with added white noise from the first operation (hereafter referred to as “low-pass data”), which is prepared as training data. In this study, the cutoff frequency of the lowpass filter was set to 400 kHz. The total number of lowpass data points was 7680.
Finally, we created the test data using the ultrasonic propagation simulation described in Section 2.1. As shown in Figure 4, the anomaly was set to 30 mm and placed at the center of the normal section, with only one anomaly positioned. The ultrasonic propagation simulation was performed each time the transmitter was moved, with the anomaly fixed, and the transmitter moved 64 times to each position of the receivers CH0 to CH63. The other simulation conditions were the same as those listed in Table 1 and Table 2. A total of 64 profile datasets were collected for testing. Similar to the training data, the test data were subjected to the addition of white noise. The SNRs for the test data were set to values not used in the training data: 0 dB, 10 dB, and 20 dB. The total number of test data sets was 192 (profile data count: 64 sets × 3 SNRs).
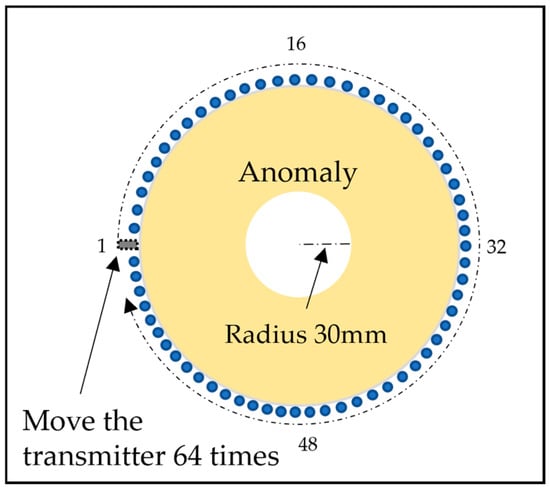
Figure 4.
Test data to be created by ultrasonic propagation simulation. The blue dots are receivers. The ultrasonic propagation simulation was performed each time the transmitter was moved, with the anomaly fixed, and the transmitter moved 64 times to each position of the receivers CH0 to CH63.
2.4. Network Design
In this study, we estimated the TOF using CNNs [27]. The proposed network structure and its details are presented in Figure 5 and Table 3. As shown in Figure 5, we first normalized the input data using the z-score, as described in Equation (7).
where and are the mean and standard deviation of the amplitude of the waveform.
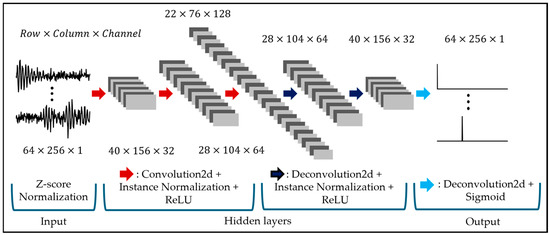
Figure 5.
Network structure of the proposed 2D CNNs.

Table 3.
Acoustic properties of each section in ultrasonic propagation simulation.
Next, down-sampling was performed using convolutional layers, instance normalization, and the ReLU function. Subsequently, up-sampling was conducted using deconvolutional layers, instance normalization, and the ReLU function, with the sigmoid function used for the output [28,29]. In this study, the holdout method was employed, splitting the data into 75% for training and 25% for validation. The number of epochs was set to 200, and the batch size was adjusted between 4 and 128. The loss functions used were binary cross-entropy, as described in Equation (8), and L2 loss, as described in Equation (9). Equation (10) shows the combined loss function that incorporates both Equations (8) and (9).
From Equation (8), represents the label data, is the output of the model, and is the output of the sigmoid function. is the weight applied when the label data are 1. In this study, was set as 255. According to Equation (9), are the weights of the model, is the total number of weights, and is a parameter that adjusts the strength of normalization. was set to . The optimization algorithm used was stochastic gradient descent, with a learning rate of .
The model was constructed with the following environment and PC configuration: Python3.7, Pytorch ver1.11.0, Windows10 Education (64 bit), 12th Gen Intel(R) Core(TM) i7-12700K@3.61 GHz, DDR4-3200 32 GB, and Nvidia GeForce RTX4060ti 16 GB.
2.5. Signal Processing Methods and Evaluation Methods
In this study, to compare the accuracy of the proposed method, two traditional one-dimensional signal processing techniques were employed. The two signal processing methods are a simple threshold method and a squared amplitude integral method [6,8]. The threshold method was the same as the one used to create the label data in Section 2.2. The squared amplitude integral method involves squaring the waveform amplitudes and setting a threshold based on the total energy of ultrasonic waves. To evaluate the TOF estimation accuracy, the average errors of the TOF estimated using these two signal processing methods and the proposed method were calculated using the label data created in Section 2.2.
Finally, CT images were created using the Filtered Back Projection (FBP) method [8] with TOF data sets from the proposed method and two signal processing methods. The CT images were evaluated using PSNR and SSIM. The PSNR and SSIM were calculated using Equations (11) and (12), respectively [30,31].
where represents the ideal reconstructed image created using the FBP method from the label data, and represents the reconstructed image created using the FBP method for the TOF estimated using the proposed method or signal processing methods.
and are described in Equation (12). and represent the mean luminance values, and represent the variances of the luminance values, and represents the covariance. and are arbitrary constants that are inserted to prevent division by zero. In this study, was set to , and was set to . was the dynamic range of the pixel values and was set to 255.
3. Results
Figure 6 shows the convergence curve of the loss function during CNN training. The results of the proposed method are presented for two models trained with different types of training data: proposed noise and proposed lowpass. Proposed noise is a model trained using noise data, whereas proposed lowpass is a model trained using lowpass data. Table 4 and Table 5 show the SNR dependency of the maximum and average errors in the TOF estimates obtained using the proposed method and traditional signal processing methods with test data. According to Table 4, both proposed noise and proposed lowpass show smaller maximum errors in the TOF across all SNRs compared with the two signal processing methods, with differences ranging from 1.5 to 30 times. Similarly, Table 5 indicates that both proposed noise and proposed lowpass exhibit smaller average errors in the TOF across all SNRs than the two traditional signal processing methods.

Figure 6.
Convergence curves of the loss function when training CNNs with noise or lowpass data: (a) Training loss and validation loss when training CNNs with noise data. (b) Training loss and validation loss when training CNNs with lowpass data.

Table 4.
Maximum TOF error for each method (unit: s).

Table 5.
Average TOF error for each method (unit: s).
Figure 7 shows the images reconstructed using the FBP method from the TOF estimates obtained using each method. The ground truth (GT) in Figure 7 is an ideal CT image reconstructed using the label data. In Figure 7, the proposed noise and proposed lowpass depict the outer shape of the normal section and identify the anomaly across all SNRs. However, fine linear artifacts were observed in the normal section for all SNRs, with particularly large linear artifacts visible in the test data at an SNR of 0 dB. The threshold method is capable of image reconstruction at an SNR of 20 dB but fails to represent the normal section at other SNRs. The squared amplitude integral method failed to represent the normal section for all SNRs.
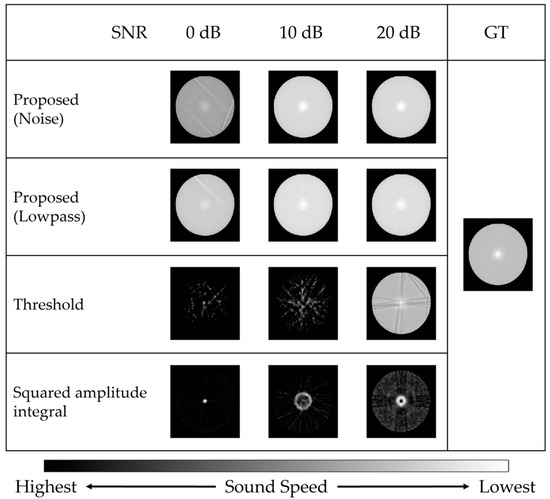
Figure 7.
CT images reconstructed using the FBP method from the TOF estimated by each method.
Figure 8 and Figure 9 present the PSNR and SSIM scores for each reconstructed image, respectively. Higher PSNR and SSIM scores indicate better image quality, with the maximum score for SSIM being 1. As shown in Figure 8, the PSNR scores for proposed noise and proposed lowpass are above 20 across all SNRs. Furthermore, as shown in Figure 9, the SSIM scores for proposed noise and proposed lowpass are above 0.9 across all SNRs, indicating high scores.
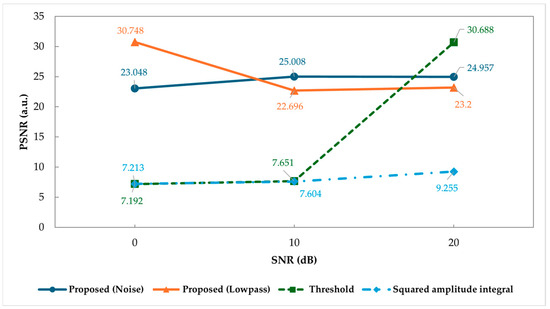
Figure 8.
PSNR score for each reconstructed image.
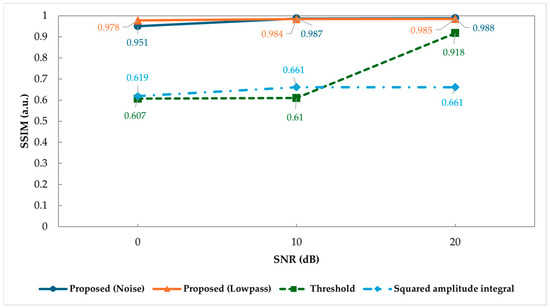
Figure 9.
SSIM score for each reconstructed image.
4. Discussion
We obtained the profile data of fan-beam ultrasonic waveforms containing white noise from an SNR of 3–30 dB using an ultrasonic propagation simulation and created a TOF estimation model using two-dimensional CNNs. Consequently, we successfully estimated the longitudinal-wave TOF with greater accuracy than the two types of signal processing methods. As shown in Figure 7, the two proposed methods achieved nearly equivalent image reconstruction, even with white noise ranging from an SNR of 0 to 20 dB in the ultrasonic waveforms. Notably, the results of the proposed noise and proposed lowpass at an SNR of 0 dB indicate that they can correctly estimate the TOF even when the noise is of the same magnitude as the signal components. Subjectively comparing these two results, the reconstructed image from the proposed lowpass at an SNR of 0 dB shows fewer large linear artifacts and better represents the normal and anomalous sections. This is also corroborated by the PSNR and SSIM scores shown in Figure 8 and Figure 9. Additionally, large linear artifacts were noticeable in the results of the proposed noise at an SNR of 0 dB and the threshold method at an SNR of 20 dB. According to Table 5, the average errors for these CT images are not significantly higher than those of other SNRs, with the proposed noise at an SNR of 0 dB having an average error of 0.421 and the threshold method at an SNR of 20 dB having an average error of 2.36. However, from Table 4, the maximum errors are considerably different, with the proposed noise at an SNR of 0 dB at 68.5 and the threshold method at an SNR of 20 dB at 55.5. This suggests that larger maximum errors may contribute to the presence of larger linear artifacts.
As shown in Figure 8 and Figure 9, at an SNR of 20 dB, the PSNR scores of the threshold method were higher than those of the two proposed methods, whereas the SSIM scores were lower for the threshold method. Observing the reconstructed images at an SNR of 20 dB in Figure 7, the image of the threshold method shows large linear artifacts. By contrast, the reconstructed images from the two proposed methods did not exhibit large linear artifacts. By subjectively comparing the reconstructed images, those without large linear artifacts felt that they were more accurately reconstructed. This suggests that SSIM may be closer to subjective evaluations than PSNR, indicating that SSIM could be a more suitable image evaluation method for this study.
5. Conclusions
In this study, we examined the effectiveness of a TOF estimation method using two-dimensional CNNs. We investigated the accuracy of estimating the TOF using fan-beam-shaped ultrasonic waveforms compared to using single waveforms alone. Additionally, we explored how the noise contained in ultrasonic waveforms affects the TOF estimation and clarified the dependency of the estimation accuracy on the amount of noise. Images were reconstructed from the estimated TOF using the FBP method and evaluated using the two image evaluation methods. It was found that the accuracy of the TOF estimation significantly worsens with decreasing SNR when using signal processing methods with thresholds. In contrast, the method proposed in this study demonstrated nearly equivalent TOF estimation accuracy across all SNRs. Moreover, it was confirmed that satisfactorily reconstructed images could be obtained from the TOF estimates using the proposed method, even with white noise ranging from an SNR of 0 to 20 dB.
Supplementary Materials
The following supporting information can be downloaded at https://www.mdpi.com/article/10.3390/technologies12080129/s1.
Author Contributions
Conceptualization, Y.M., and H.Y.; methodology, Y.M., Y.S., and H.Y.; software, Y.M. and Y.S.; validation, Y.M., Y.S., and H.Y.; formal analysis, Y.M. and Y.S.; investigation, Y.M., Y.S., and H.Y.; resources, Y.M., and H.Y.; data curation, Y.M., Y.S., T.S. (Toshiyuki Sugimoto), T.S. (Tadashi Saitoh), T.T., and H.Y.; writing—original draft preparation, Y.M. and H.Y.; writing—review and editing, Y.M., T.S. (Toshiyuki Sugimoto), T.S. (Tadashi Saitoh), T.T., and H.Y.; visualization, Y.M. and H.Y.; supervision, T.S. (Toshiyuki Sugimoto), T.S. (Tadashi Saitoh), T.T., and H.Y.; project administration, H.Y.; funding acquisition, Y.M., and H.Y. All authors have read and agreed to the published version of the manuscript.
Funding
This research was supported by JST, the Establishment of University Fellowships Towards the Creation of Science Technology Innovation, grant number JPMJFS2104.
Institutional Review Board Statement
Not applicable.
Informed Consent Statement
Not applicable.
Data Availability Statement
Data are contained within the article.
Conflicts of Interest
The authors declare no conflicts of interest.
References
- Zheng, Y.; Wang, S.; Zhang, P.; Xu, T.; Zhuo, J. Application of Nondestructive Testing Technology in Quality Evaluation of Plain Concrete and RC Structures in Bridge Engineering: A Review. Buildings 2022, 12, 843. [Google Scholar] [CrossRef]
- Khalili, P.; Cawley, P. The choice of ultrasonic inspection method for the detection of corrosion at inaccessible locations. NDT E Int. 2018, 99, 80–92. [Google Scholar] [CrossRef]
- Schabowicz, K. Modern acoustic techniques for testing concrete structures accessible from one side only. Arch. Civ. Mesh. Eng. 2015, 15, 1149–1159. [Google Scholar] [CrossRef]
- Reddy, M.U.; Filly, A.R.; Copel, A.J. Prenatal Imaging: Ultrasonography and Magnetic Resonance Imaging. Obset. Gynecol. 2008, 112, 145–157. [Google Scholar] [CrossRef] [PubMed]
- Tomikawa, Y.; Iwase, Y.; Arita, K.; Yamada, H. Non-Destructive Inspection of Rotted or Termite Damaged Wooden Poles by Ultrasound. Jpn. J. Appl. Phys. 1985, 24, 187. [Google Scholar] [CrossRef]
- Yanagida, H.; Tamura, Y.; Kim, K.M.; Lee, J.J. Development of ultrasonic time-of-flight computed tomography for hard wood with anisotropic acoustic property. Jpn. J. Appl. Phys. 2007, 46, 5321–5325. [Google Scholar] [CrossRef]
- Fan, H.; Yanagida, H.; Tamura, Y.; Guo, S.; Saitoh, T.; Takahashi, T. Image quality improvement of ultrasonic computed tomography on the basis of maximum likelihood expectation maximization algorithm considering anisotropic acoustic property and time-of-flight interpolation. Jpn. J. Appl. Phys. 2010, 49, 07HC12-1–07HC12-6. [Google Scholar] [CrossRef]
- Fujii, H.; Adachi, K.; Yanagida, H.; Hoshino, T.; Nishiwaki, T. Improvement of the Method for Determination of Time-of-Flight of Ultrasound in Ultrasonic TOF CT. SICE J. Control. Meas. Syst. Integr. 2015, 8, 363–370. [Google Scholar] [CrossRef]
- Nogami, K.; Yamada, A. Evaluation experiment of ultrasound computed tomography for the abdominal sound speed imaging. Jpn. J. Appl. Phys. 2007, 46, 4820–4826. [Google Scholar] [CrossRef]
- Queirós, R.; Alegria, F.C.; Girão, P.S.; Serra, A.C. Cross-correlation and sine-fitting techniques for high resolution ultrasonic ranging. IEEE Trans. Instrum. Meas. 2010, 59, 3227–3236. [Google Scholar] [CrossRef]
- Juan, C.W.; Hu, J.S. Object Localization and Tracking System Using Multiple Ultrasonic Sensors with Newton–Raphson Optimization and Kalman Filtering Techniques. Appl. Sci. 2021, 11, 11243. [Google Scholar] [CrossRef]
- Yang, F.; Shi, D.; Lo, L.Y.; Mao, Q.; Zhang, J.; Lam, K.H. Auto-Diagnosis of Time-of-Flight for Ultrasonic Signal Based on Defect Peaks Tracking Model. Remote Sens. 2023, 15, 599. [Google Scholar] [CrossRef]
- Lu, Z.; Ma, F.; Yang, C.; Chang, M. A novel method for Estimating Time of Flight of ultrasonic echoes through short-time Fourier transforms. Ultrasonics 2020, 103, 106104. [Google Scholar] [CrossRef] [PubMed]
- Lu, Y.; Demirli, R.; Cardoso, G.; Saniie, J. A successive parameter estimation algorithm for chirplet signal decomposition. IEEE Trans. Ultrason. Ferroelect. Freq. Contr. 2006, 53, 2121–2131. [Google Scholar] [CrossRef] [PubMed]
- Cowell, D.M.J.; Freear, S. Separation of overlapping linear frequency modulated (LFM) signals using the fractional Fourier transform. IEEE Trans. Ultrason. Ferroelect. Freq. Contr. 2010, 57, 2324–2333. [Google Scholar] [CrossRef] [PubMed]
- Wei, L.; Huang, Z.Y.; Pei, W.Q. Sparse deconvolution method for improving the time-resolution of ultrasonic NDE signals. NDT E Int. 2009, 42, 430–434. [Google Scholar] [CrossRef]
- Purwins, H.; Li, B.; Virtanen, T.; Schluter, J.; Chang, S.Y.; Sainath, T. Deep learning for audio signal processing. IEEE J. Sel. Top. Sign. Proces. 2019, 13, 206–219. [Google Scholar] [CrossRef]
- Xu, Y.; Du, J.; Dai, L.R.; Lee, C.H. A regression approach to speech enhancement based on deep neural networks. IEEE/ACM Trans. Audio Speech Lang. Process. 2014, 23, 430–434. [Google Scholar] [CrossRef]
- Rethage, D.; Pons, J.; Serra, X. A wavenet for speech denoising. In Proceedings of the 2018 IEEE International Conference on Acoustics, Speech and Signal Processing (ICASSP), Calgary, AB, Canada, 15–20 April 2018; pp. 5069–5073. [Google Scholar]
- Li, Z.; Wu, T.; Zhang, W.; Gao, X.; Yao, Z.; Li, Y.; Shi, Y. A study on determining time-of-flight difference of overlapping ultrasonic signal: Wave-transform network. Sensors 2020, 20, 5140. [Google Scholar] [CrossRef]
- Shpigler, A.; Mor, E.; Bar, H.A. Detection of overlapping ultrasonic echoes with deep neural networks. Ultrasonics 2022, 119, 106598. [Google Scholar] [CrossRef]
- Shi, Y.; Xu, W.; Zhang, J.; Li, X. Automated Classification of Ultrasonic Signal via a Convolutional Neural Network. Appl. Sci. 2022, 12, 4179. [Google Scholar] [CrossRef]
- Ross, Z.E.; Meier, M.A.; Hauksson, E. P Wave Arrival Picking and First-Motion Polarity Determination With Deep Learning. JGR Solid Earth 2018, 123, 5120–5129. [Google Scholar] [CrossRef]
- Treeby, B.E.; Cox, B.T.; Jaros, J. k-Wave User Manual. Available online: http://www.k-wave.org/manual/k-wave_user_manual_1.1.pdf (accessed on 8 May 2024).
- Treeby, B.E.; Jaros, J.; Rohrbach, D.; Cox, B.T. Modeling Elastic Wave Propagation Using the k-Wave MATLAB Toolbox. In Proceedings of the 2014 IEEE International Ultrasonics Symposium, Chicago, IL, USA, 3–6 September 2014; pp. 146–149. [Google Scholar]
- Berenger, J.P. A perfectly matched layer for the absorption of electromagnetic waves. J. Comput. Phys. 1994, 114, 185–200. [Google Scholar] [CrossRef]
- Krizhevsky, A.; Sutskever, I.; Hinton, G.E. ImageNet Classification with Deep Convolutional Neural Networks. In Proceedings of the Advances in Neural Information Processing System 25 (NIPS 2012), Lake Tahoe, NV, USA, 3–6 December 2012; pp. 1097–1105. [Google Scholar]
- LeCun, Y.; Bengio, Y.; Hinton, G. Deep learning. Nature 2015, 521, 436–444. [Google Scholar] [CrossRef]
- Dumoulin, V.; Visin, F. A guide to convolution arithmetic for deep learning. arXiv 2018, arXiv:1603.07285. [Google Scholar] [CrossRef]
- Hore, A.; Ziou, D. Image Quality Metrics: PSNR vs. SSIM. In Proceedings of the 2010 20th International Conference on Pattern Recognition, Istanbul, Turkey, 23–26 August 2010; pp. 2366–2369. [Google Scholar] [CrossRef]
- Wang, Z.; Bovilk, A.C.; Sheikh, H.R.; Simoncelli, E.P. Image Quality Assessment: From Error Visibility to Structural Similarity. IEEE Trans. Img. Proc. 2004, 13, 600–612. [Google Scholar] [CrossRef]
Disclaimer/Publisher’s Note: The statements, opinions and data contained in all publications are solely those of the individual author(s) and contributor(s) and not of MDPI and/or the editor(s). MDPI and/or the editor(s) disclaim responsibility for any injury to people or property resulting from any ideas, methods, instructions or products referred to in the content. |
© 2024 by the authors. Licensee MDPI, Basel, Switzerland. This article is an open access article distributed under the terms and conditions of the Creative Commons Attribution (CC BY) license (https://creativecommons.org/licenses/by/4.0/).