3.1. Results of Main Parameters for the 70 kg User
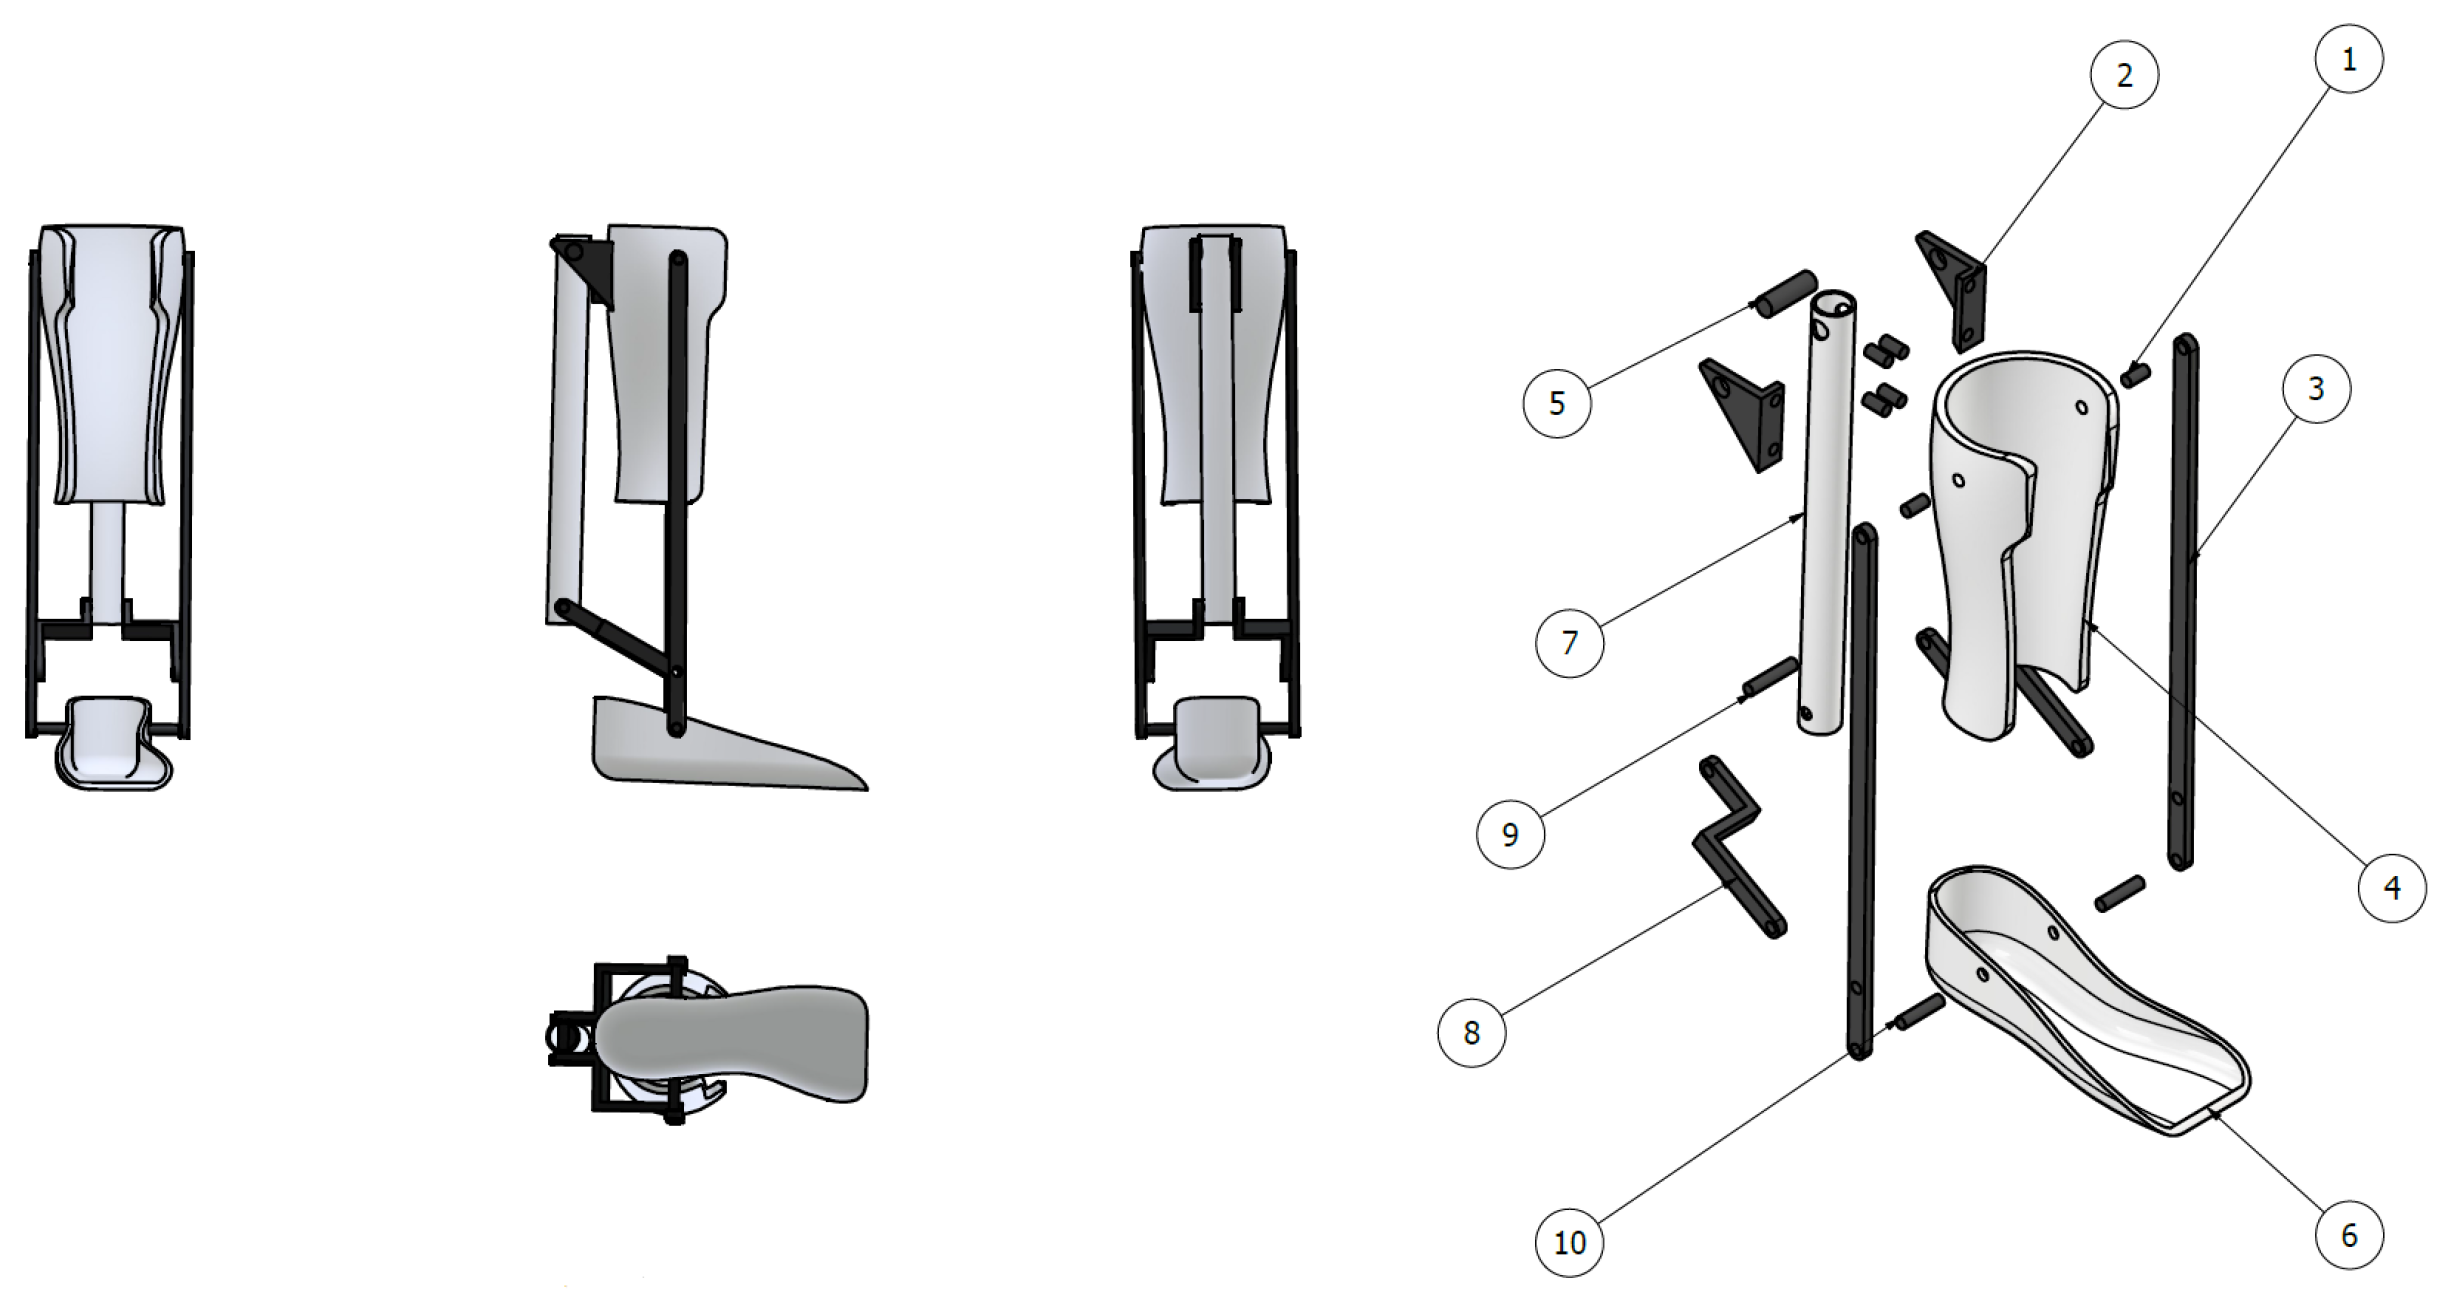
All of the aforementioned procedures were carried out in order to create an exoskeleton that was a perfect fit for the leg of the 66-year-old user. Using the anatomical dimensions of his leg, an ergonomic exoskeleton was created, which included the following:
The device’s viability in the market necessitated the decision to 3D-print the whole mechanical design, and choosing a composite with high hardness and reasonable pricing was a key component in this process. For this reason, a numerical simulation was carried out in the environment of Autodesk Inventor 2021 in order to evaluate two composites. The first composite was ABS, which is a material that is frequently used in applications that include 3D printing [
49]. Furthermore, a carbon fiber-reinforced polymer (with a percentage of 20% of carbon fiber) of the brand Bambu Lab was also used due to its great performance in the prototyping of trans-medium vehicles [
50].
The materials library in Autodesk Inventor 2021 was used to conduct numerical simulations of all the composites used in the piece design. While ABS is already available at this gallery, carbon fiber-reinforced polymer is not. So, with the goal of incorporating the physical features that this material delivers per the manufacturer’s standards, a new material named “Carbon Fiber-Reinforced Polymer” was added to the program gallery.
Performing the numerical simulations on the exoskeleton was the following step, followed by a numerical comparison of both materials’ physical quantities. We simulated ABS and “Carbon Fiber-Reinforced Polymer” in Autodesk Inventor 2021 to determine their Von Mises stress, first principal stress, and safety coefficient.
ABS was the first composite material to be simulated.
Figure 3a shows its Von Mises stress,
Figure 3b shows the first principal stress, and
Figure 3c shows the safety coefficient results, respectively.
As may be seen from the figures, numerical data pertaining to the magnitudes were gathered and are displayed in
Table 3.
Figure 4 shows the outcomes of applying the same simulations to the carbon fiber-reinforced polymer.
Next,
Table 4 contains the numerical values for this composite.
The following conclusions can be drawn once the lowest and highest values for the two composites have been recorded in
Table 3 and
Table 4, respectively:
Since the average Von Mises stress value for ABS is 10.13 MPa and for carbon fiber-reinforced polymer, it is 10.09 MPa, there is not much difference between the two composites. The results of the simulations (shown in
Figure 3a and
Figure 4a) demonstrate this.
Based on the first principal stress data, it is evident that the ABS (
Figure 3b) has closer minimum and maximum values compared to the carbon fiber-reinforced polymer (
Figure 4b). As a result, the average first principal stress for ABS is 7.075 MPa, while for the polymer, it is 6.87 MPa.
The safety coefficient values obtained from the ABS and polymer simulations are drastically different. The ABS simulation shows numerous red-colored zones in its structure with values ranging from 0.994 μL to 15 μL (
Figure 3c), while the polymer simulation shows substantially higher values ranging from 14.869 μL to 15.00 μL (
Figure 4c).
Following a comparison of the numerical values for the required physical magnitudes, it is possible to conclude that the Von Mises stress and first principal stress parameters do not determine which simulated material is better for the ankle exoskeleton. This is due to the reason that both of these parameters exhibit optimal structural values.
On the other hand, when the safety coefficient is analyzed, the values of ABS are found to be lower than 1 μL in some regions. Instead, values that are lower than 14.869 μL along the structure do not appear in the simulations that were carried out with the carbon fiber-reinforced polymer.
In order to choose which of the two materials is the best for the manufacture of this exoskeleton, it is important to take into account design criteria for plastic components, in which it is explained that the safety coefficient for this kind of component, according to the behavior of the mechanism designed in this research, must be at least 10 μL [
51]. This makes it possible to specify that the carbon fiber-reinforced polymer (14.869 μL) offers better performance for the development of the ankle exoskeleton of the research since it offers optimum hardness and the necessary reliability for the application of the device in comparison with ABS (0.994 μL).
3.2. Results of Main Parameters Varying the User’s Weight
After comparing the breaking capacity of both materials for a 70 kg user, it was necessary to study the behavior of the mechanical design in different scenarios. To carry out the analysis, the simulation environment carried out with the software was entered, and new numerical simulations were performed by varying the user’s weight, which caused Equation (
9) to be modified for each of them; based on this, new load values were entered in the software.
On the other hand, as shown in
Figure 3 and
Figure 4, most of the pieces of the exoskeleton did not suffer considerable deformations or stress with the applied load since, along their geometries, they presented blue zones or optimum design zones. However, it was observed that the piece called the heel of the exoskeleton suffered considerable deformations and stress since it presented zones where a greater analysis should be carried out (red-colored zones). For this reason, and to improve the analysis of the mechanical design, subsequent simulations will focus only on this part and not on the entire exoskeleton since doing so would incur an unnecessary computational cost for the other parts that are not in a risky condition and do not need to be analyzed in greater detail.
Also, since it was determined that carbon fiber-reinforced polymer is better than ABS, a graphical approach was taken for this material, but the numerical approach for both materials is presented later.
Table 5 shows a summary of the weights entered and their respective loads generated.
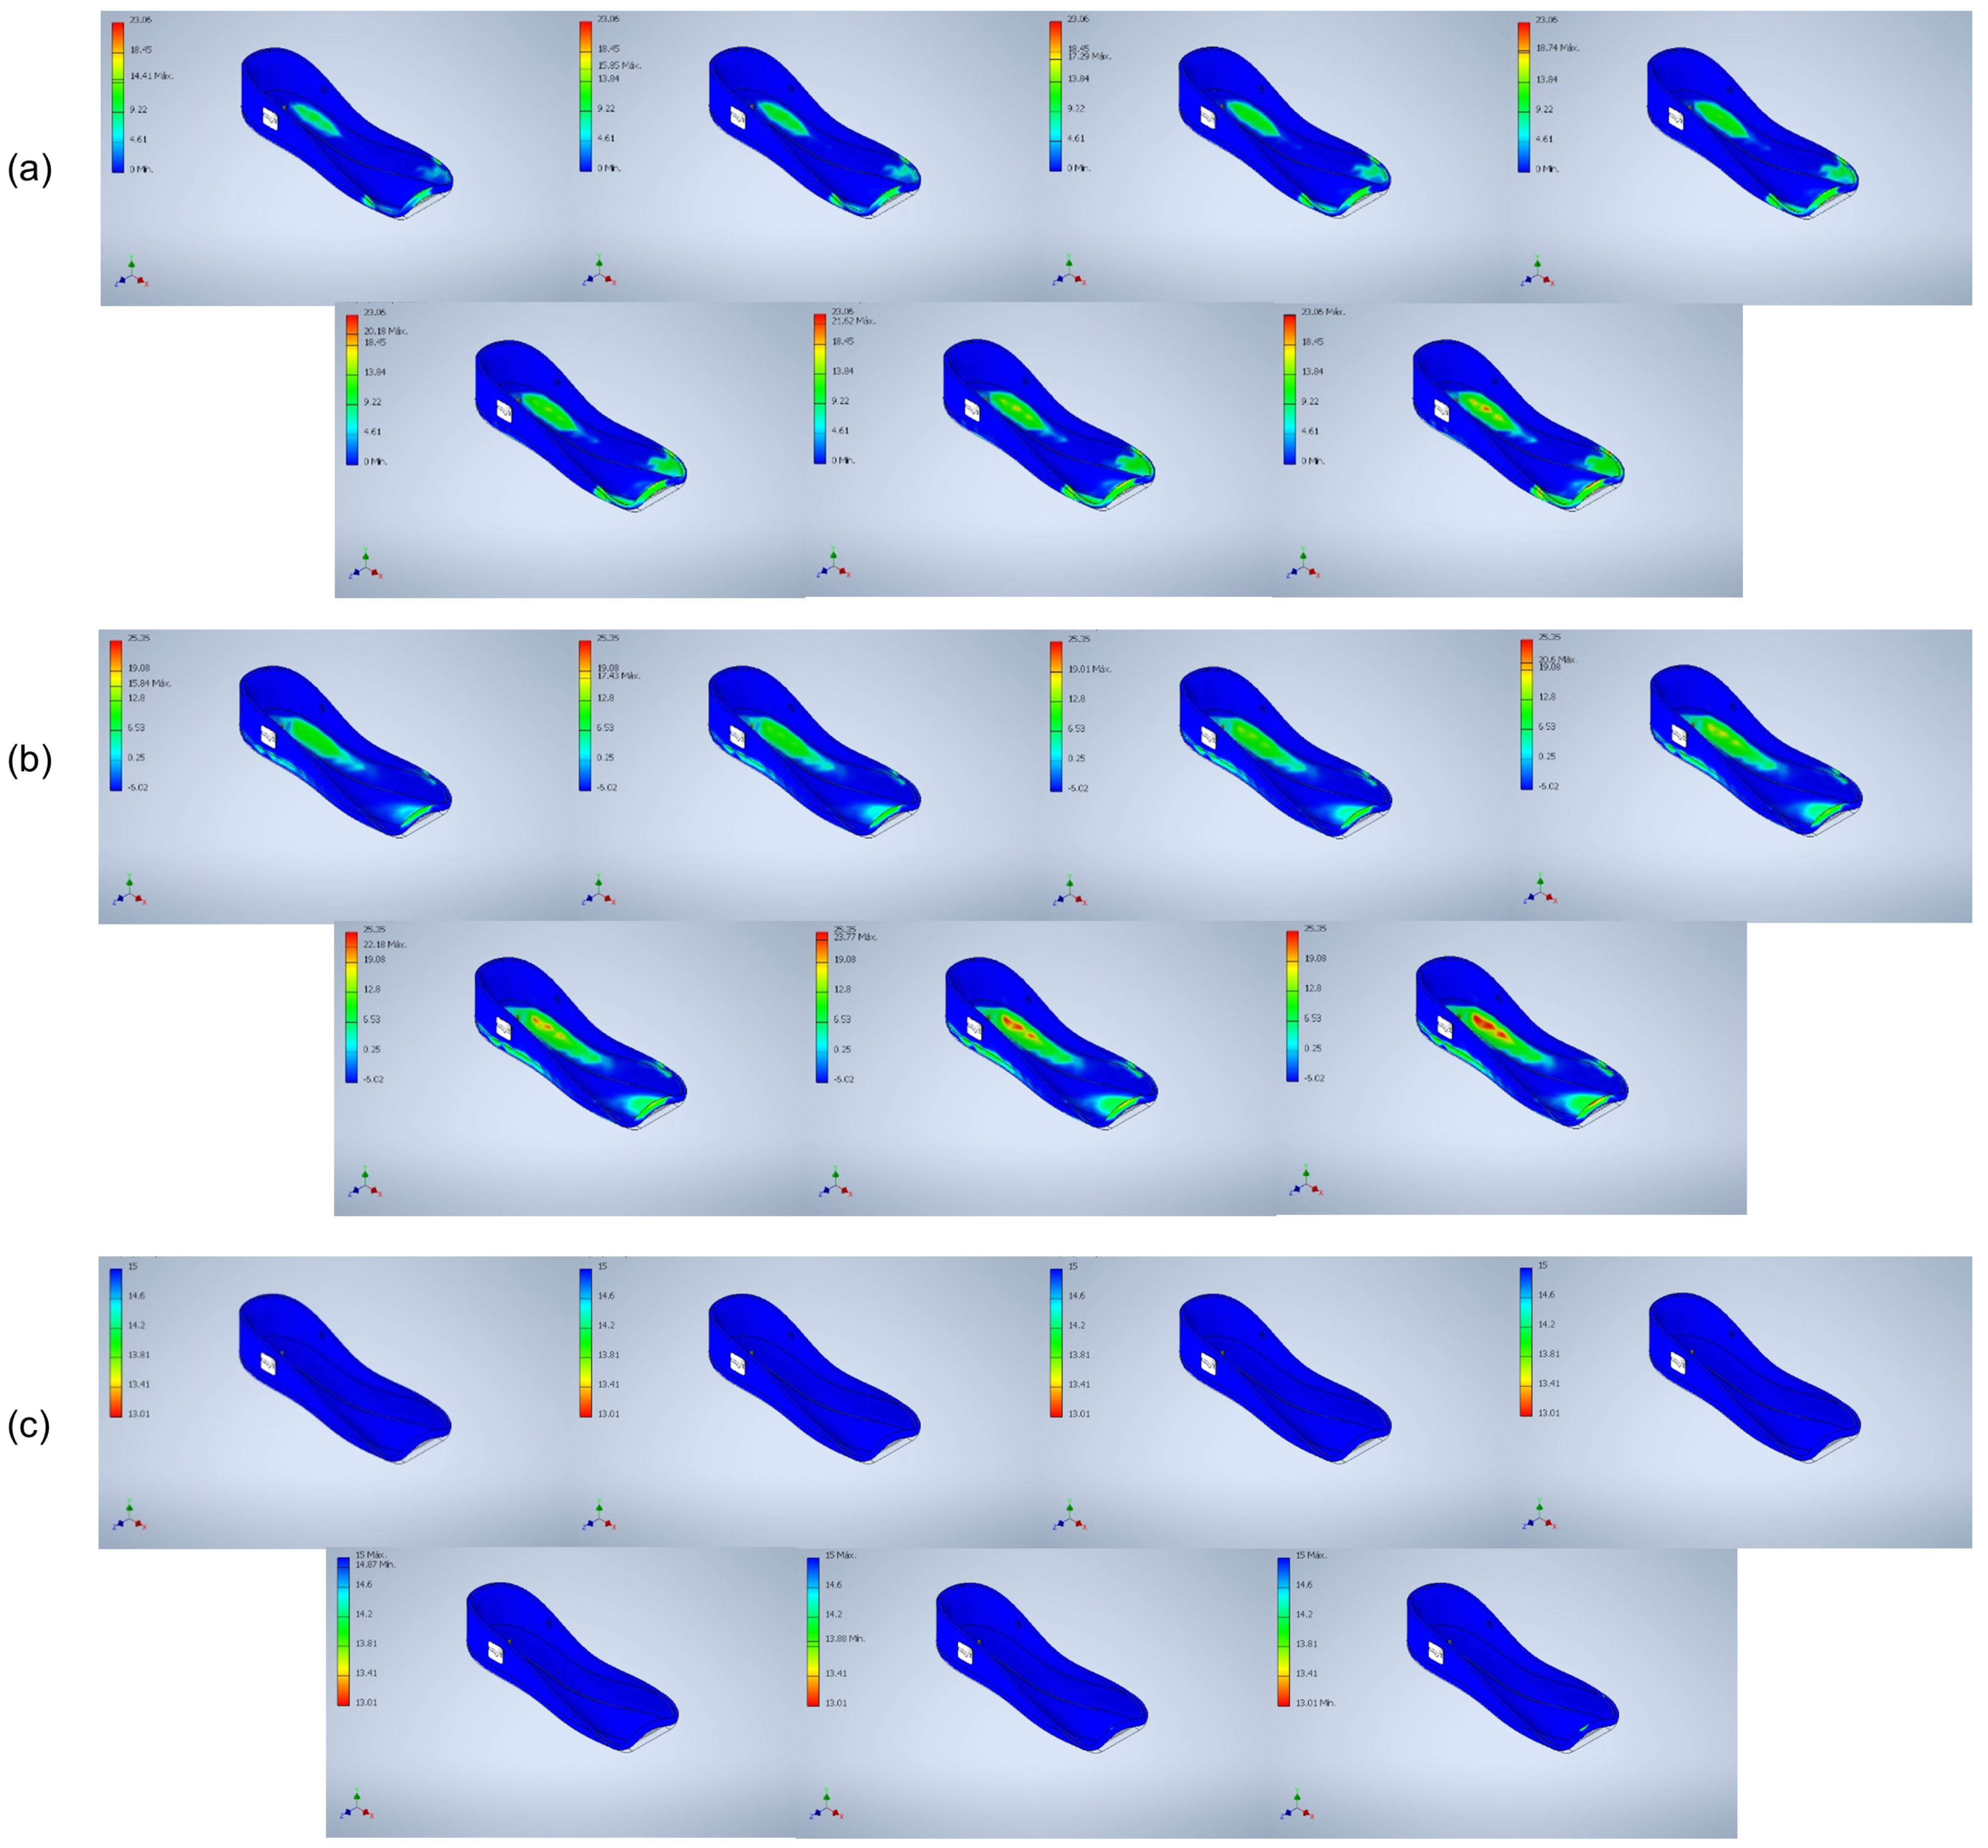
The loads described in the table above were entered into the software, and with them, new plots were obtained for the carbon fiber-reinforced polymer. First, seven Von Mises stress plots were obtained, which are shown as a set in
Figure 5a. Then, under the same data entry process with the new loads generated in the software, the new seven first principal stresses applied to the mechanical design for users between 50 and 80 kg were obtained. They are shown grouped in
Figure 5b. Finally, the safety coefficient plots validated in the research ankle exoskeleton design were simulated with the same weights, and the results obtained were grouped into one, as shown in
Figure 5c.
The graphical results show slight visual variations. Contrasting each group of simulations in which the minimum and maximum peaks of each study are presented, the following is observed:
Blue areas predominate in the seven Von Mises stress plots. In the last image of this group, there is more green coloration, but it does not represent a significant area of the total, indicating that there is no considerable deformation in the exoskeleton heel structure.
In the first principal stress graphs, it is observed that there are no critical areas (red-colored zones) until the last image of the group is reached. However, this is not enough to consider that the piece may suffer some kind of volumetric deformation when used.
If attention is paid to the last graph of the safety coefficient study, slight green coloration is observed at the heel end of the exoskeleton, but it does not represent a risk factor for breakage of the piece since more than 99% of the area presents blue zones (optimum design zones).
The above graphs are useful for observing the piece in real conditions, but to understand the behavior of the exoskeleton it is necessary to analyze the numerical values for each of the studies.
Table 6 shows the weights used as input data to the software and then the corresponding minimum and maximum values of Von Mises stress, the first principal stress, and safety coefficient for the carbon fiber-reinforced polymer.
It is clear from looking at this table that, as the user’s weight increases (from 50 kg to 80 kg), the minimum and maximum values of Von Mises stress also increase: the minimum values range from 0.0001319 MPa to 0.0002110 MPa, and the maximum values range from 14.4116 MPa to 23.0586 MPa. For the case of the first principal stress, the same thing happens: the maximum values increase from 15.8447 MPa to 25.3516 MPa, and the minimum values change on a negative scale, starting at −6.0286 MPa and ending at −9.6457 MPa.
Finally, when looking at the safety coefficient, the maximum values remain at 15 μL, but the minimum values decay as the weight increases, going from 15 μL to 13.0104 μL for the heaviest user. These values make sense because, as the weight of the user increases, so does the Von Mises and first principal stresses in a direct proportion; in addition, as for the safety coefficient, an inverse proportion is observed.
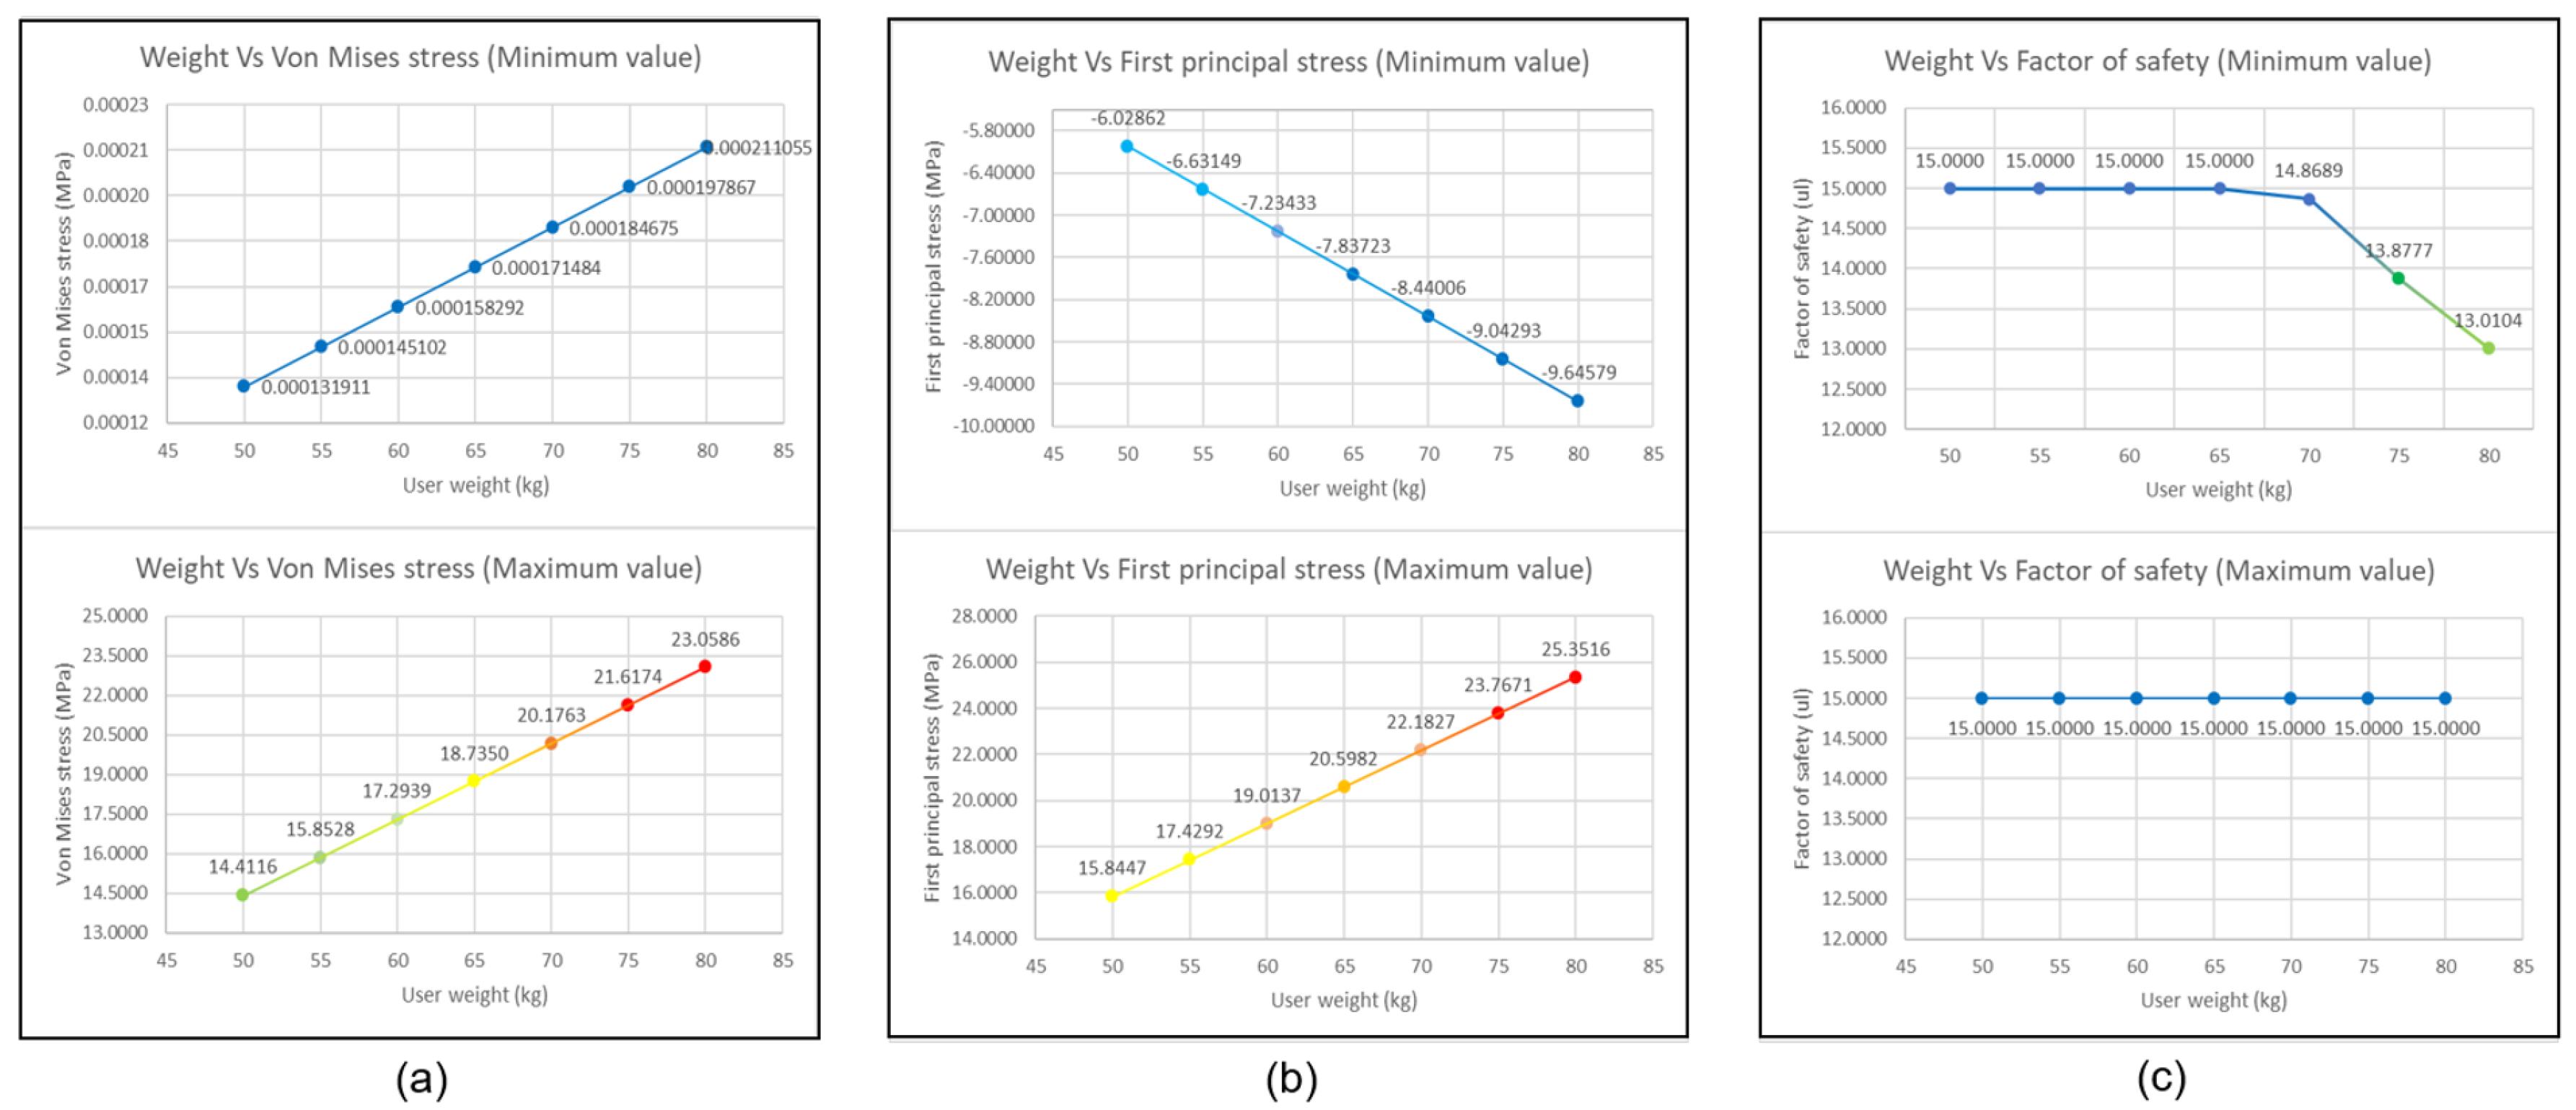
With the numerical data obtained, scatter plots were generated, which were used to draw trend lines and to predict the behavior of the piece at more specific values that can be placed in the range of 50–80 kg.
Figure 6a, which represents the trend lines for the Von Mises stress, is shown below. Likewise, the graphs for the first principal stress are shown in
Figure 6b. Finally,
Figure 6c shows the trend lines of the piece for the safety coefficient.
Looking at
Figure 6a, concerning Von Mises tension, it can be determined that the trend line of minimum values and that of maximum values behaves linearly with increasing projection. In
Figure 6b, regarding first principal stress, we can see that the trend line of minimum values has a linearity with a tendency to increase on a negative scale, and the trend line of maximum values also shares linearity but with projection to grow in positive scale. In the case of
Figure 6c, regarding the safety coefficient, the trend line of the minimum values is a constant with a value of 15 μL until reaching a value of 65 Kg; from there, we can see how the trend line behaves in a decreasing and linear way, and finally, the trend line of maximum values is a constant with a value of 15 μL.
Parallel to this,
Table 7 presents the numerical values of the simulations performed on the exoskeleton heel, but with ABS as the manufacturing material, only to compare both materials. When analyzing this table, the behavior of the user’s weight with respect to the Von Mises stress and first principal stress is directly proportional to the safety coefficient, inversely proportional in the same way as observed in
Table 6.
On the other hand, the values of the first two parameters are very similar to those in
Table 6; however, the safety coefficient does present a notable difference in the minimum values, which range from 1.3821 μL to values below zero, such as 0.8638 μL, and this shows, once again, that the carbon fiber-reinforced polymer offers better performance than ABS.
Finally, plots were made to compare the deviation between simulated and theoretical values. For this, and for practical purposes, the exact point where the load is assigned to the heel of the exoskeleton was taken as a reference. At this point, the values of Von Mises stress, the first principal stress, and safety coefficient simulated with the help of the software were calculated, and the theoretical values were also found for each weight of the previous study (users between 50 and 80 kg). The results obtained are presented in
Figure 7. Analysis of these graphs shows that the theoretical values of Von Mises stress are higher compared to the simulated values according to
Figure 7a, and considering that Von Mises stress translates into the deformation of an object, it can be stated that the simulated figures offer a better scenario for the piece in which the piece is guaranteed to be rigid and firm. For the first principal stress, it was obtained, according to
Figure 7b, that the simulated values are higher than the theoretical values, and because they are on the negative scale, both values are optimal for the exoskeleton design. Finally, based on
Figure 7c, it is observed that the simulated values are higher than the theoretical values, and as it is already known, the higher the values of this parameter, the more durable and resistant to fracture or cracking the analyzed body will be. In other words, within the simulation framework, this piece offers better performance.
As can be seen in the previous figures, the theoretical values are not equal to those of the simulations obtained, and this is mainly because we focused on only one point of the entire geometry of the exoskeleton heel to calculate the theoretical values. In contrast, in the simulation environment, all the values for the infinite points of the piece geometry are mapped, and based on these, an average is performed to show the value at a specific point.
As the values of the three parameters were focused on the same point, the calculation criteria were different, and these caused the theoretical and simulated figures not to be the same. The deviation between theoretical and simulated values is seen in
Table 8.
After analyzing both criteria and the three measured parameters, it should be noticed that the simulated environment presents the piece with a better performance for the range of users of the study case compared to the theoretical environment and, as the simulation generates its result based on many more values than the theoretical calculation, it can be concluded that this criterion will be more accurate and reliable when validating the geometry of the heel of the exoskeleton.
In contrast, to determine whether the contacts designed for the exoskeleton were optimal, an interference check was performed. For this application it was necessary to use other software specialized in this type of analysis, and in this case, Ansys tools were used. First, the design made in Autodesk Inventor 2021 was imported to Ansys SpaceClaim 2024, and then Ansys Mechanical 2024 was used to configure a mesh with 47,934 elements and perform the necessary analysis.
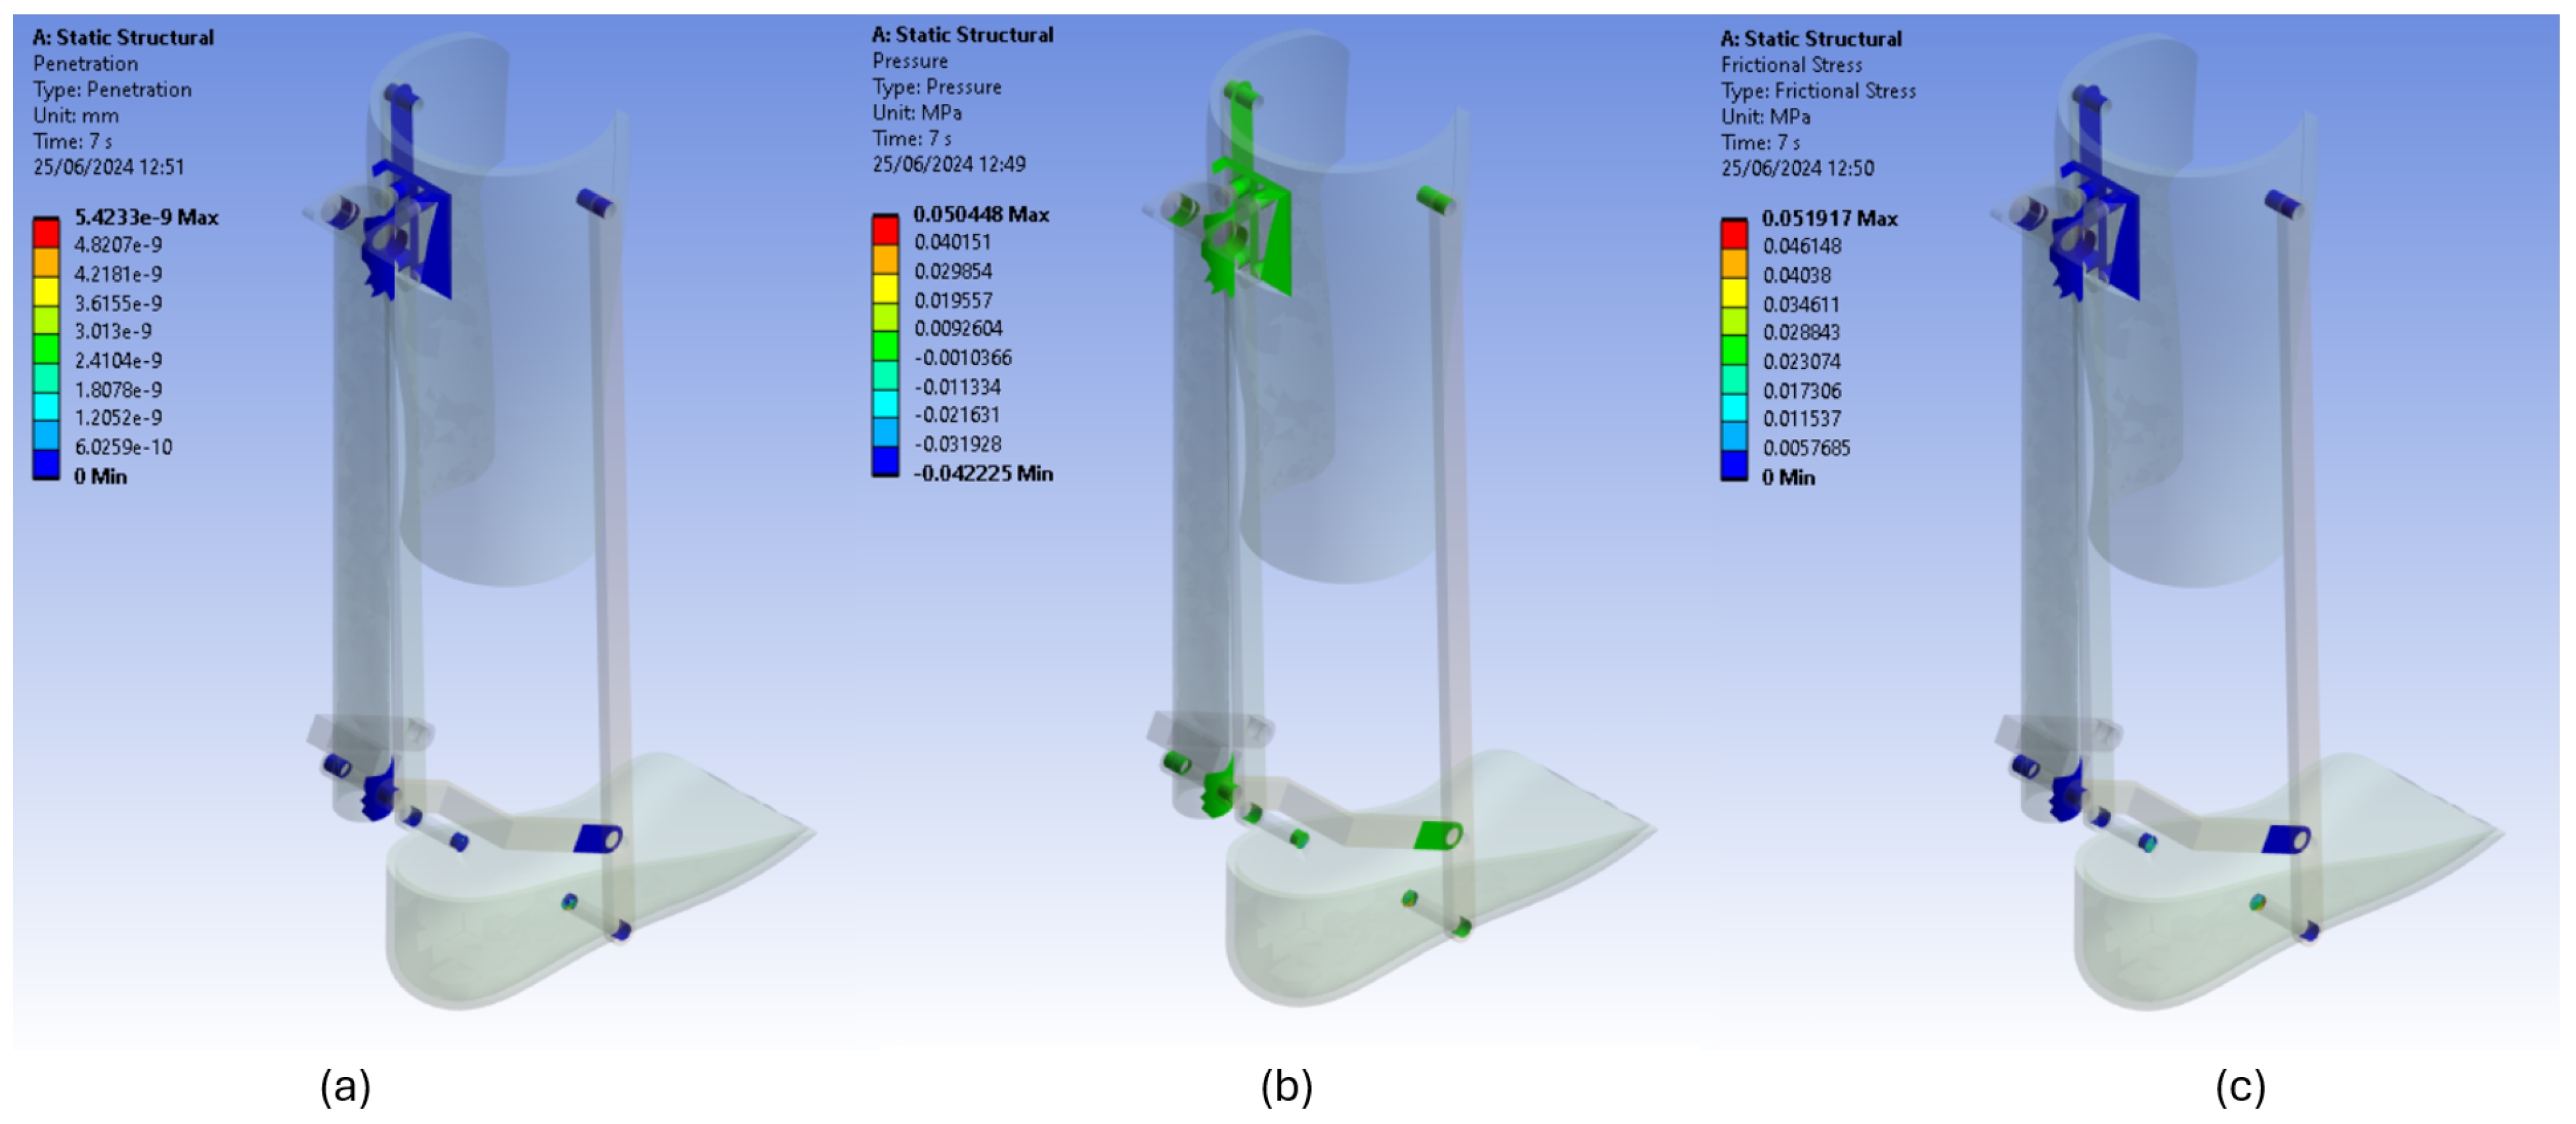
Figure 8 shows three graphs in which the exoskeleton contacts were analyzed.
After analyzing the previous graph, the following was determined:
Figure 8a shows the penetration that exists between the contacts of the exoskeleton, and as can be seen in the numerical scale, the values range from 0 mm to
mm. The second value shows that there is practically no penetration in the contacts of the design since this value is very low and reaches almost zero. This allows for the definition that the design of the contacts is optimal since no considerable penetration is observed, and although it is true that there are values different from zero, it may be due to the configuration of the mesh and not to the geometry of the components.
On the other hand,
Figure 8b shows the pressure between the exoskeleton contacts. The range of values for this analysis fluctuates between −0.042225 MPa and 0.050448 MPa, which shows that the contacts are not subjected to considerable pressure after applying the load since, if we analyze these values, it can be defined that the magnitude of pressure in the contacts is very low with respect to other values present in the analysis, such as the Von Mises stress that reaches up to 23.0586 MPa (
Table 6). This remarkable difference allows us to define that the pressure in the contacts will not be a risk factor for the design of the exoskeleton.
Finally,
Figure 8c shows the frictional stress in the exoskeleton contacts, and its numerical values range from 0 MPa to 0.051917 MPa. As can be observed in the graph, red zones (zones of maximum value) are not very present in the contacts, and this is mainly due to the fact that, at the time of designing the exoskeleton parts, some necessary distances were taken into consideration so that each of them is not exposed to a frictional force. This is reflected in the values of the graph and allows us to determine that the contacts are well-designed and will support the load that the user will produce during its use.
Likewise, tests were carried out to determine the ergonomics of the designed device and establish whether the mechanism could be used by the user of the study. In this sense, as analyzed in previous sections, the dorsiflexion movement sweeps an angle of 30°, whereas the plantar flexion movement has 40° of angular travel.
This is the reason why a schematic of the human´s lower extremity was designed in the Autodesk Inventor environment with its approximate measurements.
This model was then configured with that of the ankle exoskeleton to simulate the attachment of the device and to determine whether the mechanism developed complies with the normal anatomical rotation function of the human body. Planes were deployed in the vertical and horizontal axes around what would become the user’s ankle.
Then the device was placed together with the leg in a neutral position in which they would form an approximate angle of 90°. For this simulation, an angle of 90.06° was achieved, as can be seen in
Figure 9a. Afterwards, a maximum dorsiflexion movement was simulated so that the device did not suffer alterations in its structure; that is, the maximum movement allowed by the design was carried out. In this sense, as can be seen in
Figure 9b, the angle obtained between the initial axial plane and the axial plane during movement was 31.91°. In contrast, for the plantar flexion movement, the maximum movement was performed without altering the structure of the mechanism in the Autodesk Inventor 2021 environment, as presented in
Figure 9c.
The angle formed between the initial axial plane of the ankle and the axial plane during movement was 63.67°.
Table 9 shows the data obtained and the theoretical data studied in the previous sections.
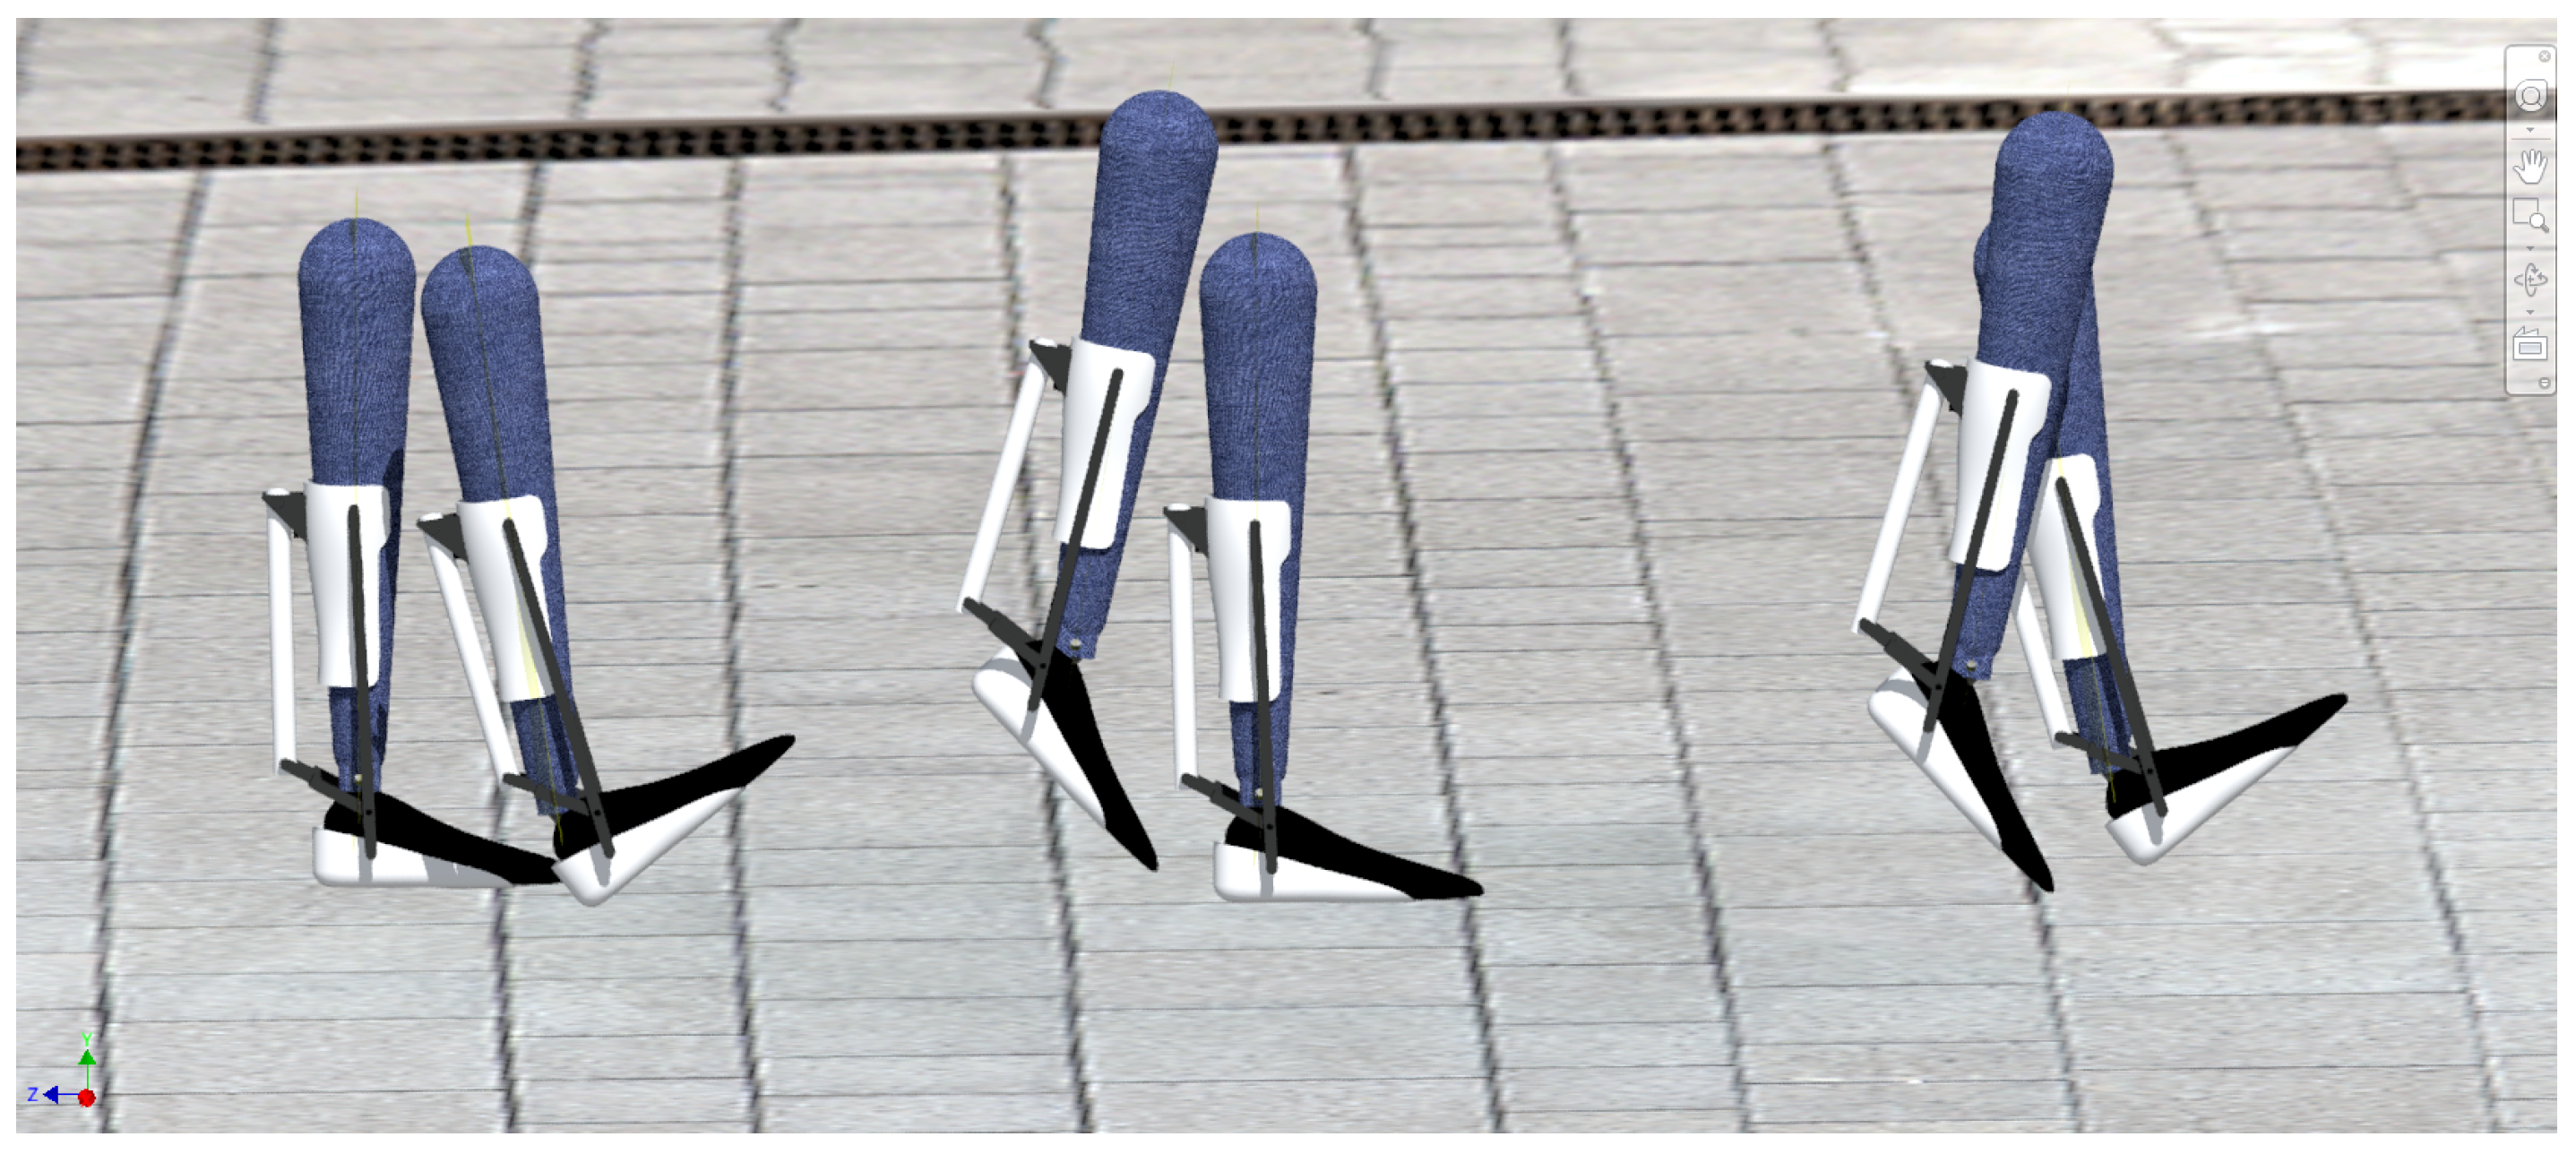
Likewise, to observe the behavior of the ankle exoskeleton together with the model of the leg of the user of this study during walking, a simulation was performed, as shown in
Figure 10. This graph presents the main moments of walking: the initial contact, support phase, and propulsive phase, where the movements of dorsiflexion and plantar flexion of the ankle are involved. The graph demonstrates that the design correctly fulfils its mobility in conjunction with the user’s leg and its anatomical principle.
Finally, because the mass of the designed exoskeleton is important in order not to generate a greater weight on the user, a data export was performed from the Autodesk Inventor software, and a report was obtained, as shown in
Figure 11, where it is observed that the mass of the device is 0.361456 kg. This value confirms once again that the design is optimal because it has a very light mass and will not affect the user during testing.

