Article

Blood Pressure Measurement Device Accuracy Evaluation: Statistical Considerations with an Implementation in R

1
Institute of Biomedical Technologies, Auckland University of Technology, Auckland 1010, New Zealand
2
Department of Mathematical Sciences, Auckland University of Technology, Auckland 1010, New Zealand
*
Author to whom correspondence should be addressed.
Technologies 2024, 12(4), 44; https://doi.org/10.3390/technologies12040044
Submission received: 19 February 2024 / Revised: 22 March 2024 / Accepted: 22 March 2024 / Published: 25 March 2024

Abstract

:
Inaccuracies from devices for non-invasive blood pressure measurements have been well reported with clinical consequences. International standards, such as ISO 81060-2 and the seminal AAMI/ANSI SP10, define protocols and acceptance criteria for these devices. Prior to applying these standards, a sample size of N >= 85 is mandatory, that is, the number of distinct subcjects used to calculate device inaccuracies. Often, it is not possible to gather such a large sample. Many studies apply these standards with a smaller sample. The objective of the paper is to introduce a methodology that broadens the method first developed by the AAMI Sphygmomanometer Committee for accepting a blood pressure measurement device. We study changes in the acceptance region for various sample sizes using the sampling distribution for proportions and introduce a methodology for estimating the exact probability of the acceptance of a device. This enables the comparison of the accuracies of existing device development techniques even if they were studied with a smaller sample size. The study is useful in assisting BP measurement device manufacturers. To assist clinicians, we present a newly developed “bpAcc” package in R to evaluate acceptance statistics for various sample sizes.

1. Introduction

Blood pressure (BP) is extensively used to assist health monitoring and diagnosis in healthcare settings. However, inaccuracies in BP measurement can result in misjudgments, potentially leading to severe consequences [1]. The clinical gold standard for BP measurement is BP measurement performed using arterial cannulation [2]; however, arterial cannulation is invasive and time-consuming and can only be performed by skilled personnel. It is also linked with cases of ischemia, lesions of nerves or vessels, embolism, and other complications [3]. In regular cases, BP is measured non-invasively [4], which yields measurement inaccuracies. Even slight measurement inaccuracies can result in misclassifying millions of individuals [5]. Hence, a precise measurement of blood pressure holds significant importance in public health. Underestimating true BP by merely 5 mmHg or less can have significant clinical consequences as several studies have inferred incorrect tagging of more than 20 million Americans as pre-hypertensive when, in fact, they are suffering from hypertension. Untreated hypertension can lead to a 25% increased risk of fatal strokes and fatal myocardial infarctions [1]. Conversely, if there is an overestimation of true BP by 5 mmHg, nearly 30 million Americans may receive inappropriate treatment with antihypertensive medications. This could result in exposure to potential side effects of the drugs, psychological distress due to misdiagnosis, and unnecessary financial liability [5]. In healthcare domains such as intensive care, accurate BP measurement is even more crucial. As a result, regulating BP measurement devices is a critical matter, and suitable processes must be used for clinical investigations to validate BP devices.
National regulators have made significant efforts towards global harmonization of the standards for medical devices. When designing a blood pressure (BP) measurement device, manufacturers must adhere to standardized protocols, ensuring that the device’s inaccuracy falls within an acceptable range, typically expressed as mean error ± standard deviation of BP errors for non-invasive techniques. Even when within acceptable limits, continuous efforts are made to improve the accuracy using improved methods by adding parameters associated with blood pressure [6,7,8]. This pursuit aims to provide healthcare professionals with more reliable BP readings, reducing the likelihood of errors and supporting informed decision-making. The International Organization for Standardization (ISO), established in 1947, defines standards that are accepted worldwide. It comprises representatives from various national standards organizations. The ISO 81060-2:2018 standard defines the criterion for the clinical investigation of automated, non-invasive sphygmomanometers [9] and has been approved for use currently and recognized in whole or part by many national regulators. It supersedes region-specific standards such as EN 1060-4:2004 [10] and has been adopted in law, in contrast to validation protocols such as those recommended by the British Hypertension Society [11] and the European Society of Hypertension [12].
ISO 81060-2:2018 stipulates criteria for determining the acceptable accuracy of sphygmomanometers that originated from the initial work of the Committee of US Association for the Advancement of Medical Instrumentation (AAMI) in creating the American Standard for manual, electronic, or automated sphygmomanometers known as SP10 [13]. The standard also specifies safety, labeling, and performance requirements designed to ensure the safety and effectiveness of the device. ISO 81060-2, like SP10, mandates a minimum sample size (N) of 85 participants to be used to evaluate the BP device inaccuracy [9]. In addition to N >= 85, the standard requires the BP errors to be within −10 mmHg to 10 mmHg, also known as the tolerable error limit, and the estimated probability of tolerable error ( p ^ ) to be at least 85%. In practice, it is found that accuracy requirements are difficult to achieve, and process requirements are costly. Manufacturers attempt to adhere to this standard. However, only a small fraction of manufacturers can do so [14]. A study reports that less than 20% of the devices accessible today conform to an established guideline [2].
While compliance with this standard is appropriate for devices that are to be marketed, there are purposes other than regulation of medical devices for which studies involving fewer participants can still yield useful information. For instance, early evaluation of experimental devices would benefit from an earlier checkpoint, as it is often difficult for clinicians to gather 85 participants [15,16,17]. Currently, to our knowledge, there is no official method for evaluating studies with fewer participants. As a result, various research works in this field adopted potentially incorrect pass/fail criteria of the standard apparently without recognizing the difference between their research methods and those assumed by the standard. This paper aims to inform researchers and BP device manufacturers about the potential effects of employing different sample sizes for the validation of a BP measurement device.
We also offer recommendations to adjust the appropriate acceptance range (upper limit of acceptable standard deviation for a certain mean error) required for any study to adhere to criteria similar to the SP10 requirements. In addition to the different acceptance limits for different sample sizes, this paper provides a brief comparison of previous studies that investigated novel BP measurement methods with different sample sizes, and also assesses their adherence to the current standard.

2. SP10 Statistical Considerations

2.1. SP10 Acceptance Criteria

Multiple techniques are used for automated, non-invasive BP measurement. Most researchers/clinicians use an inflatable cuff to hinder the flow of blood in the upper arm. As the cuff is deflated, various methods can be employed to estimate the systolic and diastolic blood pressure (SBP; DBP) [18]. The error in estimation is the difference between the values obtained from the test device and the value obtained using a reference method, which is normally specified as auscultation by trained observers [19]. Acceptance criteria evolved from SP10′s inception in 1987 to reflect a more defined statistical treatment that is currently adopted in ISO 81060-2.
Initially, the standard required that manufacturers should maintain the mean of errors within ±5 mmHg with a standard deviation no greater than 8 mmHg [20]. However, these static values did not consider the relation between the mean and standard deviation of errors. For the same standard deviation, p ^ will be different if the sample mean is 0 mmHg and if the sample mean is 5 mmHg. Hence, SP10′s criteria (reproduced as Table A1 in Appendix A) was introduced to span different values of the sample mean and the upper limit of standard deviation such that 85% of the errors are within the tolerable error range, where p ^ = 0.85 . These values of acceptable standard deviation for a given sample mean represent the acceptance limit. For instance, for a mean error of 2 mmHg, the standard deviation must be less than or equal to 6.65 mmHg to accept the device. But this estimated probability of tolerable error ( p ^ ) is itself an estimate.
How far off it is from the true value depends on the sample size. As per SP10, a sample size of N = 85 yields a 90% chance or confidence that p ^ will not differ by more than about 0.07 from its true probability of tolerable error ( p ) [20], given by
p ^ p = 1.645 × K ,
where K = 1 2 π ( N 1 ) and N is the sample size. We will refer to this difference as the “90% confidence between p and p ^ ”. In Equation (1), K is the standard deviation of the distribution of probability of tolerable error which is assumed to be asymptotically normal according to the SP10 standard, where the mean of the distribution is p ^ . Thus, for the device to be acceptable, p ^ must be at least 85% for N = 85, because then one can be confident that p is at least 78%, as per the standard.

2.2. Brief Review of the Problem

2.2.1. Acceptance Criteria

According to SP10, Table A1 can be used with any number of participants, but it only considers the acceptance limit that is suitable for N ≥ 85. However, studies with fewer participants than the minimum of 85 specified by SP10 are not uncommon. For instance, one study proposes a novel BP estimation method based on Pulse Arrival Time (PAT) to estimate SBP and DBP [16]. Using 32 subjects, they report the BP error limit, mean error ± SD. These limits are 0.12 ± 6.15 (SBP, mmHg) and 1.31 ± 5.36 (DBP, mmHg). Another study validates a wireless BP monitor using 33 participants [6]. The estimated BP errors were −0.7 ± 6.9 mmHg for SBP and −1 ± 5.1 mmHg for DBP. A new calibration procedure that accounts for the Sympathetic Nervous System (SNS) on BP-PTT (Pulse Transit Time) was also proposed to estimate BP values using 10 subjects [21]. All these studies attain the p ^ = 0.85 criteria mentioned in SP10, but the sample size is less than 85. For smaller sample sizes, there is little guidance on how the acceptance limit should change such that one can be 95% certain that the true probability is at least 78%, which is recognized as the threshold for acceptability by SP10. While these studies are potentially valuable, it would be inappropriate to interpret results by making a comparison to the criteria in the standard which is just fixed for N = 85.
At present, the 90% confidence between p ^ and p which is evaluated using Equation (1) only considers the sample size of a specific study. Using this 90% difference value, the standard makes some assumptions about the p ^ such that p   0.78. However, variations in the 90% difference are not only due to changes in sample size but also to the value of p ^ , obtained from the reported sample mean and standard deviation from the BP device. To tackle this issue, we propose a methodology that provides a more flexible approach to evaluating the 90% confidence between p ^ and p with respect to the sample size, sample mean, and standard deviation from a statistical point of view. With this approach, the value of p ^ can be evaluated for different sample sizes, which we can use to study the changes in the acceptance limit of different sample sizes such that the devices under test adhere to the SP10 criteria.

2.2.2. Probability of Acceptance ( P A )

As a result of the acceptance limit varying with sample size, the probability of acceptance, which essentially gives the probability of meeting the SP10 criterion for a particular sample mean, standard deviation, and sample size, will fluctuate. In this regard, this research also provides a mechanism for a more relevant comparison of the mean and standard deviation of the data from studies with varying sample sizes. To effectively compare studies with smaller sample sizes and distinguish the methodology (e.g., techniques and mathematical methods) being used to develop the BP measurement devices, a more robust statistical treatment is required to re-evaluate the literature less subjectively as per the international standards. We present aspects behind the computation of the probability of acceptance, denoted by P A .
There are two key outcomes from this work. First, we study the changes in the acceptance limit for different sample sizes such that they adhere to the standards when the sample size is less than N = 85. Secondly, we provide a methodology for evaluating the probability of acceptance P A , allowing comparison of different studies with varying sample sizes, assessing the accuracy of different methods and techniques being tested to build BP measurement devices. This work has a companion R package called “bpAcc” which implements the methodology introduced in this paper. This enables manufacturers and researchers to better judge their compliance with the accuracy criteria of ISO 81060-2 using a smaller sample size and more appropriately compare studies performed using different sample sizes.

3. Methodology

This section outlines the theoretical details of this research starting from the protocols currently in use by the SP10 standard. The parameters utilized in this section are also outlined in Table A2 within Appendix C.

3.1. Brief Review of the Statistical Components of SP10

3.1.1. Average Error and Tolerable Error

For each of the N participants, k = 3 pairs of blood pressure measurements are obtained: one measurement, δ k 1 j , produced by the usual auscultatory reference method, and the other, δ k 2 j , produced by the device being assessed. The difference, ϵ k j = δ k 2 j δ k 1 j , is called an error, and the average error for the j t h participant is
δ j = k = 1 3 ϵ k j 3   , j = 1 , , N
Statistically, we assume the average errors δ j produced by the device D follow a θ -parameterized distribution F = F ( θ ). The maximum average error accepted, also known as the tolerable error, is denoted by Δ. The tolerable error is set to Δ = 10 mmHg in this work, following the SP10 standard. Hence, the probability of tolerable error is given by
P   ( | δ j |   10 ;   θ )   =   F   ( 10 ;   θ )     F   ( 10 ;   θ ) .
The errors produced by any device are deemed acceptable if p is a minimum of γ p , i.e.,
p = P | δ j | 10 ; θ γ p ,   0   γ p 1
Fundamentally, we assume the errors δ j follow a normal distribution with parameters θ = ( μ p , σ p ) T , μ p ℝ, σ p > 0 . μ p and σ p are the mean and standard deviation of the errors produced by the device readings and will be referred to as true mean error (or true bias) and true standard deviation, respectively.

3.1.2. σ γ P Acceptance Curve

Our interest focuses on σ γ p M A X , a bivariate function of ( μ p , γ p ) given by
σ γ p M A X = σ γ p ( μ p , γ P ) = m a x σ p ; P | δ j | 10 ; θ = ( μ p , σ p ) T γ P ,
for μ p ∈ (−10, 10) and fixed γ P ∈ (0, 1). The curve is called the σ γ P acceptance curve, or simply the acceptance curve. For every μ p ,   σ γ p M A X is given by the maximum sample standard deviation producing a probability of tolerable error of at least γ P . Figure 1 shows σ γ P acceptance curves represented by σ M A X for γ P 0.75 , 0.80 , 0.85 , 0.90 , 0.95 , and μ p in (10, 10).

3.1.3. ANSI/AAMISP10 Acceptance Criterion

As per the SP10 standard [20], a device D will be deemed acceptable if the estimated probability of tolerable error p ^ is at least γ p = 0.85, and the sample size is 85 subjects. From Equation (5), we define the σ A A M I acceptance curve as
σ A A M I = σ 0.85 M A X σ p ; P δ j 10 ; θ = ( μ p , σ p ) T 0.85 ,
with μ p   (−10, 10), θ = ( μ p , σ p ) T . Since σ γ P acceptance curves narrow down as shown in Figure 1 as γ P decreases, without loss of generality, we assume that the σ A A M I acceptance curve is obtained at γ p = 0.85, which is as follows:
σ A A M I = m a x σ p ; P δ j 10 ; θ 0.85 = σ p ; P δ j 10 ; θ = 0.85 .
The σ A A M I acceptance curve is the thick black line and is given by the solution to
P | δ j | ; θ = ( μ p , σ p ) T = 0.85 .
with = 10, and μ 0 ϵ ( 10 , 10 ) .
However, in practice, only size-limited samples of BP measurements are available for testing the device D. In the following, we will introduce the statistical assumptions required in this work. Let S ι = δ ι 1 , . . . , δ ι n be a size-n sample of BP average errors δ ι with δ ι ~ N ( μ p , σ p ) . The S ι -sample mean, and S ι -sample standard deviation are denoted by x ¯ ι and s ι , respectively. We will remove the superscripts 1, …, n for simplicity.
Crucially, we replace μ p with x ¯ ι in Equation (8). Then, the highest permissible value for s ι rendering the device σ 0.85 -acceptable, denoted by σ 0.85 A A M I , is the function of x ¯ ι given by
σ 0.85 A A M I = σ 0.85 A A M I ( x ¯ ι ) = σ p ; P | δ ι | 10 ; x ¯ ι = 0.85 .
As a result, the device D is deemed acceptable under the SP10 acceptance criterion if and only if s ι σ 0.85 A A M I ( x ¯ ι ) .
The values σ 0.85 A A M I for fixed x ¯ ι are obtained by directly applying the bisection method to Equation (7) as a function of σ p . Table 1 gives σ 0.85 A A M I to selected values of μ p = x ¯ ι . The pairs ( x ¯ ι , σ 0.85 A A M I ) mentioned in the table are the values displayed in Figure 1 as red dots.

3.2. Sampling Distribution of Sampling Proportions

SP10′s confidence limits for p, or true probability of tolerable error, rely on approximations of the Gaussian density using Taylor expansions around the mean and standard deviation [20], providing a biased, standard error depending just on N of the form 1 2 π N 1 and 95% confidence limits given by p ^ ± 1.645 × 1 2 π N 1 .
In this paper, as opposed to [20], we adopt a statistical standpoint to address the uncertainty attached to p ^ . Consider the binomial random variable, say Y, given by the number of errors falling in the interval [−10, 10]. The probability of “occurrence” or errors falling in [−10, 10], denoted with p, is central to this paper. Essentially, we estimate p via maximum likelihood estimation (MLE) using the sampling distribution of proportions which results from the theoretical probability distribution of random-sampled proportions of fixed-size N from the population of errors. The MLE of p is given by Y N . This method represents our main modeling framework allowing us to estimate p and compute probabilities associated with any sample. This framework has been implemented in the package “bpAcc” in R software, R version 4.2.0 [22].
The distribution of p, or proportion’s sampling distribution, is asymptotically normal, based on the Central Limit Theorem, requiring a reasonably large sample size for estimation accuracy. Specifically, it requires N p ^ ≥ 5 and N(1 − p ^ ) ≥ 5. Under such conditions, the distribution of p is approximately normal with mean p ^ and standard deviation
s d = p ^ 1 p ^ N .
With the proposed approach, the 90% confidence between p ^ and p is given by
p p ^ = 1.645 × p ^ 1 p ^ N
To comply with the SP10 standards, the 90% confidence between p ^ and p should be such that p ≥ 0.78. In this way, one can evaluate an updated value of p ^ for any sample size (N) using Equation (12). This results in changes in the acceptance limits for different sample sizes which will be discussed in Section 5.
p ^ 1.645 × p ^ 1 p ^ N = 0.78

3.3. Evaluation of the Probability of Acceptance ( P A )

3.3.1. Evaluating the Probability

According to the standard, there is 95% certainty that p ≥ 0.78 with a sample size of N = 85, where 95% is the threshold for the probability of acceptance. This will serve as the benchmark for our proposed methodology, given by
P A = 1 0.78 , p ^ , p ^ 1 p ^ N ,
where is the cumulative density function of the normal distribution. Fundamentally, Equation (13) compares the probability of acceptance for previously published studies with reported mean and standard deviation for the BP errors under different sample sizes. For cases where P A ≥ 0.95, the device meets the SP10 standard. Currently, the acceptance region provided for N = 85 is used to validate devices that have used smaller sample sizes; however, with the proposed approach, we can now provide more insights on whether those devices are complying with the SP10 standards with fewer sample sizes or not.
For inference purposes, the proposed framework relies on reasonably large sample sizes, i.e., N ≥ 39 such that N p ^ ≥ 5 and N(1 − p ^ ) ≥ 5. However, the results provided by the simulation study described in Section 3.3.2 have shown closer approximations even for small sample sizes (N < 39), as shown in Table 2. For instance, μ P = 2 and σ P = 5.5 are used to check for cases of samples that are less than 39 to compare the value of P A . The selection of sample size for comparing the values of P A in Table 2 is informed by some of the previous studies that have utilized smaller sample sizes to assess device inaccuracy through various evaluation methods [23,24,25].

3.3.2. Simulation Study

The simulation study conducted to evaluate the probability of acceptance compares the results obtained with the proposed framework. We investigated a simple situation in which N random numbers from a normal distribution with a known mean and standard deviation were generated. The proportion of errors that fall within the tolerable error range is calculated, yielding the estimated probability of tolerable error, p ^ . The simulations are conducted for sim.count = 20,000 errors, and the proportion of p ^ ≥ 0.78 is evaluated to determine the value of P A . To obtain the probability values shown in Table 2, an R code has been provided in Appendix B.
To obtain an estimate of the proportion of instances that have p ^ ≥ 0.78, this process was repeated 50 times. The proportion obtained in each of these repetitions is comparable with a maximum difference of 0.004. For mean = 2, standard deviation = 5.5, and sample size = 25, the median of these repetitions was 9.982. Future simulations would yield similar medians of proportions with only minute differences. We can demonstrate through simulations that our modeling framework is a better approximation than the present technique for N < 39.

4. Software Implementation

The concept of the acceptance region and the probability of acceptance have been implemented in the package “bpAcc” for the R statistical software. The function for evaluating the acceptance region for different sample sizes is AcceptR(), which directly computes Equation (6). Here, γ P = p ^ is evaluated for a given sample size, N, using Equation (12). The function PAccept() gives the probability of acceptance for a study that has reported a sample mean error and SD for a sample size to validate a BP measurement device. This function directly evaluates Equation (13). Arguments for both the functions from the package are provided in Table 3 and Table 4. The Comprehensive R Archive Network contains concise documentation on user guidance, providing detailed descriptions of package functions and examples. Users can access this documentation when downloading the package in R.

4.1. AcceptR() Function

Figure 2 provides an upper limit on the sample standard deviation to make sure that p ^ is at least 87.47% for N = 33. If the sample mean error is between two values in the table, linear interpolation is implemented. As an example, if the sample mean is −0.7 mmHg, this is (−0.7 + 0.5)/(−1 + 0.5) = 0.40 = 40% of the distance between −1.0 and −0.5, so one uses 0.40 × 6.45 + (1 − 0.40) × 6.50 = 6.48. The sample standard deviation would have to be 6.48 or less to accept the device.

4.2. PAccept() Fuction

During the initial research and development phase of a BP measurement device, different methods can be compared by evaluating P A which gives the probability of a device meeting the standards using the “PAccept()” function. Usually, different sample sizes are used to evaluate the device. This function can be directly used to determine how far existing studies or devices are from the acceptable standard.
For instance, when two methods to develop a device are compared, where Method 1 provides a device inaccuracy with sample mean error ± SD = 4 ± 5.1 and Method 2 provides sample mean error ± SD = 3 ± 6.2 for N = 33, to validate which method provides better accuracy and is acceptable as per the standards, the R code chunk provided in Figure 3 is used.

5. Applications

5.1. Acceptance Region for Different Sample Sizes

Using the proposed methodology, we can obtain the value of p ^ such that the standard criteria are also met using Equation (12). This adjusted value of p ^ for a given N is termed as the revised estimated probability of tolerable error or revised p ^ as illustrated in Figure 4. The figure indicates the changes in the revised p ^ for different sample sizes. This implies that there will be different acceptance regions per sample size as opposed to a single acceptance region in the SP10 standard [20], which is illustrated in Figure 5. The figure shows the acceptance region for a range of sample sizes between 5 and 85, each showing the upper limit of SD for a given mean error that must be followed such that the true probability is at least 0.78 95% of the time to adhere to the SP10 standards.

5.2. BP Technologies: Comparison of Different Methods

Since the acceptance region varies for different sample sizes based on the revised p ^ , the value of P A will also vary for any reported mean error and SD. The P A values can be directly evaluated using Equation (13). Table 5 and Table 6 provide a list of different studies that have reported device inaccuracy based on their development techniques or research methods. The techniques or methods outlined in the tables represent only a subset of the diverse range of technologies employed in the development of blood pressure (BP) measurement devices. While the table highlights specific studies utilizing various methods, it is important to recognize that numerous other technologies and approaches are also being explored within the field of device development. The device inaccuracy in both the tables signifies the error ( x ¯ ± SD) associated with the BP device. These BP estimation errors are measured in mmHg. The proposed methods allow us to evaluate the probability of acceptance of devices reported by these studies and hence also provide a comparison between different BP development techniques/methods. For instance, a study conducted to develop a BP device using an oscillometric method has reported a mean of BP errors x ¯ as −0.7 and SD as 6.9 for a sample size of 33 [6]. The SP10 standard states that 85 samples should be used, and for x ¯ = −0.7 mean BP error, the SD should not be more than 6.95. Even though the SD reported by the study with 33 samples is less than 6.95, it would be incorrect to interpret this as compliance with the SP10 criteria because the smaller sample size will also influence the acceptability. By evaluating P A , we can analyze that effect. For this study, P A ~ 0.87, which is less than the threshold of acceptability upon which SP10 is based, i.e., P A ≥ 0.95. Hence, the device does not meet the criteria of acceptability.

6. Discussion and Conclusions

International standards such as ISO 86010-2 serve an important purpose in providing clarity to consumers, manufacturers, and regulators that medical devices (at least with respect to the scope of the standard) are safe and effective. With this purpose, standards provide clear pass/fail criteria, which reflect the level of a device’s performance and acceptability. In this regard, the pass/fail criteria set out in ISO 86010-2:2018, inherited from SP10, are broadly recognized and represent an implicit definition of what constitutes acceptable errors in blood pressure measurement. In SP10, the mathematical translation of this definition into pass/fail criteria utilizes an approximate approach that results in formulas for confidence intervals that are functions only of the sample size, disregarding the sampling errors in the form of estimated probability of tolerable error. In this work, we have proposed a method using a solid statistical theory to determine confidence intervals. The proportion’s sampling distribution is a more accurate statistical approach for studying the random errors producing p since it additionally takes the mean and the standard deviation of measurement errors into consideration.
By detailing the expected changes in device acceptability, the paper contributes valuable knowledge to the existing research in this field. This work also provides an adjusted acceptance limit of BP errors based on the same definition of acceptable performance underlying the SP10 standard for studies that use a sample size of less than 85. The adjusted limits are expected to be useful in the initial validation of BP technologies. Device manufacturers can use these adjusted acceptance limits to estimate compliance with the standards using smaller sample sizes, reducing the cost of development and/or allowing faster iterative development.
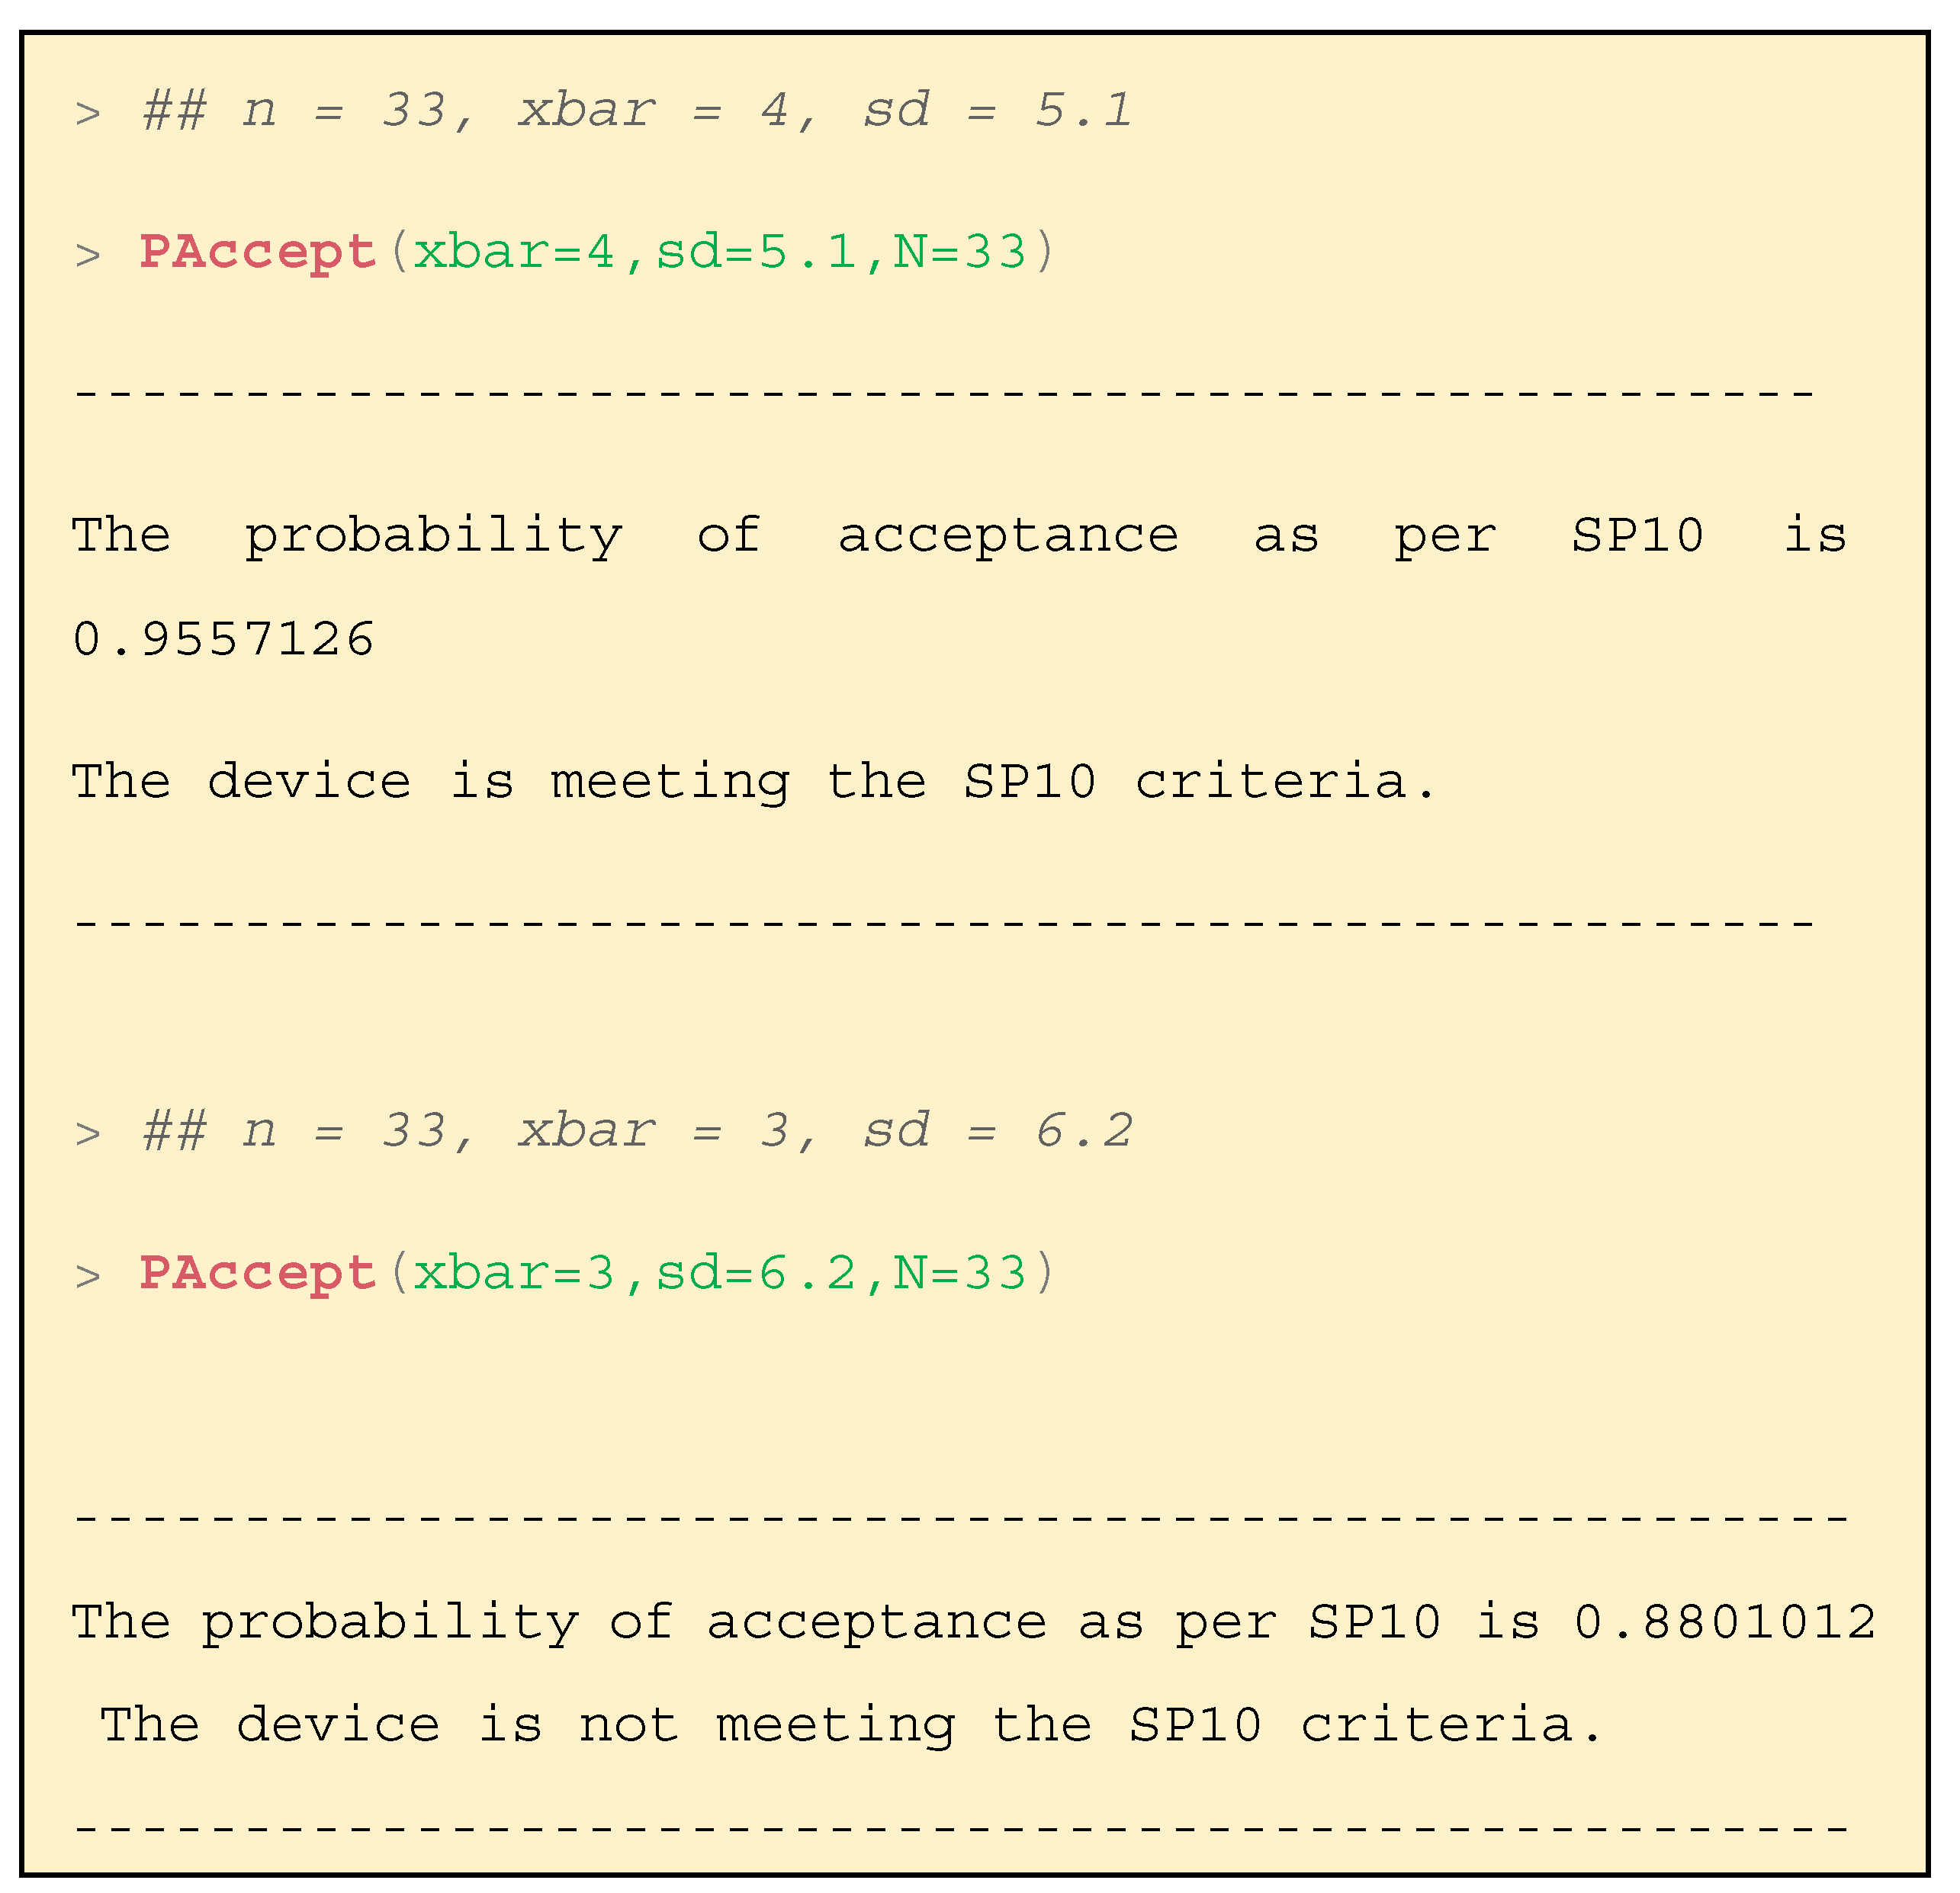
An important use case for this research is the ability to compare reported results, for example, when there are several technologies/methods/algorithms being used for estimating BP, and the individual reports utilize different sample sizes, as shown in Table 5. In each case, the reported device inaccuracy ( x ¯ and SD) appears to be within the SP10 criteria. However, the sample sizes are significantly smaller. Using the methods presented here, the calculation of the probability of acceptance, P A , allows a quantitative comparison of the existing literature and also to the SP10 criteria. For most of the presented studies, it is apparent that the reported results do not reach an equivalent level of confidence to SP10. P A allows direct comparison of results with different means and standard deviations, for example, a study with a high mean and low SD [15] and a study with a much lower mean and higher SD [26]. Many hypertension societies now offer clinicians a comprehensive list of blood pressure measurement devices, facilitating informed decision-making for clinical trials. Currently, the list can only assess whether the device is recommended or not based on its performance, utilizing the acceptance range specified in the standards [28]. With the introduction of the proposed method, clinicians can now more appropriately compare the reported inaccuracies across varying sample sizes. This functionality empowers clinicians when evaluating devices for their specific research needs.
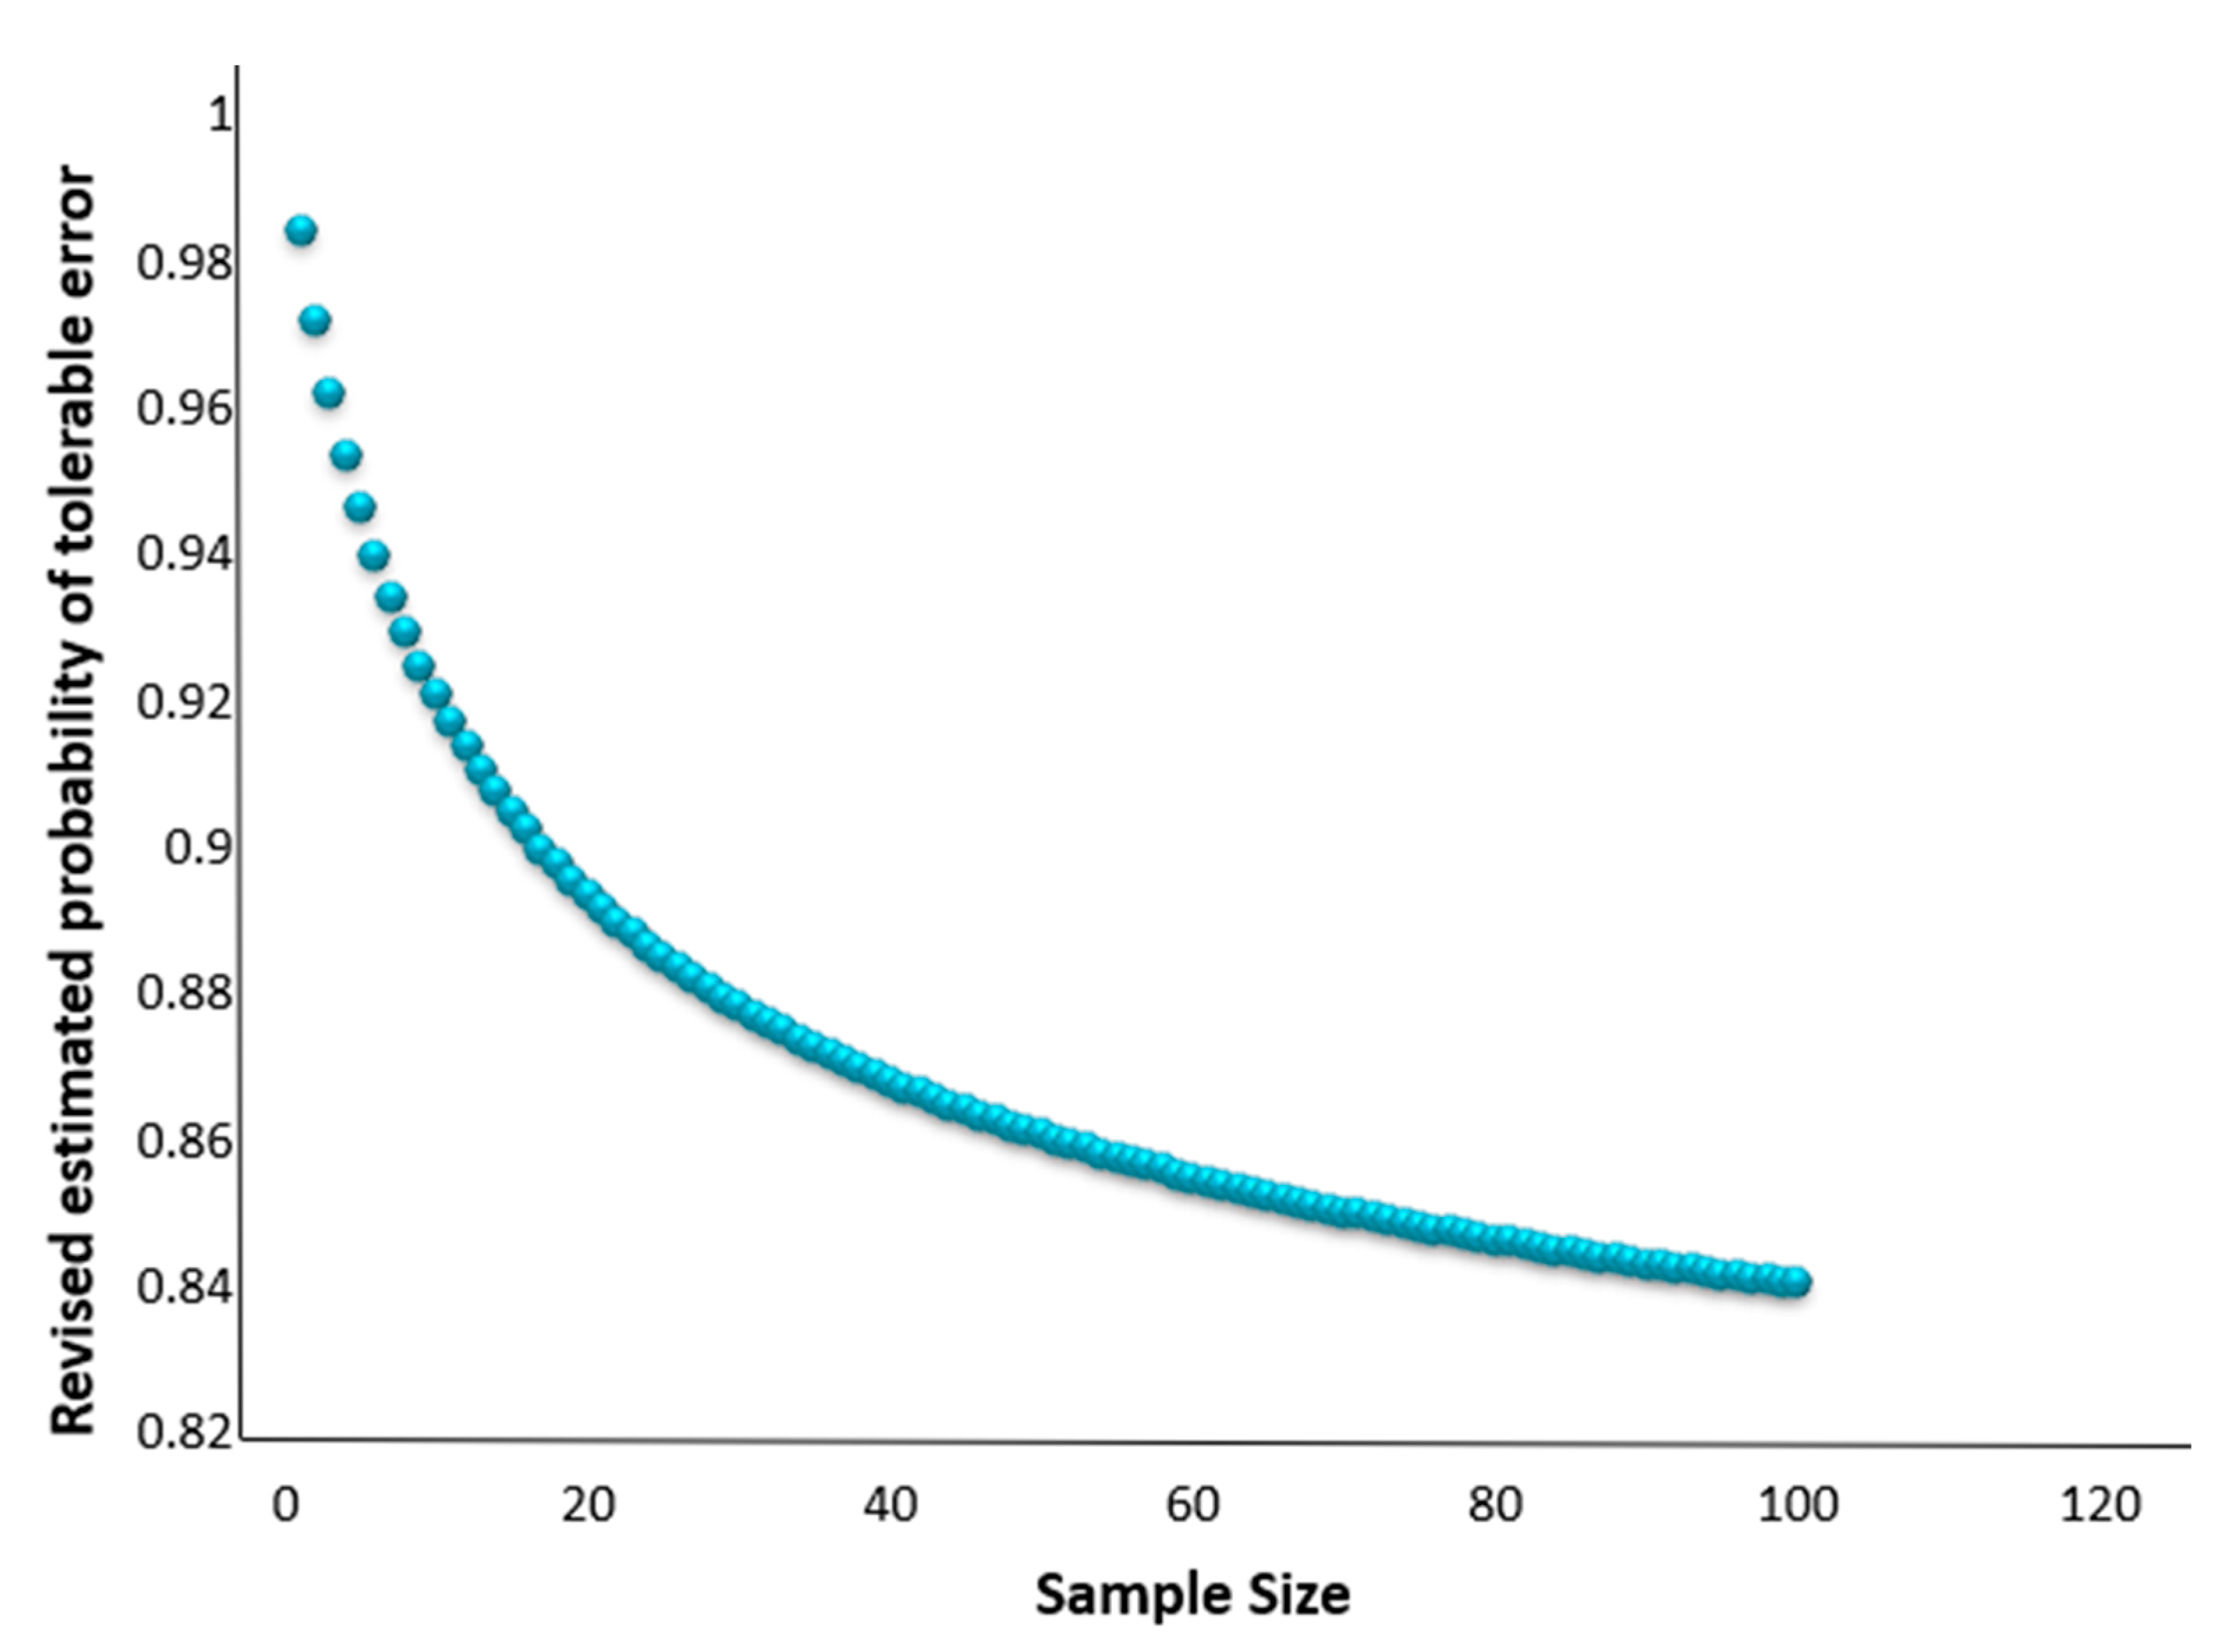
We demonstrate that no more than 70 samples are required to maintain the 85% estimated probability of tolerable error, as opposed to the N = 85 stated in the standards, as illustrated in Figure 4. There are cases where being able to correctly interpret the results of a study with a smaller sample would be beneficial, for example, with a population subset with only infants. Our framework still makes a statistical assumption of reasonably large sample sizes, ideally N ≥ 39. Although the proposed method is optimized for at least 39 samples, it is instructive to see how the framework performs for fewer samples. For this, we performed a simulation study in which we varied the mean and the standard deviation of the error distribution. We experimented with high variance but not exceeding the SP10 mandate for the standard deviation, that is, σ ≤ 6.9. The approximations with the proposed framework demonstrated closer results compared to the approximations with the existing framework. Table 2 presents one such result, while additional scenarios are elaborated in detail in Appendix D. The results become more distant for both frameworks as the sample size decreases. We witness this relation because with smaller sample sizes, the tendency of the sampling distribution to approximate normal distribution decreases. These results are further confirmation that caution should be applied when using smaller sample sizes, particularly when N < 39. To extend the proposed framework for less than 39 samples, further research is required.
This study presents a formal statistical evaluation of the device’s conformity with international standards, primarily through the evaluation of the probability of acceptance P A depending on the mean error, the standard deviation of the error, and the sample size. While evaluating a device’s inaccuracy, international standards also mandate that the device follows guidelines in regard to selecting the cuff size, providing the subject with a resting period prior to measurement, etc. Any deviation from these protocols has the potential to introduce bias, though the specific impact remains inconclusive as most studies do not explicitly state whether these protocols were adhered to. Additionally, to ensure enough samples in varied categories, including covering high and low blood pressure groups, ranges, and distributions of arm sizes, a minimum device sample size of N = 85 is necessary. In such cases, a smaller sample size will not be representative of the population.
With significant modifications for the standard SP10, we introduce a mathematical framework to accommodate different underlying definitions of acceptable error and confidence. This is of relevance to those developing new BP measurement technologies which are often tested initially in smaller samples, such as cuffless, wearable BP measurement devices that perform continuous readings to gather trends for a long period of time. These technologies help in assessing real-time fluctuations which might be useful for clinical trials that aim to gather longitudinal data on blood pressure trends and responses to interventions.
Finally, to assist in the calculations presented, this paper also introduces the companion R package “bpAcc”, an implementation of this methodology involving functions to directly compute the acceptance limit and P A without having to deal with the mathematical complexities. At present, our framework has the infrastructure to afford normally distributed errors, as stated by the argument “distribution” from “PAccept()” and “AcceptR()”. Future work includes upgrading both functions to handle errors other than normal. Initial steps have been taken in this direction with both functions being currently trained and tested using the one-parameter ( λ , or degrees of freedom) Student-t distribution. We are focused on selecting real-valued distributions with practical benefits for clinicians and manufacturers, rather than a theory-based selection of choices. Essentially, more data are useful, but experiments are often expensive. We aim to provide choices spanning various sample sizes by providing statistical infrastructure to maximize the user’s ability to identify faulty devices (e.g., Type I error) for BP measurement. Over time, both functions will be enhanced with further arguments to handle, e.g., criteria other than “SP10:2006”.

Author Contributions

Conceptualization, T.C. and V.M.; methodology, T.C. and V.M.; validation, V.M. and A.L.; formal analysis, T.C.; writing—original draft preparation, T.C.; writing—review and editing, A.L. and T.C.L.; visualization, V.M. and T.C.; supervision, V.M., A.L. and T.C.L.; funding acquisition, A.L. All authors have read and agreed to the published version of the manuscript.

Funding

This research was funded by NZ MBIE Endeavour Smart Ideas grant, grant number “AUTX1904”.

Institutional Review Board Statement

Not applicable.

Informed Consent Statement

Not applicable.

Data Availability Statement

No new data were created or analyzed in this study. Data sharing is not applicable to this article.

Conflicts of Interest

The authors declare no conflicts of interest.

Appendix A

Table A1. This is Table F.1 in [20]. It shows the upper limit on the sample standard deviation to yield at least 85% estimated probability of tolerable error.
Sample Mean ErrorStandard Deviation
06.95
±0.56.93
±1.06.87
±1.56.78
±26.65
±2.56.93
±3.06.87
±3.56.78
±46.65
±4.56.93
±5.06.87

Appendix B

This section contains Algorithm 1 that is useful to generate the probability values present in Table 2. The algorithm is used to evaluate the probability of acceptance using the simulation study.
Algorithm 1
  • function simulate (µ, σ, n)
  • δ := 10
  • Set  p ^ as the probability of tolerable error using (µ, σ, δ)
  • κ := 20000
  • Set Ρ, Γ, Υ to φ
  • ϵ := −10
  • Ε := 10
  • for i = 1 to κ do
  •   Set Θ as a randomly normalized array using (n, µ, σ)
  •   ϰ := 0
  •   for each θ in Θ do
  •    if θ > ϵ and θ < Ε then
  •     ϰ := ϰ + 1
  •    end if
  •   end for
  •   ϰ := ϰ / n
  •   Insert ϰ in Ρ
  •   Insert mean(Θ) in Γ
  •   Insert stddev(Θ) in Υ
  • end for
  • Ω := 0
  • for each ρ in Ρ do
  •   if ρ > 0.78 then
  •    Ω := Ω + 1
  •   end if
  • end for
  • Ω := Ω / κ
  • return Ω
  • end function

Appendix C

Table A2. List of parameters used in Section 3 with their description.
ParameterDescription
ϵ k j BP error for the jth participant, which is the difference between the test device measurement, δ k 2 j , and the reference device, δ k 1 j
δ j Average of the errors for three measurements for the jth participant
Δ Tolerable error, i.e., errors within −10 mmHg and 10 mmHg
p ^ Estimated probability of tolerable error
p True probability of tolerable error
γ p Maximum value of the probability of a tolerable error
θ Parameterized distribution for BP errors
μ p , σ p True mean and true standard deviation, respectively
σ M A X Maximum standard deviation for a certain value of mean and γ P
σ A A M I Maximum standard deviation for a certain value of mean as per SP10 where γ P = 0.85
x ¯ ι , s ι Sample mean and sample standard deviation of BP errors, respectively
Cumulative density function of the standard normal distribution

Appendix D

Table A3. Simulated P A and P A obtained from normal approximation using proposed method vs. the method currently in use in the SP10 standard, for small sample sizes, with μ P = 0 and σ P = 6.9.
N = 10N = 15N = 20N = 25
Simulated PA0.830.830.840.85
PA using proposed framework0.740.790.820.85
PA using SP10 method0.710.750.790.81
Table A4. Simulated P A and P A obtained from normal approximation using proposed method vs. the method currently in use in the SP10 standard, for small sample sizes, with μ P = 2.5 and σ P = 6.9.
N = 10N = 15N = 20N = 25
Simulated PA0.750.740.740.74
PA using proposed framework0.650.680.710.73
PA using SP10 method0.640.670.690.72
Table A5. Simulated P A and P A obtained from normal approximation using proposed method vs. the method currently in use in the SP10 standard, for small sample sizes, with μ P = 5 and σ P = 6.9.
N = 10N = 15N = 20N = 25
Simulated PA0.520.460.420.38
PA using proposed framework0.420.400.380.37
PA using SP10 method0.410.390.370.36

References

  1. Handler, J. The Importance of Accurate Blood Pressure Measurement. Perm. J. 2009, 13, 51–54. [Google Scholar] [CrossRef]
  2. Stergiou, G.S.; Alpert, B.S.; Mieke, S.; Wang, J.; O’Brien, E. Validation protocols for blood pressure measuring devices in the 21st century. J. Clin. Hypertens. 2018, 20, 1096–1099. [Google Scholar] [CrossRef]
  3. Scheer, B.V.; Perel, A.; Pfeiffer, U.J. Clinical review: Complications and risk factors of peripheral arterial catheters used for haemodynamic monitoring in anaesthesia and intensive care medicine. Crit. Care 2002, 6, 198–204. [Google Scholar] [CrossRef]
  4. Meidert, A.S.; Saugel, B. Techniques for non-invasive monitoring of arterial blood pressure. Front. Med. 2017, 4, 231. [Google Scholar] [CrossRef] [PubMed]
  5. Jones, D.W.; Appel, L.J.; Sheps, S.G.; Roccella, E.J.; Lenfant, C. Measuring Blood Pressure Accurately New and Persistent Challenges. JAMA 2003, 289, 1027–1030. [Google Scholar] [CrossRef] [PubMed]
  6. Wang, Q.; Zhao, H.; Chen, W.; Li, N.; Wan, Y. Validation of the iHealth BP7 wrist blood pressure monitor, for self-measurement, according to the European Society of Hypertension International Protocol revision 2010. Blood Press. Monit. 2014, 19, 54–57. [Google Scholar] [CrossRef] [PubMed]
  7. Ding, X.; Yan, B.P.; Zhang, Y.T.; Liu, J.; Zhao, N.; Tsang, H.K. Pulse Transit Time Based Continuous Cuffless Blood Pressure Estimation: A New Extension and A Comprehensive Evaluation. Sci. Rep. 2017, 7, 1–11. [Google Scholar] [CrossRef] [PubMed]
  8. Imai, Y.; Sasaki, S.; Minami, N.; Munakata, M.; Hashimoto, J.; Sakuma, H.; Sakuma, M.; Watanabe, N.; Imai, K.; Sekino, H.; et al. The accuracy and the performance of the A&D TM 2421, a new ambulatory blood pressure monitoring device based on the cuff-oscillometric method and the Korotkoff sound technique. Am. J. Hypertens. 1992, 5, 719–726. [Google Scholar]
  9. ISO. Non-Invasive Sphygmomanometers—Part 2: Clinical Investigation of Intermittent; ISO: Geneva, Switzerland, 2018. [Google Scholar]
  10. EN 1060-4:2004; Non-Invasive sphygmomanometers—Part 4: Test Procedures to Determine the Overall System Accuracy of Automated non-invasive Sphygmomanometers. European Committee for Standardization; BSI: London, UK, 2004.
  11. O’Brien, N.A.E.; Petrie, J.; Littler, W.; de Swiet, M.; Padfield, P.L.; O’Malley, K.; Jamieson, M.; Altman, D.; Bland, M. The British Hypertension Society protocol for the evaluation of automated and semi-automated blood pressure measuring devices with special reference to ambulatory systems. J. Hypertens. 1990, 8, 607–619. [Google Scholar] [CrossRef] [PubMed]
  12. Oʼbrien, E.; Pickering, T.; Asmar, R.; Myers, M.; Parati, G.; Staessen, J.; Mengden, T.; Imai, Y.; Waeber, B.; Palatini, P.; et al. Working Group on Blood Pressure Monitoring of the European Society of Hypertension International Protocol for validation of blood pressure measuring devices in adults. Blood Press. Monit. 2002, 7, 3–17. [Google Scholar] [CrossRef] [PubMed]
  13. Stergiou, G.S.; Alpert, B.; Mieke, S.; Asmar, R.; Atkins, N.; Eckert, S.; Frick, G.; Friedman, B.; Graßl, T.; Ichikawa, T.; et al. A universal standard for the validation of blood pressure measuring devices: Association for the Advancement of Medical Instrumentation/European Society of Hypertension/International Organization for Standardization (AAMI/ESH/ISO) Collaboration Statement. Hypertension 2018, 71, 368–374. [Google Scholar] [CrossRef]
  14. Alpert, B.; Friedman, B.; Osborn, D. AAMI blood pressure device standard targets home use issues. Biomed. Instrum. Technol.Assoc. Adv. Med. Instrum. 2010, 69–72. [Google Scholar]
  15. Jung, Y.K.; Baek, H.C.; Soo, M.I.; Myoung, J.J.; In, Y.K.; Sun, I.K. Comparative study on artificial neural network with multiple regressions for continuous estimation of blood pressure. In Proceedings of the Annual International Conference of the IEEE Engineering in Medicine and Biology—Proceedings, Shanghai, China, 17–18 January 2005; Volume 7, pp. 6942–6945. [Google Scholar] [CrossRef]
  16. Esmaili, A.; Kachuee, M.; Shabany, M. Nonlinear Cuffless Blood Pressure Estimation of Healthy Subjects Using Pulse Transit Time and Arrival Time. IEEE Trans. Instrum. Meas. 2017, 66, 3299–3308. [Google Scholar] [CrossRef]
  17. Dong, Y.; Kang, J.; Yu, Y.; Zhang, K.; Li, Z.; Zhai, Y. A Novel Model for Continuous Cuff-less Blood Pressure Estimation. In Proceedings of the 2018 11th International Symposium on Communication Systems, Networks & Digital Signal Processing (CSNDSP), Budapest, Hungary, 18–20 July 2018. [Google Scholar]
  18. Kallioinen, N.; Hill, A.; Horswill, M.S.; Ward, H.E.; Watson, M.O. Sources of inaccuracy in the measurement of adult patients’ resting blood pressure in clinical settings: A systematic review. J. Hypertens. 2017, 35, 421–441. [Google Scholar] [CrossRef]
  19. Bonnafoux, P. Auscultatory and oscillometric methods of ambulatory blood pressure monitoring, advantages and limits: A technical point of view. Blood Press. Monit. 1996, 1, 181–185. [Google Scholar]
  20. ANSI/AAMI SP10:2002/(R)2008; American National Standard for Manual, Electronic, or Automated Sphygmomanometers. American National Standards Institute: New York, NY, USA, 2008.
  21. Lui, H.-W.; Chow, K.-L. A Novel Calibration Procedure of Pulse Transit Time based Blood Pressure measurement with Heart Rate and Respiratory Rate. In Proceedings of the Annual International Conference of the IEEE Engineering in Medicine and Biology Society, EMBS, Honolulu, HI, USA, 18–21 July 2018; Volume 2018, pp. 4318–4322. [Google Scholar] [CrossRef]
  22. Victor, M.; Tanvi, C.; Andrew, L.; Tet, L.C. _bpAcc: Blood Pressure Device Accuracy Evaluation: Statistical Considerations.; R package Version 0.0-2; CRAN: Auckland, New Zealand, 2024. [Google Scholar]
  23. Pandian, P.; Mohanavelu, K.; Safeer, K.; Kotresh, T.; Shakunthala, D.; Gopal, P.; Padaki, V. Smart Vest: Wearable multi-parameter remote physiological monitoring system. Med. Eng. Phys. 2008, 30, 466–477. [Google Scholar] [CrossRef]
  24. Wibmer, T.; Doering, K.; Kropf-Sanchen, C.; Rüdiger, S.; Blanta, I.; Stoiber, K.M.; Rottbauer, W.; Schumann, C. Pulse Transit Time and Blood Pressure During Cardiopulmonary Exercise Tests. Physiol. Res. 2014, 63, 287–296. [Google Scholar] [CrossRef] [PubMed]
  25. Huynh, T.H.; Jafari, R.; Chung, W.Y. Noninvasive cuffless blood pressure estimation using pulse transit time and impedance plethysmography. IEEE Trans. Biomed. Eng. 2019, 66, 967–976. [Google Scholar] [CrossRef] [PubMed]
  26. Masè, M.; Mattei, W.; Cucino, R.; Faes, L.; Nollo, G. Feasibility of cuff-free measurement of systolic and diastolic arterial blood pressure. J. Electrocardiol. 2011, 44, 201–207. [Google Scholar] [CrossRef] [PubMed]
  27. Huynh, T.H.; Jafari, R.; Chung, W.Y. A robust bioimpedance structure for smartwatch-based blood pressure monitoring. Sensors 2018, 18, 2095. [Google Scholar] [CrossRef]
  28. Padwal, R.; Berg, A.; Gelfer, M.; Tran, K.; Ringrose, J.; Ruzicka, M.; Hiremath, S.; Accuracy in Measurement of Blood Pressure (AIM-BP) Collaborative. The Hypertension Canada blood pressure device recommendation listing: Empowering use of clinically validated devices in Canada. J. Clin. Hypertens. 2020, 22, 933–936. [Google Scholar] [CrossRef] [PubMed]
Figure 1. Acceptance curves obtained from Equation (5) for γ p ∈ {0.75, 0.80, 0.85, 0.90, 0.95}; μ p in (–10, 10).
Technologies 12 00044 g001
Figure 2. Sample output from AcceptR() for sample size N = 33.
Technologies 12 00044 g002
Figure 3. Sample output from PAccept() for two different cases with different device inaccuracies.
Technologies 12 00044 g003
Figure 4. Relationship between the revised estimated probability of tolerable error for different sample sizes (N).
Technologies 12 00044 g004
Figure 5. Changes in the acceptance region (upper limit of SD for a given sample mean, x ¯ ) as per SP10 for different sample sizes.
Technologies 12 00044 g005
Table 1. The upper limit of SD for selected values of x ¯ ι .
x ¯ ι 0 ± 1 ± 1.5 ± 2.87 ± 3.96 ± 5.12
σ 0.85 A A M I 6.9476.8746.7826.3115.6644.696
x ¯ ι ± 5.93 ± 6.67 ± 7.15 ± 7.88 ± 8.9 ± 9.99
σ 0.85 A A M I 3.9273.2132.752.0451.0610.01
Table 2. Simulated P A and P A obtained from normal approximation using proposed method vs. the method currently in use in the SP10 standard, for small sample sizes, with μ P = 2 and σ P = 5.5.
N = 10N = 15N = 20N = 25
Simulated PA0.950.9640.9740.982
PA using proposed framework0.9310.9650.9820.99
PA using SP10 method0.840.8930.9260.948
Table 3. Arguments for AcceptR() from the R package bpAcc.
ArgumentComments
N—sample size.
distributionDistribution the errors are pulled from. Default is “normal”, i.e., normally distributed δ ι k errors.
criteriaThe underlying standard criteria for testing and data analysis. The default is “SP10:2006”.
Table 4. Arguments for PAccept() from the R package bpAcc.
ArgumentComments
N—sample size.
Xbar, sd Sample mean and sample standard deviation of δ ι k -error distribution.
distributionDistribution the errors are pulled from. Default is “normal”, i.e., normally distributed δ ι k errors.
criteriaThe underlying standard criteria for testing and data analysis. The default is “SP10:2006”.
Table 5. Comparison statistics of the previous clinical studies that have reported device inaccuracy based on SBP values.
Study Method/TechniquesSample SizeDevice Inaccuracy ( x ¯ ± SD)Probability, P A
( p 0.78 )
[6]Oscillometry33−0.7 ± 6.9 0.873
[21]PTT101.04 ± 6.88 0.730
[7]PTT-PPG331.17 ± 5.72 0.997
[23]Standing25−0.462 ± 8 0.539
[16]PAT320.12 ± 6.15 0.984
[26]PTT33−0.06 ± 6.63 0.934
[24]PTT-linear200 ± 6.73 0.859
PTT-nonlinear0 ± 5.56 0.995
[15]ML454.53 ± 2.68 0.999
Table 6. Comparison statistics of the previous clinical studies that have reported device inaccuracy based on DBP values.
Study Method/TechniquesSample SizeDevice Inaccuracy ( x ¯ ± SD)Probability, P A
( p 0.78 )
[21]PTT10−2.16 ± 6.60 0.732
[7]PTT-PPG330.40 ± 7.11 0.825
[25]PTT-IPG15−0.5 ± 5.07 0.999
[27]PWV-15−0.06 ± 5.46 0.991
[6]Oscillometry33−1.0 ± 5.1 0.999
[16]PAT321.31 ± 5.36 0.999
[26]PTT33−0.25 ± 5.63 0.999
Disclaimer/Publisher’s Note: The statements, opinions and data contained in all publications are solely those of the individual author(s) and contributor(s) and not of MDPI and/or the editor(s). MDPI and/or the editor(s) disclaim responsibility for any injury to people or property resulting from any ideas, methods, instructions or products referred to in the content.

