Article

Monitoring Critical Health Conditions in the Elderly: A Deep Learning-Based Abnormal Vital Sign Detection Model

by
Murad A. Rassam
* and
Amal A. Al-Shargabi
Department of Information Technology, College of Computer, Qassim University, Buraydah 51452, Qassim, Saudi Arabia
*
Author to whom correspondence should be addressed.
Technologies 2024, 12(12), 258; https://doi.org/10.3390/technologies12120258
Submission received: 28 October 2024 / Revised: 5 December 2024 / Accepted: 11 December 2024 / Published: 13 December 2024
(This article belongs to the Section Information and Communication Technologies)

Abstract

:
Global population aging creates distinct healthcare needs, particularly for older adults and those with serious illnesses. There are several gaps in current models for monitoring elderly individuals. These include the limited application of advanced deep learning techniques in elderly health monitoring, the lack of real-time anomaly detection for vital signs, the absence of robust evaluations using real-world data, and the failure to tailor monitoring systems specifically for the unique needs of elderly individuals. This study addresses these gaps by proposing a Hierarchical Attention-based Temporal Convolutional Network (HATCN) model, which enhances anomaly detection accuracy and validates effectiveness using real-world datasets. While the HATCN approach has been used in other fields, it has not yet been applied to elderly healthcare monitoring, making this contribution novel. Specifically, this study introduces a Hierarchical Attention-based Temporal Convolutional Network with Anomaly Detection (HATCN-AD) model, based on the real-world MIMIC-II dataset. The model was validated using two subjects from the MIMIC-II dataset: Subject 330 (Dataset 1) and Subject 441 (Dataset 2). For Dataset 1 (Subject 330), the model achieved an accuracy of 99.15% and precision of 99.47%, with stable recall (99.45%) and F1-score (99.46%). Similarly, for Dataset 2 (Subject 441), the model achieved 99.11% accuracy, 99.35% precision, and an F1-score of 99.44% at 100 epochs. The results show that the HATCN-AD model outperformed similar models, achieving high recall and precision with low false positives and negatives. This ensures accurate anomaly detection for real-time healthcare monitoring. By combining Temporal Convolutional Networks and attention mechanisms, the HATCN-AD model effectively monitors elderly patients’ vital signs.

1. Introduction

According to the United Nations, anyone older than 60 is considered older. However, families and communities frequently define age in terms of other socio-cultural referents, such as physical attributes, age-related health issues, or family status (grandparents). According to the World Health Organization (WHO), by 2024, the number of people over 65 will be predicted to surpass that of people under 15 in the WHO European Region. In this context, it is practically impossible for older people to escape becoming chronic disease statistics due to factors such as gender, age, and family genetics. Moreover, 94.9% of senior individuals 60 and older have at least one condition, and 78.7% have two or more, some of which are critical and life-threatening, according to the National Council on Aging (NCOA) study [1]. Nevertheless, stakeholders in the healthcare sector, including patients, physicians, clinicians, caregivers, and equipment, frequently require support and continuous monitoring of this important population segment.
The aging global population sparked an urgent demand for efficient healthcare solutions to safeguard the well-being of elderly individuals, particularly those with critical health conditions, while enabling them to maintain their independence and live comfortably in their homes. Remote home monitoring systems emerged as a promising avenue to address this need. The recent evolving concepts such as the Internet of Things (IoT), cloud computing (CC), ubiquitous computing, and data analytics have enabled the release of smart healthcare knowledge-based systems, which play an essential role in facilitating the process of the remote monitoring of elderly individuals. Using remote sensors to measure vital signs and cloud services to deliver continuous, real-time data to a reputable professional are typical examples of IoT applications in the healthcare industry. IoT has eliminated the need for nurses and physicians to monitor patients’ physical conditions. Instead, data and any unusual indication found in the patients can be observed directly. Figure 1 shows the architecture of the Internet of Medical Things (IoMT) that constitutes the base for remote healthcare monitoring systems.
The first layer, the perception layer, primarily aims to communicate with higher levels and gather necessary data from individuals. The Body Area Network (BANs) is the main element of this layer, whereby a network of vital signs accessories, such as chest straps, pulse oximeters, and blood pressure monitors, or smart wearables, such as smartwatches, fitness trackers, and smart hats, are responsible for gathering individual health status. The second layer is the gateway layer. Through wired or wireless communication protocols (such as Bluetooth, 6LoWPAN, and Zigbee), sensory input from the perception layer is obtained and sent to the cloud layer for necessary processing. The third layer is the cloud, the remote data center. This layer stores the entire history and gathers information about the individuals and environments under observation, including data from multiple data centers. It also handles data analysis, which includes reasoning, machine learning algorithms, and pattern recognition techniques. Based on the results obtained, decisions and actions are taken to respond to the needs of older adults effectively.
A survey on remote health monitoring systems was introduced in [1], providing a comprehensive review of existing remote health monitoring applications for older adults. Furthermore, it outlines the typical structure of such systems and highlights their essential functions and the standards used for building such systems. Some gaps identified by this study include issues of technology acceptance by elderly individuals, privacy concerns, and integration challenges. Another helpful survey on the design of smart and ubiquitous healthcare monitoring frameworks based on machine learning was introduced in [2], which thoroughly examines the state-of-the-art machine learning (ML)-based healthcare monitoring systems, particularly emphasizing ubiquitous and innovative health frameworks.
Several models and systems exist for local or remote monitoring of vital signs in hospitals or intensive care units (ICUs), including the studies of [3,4,5,6]. In the context of older adults, some literature focuses on activity recognition rather than vital signs monitoring, such as [3]. The Internet of Medical Things (IoMT) is a novel concept that integrates computer networks, medical equipment, and healthcare applications. Any Smart Healthcare Monitoring (SHM) system benefits from the IoMT concept as a tool for monitoring patients’ vital signs. Remote vital sign monitoring tracks people’s vital signs (heart rate, blood pressure, respiration rate, oxygen saturation, and body temperature) in non-clinical settings on a continuous and non-invasive basis. This is frequently accomplished by transmitting real-time data to monitoring systems or healthcare practitioners via wearable sensors, mobile devices, or IoMT technologies [4].
To identify abnormal observations that emerge for various reasons, IoMT systems and the anomaly detection concept are widely used to ensure the quality of data collected in WBANs for healthcare monitoring applications. Several anomaly detection models have been proposed for IoMT systems [5,6,7,8] that realize the use of Wireless Body Area Networks (WBANs) to detect abnormal vital signs readings. However, most existing works are not tailored for older adults. Moreover, most of the proposals for those elderly groups focused on activity recognition rather than detecting the critical vital readings that may indicate critical health situations that healthcare professionals should treat early. The main contributions of this paper are summarized as follows:
  • Novel deep learning model for detecting abnormal vital sign readings in elderly individuals. This paper presents a novel deep learning model, the Hierarchical Attention-based Temporal Convolutional Network anomaly detection (HATCN-AD), for detecting abnormal vital signs in elderly individuals. While the combination of Temporal Convolutional Networks (TCNs) and hierarchical attention mechanisms has been used for anomaly detection in other domains [9,10,11], it has not been applied to elderly vital sign monitoring, which is the focus of this study.
  • Evaluation of the proposed model using real-world data. The proposed model is evaluated using real-world data, demonstrating its effectiveness in detecting abnormal vital signs and providing a practical solution for real-time elderly health monitoring. Unlike existing systems that focus on general health assessments or rely on basic anomaly detection [12,13,14], our model offers critical real-time detection, addressing the dynamic health conditions of elderly individuals.
The rest of this paper is organized as follows: Section 2 reviews the literature on detecting abnormal vital signs in elderly individuals. Section 3 outlines our observations on previous studies and how this study is different. The structure of the proposed deep learning model is introduced in Section 4. Section 5 reports the experimental results using different settings on a real-world dataset. Section 6 discusses the results and evaluates the proposed model in the context of the findings compared to some existing baseline machine learning and deep learning models. Section 7 concludes the paper.

2. Related Works

2.1. General Healthcare Monitoring Systems and Models

Wearable technology and data analysis enable remote health monitoring of individuals. This is made possible by improvements in wireless communications, medical sensor technology, and data collection techniques. These sensors and wearable electronics can be incorporated into diverse items like apparel, wristbands, eyewear, socks, headwear, shoes, and other devices such as cellphones, headphones, and wristwatches [10]. Several solutions have been developed to monitor patients at hospitals or remote locations such as houses or nursing facilities. Many real-world application systems, such as CodeBlue [11], MEDISN [15], Vital Jacket [16], and Medical MoteCare [17], are available for remote patient monitoring. These systems are built on WBAN technology and are intended to collect and transmit patients’ vital signs while they are at home or in the great outdoors. The work in [18,19] provides a thorough survey evaluation of sensor-based medical applications.
Regarding research contributions, several anomaly detection algorithms for wireless sensor networks (WSNs), including those in [5,20,21,22], can be applied to WBAN by treating WBAN as a form of WSN. However, because vital sign readings are dynamic, most of the suggested WSN models must be adapted to suit applications of monitoring healthcare conditions. The authors presented a Kalman filter-based framework for event detection on data from biomedical sensors [23]. Predicting the current observation and then determining the time series baseline of the gathered data form the basis of the suggested process. This method measures the difference between the predicted and actual values by looking at the power divergence of the Kalman filter, which changes dramatically from its previous values. Additionally, this method distinguished between false readings and emergencies by using the geographical correlation between the observed observations that were being tracked. In addition to the authors’ claimed high detection accuracy, the suggested framework works well in practical applications. However, the Kalman filter relies on a sliding window and numerous parameters that must be adjusted for every scenario.
In [24], a two-level anomaly detection method was presented based on the Mahalanobis distance measure and game theory. It was stated that the suggested model is adaptive and lightweight, raising alarms only when the patient enters an emergency scenario and dismissing false alarms caused by inaccurate observations. Using the spatiotemporal correlation of body sensor node readings, the initial level of the game-theoretic technique identifies local anomalous events based on the WBAN context. In the local processing unit attached to the body, the Mahalanobis distance measure is utilized at the second level for global multivariate analysis. To assess the effectiveness of the suggested method, several numerical simulations using a real-world physiological dataset were carried out.
The study in [25] contributed a model that can identify many anomalous observations in WBAN, including simple, point, and contextual anomalies. Based on hybrid Convolutional Long Short-Term Memory (ConvLSTM) approaches, the suggested model was created to identify correlations between WBAN sensor values. The authors state that experimental assessments demonstrated a high detection rate and a lower loss rate on several data subjects of a physiological dataset taken from real-world scenarios. Autoencoder neural networks have been utilized for the first time in [26] for anomaly detection in WSNs for IoT applications. A two-tier method was presented, with the sensor nodes housing the first-level algorithm and the cloud housing the second level. Each node can identify abnormalities locally thanks to the fully dispersed detection system, eliminating the need for collaboration or contact with other nodes or the cloud.

2.2. Vital Signs Monitoring Systems and Models for Elderly Individuals

It has been demonstrated that the Internet of Medical Things, combined with smart technologies, offers many upgraded and better services. Researchers have created various emergency systems with sensors and technologies allowing intelligent, distant wireless communication. Many medical applications have utilized this technology, most notably in monitoring the health of senior citizens. This way, vital signs can be taken to obtain data on risky circumstances and general health [27].
The authors in [12] investigate improving nursing care for elderly patients and stroke prevention using the Medical Internet of Things (IoMT). One of its main achievements is proposing an IoMT-based architecture combining wearable sensors and remote monitoring systems to continuously follow vital signs and identify early stroke risk indicators. The paper emphasizes the significance of real-time data analysis in improving patient outcomes, lessening the strain on healthcare personnel, and enabling early intervention. It also discusses how IoMT allows remote monitoring and individualized nursing care, enabling ongoing health management and prompt medical intervention. Researchers in [13] provide a framework based on the Internet of Things intended to remotely monitor patients’ health, especially that of older adults. The main contribution is creating a system that tracks vital signs, including blood pressure, temperature, and heart rate, using wearable sensors and sending real-time data to healthcare professionals. The approach facilitates prompt medical actions and early identification of aberrant health problems. Furthermore, it improves patient autonomy by decreasing the frequency of hospital stays and increasing the effectiveness of medical services. The report highlights the system’s scalability, which can be tailored to various healthcare settings and patient needs.
Recent research in [14] contributes by putting out a framework based on the Internet of Medical Things (IoMT) for tracking vital signs in nursing homes and educational institutions. It encompasses wearable sensors to continuously monitor essential health indicators, including heart rate, temperature, and oxygen levels. The system uses machine learning techniques to analyze the data, find anomalies, and issue early alerts regarding possible health dangers. This strategy improves health management by facilitating early diagnosis, individualized care, and real-time monitoring for seniors and kids. Additionally, the paper emphasizes how IoMT and machine learning can lower healthcare costs, enhance preventive care in non-clinical settings like senior homes and schools, and enhance general well-being. Another interesting study in [28] focuses on creating an Internet of Medical Things (IoMT) system for monitoring older adults that considers their needs and user experience. Its primary contribution is based on the use of a user-centered design methodology, which guarantees that IoT devices and technologies are accessible, user-friendly, and customized to meet the unique requirements of senior citizens. The report also emphasizes the importance of trust, privacy, and usability when implementing IoT solutions in senior care. This study ensures that the system provides efficient health monitoring while honoring user preferences and restrictions by obtaining input from older adults and caregivers. The effort advances remote elder care through increased practicality, ease of use, and an emphasis on improving overall quality.
A study in [24] proposes a new healthcare system meant to provide emergency aid to older folks in outside locations. The system uses wearables and Internet of Things (IoT) technology to track vital signs like blood pressure and heart rate and identify emergencies like falls or abrupt health decline. The technology automatically notifies emergency services or caretakers in real time when an unexpected occurrence is detected, along with the person’s location. This study emphasizes the system’s emphasis on older adults’ mobility and safety—ensuring prompt medical attention even outside their homes. It also helps by lowering healthcare response times in outdoor environments, increasing elderly autonomy, and strengthening emergency response capabilities.

Machine and Deep Learning Models for Elderly Individuals

Research conducted in [29] introduced a system of an electronic, wearable wellness tracker and an all-in-one, station-based health monitoring equipment that, in turn, gathers daily vital signs from older adults and continuously monitors their overall activity. The proposed work created a data-preparation plan to collect information from various monitoring equipment. Then, this study suggested combining discrete physiological and continuous activity data for further data modeling and analysis. By choosing the most appropriate data mining models for identifying older adults who are in danger through daily monitoring, a tailored health monitoring system was created to predict the well-being of the elderly one day ahead of time. The outcome of this work was a quantitative comparison of various data mining and machine learning methods, and it found that the best performance was achieved by the decision tree method.
In [30], another research study contributes by creating a prediction model that forecasts and evaluates frailty in older people using multidimensional sociological data. The model offers a thorough method of frailty prediction by integrating a variety of variables, such as lifestyle choices, social determinants, clinical health data, and psychological well-being. By applying machine learning approaches to these heterogeneous datasets, the model enhances the predictive accuracy of frailty, facilitating early intervention and customized care. Compared to conventional clinical assessments, the model’s quantitative prediction accuracy showed a considerable improvement, providing healthcare providers with more effective tools to detect elderly patients who are at risk and treat frailty before it becomes worse. It is reported that the random forest method achieved the best results, achieving a weighted average recall of 91%.
In [31], a study suggests a deep learning-powered ambient assisted living system that uses the Internet of Medical Things to monitor and assess senior citizens’ vital signs and activities for clinical decision support. The unique aspect of the suggested method was the application of mutual information-based feature selection techniques in conjunction with bidirectional Gated Recurrent Unit deep learning techniques to choose robust features to identify abnormalities and target actions. Bidirectional Gated Recurrent Unit and Gated Recurrent Unit deep learning approaches were used in experiments on two datasets (the recorded Ambient Assisted Living data and the MHealth benchmark data), and the results were compared with other cutting-edge methods. Various evaluation metrics were employed to evaluate performance. The results show that the proposed bidirectional gated recurrent unit (GRU) deep learning techniques outperform other state-of-the-art approaches with an accuracy of 99.26% for MHealth data and 98.14% for ambient assisted living data.
Various drawbacks are associated with the existing anomaly detection models that use deep learning (DL) and machine learning (ML) techniques to monitor senior adults. One of these drawbacks is that most proposed models focused on activity monitoring rather than vital signs monitoring. Furthermore, the proposed models in the literature, which focus on vital signs monitoring, suffer from the high computational cost that hinders such models from being practically applicable. Furthermore, most of these models have not achieved accurate results that make them suitable for critical monitoring and decision-making for further intervention by healthcare professionals.

3. Key Observations from Related Research

Based on the studies mentioned above, the following observations can be made:
  • Many previous studies focus on anomaly detection in general wireless sensor networks (WSNs) or wearable sensor networks (WBANs) for various purposes, such as detecting anomalies in multivariate sensor data, including Kalman filters [20], Mahalanobis distance [24], and ConvLSTM [25]. However, none of these studies have specifically applied these methods to the detection of abnormal vital signs in elderly individuals.
  • While some studies, like [31], use deep learning methods such as bidirectional Gated Recurrent Units (GRUs) for monitoring elderly health, these models do not specifically address anomaly detection in vital signs. The primary focus has been on activity recognition rather than real-time, critical anomaly detection for vital signs, such as heart rate, blood pressure, or oxygen saturation, essential in preventing serious health crises among elderly patients.
  • Existing systems, such as IoMT-based platforms, provide remote monitoring but often lack real-time intervention capabilities. While Refs. [12,13,14] emphasize the importance of continuous health monitoring using wearable technologies, these systems either focus on general health assessments or rely on basic anomaly detection methods, which may miss crucial, sudden health events in elderly patients due to their dynamic and complex health conditions.
  • Although there is a growing emphasis on using the Internet of Medical Things (IoMT) for elderly health monitoring, many existing systems are not specifically designed to address the unique needs of older adults—such as real-time anomaly detection for vital signs. Some systems, like those mentioned in [27,28], focus more on enhancing user experience, but they fail to consider advanced methods for detecting critical anomalies in vital sign data.
  • Although several studies present models for elderly health monitoring, few have evaluated these systems using real-world data to validate their effectiveness. This limits the applicability of these models in practical, everyday healthcare settings where variations in elderly health data can be complex and unpredictable.
  • The combination of the Temporal Convolutional Network (TCN) and hierarchical attention mechanism, which together form the HATCN model, has been recently explored for anomaly detection in multivariate time-series data [9] and spacecraft anomaly detection [10]. A similar approach was used for EEG-based emotion recognition [11]. However, to our knowledge, such a combination has not been previously applied to detecting anomalous data in vital signs monitoring systems for elderly individuals. This gap motivates the exploration of this approach in our study.

4. Proposed Model

Figure 2 presents the architecture of the proposed model in this paper. Although this architecture is a generally valid framework for building and optimizing machine learning models—and could be adapted for other models—the uniqueness of the proposed approach lies in the hybrid architecture itself, as detailed in Section 4.3. This section outlines the specific integration of Temporal Convolutional Networks (TCNs) and HATCN mechanisms, designed to address the unique characteristics of time-series data from elderly patients. The model is tailored to monitor vital signs—such as heart rate, blood pressure, oxygen saturation, and respiratory rate—particularly critical in the elderly population due to their susceptibility to various health conditions.
The subsequent subsections outline the details of the architectural design.

4.1. Input Data Representation

Continuous time-series vital sign readings, such as heart rate, blood pressure, oxygen saturation, and respiratory rate, comprise the input data. Each patient would have multiple channels representing various physiological data types.
Let X   R T × C be the input time-series readings, where t is the number of time steps in the sequence, and C is the number of features (also called channels) corresponding to the various vital signals such as heart rate, blood pressure, etc. Every input sample is represented as X = [x1, x2, …, xT], where xt is a vector of vital sign readings at time step t.
The dataset used in this study, the MIMIC II dataset, is a widely recognized resource containing time-series physiological data from over 90 ICU patients, including subjects with diverse medical conditions. For this study, two subjects, Subject 330 and Subject 441, were selected to validate the proposed HATCN-AD model. The dataset includes critical vital sign data such as heart rate, blood pressure (both systolic and diastolic), oxygen saturation, temperature, and respiration rate, which are essential for monitoring the health of elderly individuals. However, there are several considerations regarding the alignment of the dataset with the intended target population—elderly people. The MIMIC II dataset primarily contains data from ICU patients, who may not represent the general elderly population who are not hospitalized. Elderly individuals in non-acute settings might have different physiological patterns than those in intensive care, where the conditions are more severe and the medical interventions are more frequent. Consequently, while the dataset is valuable for developing and testing the model, the model’s generalizability to the broader elderly population, especially in non-ICU settings, may be limited.

4.2. Data Preprocessing

Preprocessing processes are carried out before feeding the data into the model, which consists of the following:
Normalization/Scaling: Time series data are often normalized to ensure uniformity across vital readings. By doing this, the model can prevent bias toward a single feature that may have a larger numerical range.
Missing Data Handling: In rare cases, malfunctioning sensors or pauses in data gathering may result in missing vital sign values. This can be handled using various strategies, such as interpolation or forward filling.

4.3. Hybrid Attention-Based Temporal Convolutional Network Architecture

The proposed model incorporates attention mechanisms to address important patterns in the data and Temporal Convolutional Networks (TCNs) to handle sequential data. 
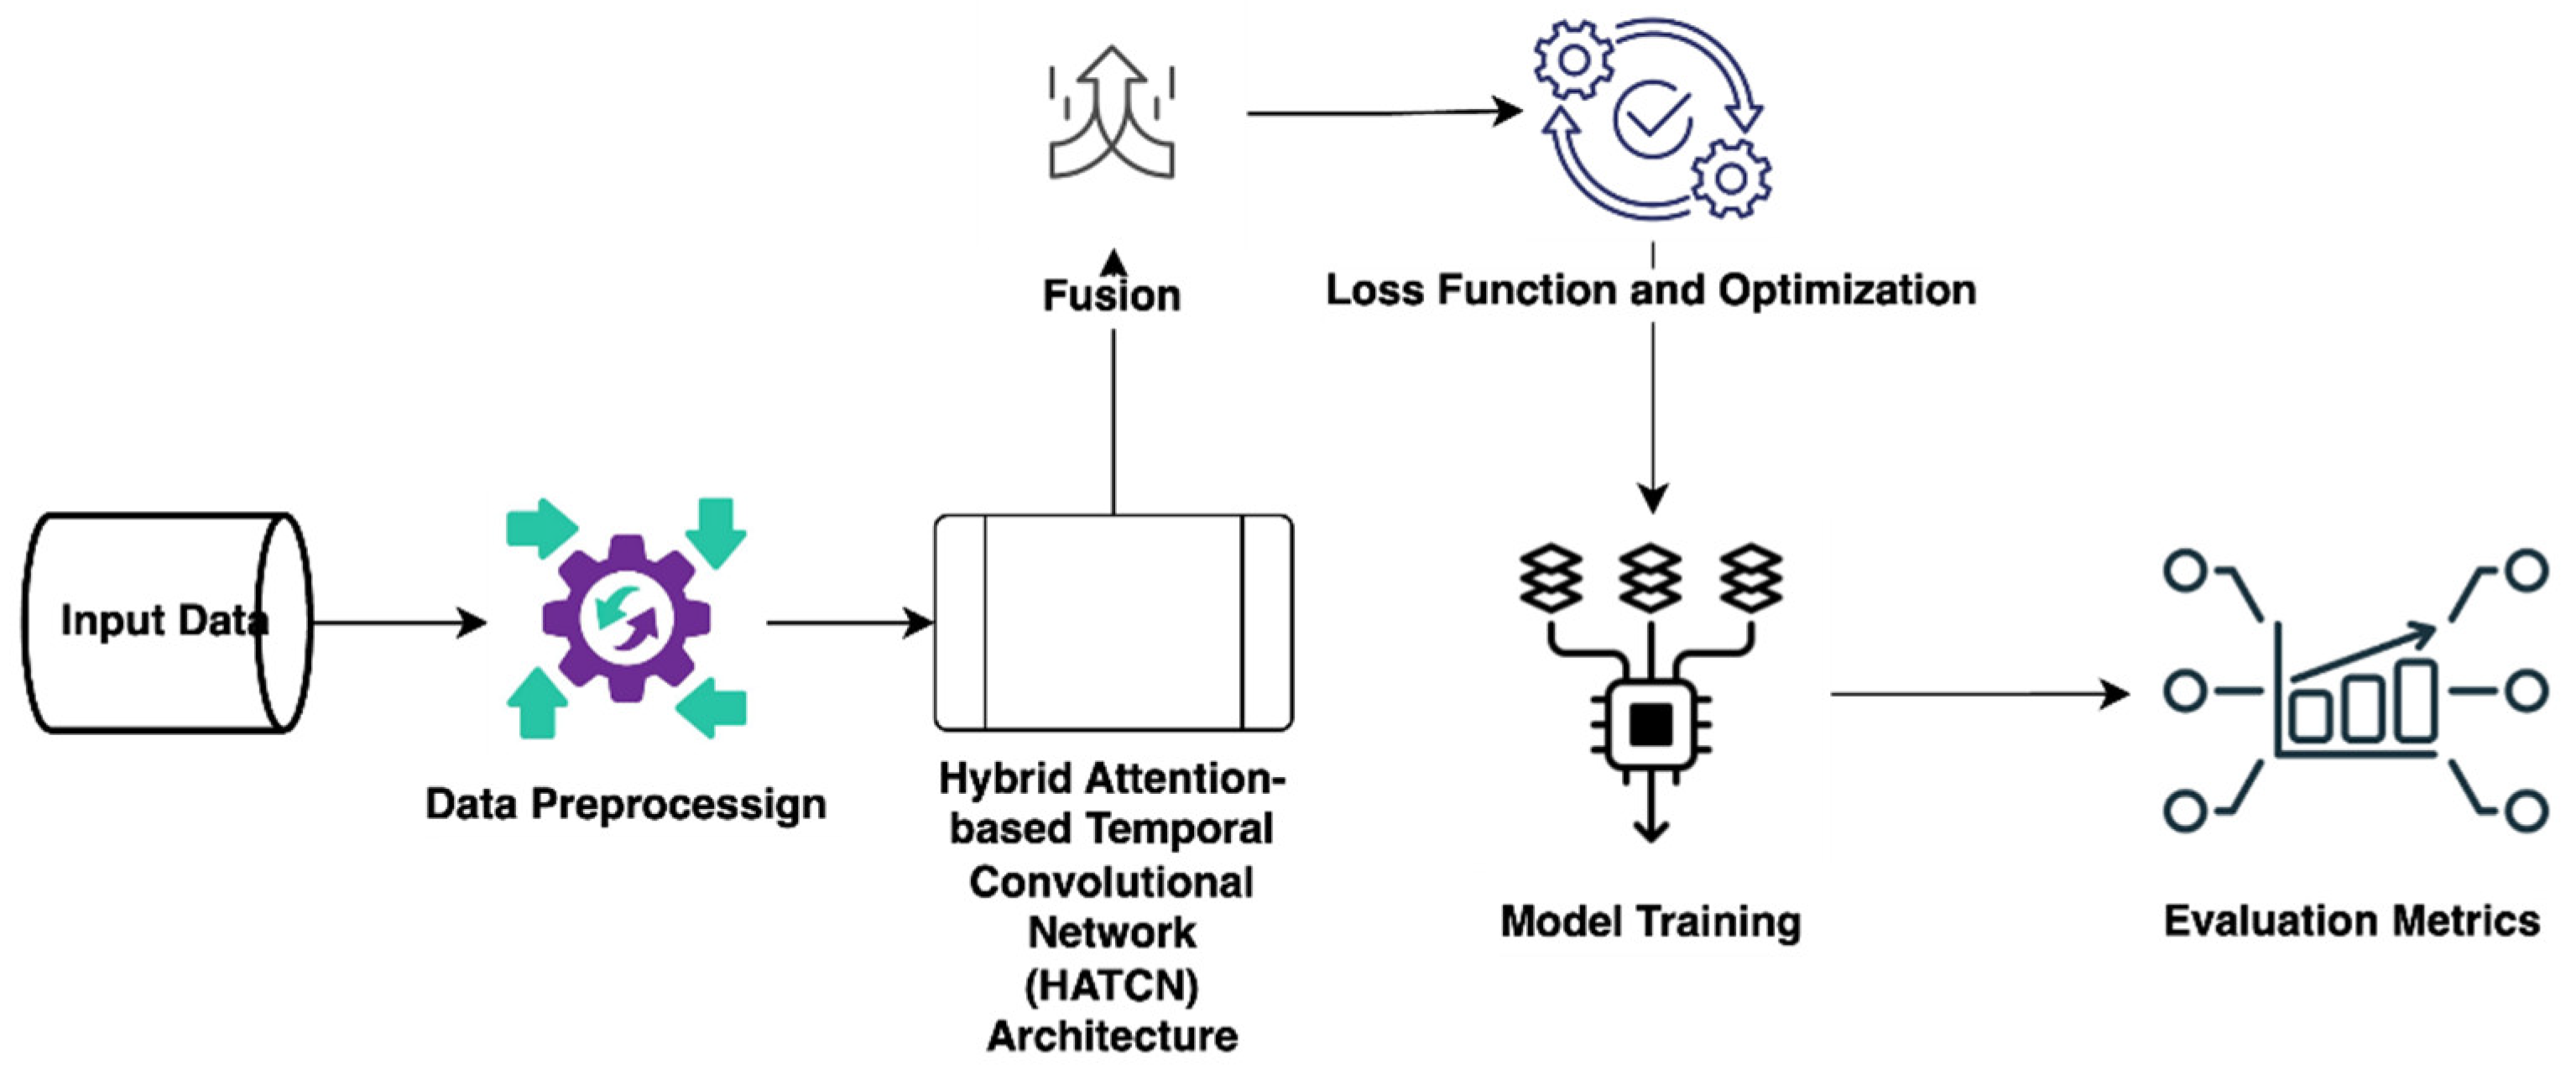
Figure 3 depicts HATCN architecture.
The architecture of the Hierarchical Attention-based Temporal Convolutional Network (HATCN-AD) model, illustrated in Figure 3, integrates multiple phases designed to process and classify time-series physiological data effectively.
The core elements of this architecture include signal preprocessing, feature extraction using Temporal Convolutional Networks (TCNs), hierarchical attention mechanisms, and a final classification layer. Each phase plays a critical role in extracting meaningful information from the time-series data and ensuring accurate classification of vital signs.
1. Signal preprocessing and spectrogram generation: The initial phase of the architecture emphasizes the preparation of input data, namely time-series vital sign measurements, including heart rate, blood pressure, oxygen saturation, and respiration rate. The continuous physiological signals were extracted from the MIMIC II dataset, comprising data from more than 90 ICU patients. The preprocessing phase includes normalization and handling missing data, ensuring the dataset is in a uniform format appropriate for deep learning models. Upon preprocessing the data, the model produces spectrograms for each input channel (e.g., heart rate, blood pressure). Spectrograms are time-frequency representations enabling the model to examine signals’ temporal and spectral attributes. This method is crucial in time-series data, as it records significant changes over time, facilitating the identification of anomalous patterns and trends in vital signs.
2. Temporal Convolutional Networks (TCNs): Following the generation of the spectrograms, the data are processed by Temporal Convolutional Networks (TCNs). Temporal Convolutional Networks (TCNs) are explicitly engineered to capture temporal dependencies within time-series data. The primary characteristic of TCNs is their utilization of dilated convolutions, enabling the model to expand the receptive field without additional layers. This allows the model to capture long-term temporal dependencies, crucial for monitoring vital signs over long durations. TCNs analyze the spectrograms produced in the prior stage, extracting feature representations that incorporate notable patterns in the time-series data. These feature representations incorporate the temporal properties of physiological signals, which are essential for identifying irregularities in vital signs.
3. Hierarchical attention mechanism: The next phase integrates a hierarchical attention mechanism, enhancing the model’s capacity to focus on relevant details within the data. This technique captures both temporal and channel-specific dependencies, enabling the model to selectively select different components of the time-series data and focus on the most essential information. The attention mechanism is structured in two tiers:
Temporal Attention: This mechanism assigns different weights to the time steps in the sequence, allowing the model to focus on important timestamps and ignore irrelevant ones. By assigning higher attention scores to crucial moments, the model can emphasize significant changes in the vital signs.
Channel Attention: This tier allows the model to focus on the most important vital sign channels (e.g., heart rate, blood pressure) and discard less relevant ones. By assigning different attention weights to each channel, the model can prioritize features more indicative of abnormal health patterns, improving the classification performance. Together, these two attention mechanisms help the model identify both intra- and inter-channel relationships in the physiological data, enabling it to make more informed predictions.
4. Hybrid attention layer: The outputs from the temporal and channel attention mechanisms are integrated into a hybrid attention layer, which combines the information derived from both levels of attention. This hybrid attention layer aggregates the attended temporal and channel aspects, effectively expressing the vital sign data. Integrating these two attention layers guarantees that the model effectively captures significant temporal dynamics and utilizes the most relevant attributes across all channels.
5. Classification: once the hybrid attention layer generates the final feature representation, it is passed through a softmax classification layer for binary classification. The classification task involves determining whether the input signals are normal or abnormal based on the extracted features. The softmax function assigns a probability to each class, and the model classifies the signals as either normal (no anomaly detected) or deviated (anomaly detected) based on the highest probability. This final classification phase enables the model to provide real-time feedback on patient conditions, classifying vital signs and detecting anomalies that may require further medical attention. The following subsections detail the mathematical modeling of the various steps involved in HATCN design.
A. Temporal Convolutional Network (TCN): To capture temporal dependencies, TCN applies dilated convolutions over the time dimension when processing the time series data.
i.
Dilated Convolutions
The definition of a one-dimensional (1D) dilated convolution at layer l is represented in Equation (1):
y t ( l ) = k = 0 K 1 W k ( l ) . x t d . k ( l 1 ) + b ( l )
where:
-
y t ( l ) is the output at time step t.
-
k is the index of the kernel, which ranges from 0 to K 1 (where K   is the size of the kernel). Each kernel in the convolution operation is applied to different time steps of the input sequence.
-
W k ( l ) is the convolution filter of size K, which is a kernel size at layer l.
-
d is the dilation factor that grows exponentially with each layer (for example, d = 1, 2, 4, …).
-
d . k : The dilation factor d   is multiplied by the kernel index k to determine the actual time step shift for each filter weight. This means that for each kernel k , the input at time t d . k is used in the convolution operation. The higher the dilation factor d , the more spread out the kernel is in terms of the time steps it operates over.
-
x t d . k ( l 1 ) is the input from the previous layer at time step td.k.
-
b ( l ) is the bias.
The mission of the dilated convolution is to allow the TCN to have a larger receptive field, which leads to covering more time steps with fewer layers.
ii.
Residual Connections
Deep network training is stabilized by adding residual connections, which are represented in Equation (2):
z t ( l ) = σ ( y t l + x t ( l 1 ) )
where:
-
z t ( l ) is the output following the residual connection at layer l.
-
σ is a non-linear activation function, such as ReLU.
B. Attention Mechanism: The attention mechanism enables the model to concentrate on significant portions of the time-series data at the temporal or channel level.
In temporal attention, the different time stamps in the sequences are assigned different weights. Equation (3) shows how to calculate the attention score for each time step:
e t = tanh W x ( x t + b x )
where:
-
W x is the matrix of learned weights.
-
b x is the vector of bias values.
The softmax function over all time steps is used to compute attention weights, as shown in Equation (4):
α t = e x p ( e t ) t ´ = 1 T exp ( e t ´ )
where:
-
α t represents the weight of attention for each time step t, such that t α t = 1 .
The z t e m p , which represents the attended temporal context vector, can be calculated as the weighted sum of the time step representations as shown in Equation (5):
z t e m p = t = 1 T α t x t
The input channels (vital signs) are given varying weights in channel attention. The attention score for each channel is provided, as shown in Equation (6):
e c = tanh ( W c x c + b c )
where:
-
W c are the channels of learned weight matrices.
-
b c is the bias term.
The softmax function is then used to compute the attention weights, as shown in Equation (7):
β c = exp ( e c ) c ´ = 1 T exp ( e c ´ )
where:
-
β c represents the weight of attention for channel c, such that c β c = 1 .
The context vector of the attended channel is calculated by using Equation (8):
z c h a n = c = 1 C β c x c
C: Hybrid Attention Layer: The outputs of the temporal and channel attention mechanisms are combined in the hybrid attention layer. This is demonstrated in Equation (9):
z h y b r i d = W t e m p z t e m p + W c h a n z c h a n
where:
-
z h y b r i d is the representation of the final attention.
-
W t e m p and W c h a n are the acquired weights used to combine the context vectors for the temporal and channel attention.

4.4. Feature Fusion

To classify the input as normal or abnormal, the model employs a fully connected (dense) layer after computing the hybrid attention vector z h y b r i d , as shown in Equation (10):
y ^ = σ W o u t z h y b r i d + b o u t
where:
-
y ^ is the predicted probability of being an anomaly (binary classification).
-
W o u t is the output layer of the weight matrix.
-
b o u t is the bias term.
-
σ is the sigmoid activation function for binary classification.
The final output of the HATCN-AD model can be represented by Equation (11):
y = 1 , i f       y ^ 0.5   ( a n o m a l y   d e t e c t e d ) 0 , o t h e r w i s e ( n o   a n o m a l y )

4.5. Loss Function and Optimization

A proper loss function should be selected based on the classification task in order to train the model effectively. The binary cross-entropy loss function in the proposed model is used for binary classification. Standard algorithms such as Adam or stochastic gradient descent (SGD) can be used for optimization. In this study, the Adam optimizer is applied.

4.6. Model Training

The batch training process segments data into batches to efficiently train the model on large datasets.

4.7. Evaluation and Performance Metrics

The following measures are used to evaluate the HATCN-AD model’s performance:
Accuracy: This metric computes the accurate prediction percentage, including both true positive and true negative, as shown in Equation (12):
A c c u r a c y = T P + T N T P + T N + F P + F N
where:
-
TP: true positives (instances that were accurately identified as positive).
-
TN: true negatives (instances that were accurately identified as negative).
-
FP: false positives (instances that were incorrectly identified as positive).
-
FN: false negatives (instances that were incorrectly identified as negative).
Precision: This metric calculates the percentage of accurate positive predictions among all the model’s positive predictions, as shown in Equation (13):
P r e c i s i o n = T P T P + F P
Recall: This metric quantifies the percentage of real positive cases that the model accurately predicted, as shown in Equation (14):
R e c a l l = T P T P + F N
F1-score: This is a balanced metric that considers false positives and negatives. It is calculated as the harmonic mean of precision and recall, as shown in Equation (15).
F 1 - s c o r e = 2 × P r e c i s i o n × R e c a l l P r e c i s i o n + R e c a l l

5. Experimental Results

This section introduces the dataset for assessing the suggested model and summarizes the empirical results.

5.1. Dataset

The Multiple Intelligent Monitoring in Intensive Care (MIMIC-I and II) [32] dataset, which comprises physiological data records from over 90 ICU patients—referred to as subjects—was used in this study. Several research publications [24,25,33] have used this dataset as a benchmark to validate the practicality of their proposed methods. Subjects 330 and 441 were chosen to test the model proposed in this research. Seven features in the data samples collected from these two participants characterize the patient’s vital signs as of the given time. The features gathered include heart rate (HR), pulse, temperature, respiration rate (RESP), oxygen saturation (SPO2), diastolic arterial blood pressure (ABPdias), mean arterial blood pressure (ABP-mean), and systolic arterial blood pressure (ABPsys).
Figure 4 displays sample sensor readings for blood pressure and heart rate (HR) from Subject 441. The blood pressure readings include two measurements: ABP diastolic (ABPdias), which represents the diastolic arterial blood pressure—the pressure in the arteries when the heart rests between beats—and ABP systolic (ABPsys), which represents the systolic arterial blood pressure—the pressure in the arteries during the contraction of the heart.

5.2. Experimental Setup

To validate the proposed model in this paper, two subjects were chosen from the MIMIC II dataset, namely, Subject 330 and Subject 441. We denote the data samples from Subjects 330 and 441 as Datasets 1 and 2, respectively. As mentioned in Section 4.2, the dataset samples should undergo necessary preprocessing steps, such as normalization/scaling and missing data handling, to prepare them for the model creation. The selected dataset samples are normalized to make them ready for deep learning processing. The normalization process aims to use a consistent scale to modify the dataset’s numeric column values without affecting the range of values or losing any data. Equation (16) is used to normalize the data.
x i = x i x ¯ S ( x )
where x(i) represents the dataset sample, x ¯ is the mean of the dataset (the average of all values in the dataset); S(x) is the standard deviation of the dataset (a measure of the spread of the dataset); and x i is the standardized value of the data point x i . After the data are normalized, some missing values in the dataset samples are removed to avoid biasing issues.
Before we explore the experimental results, it is worth presenting the most critical parameters of the HATCN-AD model, as shown in Table 1.

5.3. Results and Analysis

Several experiments are conducted on two datasets (Dataset 1 from Subject 330 and Dataset 2 from Subject 441 in the MIMIC II dataset). The k-fold cross-validation was employed in the experiments with k = 5. K-fold cross-validation is an effective technique for assessing model performance, guaranteeing that the outcomes are reliable, less influenced by arbitrary partitions, and indicative of actual performance. The following subsections present the results and analyses for each dataset in various settings of the number of epochs and the batch sizes. 50 and 100 epochs were used, while batch sizes of 32 and 64 were investigated in the experiments.
  • Results For Dataset 1
Table 2 presents the performance of the proposed HATCN-AD model on Dataset 1 (Subject 330) with a batch size of 32, evaluated at 50 and 100 epochs. The findings indicate outstanding performance, achieving an accuracy of 98.88% at 50 epochs, which marginally improves to 99.15% at 100 epochs. Precision, recall, and F1-scores consistently exhibit high values, ranging from 99.27% to 99.47%. The enhancement in measures with additional epochs indicates successful learning without indications of overfitting, as seen by consistent precision and recall levels. The elevated precision of 99.47% demonstrates the model’s effectiveness in reducing false positives, and the high recall of 99.45% reflects its effectiveness in identifying actual abnormalities. The F1-Score, continuously approaching 99.5%, demonstrates the model’s capability to balance precision and recall, making it exceptionally consistent for identifying significant anomalies in elderly healthcare monitoring.
Compared to batch size 32, Table 3, the model’s performance is evaluated on the same dataset employing a larger batch size of 64. The findings reveal a minor reduction in accuracy relative to Table 2, with values of 98.87% at 50 epochs and 99.11% at 100 epochs. Precision and recall are consistently good, with F1-scores exhibiting slight variations between 99.29% and 99.44%. The results indicate that the model retains reliability and robustness, although augmenting the batch size slightly influences performance metrics. Increased batch sizes could increase computational efficiency; nevertheless, they represent tradeoffs in convergence and minor decreases in accuracy. Nonetheless, the model’s capacity to generalize effectively across various setups is demonstrated by consistently high scores.
Figure 5 and Figure 6 illustrate the model’s accuracy and loss across epochs for Dataset 1 under different configurations, providing insight into the training dynamics of the HATCN-AD model.
The loss curve in Figure 5a exhibits a steep decline before leveling off, indicating that the model effectively decreases errors without exhibiting any overfitting. The accuracy graph in Figure 5b, where a batch size of 32 and 50 epochs are used, demonstrates that learning and convergence were successful, as evidenced by the quick increase during the early epochs and the subsequent stabilization.
Since there is no subsequent increase in loss, the loss curve in Figure 5c exhibits a consistent drop, suggesting that training beyond 100 epochs does not lead to overfitting. The accuracy curve in Figure 5d confirms the learning stability of the model, exhibiting a rapid ascent and peak comparable to that of Figure 5b.
Using a batch size of 64, with somewhat higher loss values than in Figure 5, the loss curve in Figure 6a exhibits a significant decline and stabilization, indicating that a larger batch size may slow down convergence. The accuracy graph in Figure 6b shows a steady rise before leveling out, suggesting that the model achieves peak performance fast. However, for 100 epochs, the loss curve in Figure 6c converges similarly to the 50-epoch loss, reflecting the model’s robustness and lack of overfitting even with increased training duration. Similarly, the accuracy in Figure 6d stabilizes early, remaining consistent with 50-epoch performance, showing that the model does not gain much from additional epochs.
  • Results For Dataset 2
Table 4 presents the performance of the HATCN-AD model on Dataset 2 (Subject 441) with a batch size of 32, evaluated at 50 and 100 epochs. The model achieves an accuracy of 0.9876 after 50 epochs, which marginally increases to 0.9896 after 100 epochs. Precision slightly decreases from 0.9923 to 0.9912, although recall increases somewhat from 0.9922 to 0.9957. The metrics yield F1-scores of 0.9922 at 50 epochs and 0.9935 at 100 epochs, indicating the model’s balanced effectiveness in anomaly recognition. The slightly decreased precision values imply that the model efficiently increases false positives, but the consistent recall signifies reliable identification of actual anomalies. The slight differences between 50 and 100 epochs indicate that the model converges early and maintains its dependability across extended training epochs.
Table 5 evaluates the performance of the HATCN-AD model on Dataset 2 (Subject 441) with a batch size of 64, assessed at 50 and 100 epochs. In 50 epochs, the model obtains an accuracy of 98.61%, which marginally increases to 99.05% in 100 epochs. Precision consistently remains elevated, commencing at 99.56% after 50 epochs and marginally declining to 99.52% after 100 epochs. Recall commences at 98.69% and improves to 99.29%, indicating the model’s outstanding ability to accurately detect actual anomalies. The F1-score exhibits a comparable trend, obtaining values of 99.44% and 99.40% at 50 and 100 epochs, respectively.
The results demonstrate that the model operates efficiently with an increased batch size, exhibiting elevated precision and recall despite the rise in the number of epochs. The minor decrease in precision at 100 epochs is compensated for by an enhancement in recall, indicating that the model sustains a consistent trade-off between reducing false positives and reliably identifying actual abnormalities. The consistent performance across varying epoch counts emphasizes the model’s reliability and adaptability for anomaly detection in elderly health monitoring.
The HATCN-AD model shows excellent effectiveness and long-term reliability across various batch sizes, epoch settings, and datasets in Table 2, Table 3, Table 4 and Table 5. The model has good generalization, as evidenced by the minimal fluctuations in accuracy and F1-score, which point to minor effects from batch size and epoch adjustments. For real-world applications, robust performance across various settings guarantees the reliable identification of abnormalities in the vital signs of elderly patients, enabling prompt interventions. This consistency is essential as the model performs well under various scenarios, demonstrating its applicability for real-time observation in crucial healthcare environments.
The accuracy and loss of the model across epochs for Dataset 2 with different configurations are shown in Figure 7 and Figure 8, revealing details regarding the training behavior of the HATCN-AD model.
With a batch size of 32, in line with the findings of Dataset 1, the loss in Figure 7a exhibits a steady fall that suggests no overfitting and smooth convergence, lacking any spikes or rises. The accuracy in Figure 7b exhibits a well-known pattern of sharp increase and decrease, indicating that the model also functions well on Dataset 2. Similarly, for 100 epochs, the low and stable loss curve in Figure 7c shows the model’s consistent error minimization over an extended training period. The accuracy plot in Figure 7d illustrates stability over multiple epochs while reflecting the 50-epoch trend.
In the scenario of a 64 batch size, though having slightly greater initial loss values than in smaller batch sizes, loss in Figure 8a decreases fast before stabilizing, showing efficient learning and stability. The accuracy curve in Figure 8b demonstrates the model’s capacity to converge quickly once more by displaying rapid stabilization.
In the case of 100 epochs, the loss in Figure 8d shows a smooth declining trend before plateauing, indicating that the model does not exhibit overfitting or excessive error accumulation even after 100 epochs. Figure 8c shows that the declining accuracy performance returns with more epochs, staying constant with the 50-epoch design.
To conclude, the HATCN-AD model exhibits consistent learning patterns with fast improvements in accuracy and stable, low loss levels in all configurations, as seen in Figure 5, Figure 6, Figure 7 and Figure 8. Regardless of the batch size or epoch period, the model appears to generalize effectively without overfitting based on the lack of rising loss trends or fluctuating accuracy. For real-world applications, particularly in the monitoring of elderly patients, this stability is essential since it guarantees dependable performance under a variety of situations and for prolonged periods. The outcomes highlight the model’s adaptability and robustness for ongoing, long-term healthcare monitoring, where reliable performance is critical.

6. Comparisons and Discussion

The proposed Hierarchical Attention-based Temporal Convolutional Network (HATCN-AD) model is compared with one baseline machine learning model named the one-class support vector machine (OCSVM), two baseline deep learning models named the convolutional neural network (CNN) and the long short-term memory technique (LSTM), and a hybrid deep learning model named ConvLSTM proposed in [25], as shown in Table 6. The accuracy, precision, recall, and F1-score evaluation measures are used to evaluate the models’ overall performance and capacity to correctly identify abnormal vital signs in elderly patients.
In Dataset 1, as Table 6 shows, the HATCN-AD model has superior performance compared to all baseline models, achieving the greatest accuracy (99.15%), precision (99.47%), recall (99.45%), and F1-score (99.46%). ConvLSTM, the nearest competitor, achieves an accuracy of 98% along with balanced precision, recall, and F1-score, all at 98%. Nevertheless, simpler models such as CNN and LSTM exhibit substantially lower performance, with CNN achieving only 96% precision and 97% recall, while LSTM shows comparably modest results. OCSVM exhibits a notable insufficiency, achieving an accuracy of 81% and an overall lower F1-Score of 76%, signifying its inadequacy in addressing the task’s complexity.
The HATCN-AD model’s exceptional performance demonstrates its capacity to capture both temporal and feature-level relationships in vital sign data, utilizing hierarchical attention mechanisms and temporal convolutional networks. This functionality improves its accuracy and sensitivity, guaranteeing that anomalies are identified with minimum false positives and negatives, which is essential for healthcare applications.
Table 7 shows that, in Dataset 2, the HATCN-AD model has superior performance, achieving an accuracy of 98.96%, precision of 99.12%, recall of 99.57%, and an F1-score of 99.35%. CNN achieves an accuracy of 99% and a competitive recall of 98%, but it decreases in precision and F1-score. The LSTM and ConvLSTM models exhibit lower performance than Dataset 1, achieving accuracy near 98%, with accuracy and recall generally between 96% and 97%, along with related F1-scores. The OCSVM once more proves inadequate, exhibiting comparable deficiencies as noted in Dataset 1.
The findings indicate that the HATCN-AD model has continuous reliability across several datasets, preserving exceptional detection capabilities. Its advantage over other models comes from its hybrid architecture, which combines temporal and channel-specific attention mechanisms to enhance comprehension of the complexities in multivariate time-series data. The comparison highlights the advantages of the HATCN-AD model regarding precision and recall, which are critical metrics in healthcare settings where false positives (unwarranted interventions) and false negatives (missed anomalies) can lead to significant repercussions. The ConvLSTM model exhibits adequate performance; nonetheless, it falls short of the suggested model’s accuracy. Basic models such as CNN and LSTM demonstrate constraints in their ability to encapsulate the complex nature of the data, especially in differentiating between normal and abnormal values in changing health conditions.
Table 8 displays the paired statistical t-test outcomes that compare the proposed HATCN-AD model with the compared models (CNN, LSTM, ConvLSTM, and OCSVM) over Datasets 1 and 2. The p-values in the table reflect the statistical significance of the performance differences between the HATCN-AD model and the other models, as the value of p is less than 0.05 in all cases.
In a complexity analysis, the proposed HATCN-AD model combines the hierarchical attention mechanism and the temporal convolutional network (TCN) incurs O ( k × n + n × c ) , where k is the kernel size, n is the sequence length, and c is the number of channels. Such a combination results in efficient parallelization and scalability for multivariate time-series data such as vital sign readings. With the CNN model, which depends solely on convolutional operations, the complexity makes it more efficient but, on the other hand, less effective in capturing long-term dependencies, which is a common feature for vital sign readings. LSTMs, with their sequential processing nature, have a higher complexity of O ( n 2 × d ) , where d is the hidden layer’s size. Such high complexity is a limitation of their scalability for long sequences. ConvLSTM combines the convolutional layers with LSTM layers, resulting in compounded complexity O ( k × n + n 2 × d ) , which increases computational overhead. Finally, the OCSVM, in its standard implementation, has a complexity of O ( n 3 ) for training and O ( n 2 ) for prediction, which makes it inefficient for large datasets or real-time monitoring settings. Overall, the proposed HATCN-AD model balances efficiency as per this analysis and effectiveness as presented in Table 6 and Table 7, outperforming the other models in handling multivariate vital sign data with lower computational overhead and better scalability for real-time healthcare monitoring applications.

7. Concluding Remarks and Future Work

This study introduced a novel Hierarchical Attention-based Temporal Convolutional Network (HATCN-AD) model to detect abnormal vital signs in older adults. The model outperforms the traditional baseline machine learning model OCSVM and traditional baseline deep learning models like CNN, LSTM, and the ConvLSTM deep learning model, achieving the highest F1-score. The model focuses on important features in time-series data by combining temporal convolutional networks with attention mechanisms. HATCN-AD’s resilience and flexibility make it ideal for real-time, continuous monitoring of elderly individuals, making it a valuable tool in healthcare. Despite its positive results, several limitations must be addressed in future work. Firstly, the model was validated using a limited dataset, consisting of data from only two subjects (Subjects 330 and 441) from the MIMIC II dataset. While widely used, this narrow scope limits the model’s generalizability. Future studies should incorporate a more diverse set of subjects to enhance the model’s robustness and applicability to a broader population of elderly individuals. Furthermore, the model’s applicability to other healthcare scenarios, such as detecting anomalies in different conditions or incorporating additional sensor data, has yet to be tested. Future work should investigate these possibilities to expand the model’s versatility. Finally, while the results demonstrated high accuracy and recall, the real-time performance of the model—especially its ability to handle large volumes of continuous data in live monitoring environments—requires further validation. Testing the model in real-world settings will be essential for evaluating its efficiency and suitability for continuous healthcare monitoring.

Author Contributions

Conceptualization, M.A.R. and A.A.A.-S.; methodology, M.A.R.; software, M.A.R.; validation, M.A.R. and A.A.A.-S.; formal analysis, M.A.R.; investigation, A.A.A.-S.; resources, M.A.R.; data curation, M.A.R.; writing—original draft preparation, M.A.R. and A.A.A.-S.; writing—review and editing, M.A.R. and A.A.A.-S.; visualization, M.A.R. and A.A.A.-S.; supervision, M.A.R.; project administration, M.A.R. All authors have read and agreed to the published version of the manuscript.

Funding

The authors gratefully acknowledge Qassim University, represented by the Deanship of Scientific Research, on the financial support for this research under the number (2023-SDG-l-BSRC36393) during the academic year 1445 AH/2023 AD.

Data Availability Statement

The original data used in the study are openly available in [Physionet] at [https://www.physionet.org/content/mimicdb/1.0.0], accessed on 7 January 2024.

Conflicts of Interest

The authors declare no conflicts of interest.

References

  1. Ahmed, S.; Irfan, S.; Kiran, N.; Masood, N.; Anjum, N.; Ramzan, N. Remote Health Monitoring Systems for Elderly People: A Survey. Sensors 2023, 23, 7095. [Google Scholar] [CrossRef] [PubMed]
  2. Motwani, A.; Shukla, P.K.; Pawar, M. Ubiquitous and Smart Healthcare Monitoring Frameworks Based on Machine Learning: A Comprehensive Review. Artif. Intell Med. 2022, 134, 102431. [Google Scholar] [CrossRef] [PubMed]
  3. Deepa, K.; Bacanin, N.; Askar, S.S.; Abouhawwash, M. Elderly and Visually Impaired Indoor Activity Monitoring Based on Wi-Fi and Deep Hybrid Convolutional Neural Network. Sci. Rep. 2023, 13, 22470. [Google Scholar] [CrossRef] [PubMed]
  4. Guk, K.; Han, G.; Lim, J.; Jeong, K.; Kang, T.; Lim, E.K.; Jung, J. Evolution of Wearable Devices with Real-Time Disease Monitoring for Personalized Healthcare. Nanomaterials 2019, 9, 813. [Google Scholar] [CrossRef]
  5. Khan, F.A.; Haldar, N.A.H.; Ali, A.; Iftikhar, M.; Zia, T.A.; Zomaya, A.Y. A Continuous Change Detection Mechanism to Identify Anomalies in ECG Signals for WBAN-Based Healthcare Environments. IEEE Access 2017, 5, 13531–13544. [Google Scholar] [CrossRef]
  6. Mohamed, M.B.; Makhlouf, A.M.; Fakhfakh, A. Correlation for Efficient Anomaly Detection in Medical Environment. In Proceedings of the 2018 14th International Wireless Communications & Mobile Computing Conference (IWCMC), Limassol, Cyprus, 25–29 June 2018; pp. 548–553. [Google Scholar]
  7. Haque, S.A.; Rahman, M.; Aziz, S.M. Sensor Anomaly Detection in Wireless Sensor Networks for Healthcare. Sensors 2015, 15, 8764–8786. [Google Scholar] [CrossRef]
  8. Zamry, N.M.; Zainal, A.; Rassam, M.A. Unsupervised Anomaly Detection for Unlabelled Wireless Sensor Networks Data. Int. J. Adv. Soft Comput. Its Appl. 2018, 10, 172–191. [Google Scholar]
  9. Yu, L.-R. DTAAD: Dual Tcn-Attention Networks for Anomaly Detection in Multivariate Time Series Data. Knowl. Based Syst. 2024, 295, 111849. [Google Scholar] [CrossRef]
  10. Abdulmalek, S.; Nasir, A.; Jabbar, W.A.; Almuhaya, M.A.M.; Bairagi, A.K.; Khan, M.A.M.; Kee, S.H. IoT-Based Healthcare-Monitoring System towards Improving Quality of Life: A Review. Healthcare 2022, 10, 1993. [Google Scholar] [CrossRef]
  11. Malan, D.J.; Fulford-Jones, T.; Welsh, M.; Moulton, S. Codeblue: An Ad Hoc Sensor Network Infrastructure for Emergency Medical Care. In Proceedings of the International Workshop on Wearable and Implantable Body Sensor Networks, London, UK, 6–7 April 2004. [Google Scholar]
  12. Li, X.; Ren, S.; Gu, F. Medical Internet of Things to Realize Elderly Stroke Prevention and Nursing Management. J. Healthc. Eng. 2021, 2021, 9989602. [Google Scholar] [CrossRef]
  13. Hamim, M.; Paul, S.; Hoque, S.I.; Rahman, M.N.; Baqee, I. Al IoT Based Remote Health Monitoring System for Patients and Elderly People. In Proceedings of the 1st International Conference on Robotics, Electrical and Signal Processing Techniques, ICREST 2019, Dhaka, Bangladesh, 10–12 January 2019; Institute of Electrical and Electronics Engineers Inc.: Piscataway, NJ, USA, 2019; pp. 533–538. [Google Scholar]
  14. Duodu, N.Y.; Patel, W.D.; Koyuncu, H.; Nartey, F.; Torgby, W. Empowering Health and Well-Being: IoT-Driven Vital Signs Monitoring in Educational Institutions and Elderly Homes Using Machine Learning. Int. J. Electr. Electron. Res. 2024, 12, 42–49. [Google Scholar] [CrossRef]
  15. Ko, J.; Lim, J.H.; Chen, Y.; Musvaloiu-E, R.; Terzis, A.; Masson, G.M.; Gao, T.; Destler, W.; Selavo, L.; Dutton, R.P. MEDiSN: Medical Emergency Detection in Sensor Networks. ACM Trans. Embed. Comput. Syst. 2010, 10, 1–29. [Google Scholar] [CrossRef]
  16. Cunha, J.P.S.; Cunha, B.; Pereira, A.S.; Xavier, W.; Ferreira, N.; Meireles, L. Vital-Jacket®: A Wearable Wireless Vital Signs Monitor for Patients’ Mobility in Cardiology and Sports. In Proceedings of the 2010 4th International Conference on Pervasive Computing Technologies for Healthcare, Munich, Germany, 22–25 March 2010; pp. 1–2. [Google Scholar]
  17. Navarro, K.F.; Lawrence, E.; Lim, B. Medical MoteCare: A Distributed Personal Healthcare Monitoring System. In Proceedings of the 2009 International Conference on eHealth Telemedicine, and Social Medicine, Cancun, Mexico, 1–7 February 2009; pp. 25–30. [Google Scholar]
  18. Grgić, K.; Žagar, D.; Križanović, V. Medical Applications of Wireless Sensor Networks-Current Status and Future Directions. Med. Glas. 2012, 9, 23–31. [Google Scholar]
  19. Alemdar, H.; Ersoy, C. Wireless Sensor Networks for Healthcare: A Survey. Comput. Netw. 2010, 54, 2688–2710. [Google Scholar] [CrossRef]
  20. Bettencourt, L.M.A.; Hagberg, A.A.; Larkey, L.B. Separating the Wheat from the Chaff: Practical Anomaly Detection Schemes in Ecological Applications of Distributed Sensor Networks. In Proceedings of the Distributed Computing in Sensor Systems: Third IEEE International Conference, DCOSS 2007, Santa Fe, NM, USA, 18–20 June 2007; Proceedings 3. Springer: Berlin, Germany, 2007; pp. 223–239. [Google Scholar]
  21. Shahid, N.; Naqvi, I.H.; Qaisar, S. Bin One-Class Support Vector Machines: Analysis of Outlier Detection for Wireless Sensor Networks in Harsh Environments. Artif. Intell. Rev. 2015, 43, 515–563. [Google Scholar] [CrossRef]
  22. Subramaniam, S.; Palpanas, T.; Papadopoulos, D.; Kalogeraki, V.; Gunopulos, D. Online Outlier Detection in Sensor Data Using Non-Parametric Models. In Proceedings of the 32nd International Conference on Very Large Data Bases, Seoul, Republic of Korea, 12–15 September 2006; pp. 187–198. [Google Scholar]
  23. Salem, O.; Serhrouchni, A.; Mehaoua, A.; Boutaba, R. Event Detection in Wireless Body Area Networks Using Kalman Filter and Power Divergence. IEEE Trans. Netw. Serv. Manag. 2018, 15, 1018–1034. [Google Scholar] [CrossRef]
  24. Arfaoui, A.; Kribeche, A.; Senouci, S.M.; Hamdi, M. Game-Based Adaptive Anomaly Detection in Wireless Body Area Networks. Comput. Netw. 2019, 163, 106870. [Google Scholar] [CrossRef]
  25. Albattah, A.; Rassam, M.A. A Correlation-Based Anomaly Detection Model for Wireless Body Area Networks Using Convolutional Long Short-Term Memory Neural Network. Sensors 2022, 22, 1951. [Google Scholar] [CrossRef]
  26. Luo, T.; Nagarajan, S.G. Distributed Anomaly Detection Using Autoencoder Neural Networks in WSN for IoT. In Proceedings of the 2018 IEEE International Conference on Communications (ICC), Kansas City, MI, USA, 20–24 May 2018; pp. 1–6. [Google Scholar]
  27. Cao, H.R.; Zhan, C. A Novel Emergency Healthcare System for Elderly Community in Outdoor Environment. Wirel. Commun. Mob. Comput. 2018, 2018, 7841026. [Google Scholar] [CrossRef]
  28. Azimi, I.; Rahmani, A.M.; Liljeberg, P.; Tenhunen, H.; Rahmani, A.M.; Tenhunen, H. Internet of Things for Remote Elderly Monitoring: A Study from User-Centered Perspective. J. Ambient. Intell. Humaniz. Comput. 2017, 8, 273–289. [Google Scholar] [CrossRef]
  29. Yu, L.; Chan, W.M.; Zhao, Y.; Tsui, K.L. Personalized Health Monitoring System of Elderly Wellness at the Community Level in Hong Kong. IEEE Access 2018, 6, 35558–35567. [Google Scholar] [CrossRef]
  30. Bertini, F.; Bergami, G.; Montesi, D.; Veronese, G.; Marchesini, G.; Pandolfi, P. Predicting Frailty Condition in Elderly Using Multidimensional Socioclinical Databases. Proc. IEEE 2018, 106, 723–737. [Google Scholar] [CrossRef]
  31. Alsaeedi, A.; Jabeen, S.; Kolivand, H. Ambient Assisted Living Framework for Elderly Care Using Internet of Medical Things, Smart Sensors, and GRU Deep Learning Techniques. J. Ambient. Intell. Smart Environ. 2022, 14, 5–23. [Google Scholar]
  32. MIMIC Datasets. Available online: https://www.physionet.org/content/mimicdb/1.0.0/ (accessed on 7 January 2024).
  33. Salem, O.; Alsubhi, K.; Mehaoua, A.; Boutaba, R. Markov Models for Anomaly Detection in Wireless Body Area Networks for Secure Health Monitoring. IEEE J. Sel. Areas Commun. 2020, 39, 526–540. [Google Scholar] [CrossRef]
Figure 1. IoMT architecture.
Technologies 12 00258 g001
Figure 2. Proposed HATCN-AD model architecture.
Technologies 12 00258 g002
Figure 3. HATCN architecture.
Technologies 12 00258 g003
Figure 4. Sensor readings for three selected vital signs.
Technologies 12 00258 g004
Figure 5. Results on Dataset 1 with batch size = 32: (a) Model loss for 50 epochs. (b) Model accuracy for 50 epochs. (c) Model loss for 100 epochs. (d) Model accuracy for 100 epochs.
Technologies 12 00258 g005
Figure 6. Results on Dataset 1 with batch size = 64: (a) Model loss for 50 epochs. (b) Model accuracy for 50 epochs. (c) Model loss for 100 epochs. (d) Model accuracy for 100 epochs.
Technologies 12 00258 g006
Figure 7. Results on Dataset 2 with batch size = 32: (a) Model loss for 50 epochs. (b) Model accuracy for 50 epochs. (c) Model loss for 100 epochs. (d) Model accuracy for 100 epochs.
Technologies 12 00258 g007
Figure 8. Results on Dataset 2 with batch size = 64: (a) Model loss for 50 epochs. (b) Model accuracy for 50 epochs. (c) Model loss for 100 epochs. (d) Model accuracy for 100 epochs.
Technologies 12 00258 g008
Table 1. Parameters setting of the proposed model.
ParameterValues
Epochs50,100
Validation_split0.20
Batch size32.64
OptimizerAdam
Lossbinary_crossentropy
TCN_block64, 128, 256
Kernel size3
Dilation_rate1, 2, 4
Activation functionSigmoid activation
Table 2. Evaluation metrics of the proposed model on Dataset 1 with batch size = 32.
EpochsAccuracyPrecisionRecallF1-Score
500.98880.99270.99320.9930
1000.99150.99470.99450.9946
Table 3. Evaluation metrics of the proposed model on Dataset 1 with batch size = 64.
EpochsAccuracyPrecisionRecallF-Measure
500.98870.99240.99360.9929
1000.99110.99350.99540.9944
Table 4. Evaluation metrics of the proposed model on Dataset 2 with batch size = 32.
EpochsAccuracyPrecisionRecallF1-Score
500.98760.99230.99220.9922
1000.98960.99120.99570.9935
Table 5. Evaluation metrics of the proposed model on Dataset 2 with batch size = 64.
EpochsAccuracyPrecisionRecallF-Measure
500.98610.99560.98690.9944
1000.99050.99520.99290.9940
Table 6. Comparison with existing models on Dataset 1.
ModelAccuracyPrecisionRecallF1-Score
CNN0.980.960.970.97
LSTM0.970.960.960.96
ConvLSTM0.980.980.980.98
OCSVM0.810.800.810.76
Proposed Model0.99150.99470.99450.9946
Table 7. Comparison with existing models on Dataset 2.
ModelAccuracyPrecisionRecallF1-Score
CNN0.980.980.980.98
LSTM0.980.960.970.97
ConvLSTM0.980.970.970.97
OCSVM0.800.790.800.75
Proposed Model0.98960.99120.99570.9935
Table 8. Paired statistical t-test between the HATCN-AD model and the other models.
Paired t-Test withp-Value (Dataset 1)p-Value (Dataset 2)
CNN Model0.01530.0081
LSTM Model0.00240.0251
ConvLSTM Model0.00040.0198
OCSVM Model0.00050.005
Disclaimer/Publisher’s Note: The statements, opinions and data contained in all publications are solely those of the individual author(s) and contributor(s) and not of MDPI and/or the editor(s). MDPI and/or the editor(s) disclaim responsibility for any injury to people or property resulting from any ideas, methods, instructions or products referred to in the content.

