Article

Resource Sizing for Virtual Environments of Networked Interconnected System Services

1
Federal Treasury of Ministry of Finance of the Russian Federation, 101000 Moscow, Russia
2
Department of Digital Data Processing Technologies, MIREA—Russian Technological University, 119454 Moscow, Russia
*
Author to whom correspondence should be addressed.
Technologies 2024, 12(12), 245; https://doi.org/10.3390/technologies12120245
Submission received: 28 October 2024 / Revised: 20 November 2024 / Accepted: 25 November 2024 / Published: 27 November 2024
(This article belongs to the Section Information and Communication Technologies)

Abstract

:
Networked interconnected systems are often deployed in infrastructures with resource allocation using isolated virtual environments. The technological implementation of such systems varies significantly, making it difficult to accurately estimate the required volume of resources to allocate for each virtual environment. This leads to overprovisioning of some services and underprovisioning of others. The problem of distributing the available computational resources between the system services arises. To efficiently use resources and reduce resource waste, the problem of minimizing free resources under conditions of unknown ratios of resource distribution between services is formalized; an approach to determining regression dependencies of computing resource consumption by services on the number of requests and a procedure for efficient resource distribution between services are proposed. The proposed solution is experimentally evaluated using the networked interconnected system model. The results show an increase in throughput by 20.75% compared to arbitrary resource distribution and a reduction in wasted resources by 55.59%. The dependences of the use of resources by networked interconnected system services on the number of incoming requests, identified using the proposed solution, can also be used for scaling in the event of an increase in the total volume of allocated resources.

1. Introduction

Allocation of computing resources between interconnected system services hosted in a cloud computing infrastructure is a common practice. Hosting of services can be implemented in various forms. For example, the computing infrastructure can host virtual machines (VMs) with components of software systems [1,2,3], containers with microservices [4,5,6] or serverless functions [7,8,9] implementing specific calculations. Examples of the implementation of such systems are access control systems, banking systems, e-learning systems, web portals, social networks and others.
The technological implementation of networked interconnected systems can differ significantly both in terms of subsystems and their internal structure. The composition of services may include, for example, database management systems (DBMSs), data processing nodes, distributed file systems, message brokers, caching subsystems, load balancers, application programming interfaces (APIs), and user web interfaces. The implementation of each service may differ—for this, various existing solutions or specially developed components can be used [10]. They can be based on various programming languages, data transfer protocols, data formats, frameworks and software libraries. The above forms the technology stack [11] of a networked interconnected system. Subsystems can be distributed across multiple machines, both physical and virtual, including those located in multiple data centers [12] or across multiple cloud infrastructure providers [13].
The technologies and data processing algorithms used to implement networked interconnected system services may have different requirements for computing resources. This is especially important when the task is related to big data processing [14,15] or to high-load scenarios [16] due to a large number of incoming requests.
Allocation of computing resources proportional to the requirements of the implemented services of a networked interconnected system allows the system to operate more efficiently [17], reducing resource waste in those subsystems that are waiting for data to be processed by more loaded subsystems. But given the diversity of possible implementations of a networked interconnected system, it is difficult to provide accurate estimates of the required computing resources by sole expertise.
One of the possible solutions considered in the literature is the placement of services in elastic infrastructures [18]. However, this option is not always available. There are tasks in which a fixed amount of computing resources are given that must be used most efficiently.
The problem of distribution of computing resources with a fixed volume of resources is considered. It is necessary to distribute resources between system services in such a way as to utilize them to the maximum extent. This task is important for interconnected system services that process data sequentially and/or in parallel or that wait for the results of related processes. For example, if a number of data processing subsystems are waiting for results to be delivered by another subsystem, increasing resources for these dependent subsystems will not increase the performance of the entire system. Under these conditions, performance and scalability depend on the most resource-consuming modules. Thus, the purpose of modeling is to identify the dependence of the required resources of all interconnected system services on the most resource-intensive ones. The dependency should be identified in such a way that the total resource usage from a given volume is maximized. In addition, it is important that if the total volume of resources increases, the resulting dependence allows for the efficient distribution of resources in scope of the objective of their maximum use.
Without loss of generality, let us consider a typical example of a system combining sequential and parallel data processing. Networked interconnected systems considered in the work consist of several subsystems divided by their corresponding tasks (Figure 1). They include an API subsystem responsible for receiving external requests, generating messages for data processing services and preparing responses, a message broker which is a link between all data processing components, message processing services that also communicate via the message broker, and database management system services that implement replication and sharding.
Services of the networked interconnected system can be encapsulated into various virtualized environments such as virtual machines or containers. Each virtualized environment has its own resource limitations within the common resource pool.
The contributions of this paper are as follows:
(1)
For services of a networked interconnected system that process and transmit data to each other after processing, the problem of minimizing free resources under conditions of unknown ratios of the use of distributed resources between services is formalized.
(2)
An experimental approach is proposed for determining the regression dependencies of the consumed resources of each interconnected service on the number of requests. The approach allows for identifying bottlenecks in the system and relationships between the resource usage of other services on the resource usage of the service with the bottleneck, which consumes all the resources allocated to it.
(3)
A procedure is proposed that allows for the efficient redistribution of resources in interconnected systems in such a way that all available resources are used to the maximum extent. This is achieved by allocating the maximum possible volume of resources to the bottleneck service, while ensuring that the other services do not become such a bottleneck and have sufficient resources to process a proportional amount of data.
The rest of the paper is organized as follows. Section 2 provides an overview of the related works. Section 3 presents the proposed resource allocation models and procedure, as well as the system model that is used for experimental study. Section 4 provides results of the experiment following the proposed procedure. Section 5 discusses the results of the experiment and its implications. Section 6 summarizes the results and draws conclusions on the work presented.

2. Related Works

Regardless of the form of service presentation, the method of the virtual environments’ isolation, the methods of accounting for the use of computing resources, the underlying technologies and infrastructure providers solve the problems of efficient use [4,19,20,21] of available computing resources. Computing resources include central processing unit (CPU) time, random-access memory (RAM), disk space and throughput, network bandwidth and traffic.
Infrastructure providers solve problems of horizontal and vertical scaling [1,18,22] based on the current load on services and redistribution of virtual environments [2,3,4,23] between physical or virtual servers (also, considering service affinity). For elastic [5,7,18] infrastructures, the amount of allocated computing resources is commonly determined by the provider. For inelastic infrastructures [24], the choice usually remains with the consumer. In some cases [6,20], it is possible to allocate a fixed volume of resources, determined on the basis of the incoming task evaluation.
Based on the definition [18], elasticity is achieved through scalability (horizontal and vertical), automation and optimization. Inelastic infrastructures often lack automation [18], but the volumes of allocated resources can be configured by the consumer. For this purpose, both detailed settings and preset sizes of virtual environments can be presented.
The selection of the volume of allocated computing resources for the virtual environment deployed in the inelastic infrastructures is generally performed based on expert opinion. Due to the large number of factors influencing the volume of resources required, such estimates are rarely accurate [6,25], resulting in either overprovisioning or underprovisioning. In the first case, the cost of virtual environment resources will be higher than necessary, and unused resources will be wasted. In case of underprovisioning, service performance may be lower than desired.
In refs. [8,19,23,24], methods are proposed for estimating the correct volume of required resources based on historical data. In some cases, prediction of computing resource demand is considered for the purpose of resizing [8,19] on the infrastructure provider side, while in others, it is considered for the purpose of putting forward recommendations [24,25] for changing the size of virtual machines and containers. For this purpose, both classical forecasting methods [24,25] and neural networks [8,19] are used.
To predict the volume of required computing resources, optimization problems are formulated. The objective of optimization may be to minimize energy costs [3,19], minimize the monetary cost [2,5,8,19] of dedicated virtual environments, minimize the response time to a user request [8,20], maximize throughput [5,25], and others.
The optimization problem is considered both for the reactive approach [4,18], for example, for prediction of the workload based on monitoring data, and for the proactive approach [6,23,26], when a prediction is made by taking into account the features of the incoming computational tasks. Also, there is a combination of reactive and proactive approaches [27].
The main emphasis is placed on the dynamic [28] allocation of the correct volume of resources for calculations by the infrastructure provider, while the problem of selecting the correct volumes from the consumer’s perspective is considered much less frequently.
As it is noted, the optimal choice of the size of the virtual environment by the consumer is non-trivial [8] but can lead to better results in terms of the ratio of throughput and allocated computing resources. This is especially true for the networked interconnected systems [29,30,31], which consist of several computing services, under the conditions of sharing a common pool of resources. The load in such systems may be distributed unevenly [32] between services, which will lead to underprovisioning of some virtual environments and overprovisioning of others.
Since this paper considers inelastic infrastructures, its focus is on the selection of appropriate volumes of computing resources from the consumer’s perspective, rather than from the cloud provider’s. Elastic infrastructures implement a similar approach on the provider side, but commonly, it is based on either the current or predicted workload and, generally, strives to provide the minimum volume of computing resources necessary, rather than to maximize the networked interconnected system throughput.

3. Materials and Methods

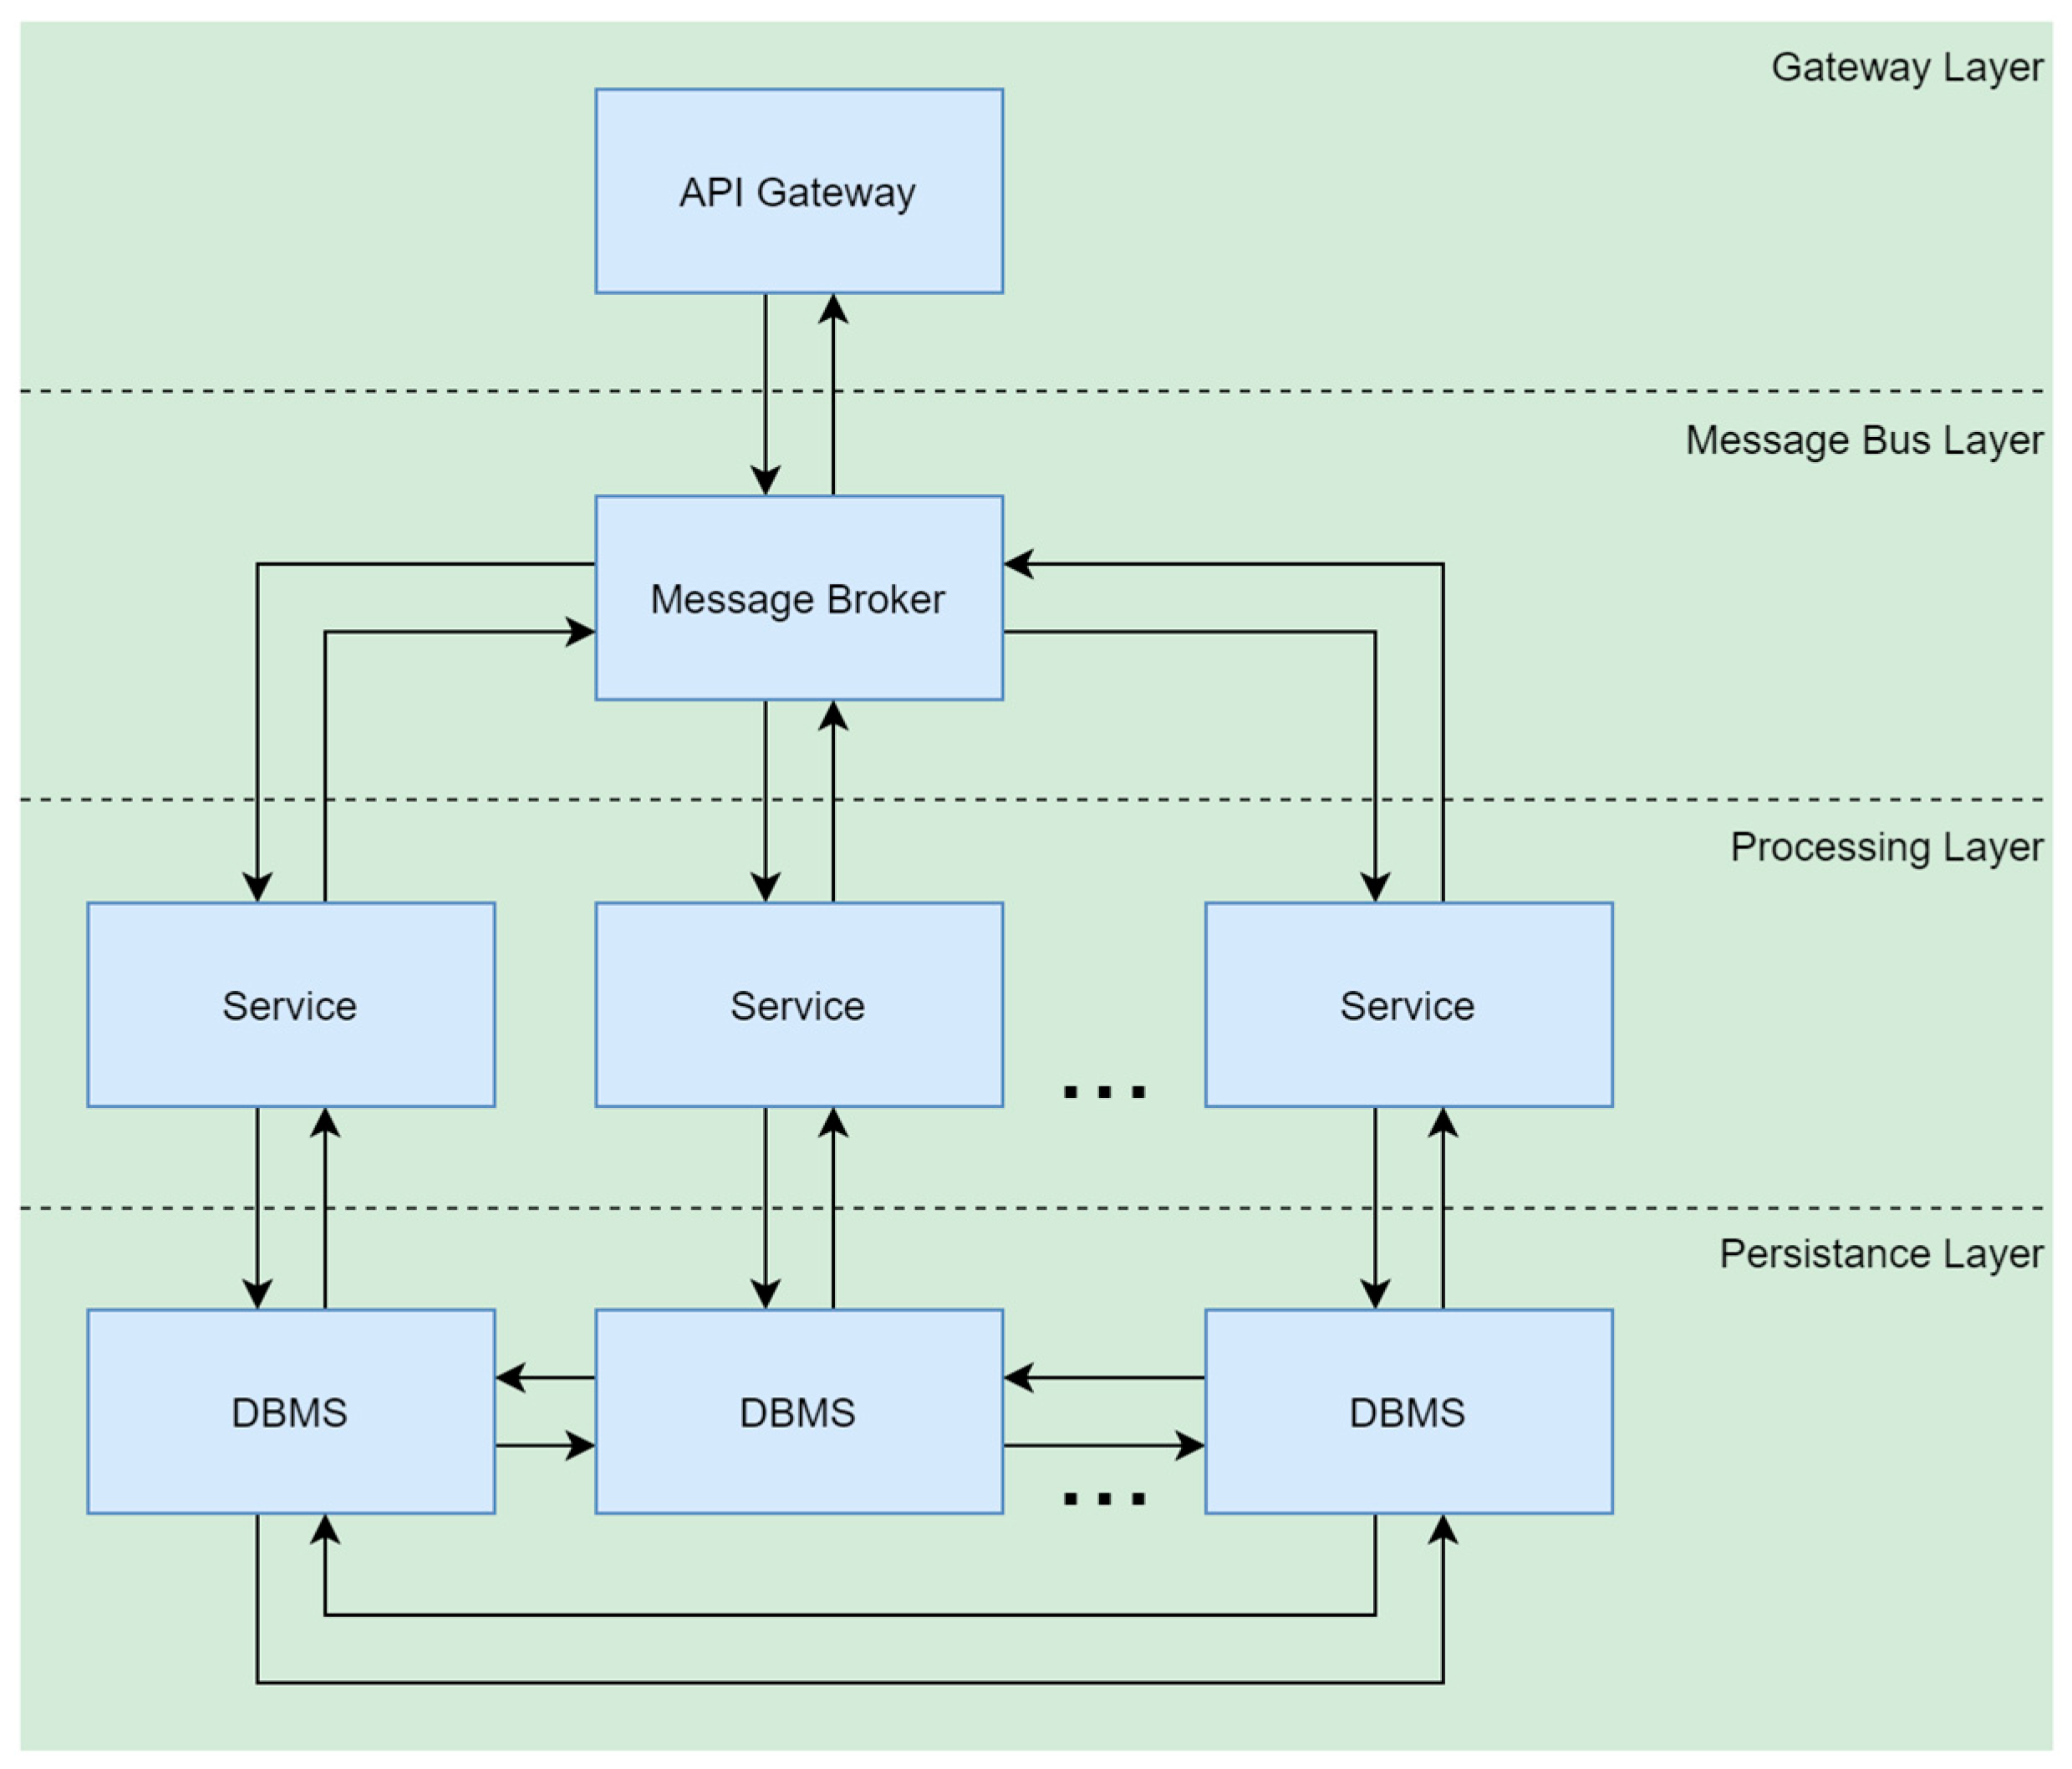
3.1. Networked Interconnected System Model

Specific implementation of the networked interconnected system consists of six services (thus, n = 6 ) deployed to virtual machines (Figure 2). The figure represents a model of a central bank digital currency software system processing fund transfers [33].
Its workflow is as follows. The representational state transfer (REST) API receives requests over the hypertext transfer protocol (HTTP), then sends them to the queue within the message broker. Processing Services receive the messages and perform the operations. The REST API waits for the result in another message queue before sending the response over the HTTP. Processing Services perform requests to the DBMS instances to update/insert corresponding entries. When the changes are completed, Processing Services send the results to the REST API over the message queue within the message broker. When the REST API receives the result, it sends the response.
To build the model, the following hardware, software and protocols were used. The experimental setup was built on top of the hardware:
  • CPU: AMD Ryzen 7 3700X 3.6 GHz;
  • RAM: 32 GB;
  • Disk: Samsung SSD QVO 2TB.
The software of the host and virtual environment was as follows:
  • Host OS: Windows 10 Pro;
  • Hypervisor: VirtualBox 6.1.30;
  • Guest OS: Ubuntu 20.04.6 LTS.
The software of the central bank digital currency system model was as follows:
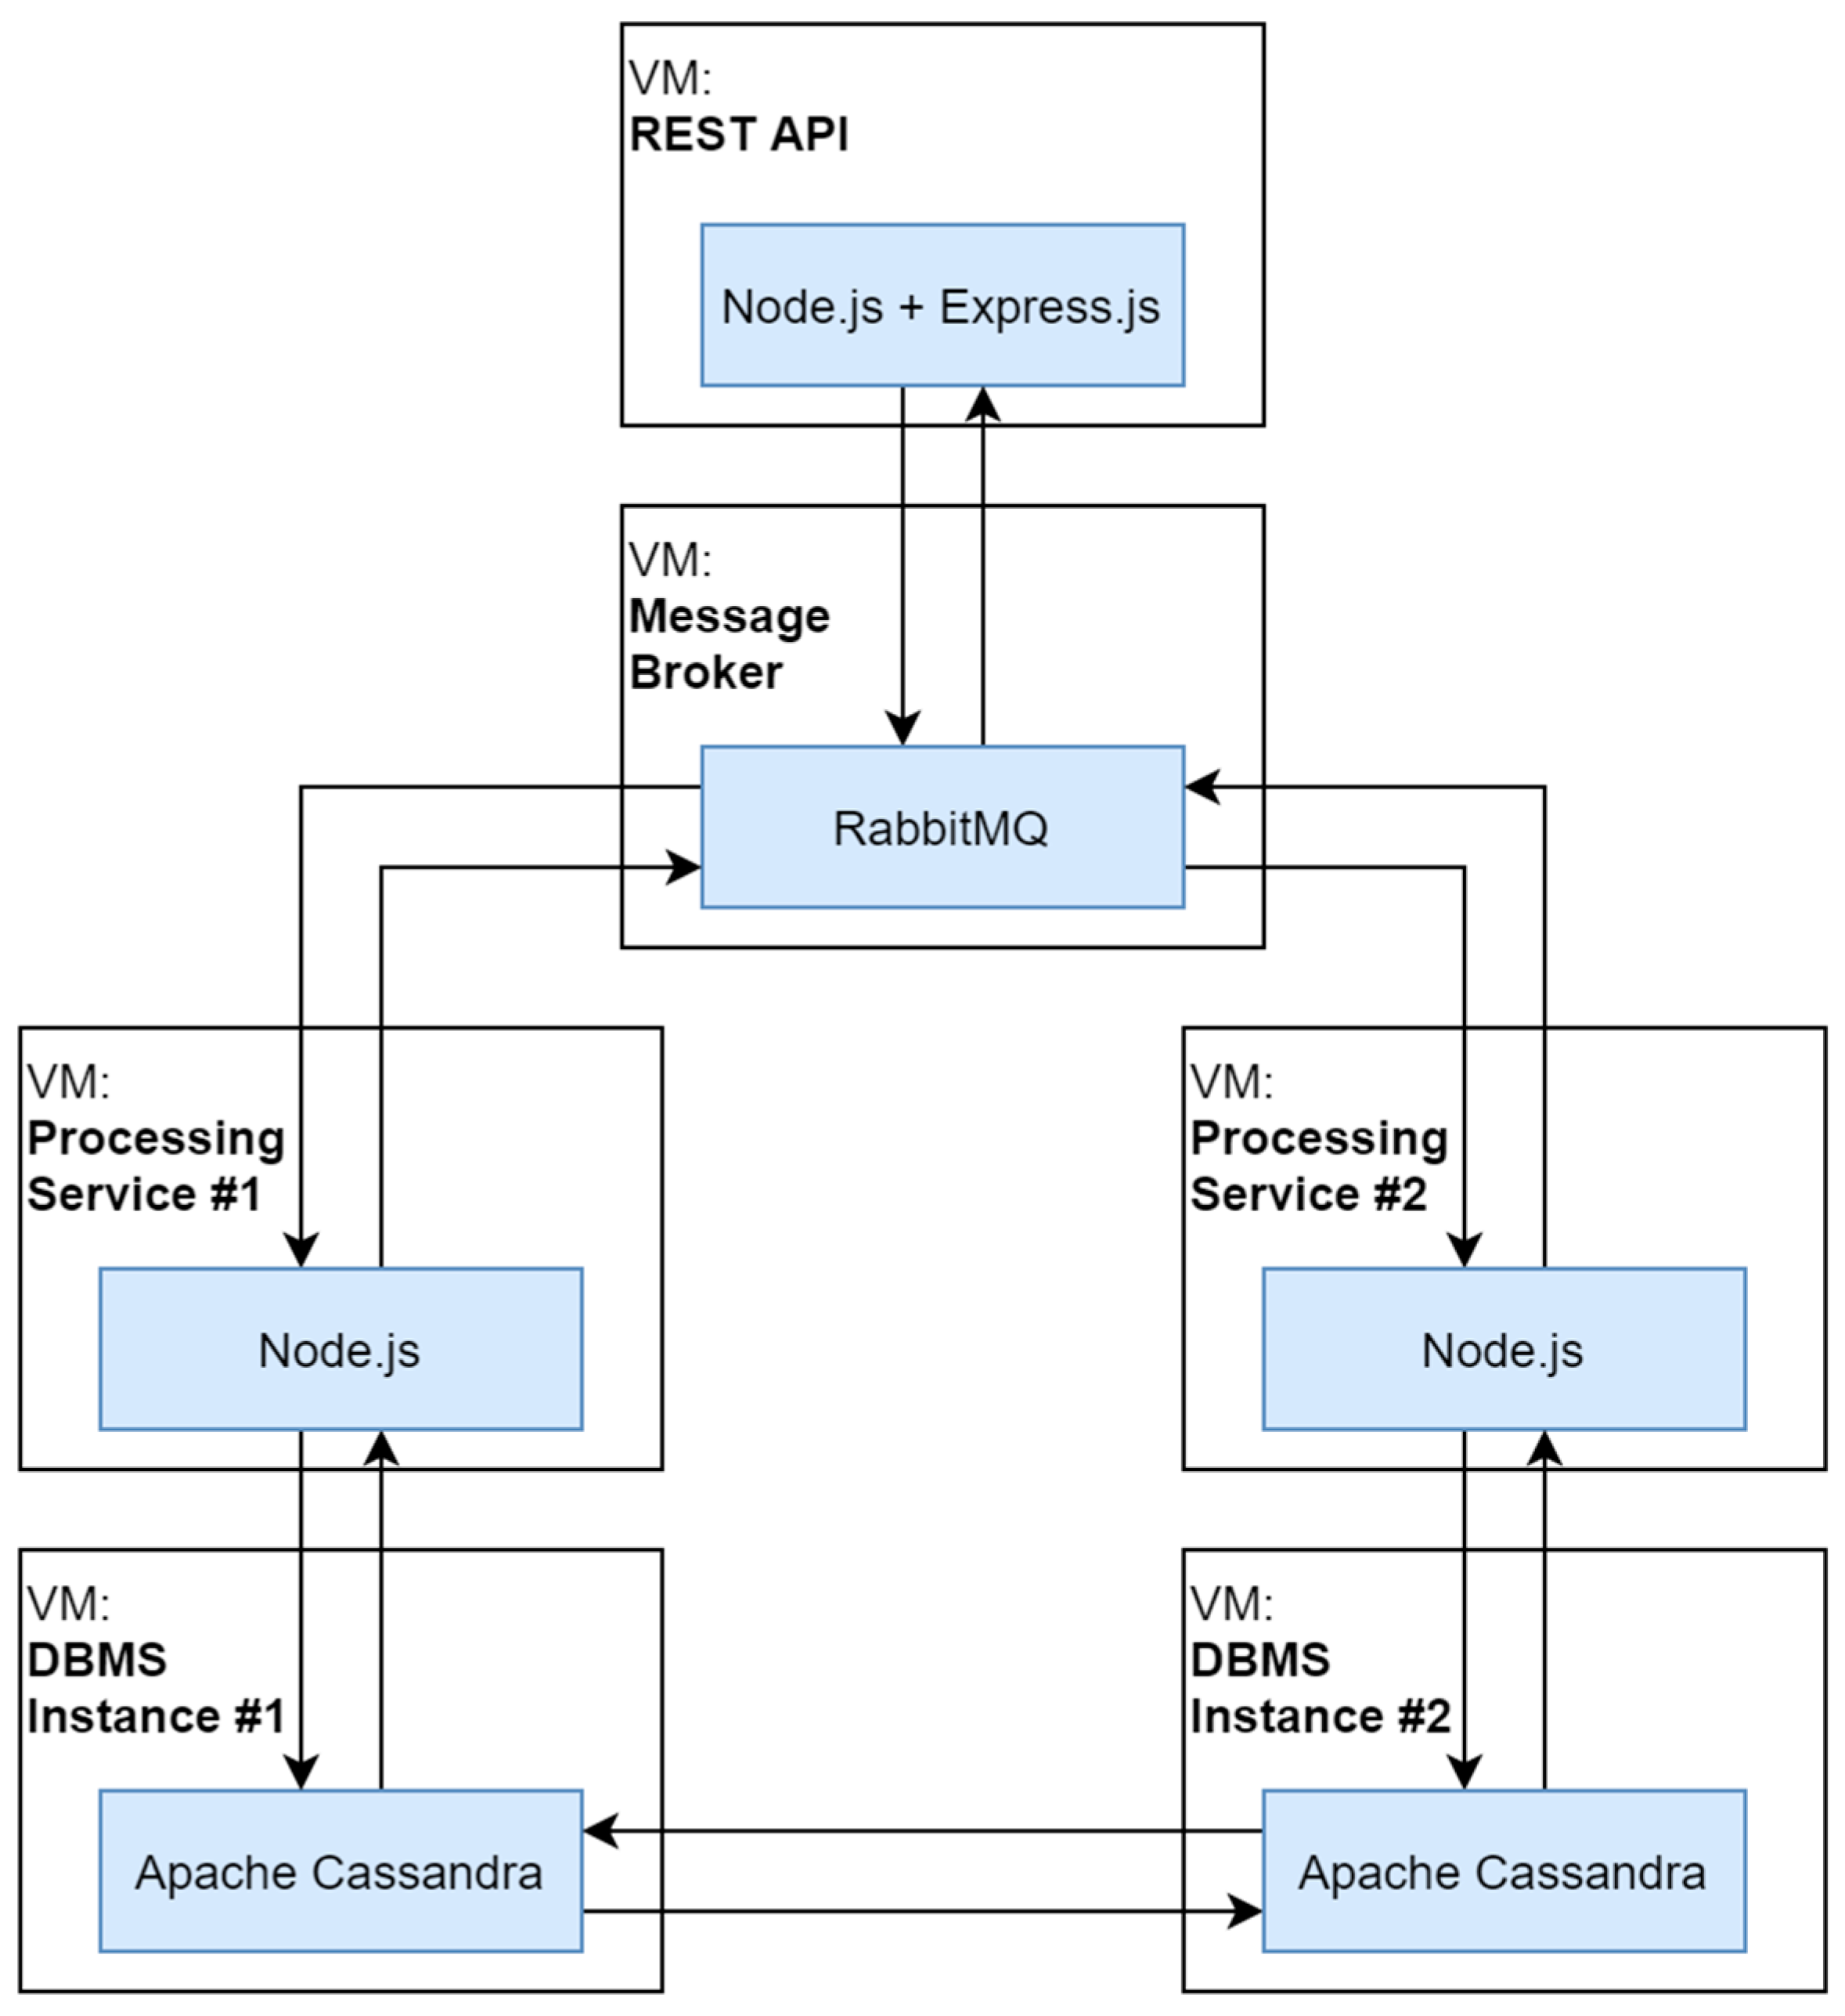
  • DBMS: Apache Cassandra v4.1.3;
  • Message Broker: RabbitMQ v3.8.2;
  • Processing Service and REST API: Node.js v18.17.1;
  • REST API framework: Express.js v4.18.2.
The advanced message queuing protocol (AMQP) 0-9-1 protocol was configured to implement the message queue with Push API communication. The consistency level used for the queries sent to Apache Cassandra was the default (consistency level One, meaning that at least one node must reply to the query). The keyspace within Apache Cassandra was configured with replication factor 2, meaning that each entry was replicated in both DBMS nodes.
For load generation, Locust v2.21.0 was used. It was also deployed in a separate virtual machine.

3.2. Resource Allocation Model and Procedure

Let n virtual environments be given in accordance with Figure 1. Given workload of x req/s, the number of utilized CPU resources will be functionally dependent on x :
y i = f i ( x ) ,   i = 1 , n ¯ ,
where f i ( x ) are smooth, monotonically increasing independent functions, which can be identified based on experimental results, and n is the number of virtual environments.
Let K be the total volume of CPU resources.
Given the condition (1), the objective is to find a constraint k i for each y i , such that
y i k i ,    i = 1 , n ¯ ,    i = 1 n k i = K ,
J = K i = 1 n y i 0 .
In other words, it is necessary to redistribute CPU resources between the networked interconnected system services in such a way that the volume of wasted resources is minimal, provided that it is possible to determine (for example, on the basis of experiments) the dependence of CPU resource utilization of the number of processed requests.
A procedure for solving problem (1)–(3) is developed. It consists of the following steps.
  • Implementation of the experimental setup. The setup represents the target networked interconnected system and its components’ virtual environments given the total volume of CPU resources is K .
  • Preparation of the experimental study algorithm. The algorithm defines the load testing process and target workload corresponding to real requests to the networked interconnected system.
  • Performing a series of load tests. These tests imply increasing workload up to the throughput limit under conditions of K partitioning into k i   ( i = 1 , n ¯ ) .
  • Processing of experimental data. Data obtained from the load tests undergo preprocessing and then used for identification of models (1).
  • Search for an efficient solution to problem (1)–(3). The search is performed under the conditions of the found dependencies f i ( x ) .
  • Experimental verification of the theoretical solution. A series of load tests are carried out with the obtained resource partitioning, and the experimental value of the objective function (3) is calculated.

4. Experiment and Results

4.1. Implementation of the Experimental Setup

The experimental setup was implemented in accordance with the scheme shown in Figure 2. The total volume of allocated CPU resources was set as K = 800, meaning 8 CPU cores with 100 clock ticks per second for each. Virtual environments were implemented using virtual machines to ensure correct resource allocation.
To identify the models (1), experimental studies were conducted with an arbitrary distribution of resources between the six subsystems k i . The virtual machines were allocated the resources shown in Table 1. The virtual machines had no limitations on CPU time, but only on the number of cores. Each system layer was provisioned with 2 cores. The load generator was provided with more CPU resources to ensure that it was not limiting the throughput.

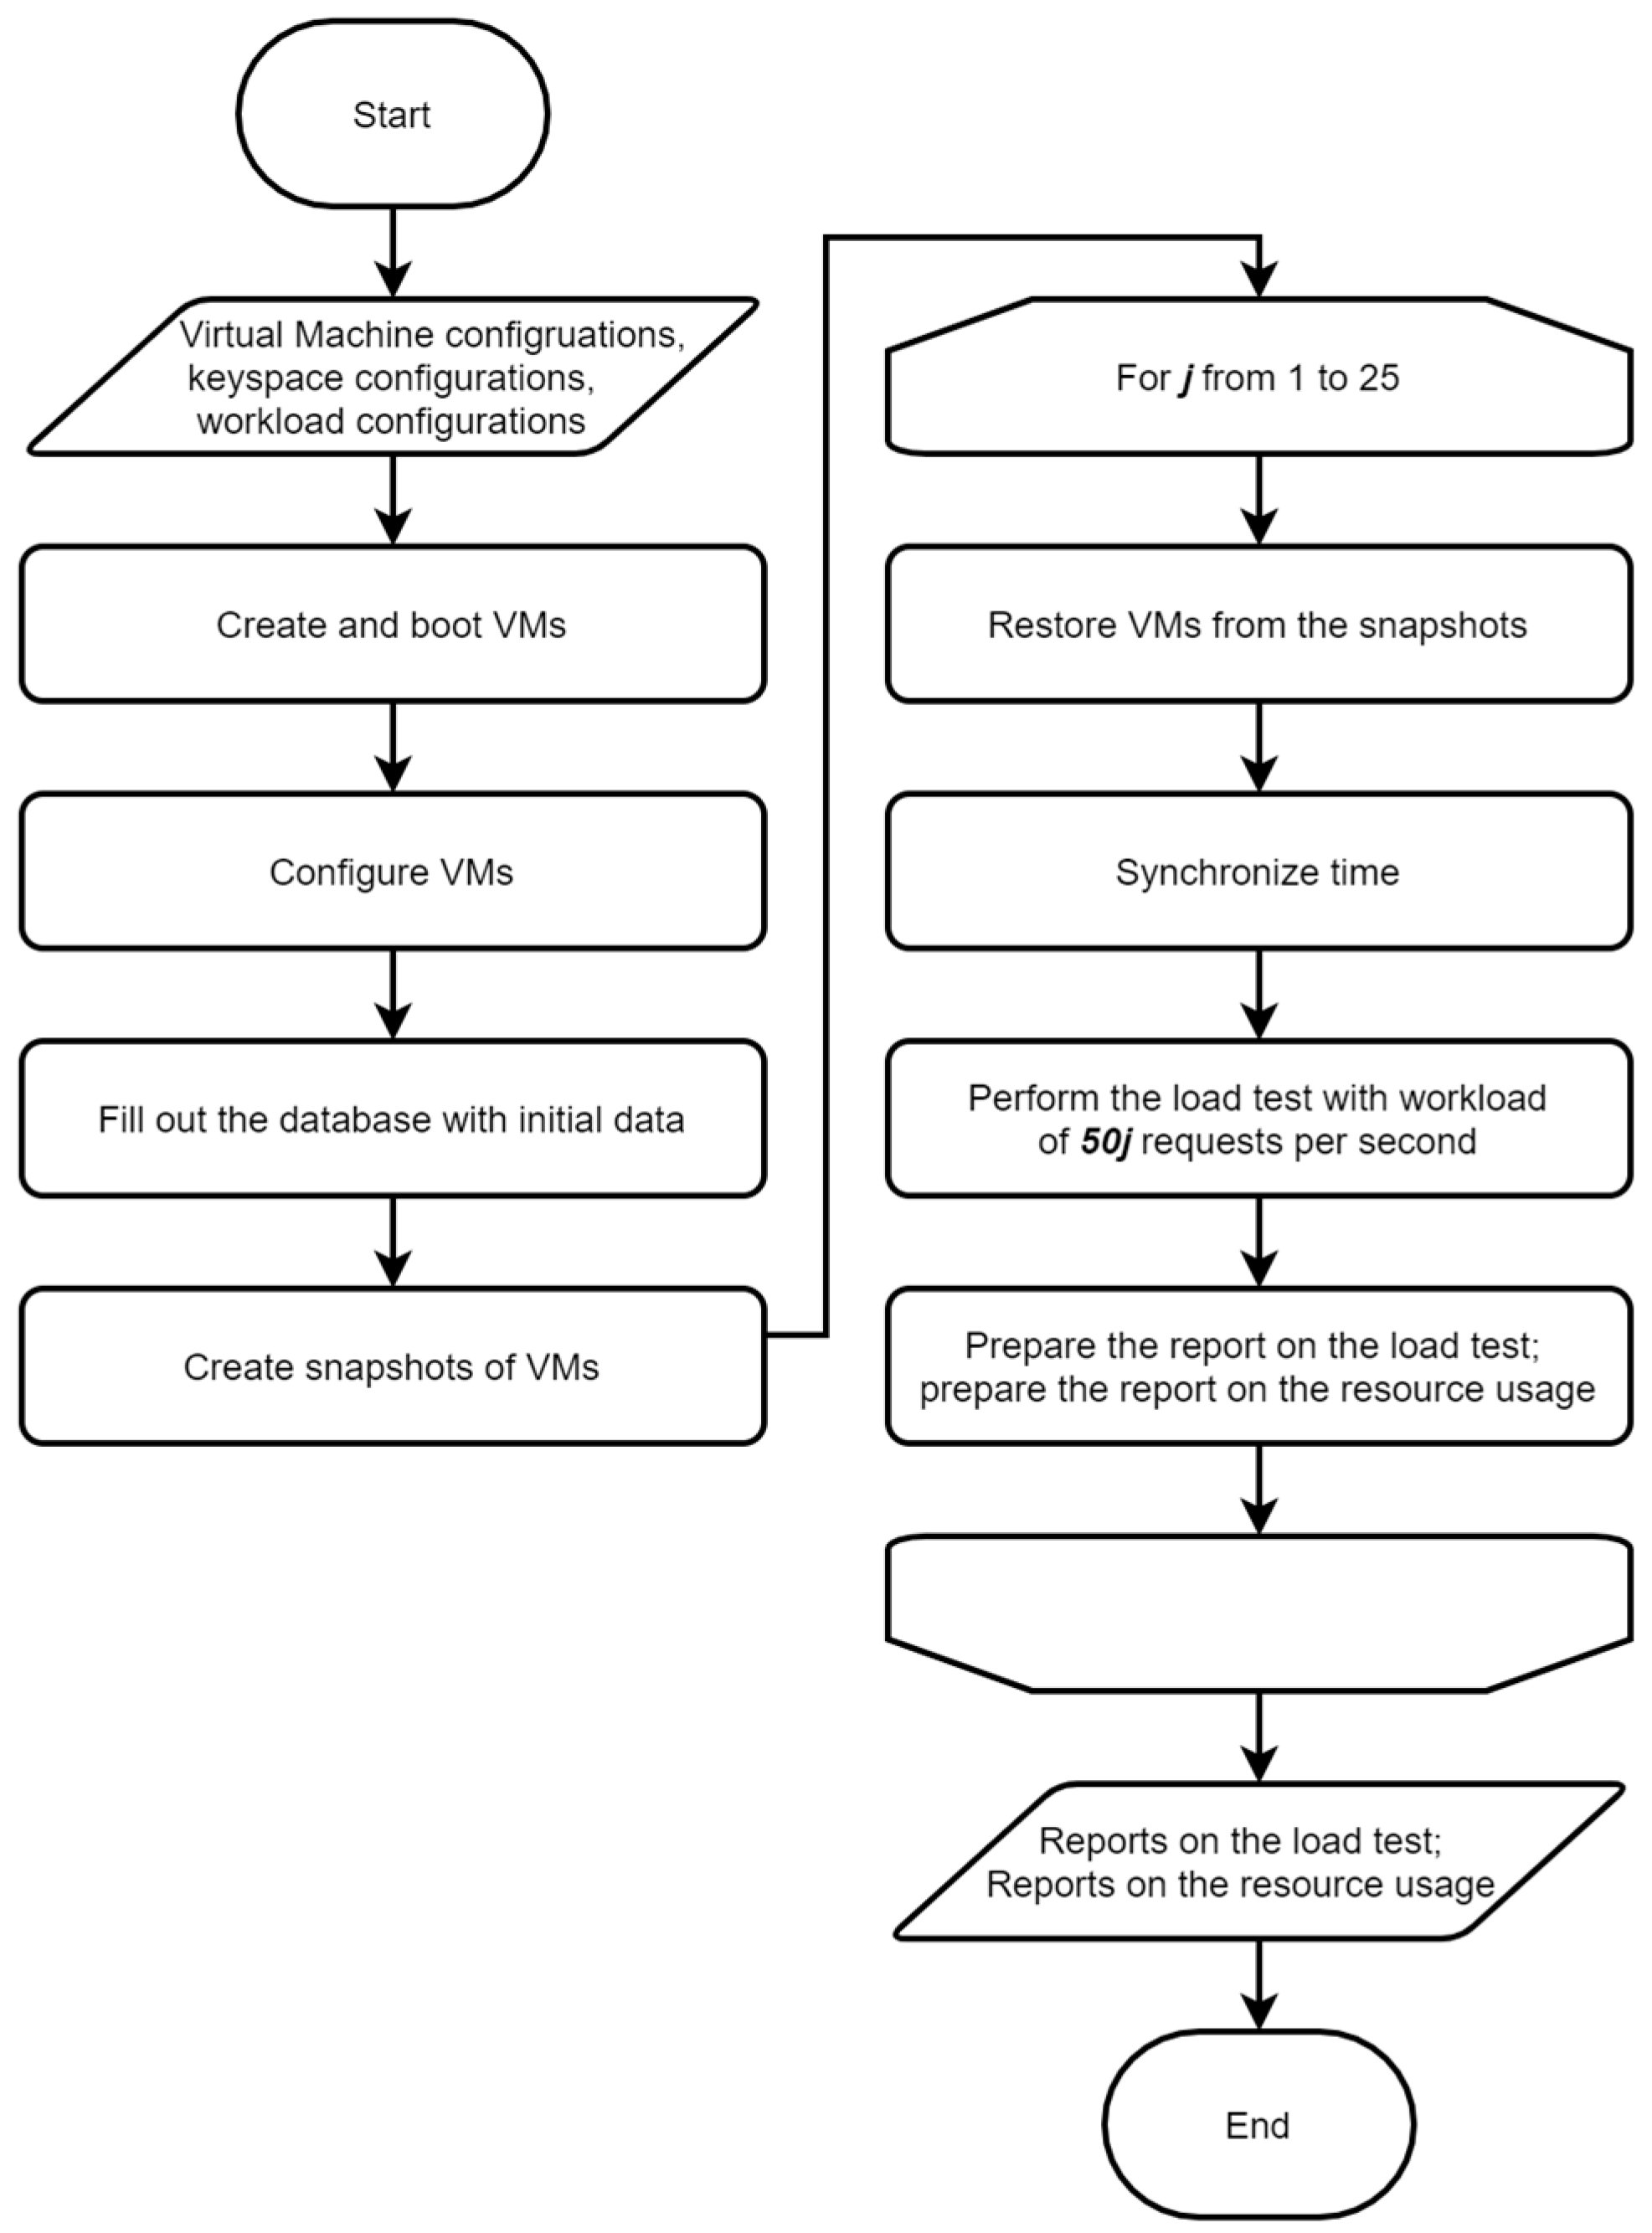
4.2. Preparation of the Experimental Study Algorithm

Load tests, collection and processing of experimental data were performed using an algorithm presented in Figure 3. The used VM configurations, Apache Cassandra keyspace settings and workload configurations were identical across all load tests.
The initialization stage involved creating virtual machines and configuring them, including installation and configuration of the appropriate software. The database was then filled with 1 million user records and 1 million account records. Once filled, snapshots of the virtual machines were created, storing the experimental setup in state ready for load testing.

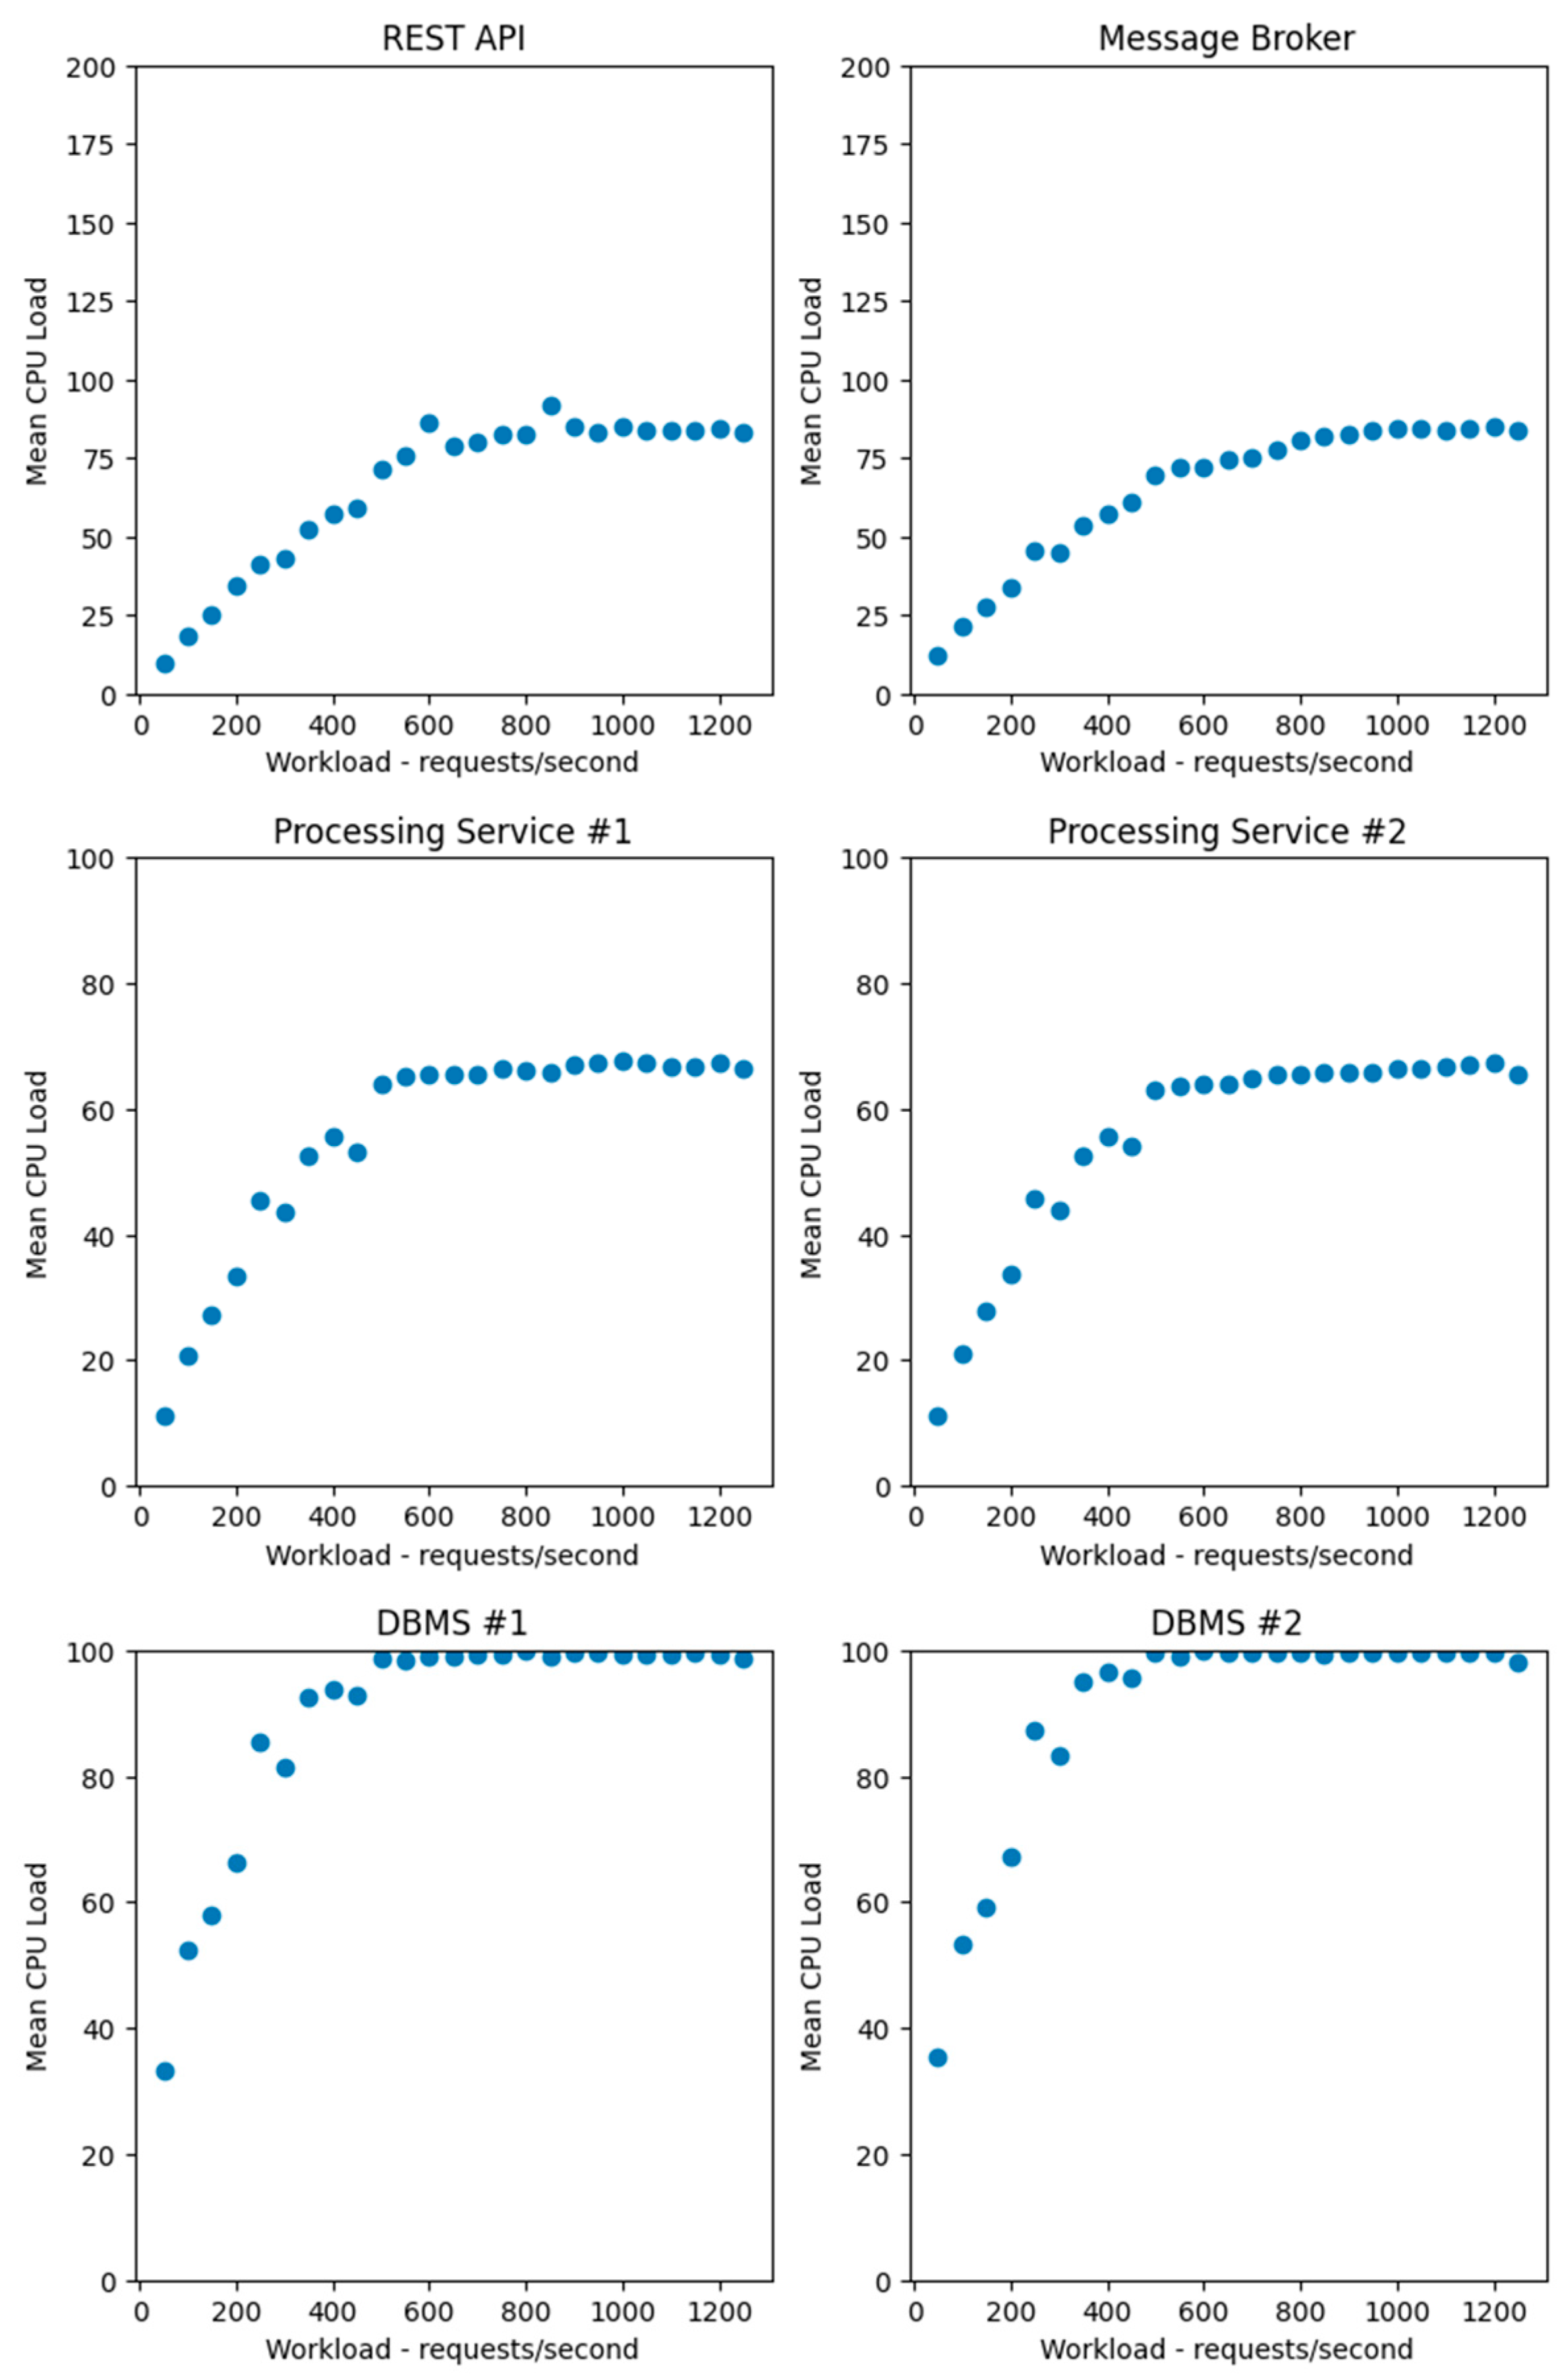
4.3. Performing a Series of Load Tests

A series of 25 load tests were conducted. For each test, virtual machines were restored from the snapshot; afterwards, time synchronization and target load generation l j were performed, where j = 1 , 25 ¯ .
In each load test, Locust virtual users were configured to execute a load limited to 2.5 requests per second. The number of virtual users at each load test was equal to 20 j , and the increase in the number of users per second until the specified target workload level was reached was equal to 2 j . Thus, load tests with target load l j = 50 j were performed, meaning the load was increasing by 50 requests per second at each step.

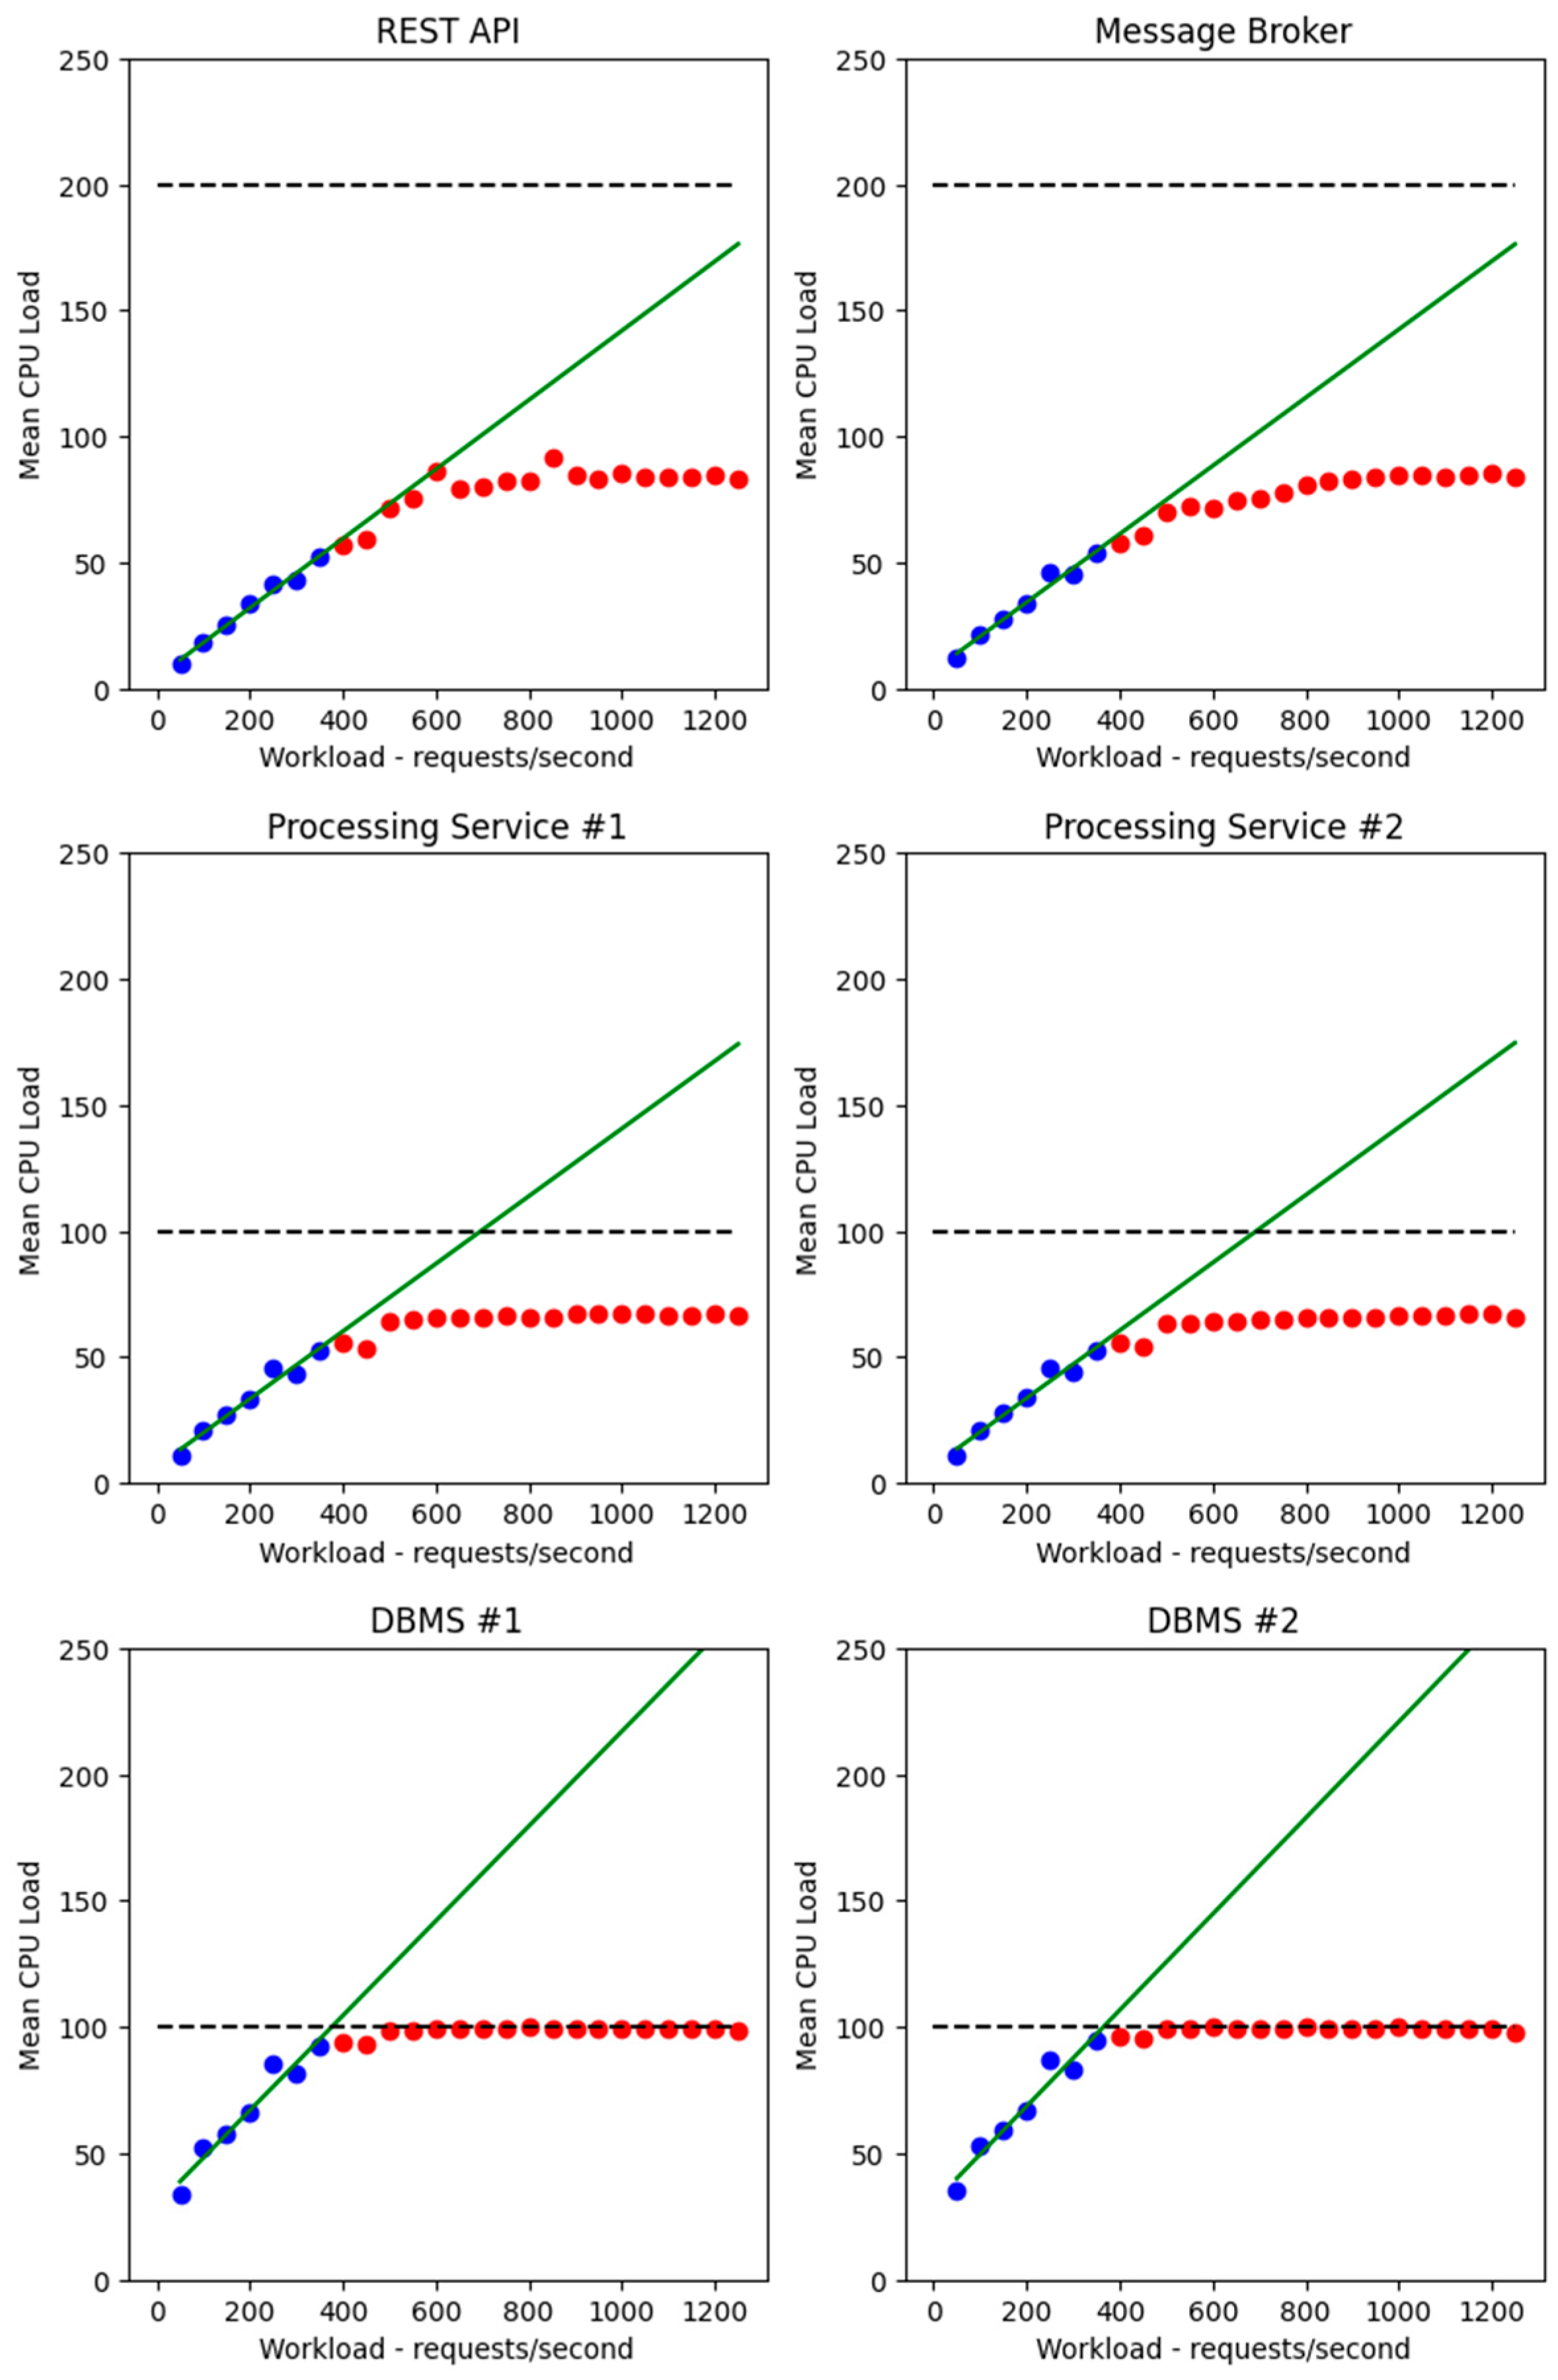
4.4. Processing of Experimental Data

At the end of each load test, a Locust report was generated, and individual reports on CPU resource usage for each virtual machine were exported. For each load test, a report was generated for each virtual machine containing the level of CPU resource utilization for each second of the experiment.
The following steps were performed when processing the computing resource usage report data:
  • The missing values were replaced with the values for the previous second.
  • A 600 s time frame was detected during which the load was applied, and the remaining measurements were discarded.
  • Outliers (negative values and values exceeding the allocated CPU time multiplied by the number of cores) were replaced with values corresponding to the boundaries.
  • The mean value was calculated for the CPU usage data.
The extracted mean value data for each virtual machine were combined with the load test report for subsequent analysis.
Table 2 shows how the actual throughput changes as the load increases. From a given load level of 800 requests per second, there is stagnation in terms of the number of requests processed. As can be seen from Table 2, the maximum number of processed requests does not exceed 781.5163 requests per second. As the load increases, the average response time also increases, which is consistent with the settings of Locust virtual users.
A plot of the average CPU resource usage (Figure 4) against the target load shows that virtual machines of the Apache Cassandra are using all of their allocated resources. Starting at 400 requests per second, about 100% of the CPU time is used by DBMS #1 and DBMS #2 services.
In this experiment, conducted to identify the model, a feature of the problem under consideration is well highlighted. The services DBMS #1 and DBMS #2 utilize the maximum of the allocated resources at the point corresponding to a load of about 400 requests per second. At the same load, the remaining interconnected components reach the maximum value of CPU resource utilization, while keeping some of the resources wasted. Thus, for example, increasing resources for the message broker will not affect overall performance in any way, since the bottleneck here is the resources allocated to the DBMS subsystems. The obtained data confirm the correctness of the problem (1)–(3).
Considering the nature of the obtained data, the functions in (1) can be taken in linear form, and the data up to their limit values (up to the flat sections of the corresponding plots) are used for identification. Linear models were built (Figure 5) using data on the CPU resource utilization up to the determined workload level of 400 requests per second. The blue dots indicate measurements obtained before one of the virtual machines started using all the allocated CPU resources, while the red dots indicate measurements obtained after full CPU utilization was reached. The green line shows the linear models, and the dotted line shows the volume of CPU resources allocated.
Let us define the consumed CPU resources of each subsystem: y 1 —REST API, y 2 —Message Broker, y 3 —Processing Service #1, y 4 —Processing Service #2, y 5 —DBMS #1, y 6 —DBMS #2; x —the number of requests per second, i.e., the workload.
Then, the system of Equation (1) with parameters identified on the basis of the experiment will be as follows:
y 1 = 0.1376 x + 4.4307 , y 2 = 0.1354 x + 7.1164 , y 3 = 0.1342 x + 6.6008 , y 4 = 0.1343 x + 6.8784 , y 5 = 0.1877 x + 29.4992 , y 6 = 0.1902 x + 30.6113 .
For each of the models (4), a coefficient of determination r i was obtained using R 2 method and data from Table 2 for a workload up to 350 requests/second:
r 1 = 0.9845 ;
r 2 = 0.9741 ;
r 3 = 0.9637 ;
r 4 = 0.9649 ;
r 5 = 0.9407 ;
r 6 = 0.9458 .
The obtained scores mean that linear models are fit for the data.

4.5. Search for an Efficient Solution

Given the found models (4), it is necessary to solve the problems (1)–(3), i.e., it is necessary to find constraints k i for each y i under conditions (4) such that
y i k i ,    i = 1 , 6 ¯ ,    i = 1 6 k i = 800 ; J = 800 i = 1 6 y i 0 .
The solution to this problem is obvious. Given the equation J = 0 and by substituting the equations from system (4), the critical value x c = 777.5898 can be found.
By substituting the value to (4) and by setting k i = y i , efficient resource allocation can be found:
k 1 = 111.4128 ;
k 2 = 112.3664 ;
k 3 = 110.9337 ;
k 4 = 111.3365 ;
k 5 = 175.4164 ;
k 6 = 178.5341 .
Thus, the theoretical solution is found.

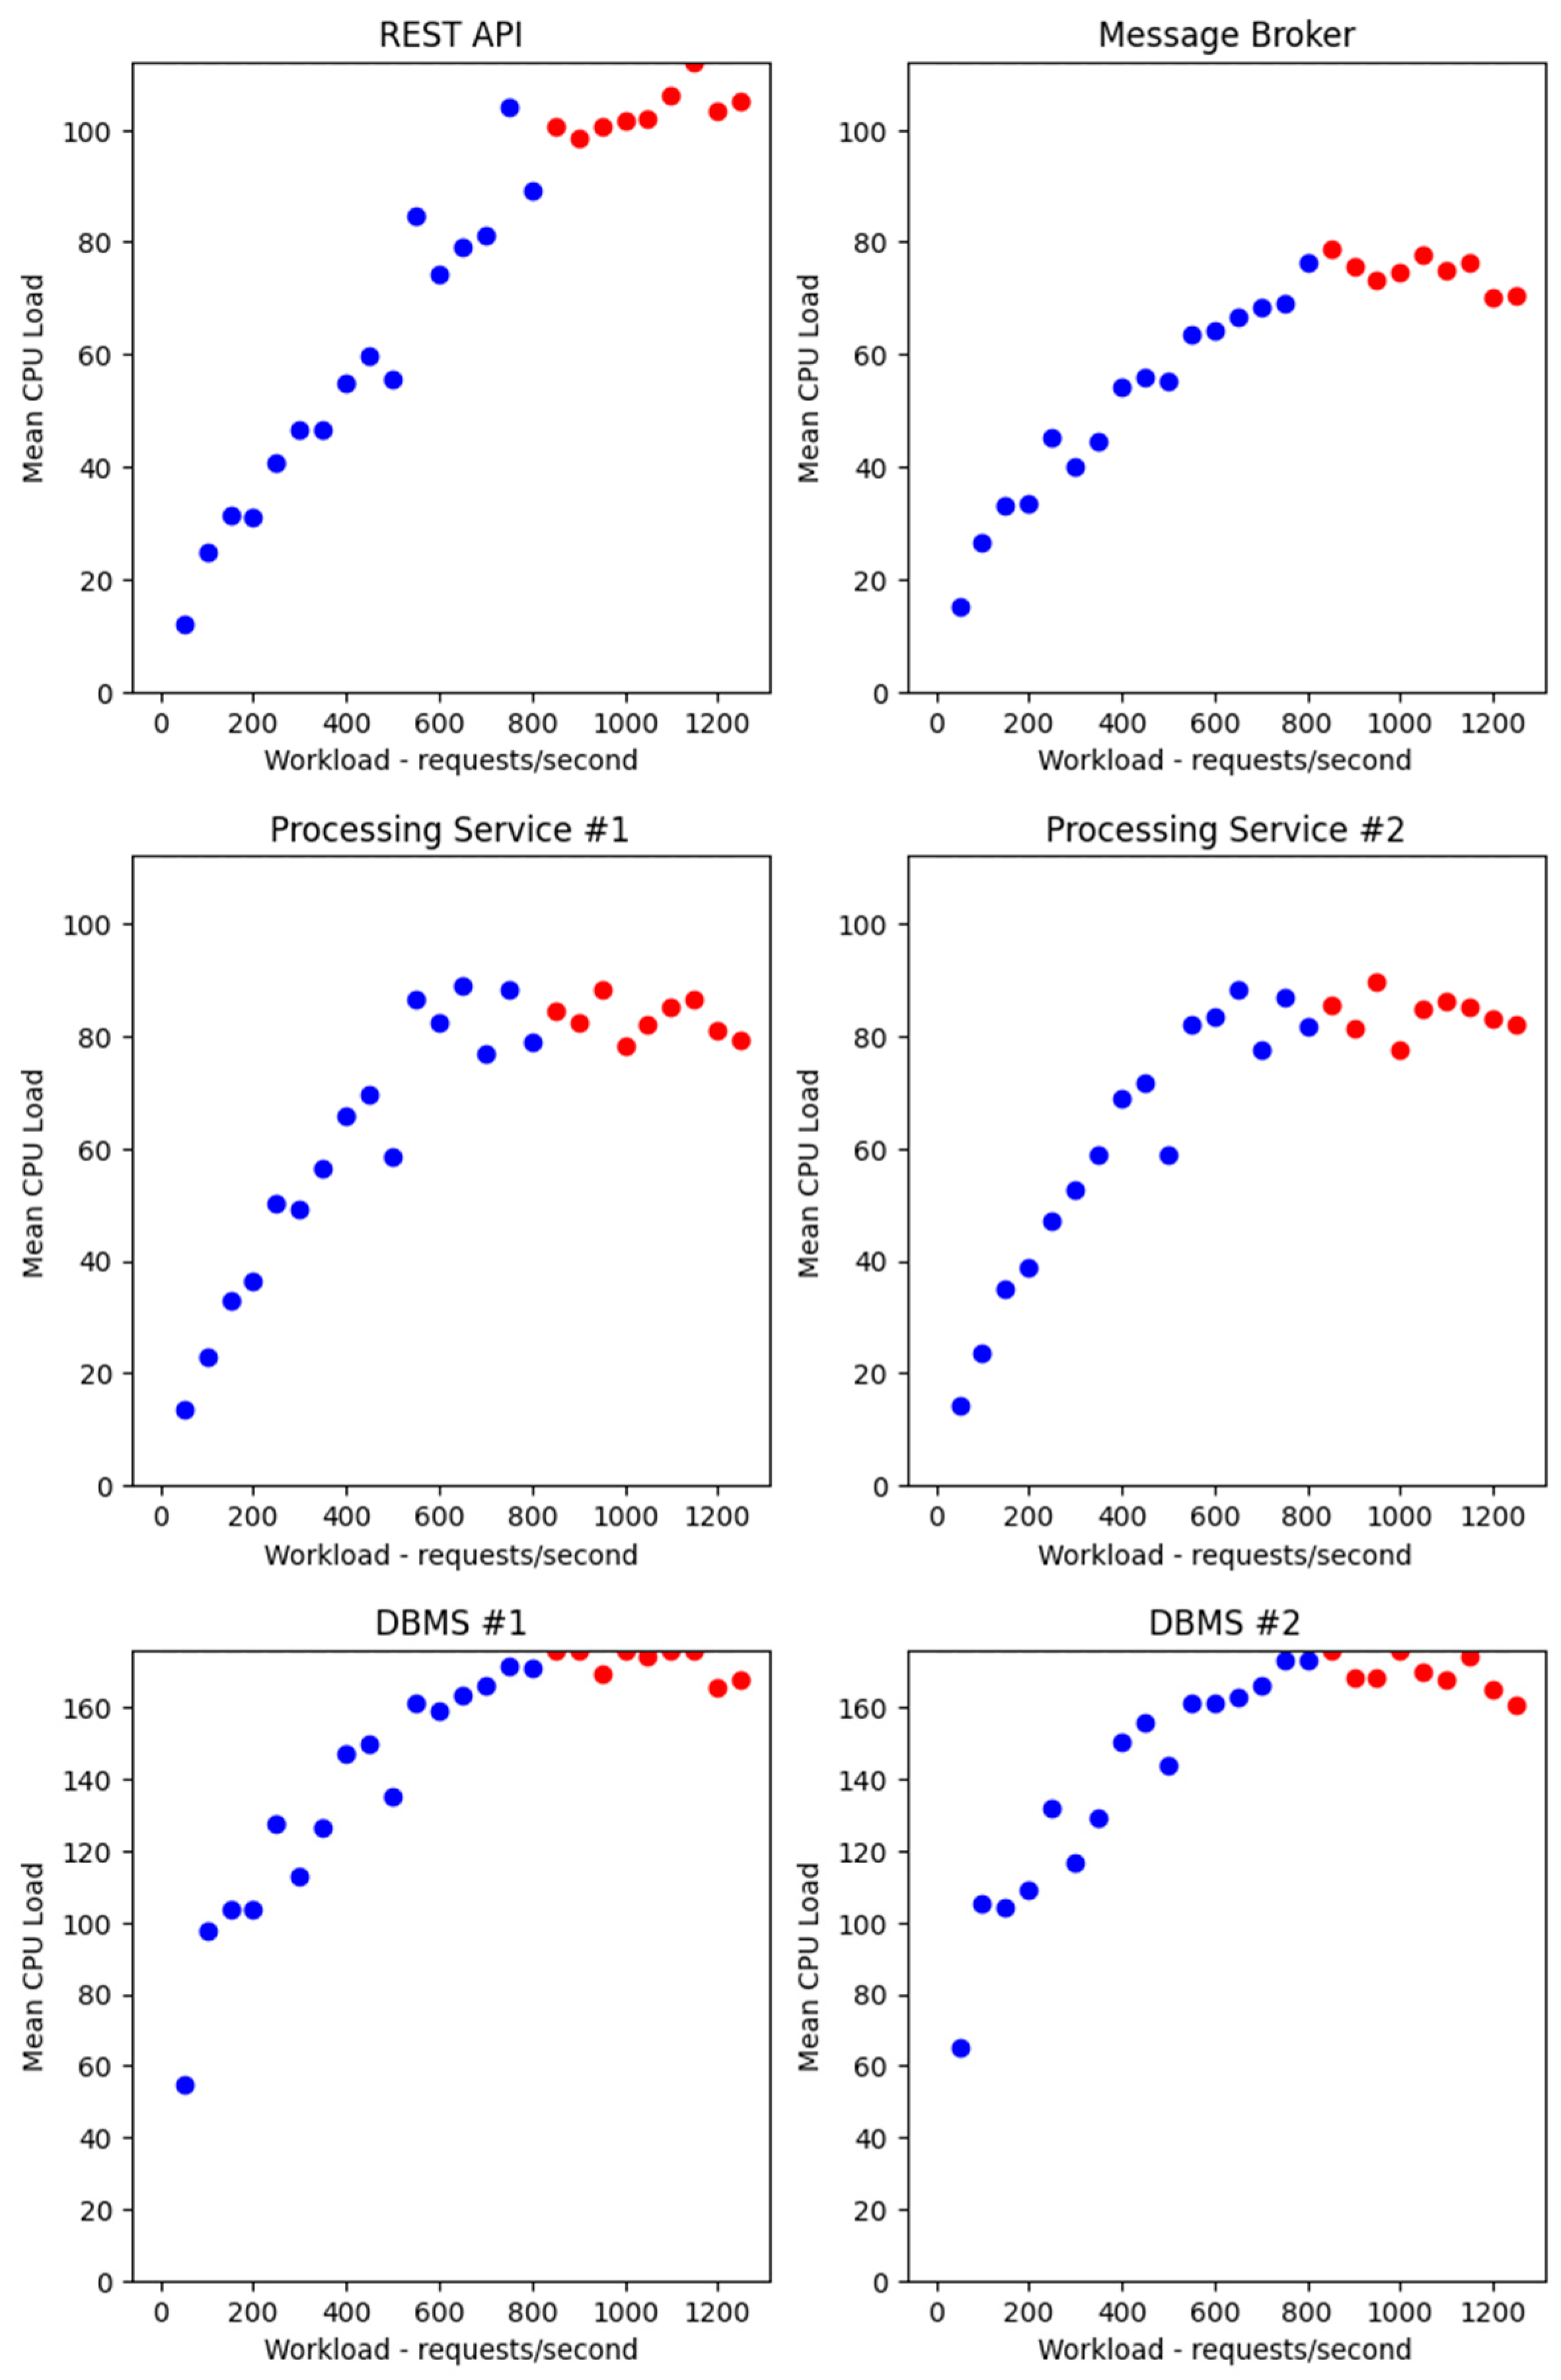
4.6. Experimental Verification of the Theoretical Solution

To assess the reliability, let us compare the theoretical result with the experimental values.
In accordance with the obtained estimates, the CPU resources were reallocated (Table 3). The virtual machines were assigned CPU cores and core time limits consistent with model-based estimates.
In case of exceeding the level of one core and 100 CPU clock ticks, VMs were assigned two cores, for which the CPU time limit was set. The values were also adjusted based on the requirements of the integer data type. Parameter values that differ from Table 2 are highlighted in bold in Table 3.
A series of load tests were performed on the experimental setup with reallocated CPU resources. Table 4 shows the actual performance level as the load increases. A noticeable stagnation in the number of processed requests is observed after a load of 1100 requests per second.
Table 4 shows that the maximum number of requests processed by the model of the central bank digital currency software system reaches 954.2838 requests per second. As the load increases, as in the first experiment, the average response time increases. However, under high load conditions, it is lower than it was with arbitrary resource distribution.
Based on the average CPU resource usage data (Figure 6), we can see a reduction in the volume of wasted resources. Both virtual machines of the DBMS services reach the utilization of all allocated CPU resources, but only starting from a load level of 850 requests per second. The values in Figure 6 that exceed the specified limits on allocated resources are reduced to the specified boundary.
Comparing the results of load tests, it can be noted that an increase in the number of processed requests by 20.75% was achieved given the load of 1250 requests per second. At the same time, the average request processing time with the same load was reduced by 21.05%, and the volume of wasted resources was reduced by 55.59%.
The continued performance gains observed when full utilization of processor resources is achieved may be related to the characteristics of the CPU used in the host machine.
For some of the experiments, an excess of the average CPU resources utilization beyond the established limits was observed. It may be associated with the hypervisor specifics or with inaccuracies in the operation of the monitoring system that collects data on the computing resources utilization.

5. Discussion

Precise allocation of computing resources to subsystems of networked interconnected systems is of great importance, as it leads to efficient use of the resources. This is achieved by reducing overprovisioning and underprovisioning of resources to the services.
In the case of elastic infrastructures, the allocation of resources proportionate to consumption is in most cases performed on the side of the infrastructure provider, but for inelastic infrastructures, the determination of the correct volume of resources is usually performed by the consumer arbitrarily, with the involvement of expert assessments. As noted, expert assessments are rarely accurate in determining the volume of resources to be allocated.
This article presents models and a procedure that allow for determining the volume of resources required by networked interconnected system services, taking into account a fixed volume of available resources. Redistribution of resources performed on the basis of the presented approach increased the system throughput and reduced resource wastage. Thus, the problem of right-sizing the resources of virtual environments of services based on virtual machines for a networked interconnected system with a fixed volume of computing resources was considered. To achieve the better throughput of networked interconnected system by reallocation of CPU time, the virtual machines were reconfigured and scaled vertically.
The result obtained during the redistribution of resources was achieved using vertical scaling. The proposed approach can be extended to tasks in which horizontal scaling is available. For example, instead of changing the number of CPU cores allocated to a specific virtual environment, it is possible to change the number of virtual environments with horizontally scalable subsystems of a networked interconnected system.
This paper considers networked interconnected systems in which computations are performed on request from external systems and users. Such systems can have different architectures, ranging from monolithic to microservice with different data exchange protocols and different connections between subsystems. Although, systems in which deferred tasks are present, as well as tasks executed on schedule, may have features that go beyond the presented approach to resource redistribution. Their consideration may be the subject of separate studies. In this paper, the use of resources under given averaged load conditions was studied, so systems with several different load patterns should also be considered separately.
This paper shows a solution in which linear dependencies of resource usage on the number of incoming requests are observed. It is assumed that this is a common case. For other cases, other models can be used instead of linear ones, while the proposed procedure will remain the same.
Automation of the proposed solution is possible. For this purpose, a combination of several aspects can be considered: collection of statistical data on user requests to the system, formation of a networked interconnected system digital twin, automated load testing with a pattern formed on the basis of the request statistics, updating the configuration of the networked interconnected system infrastructure using infrastructure-as-code tools.
The proposed solution can reduce resource wastage for networked interconnected systems deployed in inelastic infrastructures. Also, it is possible to obtain estimates of the computing resources required by services under a given load using the obtained models, for example, if the number of incoming requests increases.

6. Conclusions

This paper discussed efficient computing resource allocation for networked interconnected systems, given a fixed resource pool.
The problem of minimizing free resources under conditions of unknown ratios of the use of allocated resources between services was formalized. The proposed approach for determining the regression dependencies of the consumed resources of each interconnected service on the number of requests allows for the identification of bottlenecks in the system and relationships between the resource usage of other services on the resource usage of the service with the bottleneck, which consumes all the resources allocated to it. The proposed procedure allows for the efficient redistribution of resources in interconnected systems in such a way that all available resources are used to the maximum extent.
For the experiment’s purposes, a model of central bank digital currency software system was used as an example of a networked interconnected system. A scalable experimental setup was developed, which allows one to consider various number of virtual machines, networked interconnected system components, and allocated resources. The proposed procedure of resource reallocation based on load testing on the scalable experimental setup and discussed models made it possible to increase the number of processed requests per second by 20.75% for the given networked interconnected system.
Future research can follow several directions. Systems containing scheduled, asynchronous and deferred calculations require additional studies as they were out of the scope of the present research. Horizontal scaling can be seen as an alternative approach to vertical scaling of virtual environments and should be studied, as the scaling may not be linear for that case, and thus, additional considerations are required.

Author Contributions

Conceptualization, A.A. and E.N.; methodology, A.A., D.I. and E.N.; software, D.I.; validation, A.A.; formal analysis, A.A., E.N. and D.I.; resources, A.A. and D.I.; data curation, A.A.; writing—original draft preparation, A.A. and D.I.; writing—review and editing, E.N.; visualization, D.I.; supervision, A.A.; project administration, AA. All authors have read and agreed to the published version of the manuscript.

Funding

This research received no external funding.

Data Availability Statement

Data may be available upon request.

Conflicts of Interest

The authors declare no conflicts of interest.

References

  1. Ullah, A.; Nawi, N.M.; Ouhame, S. Recent advancement in VM task allocation system for cloud computing: Review from 2015 to 2021. Artif. Intell. Rev. 2022, 55, 2529–2573. [Google Scholar] [CrossRef] [PubMed]
  2. Rawat, P.S.; Dimri, P.; Saroha, G.P. Virtual machine allocation to the task using an optimization method in cloud computing environment. Int. J. Inf. Technol. 2020, 12, 485–493. [Google Scholar] [CrossRef]
  3. Talebian, H.; Gani, A.; Sookhak, M.; Abdelatif, A.A.; Yousafzai, A.; Vasilakos, A.V.; Yu, F.R. Optimizing virtual machine placement in IaaS data centers: Taxonomy, review and open issues. Clust. Comput. 2020, 23, 837–878. [Google Scholar] [CrossRef]
  4. Baarzi, A.F.; Kesidis, G. Showar: Right-sizing and efficient scheduling of microservices. In Proceedings of the ACM Symposium on Cloud Computing, Seattle, WA, USA, 1–4 November 2021; pp. 427–441. [Google Scholar]
  5. Agarwal, P.; Lakshmi, J. Cost aware resource sizing and scaling of microservices. In Proceedings of the 2019 4th International Conference on Cloud Computing and Internet of Things, Changchun, China, 6–7 December 2019. [Google Scholar]
  6. Rattihalli, G. Exploring potential for resource request right-sizing via estimation and container migration in Apache Mesos. In Proceedings of the 2018 IEEE/ACM International Conference on Utility and Cloud Computing Companion (UCC Companion), Zurich, Switzerland, 17–20 December 2018; pp. 59–64. [Google Scholar]
  7. Sinha, P.; Kaffes, K.; Yadwadkar, N.J. Online Learning for Right-Sizing Serverless Function Invocations. In Architecture and System Support for Transformer Models (ASSYST @ISCA). 2023. Available online: https://openreview.net/forum?id=4zdPNY3SDQk (accessed on 9 October 2024).
  8. Eismann, S.; Bui, L.; Grohmann, J.; Abad, C.L.; Herbst, N.R.; Kounev, S. Sizeless: Predicting the optimal size of serverless functions. In Proceedings of the 22nd International Middleware Conference, Québec City, QC, Canada, 6–10 December 2021; pp. 248–259. [Google Scholar]
  9. Schuler, L.; Jamil, S.; Kühl, N. AI-based resource allocation: Reinforcement learning for adaptive auto-scaling in serverless environments. In Proceedings of the 2021 IEEE/ACM 21st International Symposium on Cluster, Cloud and Internet Computing (CCGrid), Melbourne, Australia, 10–13 May 2021; pp. 804–811. [Google Scholar]
  10. Gusev, A.; Ilin, D.; Kolyasnikov, P.; Nikulchev, E. Effective selection of software components based on experimental evaluations of quality of operation. Eng. Lett. 2020, 28, 420–427. [Google Scholar]
  11. Nikulchev, E.; Ilin, D.; Gusev, A. Technology stack selection model for software design of digital platforms. Mathematics 2021, 9, 308. [Google Scholar] [CrossRef]
  12. Abbasi, A.A.; Abbasi, A.; Shamshirband, S.; Chronopoulos, A.T.; Persico, V.; Pescapè, A. Software-defined cloud computing: A systematic review on latest trends and developments. IEEE Access 2019, 7, 93294–93314. [Google Scholar] [CrossRef]
  13. Chauhan, S.S.; Pilli, E.S.; Joshi, R.C.; Singh, G.; Govil, M.C. Brokering in interconnected cloud computing environments: A survey. J. Parallel Distrib. Comput. 2019, 133, 193–209. [Google Scholar] [CrossRef]
  14. Abraham, G.; Aasheesh, K.; Samira, K.; Sihang, L.; Vidushi, D.; Sagar, K.; Jichuan, C.; Krste, A.; Parthasarathy, R. Profiling hyperscale big data processing. In Proceedings of the 50th Annual International Symposium on Computer Architecture, Orlando, FL, USA, 17–21 June 2023; pp. 1–16. [Google Scholar]
  15. Nguyen, C.N.; Lee, J.; Hwang, S.; Kim, J.S. On the role of message broker middleware for many-task computing on a big-data platform. Clust. Comput. 2019, 22, 2527–2540. [Google Scholar] [CrossRef]
  16. Blinowski, G.; Ojdowska, A.; Przybyłek, A. Monolithic vs. microservice architecture: A performance and scalability evaluation. IEEE Access 2022, 10, 20357–20374. [Google Scholar] [CrossRef]
  17. Erdei, R.; Toka, L. Minimizing resource allocation for cloud-native microservices. J. Netw. Syst. Manag. 2023, 31, 35. [Google Scholar] [CrossRef]
  18. Al-Dhuraibi, Y.; Paraiso, F.; Djarallah, N.; Merle, P. Elasticity in cloud computing: State of the art and research challenges. IEEE Trans. Serv. Comput. 2017, 11, 430–447. [Google Scholar] [CrossRef]
  19. Kenga, D.M.; Omwenga, V.O.; Ogao, P.J. Autonomous virtual machine sizing and resource usage prediction for efficient resource utilization in multi-tenant public cloud. Int. J. Inf. Technol. Comput. Sci. 2019, 5, 11–22. [Google Scholar] [CrossRef]
  20. Berg, B.; Harchol-Balter, M.; Moseley, B.; Wang, W.; Whitehouse, J. Optimal resource allocation for elastic and inelastic jobs. In Proceedings of the 32nd ACM Symposium on Parallelism in Algorithms and Architectures, Virtual Event, 15–17 July 2020; pp. 75–87. [Google Scholar]
  21. Hadary, O.; Marshall, L.; Menache, I.; Pan, A.; Greeff, E.E.; Dion, D.; Dorminey, S.; Joshi, S.; Chen, Y.; Russinovich, M.; et al. Protean: VM allocation service at scale. In Proceedings of the 14th USENIX Symposium on Operating Systems Design and Implementation (OSDI 20), Virtual Event, 4–6 November 2020; pp. 845–861. [Google Scholar]
  22. Jeong, B.; Jeon, J.; Jeong, Y. Proactive resource autoscaling scheme based on SCINet for high-performance cloud computing. IEEE Trans. Cloud Comput. 2023, 11, 3497–3509. [Google Scholar] [CrossRef]
  23. Fawwaz, D.Z.; Chung, S.H.; Ahn, C.W.; Kim, W.S. Optimal distributed MQTT broker and services placement for SDN-edge based smart city architecture. Sensors 2022, 22, 3431. [Google Scholar] [CrossRef]
  24. Chin, K.; Zhao, J.; Shan, E.; Zong, Z. Using virtual machine size recommendation algorithms to reduce cloud cost. J. Stud. Res. 2022, 11, 1–10. [Google Scholar] [CrossRef]
  25. Delul, P.Y.; Griffith, R.; Holler, A.M.; Shankari, K.; Zhu, X.; Soundararajan, R.; Jagadeeshwaran, A.; Padala, P. Crowdsourced resource-sizing of virtual appliances. In Proceedings of the 2014 IEEE 7th International Conference on Cloud Computing, Anchorage, AK, USA, 27 June–2 July 2014; pp. 801–809. [Google Scholar]
  26. Osypanka, P.; Nawrocki, P. QoS-aware cloud resource prediction for computing services. IEEE Trans. Serv. Comput. 2023, 16, 1346–1357. [Google Scholar] [CrossRef]
  27. Rampérez, V.; Soriano, J.; Lizcano, D.; Lara, J.A. FLAS: A combination of proactive and reactive auto-scaling architecture for distributed services. Future Gener. Comput. Syst. 2021, 118, 56–72. [Google Scholar] [CrossRef]
  28. Fard, M.V.; Sahafi, A.; Rahmani, A.M.; Mashhadi, P.S. Resource allocation mechanisms in cloud computing: A systematic literature review. IET Softw. 2020, 14, 638–653. [Google Scholar] [CrossRef]
  29. Li, X.; Fan, Z.; Wang, S.; Qiu, A.; Mao, J. A Distributed fault diagnosis and cooperative fault-tolerant control design framework for distributed interconnected systems. Sensors 2022, 22, 2480. [Google Scholar] [CrossRef]
  30. Abhishek, M.K. Dynamic Allocation of high performance computing resources. Int. J. Adv. Trends Comput. Sci. Eng. 2020, 9, 3538–3543. [Google Scholar] [CrossRef]
  31. Karabutov, N.N. On identification of interconnected systems. Russ. Technol. J. 2024, 12, 63–76. [Google Scholar] [CrossRef]
  32. Yang, G.; Lee, K.; Lee, K.; Yoo, Y.; Lee, H.; Yoo, C. Resource analysis of blockchain consensus algorithms in Hyperledger Fabric. IEEE Access 2022, 10, 74902–74920. [Google Scholar] [CrossRef]
  33. Albychev, A.S.; Kudzh, S.A. Development of a research environment for the operational and computational architecture of central bank digital currency software. Russ. Technol. J. 2023, 11, 7–16. [Google Scholar] [CrossRef]
Figure 1. Structural representation of the networked interconnected system under consideration. Each subsystem is deployed in an isolated virtual environment, while data exchange is performed over the network. DBMS instances implement sharding and replication.
Technologies 12 00245 g001
Figure 2. Structure of the central bank digital currency software system model. Each subsystem is deployed in an isolated virtual environment implemented using virtual machines, while data exchange is performed over the network.
Technologies 12 00245 g002
Figure 3. The algorithm of automated experimental studies. Each loop iteration forms a report with data on resource usage given specific workload.
Technologies 12 00245 g003
Figure 4. Average CPU usage of virtual machines depending on target workload.
Technologies 12 00245 g004
Figure 5. Linear models of CPU usage depending on target workload.
Technologies 12 00245 g005
Figure 6. Average CPU usage of virtual machines depending on target workload after resource reallocation.
Technologies 12 00245 g006
Table 1. Allocated virtual machine resources.
Virtual MachineCPU, CoresCPU Time per Core, Clock TicksRAM, GB
Load Generator41002
REST API21001
Message Broker21001
Processing Service #111001
Processing Service #211001
DBMS #111002
DBMS #211002
Table 2. Evaluations of the networked interconnected system performance with arbitrary resource allocation.
Workload, Requests/SecondActual Throughput, Requests/SecondMean Response Time, MillisecondsFree CPU Resources, Clock Ticks
5048.905142.6043686.4758
10098.890639.9333612.7913
150148.197259.1269575.4825
200198.272272.2949531.6661
250247.962958.7410449.0985
300296.838592.6427460.0634
350347.312897.2142401.4007
400395.1900122.1140383.8948
450446.3347131.2374383.9199
500495.5722187.7537333.1636
550538.6977245.3518325.2988
600584.8866293.5404313.1035
650618.4665341.9627318.1386
700650.8521375.7756314.9316
750686.7718391.2822308.6244
800702.3511426.1200305.4608
850725.1637443.6361296.0067
900748.6596460.2285299.8197
950741.6275497.8828300.5392
1000772.2201504.2026296.8865
1050757.0539544.1691298.8247
1100767.0819564.1533299.7629
1150743.3609610.2197298.7930
1200781.5163605.7285296.4407
1250778.3480634.0605304.0968
Table 3. Virtual machines’ resources after reallocation based on the obtained estimates.
Virtual MachineCPU, CoresCPU Time per Core, Clock TicksRAM, GB
Load Generator41002
REST API2561
Message Broker2561
Processing Service #12561
Processing Service #22561
DBMS #12882
DBMS #22882
Table 4. Evaluations of the networked interconnected system performance with suggested resource allocation.
Workload, Requests/SecondActual Throughput, Requests/SecondMean Response Time, MillisecondsFree CPU Resources, Clock Ticks
5044.594780.3336625.3823
10095.819155.7040498.8047
150142.673666.7153459.1553
200180.5712104.2168447.6678
250230.4296100.8436357.0985
300282.3206116.5228382.0050
350330.2252127.4006337.4591
400377.1159128.9022258.7780
450421.4804146.0458236.8214
500403.5352228.8908292.7713
550519.8181177.2931160.4925
600561.9751187.0312175.2788
650608.3979205.0485150.8915
700636.0103233.9468163.4007
750697.7407260.1756106.6694
800724.9086287.0579129.5342
850820.8133282.365978.2204
900824.8766304.6717111.2504
950859.3860334.1597110.3372
1000870.2509365.6972114.9599
1050900.5932385.3228108.6795
1100936.5267409.8609102.7496
1150954.2838422.192984.8564
1200938.4528474.1304131.6711
1250939.8610500.5904135.0634
Disclaimer/Publisher’s Note: The statements, opinions and data contained in all publications are solely those of the individual author(s) and contributor(s) and not of MDPI and/or the editor(s). MDPI and/or the editor(s) disclaim responsibility for any injury to people or property resulting from any ideas, methods, instructions or products referred to in the content.

