Article

Field Performance Monitoring of Energy-Generating High-Transparency Agrivoltaic Glass Windows

1
ClearVue Technologies Ltd., Perth 6005, Australia
2
Environmental Technology Centre, School of Science, Technology, Engineering & Mathematics, Murdoch University, Perth 6150, Australia
*
Author to whom correspondence should be addressed.
Technologies 2023, 11(4), 95; https://doi.org/10.3390/technologies11040095
Submission received: 9 June 2023 / Revised: 4 July 2023 / Accepted: 10 July 2023 / Published: 12 July 2023

Abstract

:
Currently, there are strong and sustained growth trends observed in multi-disciplinary industrial technologies such as building-integrated photovoltaics and agrivoltaics, where renewable energy production is featured in building envelopes of varying degrees of transparency. Novel glass products can provide a combination of thermal energy savings and solar energy harvesting, enabled by either patterned-semiconductor thin-film energy converters on glass substrates, or by using luminescent concentrator-type approaches to achieve high transparency. Significant progress has been demonstrated recently in building integrated solar windows featuring visible light transmission of up to 70%, with electric power outputs of up to Pmax ~ 30–33 Wp/m2. Several slightly different designs were tested during 2021–2023 in a greenhouse installation at Murdoch University in Perth, Western Australia; their long-term energy harvesting performance differences were found to be on the scale of ~10% in wall-mounted locations. Solar greenhouse generated electricity at rates of up to 19 kWh/day, offsetting nearly 40% of energy costs. The objective of this paper is to report on the field performance of these PV windows in the context of agrivoltaics and to provide some detail of the performance differences measured in several solar window designs related to their glazing structure materials. Methods for the identification and quantification of long-term field performance differences and energy generation trends in solar windows of marginally different design types are reported. The paper also aims to outline the practical application potential of these transparent construction materials in built environments, focusing on the measured renewable energy figures and seasonal trends observed during the long-term study.

1. Introduction and Background

At present, energy innovations which can optimize both the distributed renewable energy generation and the energy use intensity are urgently needed in the built environment and in agricultural production sectors. Huge amounts of energy are being consumed in buildings (more than 40% of the total nationwide energy consumption was occurring in the US buildings sector already in 2018 [1]). More recently, the buildings sector also accounted for 132 EJ of worldwide energy consumption in 2021 or 30% of total global energy consumption. The sector’s 3 Gt CO2 emissions accounted for 15% of total emissions from all end-use sectors in 2021 in the built environment, but this share doubles if scope 2 emissions from electricity and heat production are included [2].
The building-integrated PV (BIPV) sector continues to grow rapidly in multiple countries, deploying a constantly broadening range of new technologies and products (detailed reviews are available in [3,4,5,6]). The majority of installed energy production capacity growth still takes place in conventional installations (solar farms and rooftops). A new segment of the PV industry, enabling improved energy efficiency in agricultural production environments emerged recently, known as agrivoltaics, where the optimized arrangements of partially transparent PV and BIPV modules are required to balance the requirements of achieving energy savings simultaneously with maintaining crop growth productivity and land-use efficiency [7,8]. Efficient production of commercial crops in greenhouses requires the maximum possible delivery of the photosynthetically active radiation (PAR, the wavelength range between 400–700 nm) to plant leaves, placing substantial constraints on the design of agrivoltaic installations, where the PV modules must be either highly transparent or occupy only a rather limited fraction of wall or roof areas. The placement of the now-conventional semitransparent BIPV modules (area-patterned semiconductor thin-film layers on glass substrates) onto vertical wall areas leads invariably to strong reductions in the energy yields, compared to typical (silicon-based) roof-mounted PV modules. This is due both to the partial transparency feature limiting the sunlight utilization and the intrinsically high sensitivity of all conventional photovoltaics to variations in the angle of solar radiation incidence. In practical field conditions, especially in agrivoltaic greenhouse, factors such as environmental soiling, large ambient temperature variations, and partial external shading of the energy-converting surfaces can limit the energy production yields substantially, placing a strong emphasis on the design of alternative, non-conventional PV module configurations capable of more stable energy output in a wider range of weather conditions. Studies of the differences between the practical field performance of photovoltaics and their lab-measured parameters represent an active area of ongoing research [9,10,11]. It has been reported, based on field studies, that some PV system outputs could be reduced by as much as 60% in dusty or polluted climates without regular cleaning. The detrimental effects of high humidity, rain, and snow were also found to lead to strong reductions in the measured efficiencies of PV installations [11].
The newly emergent window-integrated PV (WIPV) class of technologies features a deep integration of various semiconductor-based energy converters into the structure of installation-ready, packaged glazing systems, which can themselves be optimized in terms of light propagation control and thermal insulation properties. This provides unique design opportunities for achieving improvements in the light-capture behavior of solar modules compared to standard PV if additional technologies are employed to alter the ways in which the incoming sunlight interacts with the PV module structure, e.g., using spectrally selective coatings [12], diffractive elements [13], spectral converter materials, and/or embedded luminescent solar concentrator (LSC) components [14,15,16,17]. Window-integrated PV systems can also offer an additional dimension (depth) inside insulated glazing units (IGU), providing extra (3D) flexibility for the design of PV module structures and their optical interfaces [18]. Compared with conventional rooftop PV and most often semitransparent, planar BIPV modules, where the semiconductor components are typically only protected from the environment by ~3 mm thick cover glass, the window-integrated systems are expected to have longer useful lifetimes of >30 years, due to the placement of semiconductor energy converters inside window compartments, such as argon-filled spaces, and usually protected by thicker layers of glass and other materials from factors such as rapid temperature variations, mechanical stresses, or UV exposure. At the same time, placing any complex-structured PV modules behind thick layers of glass with their components typically facing different geometric directions, while being subjected to additional window-structure-induced shading, requires ensuring that these PV modules can still operate effectively. It is not very widely known that a silicon-based PV module facing direct full-spectrum sunlight, but placed under a low-iron (ultra-clear) coverglass of a large thickness (near 8–10 mm) will demonstrate a short-circuit current reduction on the scale of tens of percent, up to ~30% or more, caused by the glass absorption, interface reflections, and internal reflections and scattering. For practical 3D-structured WIPV energy converter modules, employing internal light redistribution mechanisms and using optical components working from within glazing, such as fluorescent collectors or other types of light diffusers, is necessary to ensure stable operation. These added components can enable the capture of a part of solar radiation energy incident from outside the direct-path visibility range of solar cells, and they can be designed to ensure a degree of irradiation level uniformity for the interconnected solar PV components facing significantly different orientations with respect to the incoming sunlight. Luminescent concentrator-type PV devices have also been widely reported and proven [19,20] to provide efficient capture of both the direct-beam and the diffused solar radiation components, producing energy more stably in adverse weather conditions when compared to conventional PV. Ref. [20] describes a long-term large-area LSC outdoor performance study, emphasizing a relative lack of similar studies reported in the recent literature.
A range of BIPV and high-transparency WIPV systems has been developed by ClearVue Technologies (Perth, Western Australia) [21], which have been tested for compliance with the relevant industry standards and proven to be suitable for deployment in both the construction sector [22] and greenhouses [23]. ClearVue solar WIPV systems feature the following set of innovative features:
  • Custom-designed energy-saving glazing systems using special types of glass and low-emissivity coating (s) to provide substantial thermal energy savings in a range of deployment climates (adjustable solar heat gain, thermal insulation U-value, and visible light transmittance). Optical coating spectra are also selected to provide efficient back-reflection of the short-wavelength and infrared light, while maximizing visible transmission;
  • 3D-structured, custom-shaped, custom-interconnected energy harvesting PV surfaces placed around glazing perimeter regions, maximizing the visual transparency [18];
  • Glazing-integrated luminescent solar concentrator panels using stable inorganic luminophores embedded into glass lamination interlayers, targeting primarily the harvesting of the UV-blue and near-infrared solar radiation components. This feature reduces the energy harvesting losses dependent on the incidence angles of solar radiation and weather conditions, while improving the overall energy capture efficiency. Luminescent material particles embedded into custom-extruded polyvinyl butyral (PVB) interlayers also provide spectral conversion of sunlight from shortwave radiation into the spectral range (near-infrared) best suitable for the efficient conversion to electricity. The mixes of luminophores and their concentration-thickness products have been optimized based on the results first reported in [24], aiming at maintaining a balance between the scattering-induced light diffusion, outcoupling losses, and color-free appearance;
  • Customized, installation-specific electrical interconnections (floor-level) circuitry involving combiner boxes and microinverters, enabling optimization of the energy production from a large-scale building structure containing multiple solar windows.
Several other recent implementations of ClearVue high-transparency solar window technologies in built environments have been reported on [5,22], together with some of their measured and predicted performance datasets. This study focuses on the results of long-term energy generation performance monitoring of an agrivoltaic research greenhouse constructed in early 2021 at Murdoch University in Perth, Australia (Figure 1).
The total greenhouse footprint area was approx. 300 m2; building design included four grow-rooms of appx. 50 m2 floor area each and a service corridor. All rooms provided a controlled plant growth environment and were climate-controlled individually, using a combination of reverse-cycle air-conditioners, high-pressure water mist evaporators, motorized shading and louvre window-vent systems, ventilation fans, and an online-monitored custom-built, IoT-enabled building management system. Room 1 was used as a reference environment and glazed conventionally using clear low-iron laminated safety glass panes. Rooms 2–4 were fitted with Clearvue high-transparency solar windows of three slightly different design types described in subsequent sections. The glazing system design differences were practically indistinguishable by an unaided eye, despite Room 4 using a single low-haze fluorescent interlayer and Rooms 2 and 3 using a combination of two fluorescent interlayers of two similar material compositions, but identical thickness (0.76 mm each), used in a sequence. A total of 153 solar windows of glazing unit dimensions 1.2 m × 1.1 m were installed, including 90 solar windows on a 20-degree tilted north-facing roof of the greenhouse, 42 on the north wall, and 21 windows on the west-facing wall of Room 4. Polystyrene foam panels were installed behind windows to cover the internal sides of the east- and west-facing walls of the building, in order to make the internal daylighting environments close to identical, and to balance the shading effects of non-transparent internal walls. Plant growth experiments and their results will be reported elsewhere. Economic analysis of agrivoltaic installations involving glass-based solar photovoltaic windows of the described type will require conducting separate multi-disciplinary studies, which can be aimed at evaluating the energy production and plant growth productivity benefits versus the added costs of deploying an unconventional building envelope material. Several newer versions of solar windows, tailored in their thermal insulation and solar radiation transmission properties to the application requirements dictated by several different climate types have been developed recently by Clearvue Technologies, including the more lightweight double-glazed windows; the research aimed at minimizing the solar window production costs is ongoing. This study reports primarily on the results of monitoring the energy harvesting trends of this greenhouse installation and makes a comparison between the measured season-dependent energy harvesting behaviors of different solar window design types. Methods for identifying and quantifying the field performance differences in the energy harvesting behaviors of differently structured solar windows of very similar lab-tested performance characteristics have been developed and are described in the following sections.

2. Approach, Methodology, Materials and Methods

The task of designing visually clear LSC-type devices of relatively high power conversion efficiency (PCE) for BIPV and window applications involves considering fundamental trade-offs between the device transparency versus energy collection, the applicable theory limits described [25], and the optimization of shading-resistant complex-interconnected custom-shaped PV module configurations capable of operating from inside the internal spaces of framed window products while avoiding strong electric mismatch losses within module parts. The current state of the LSC development field has been summarized [26] and the recent materials-related developments reported [17,27,28,29], among other sources. It is possible to design LSC-type solar window systems featuring enhanced probability of the incident photons collection by the solar PV elements, simultaneously with an enhanced quantum yield of PV conversion. LSC-type solar window designs typically rely on redirecting a fraction of the sunlight incident onto clear glass area towards PV surfaces. This redirection of light can occur either through the internal light diffusion mechanisms; for example, by diffraction or scattering [24], or it can be engineered through luminescent down-conversion, luminescent down-shifting [30], or even up-conversion, where most of the light rays are re-emitted by the embedded luminescent particles at different wavelengths can be partially trapped within glass due to total internal reflection. Installing additional front-facing narrow PV modules near the system perimeter to face direct full-spectrum sunlight would effectively reduce the geometric gain factor, but meaningfully increase the overall light capture efficiency to boost energy output [16,22]. Therefore, considering all of the optical, materials-related, and electrical factors strongly affecting the system operation, a multidisciplinary design approach is needed to engineer practical LSC-type solar window devices capable of providing stable energy output and large energy yields in realistic deployment conditions. Long-term field performance testing of different solar window modifications represents a reliable methodology necessary to enable continued development progress while improving the understanding of the materials-dependent and design-dependent energy harvesting behavior features. In the case of highly transparent solar windows of similar visual appearance, device structure and lab-test electric parameters, revealing materials-dependent, design-related, or seasonal field performance differences, new methods for the analysis of field performance data are needed, some of which have been developed during this study.
Figure 2 shows the typical PV I-V curve and power–voltage curve measurement results of ClearVue solar windows of the types installed in Rooms 2–4 of Murdoch greenhouse. The testing was performed using flash–lamp irradiation at standard test conditions (STC, at 25 °C solar cell surface temperature and AM1.5G solar spectrum at 1000 W/m2). Figure 2 also shows the same datasets but measured from a solar window of significantly larger glass-area size but identical device structure, materials, and PV components width and arrangement, demonstrating a large degree of performance scalability in terms of the electric power output per unit device area. Lab measurements of large-area window photovoltaic performance are usually made at normal incidence, with rare exceptions requiring the use of non-standard large-scale PV metrology systems, and revealed no significant differences in the Wp/m2 electric outputs between the windows of design types installed in rooms 2, 3, and 4. It was known from prior lab measurements (made in 2018 at CENER, Spain) conducted with 1 m2 solar window samples of identical design type that a maximum electric power output per unit IGU area, measured at standardized solar cell surface temperature and solar spectrum, was actually obtained at oblique incidence, at near 15–20° from normal. Field measurements of the main electric output parameters of Murdoch greenhouse windows, made in outdoor summer sunlight prior to installation into the building envelope, have also re-confirmed that the maximum electric outputs were seen at oblique incidence, with windows inclined away from the sun direction in both planes. There were some systematic differences observed in the maximum short-circuit current (Isc) outputs between solar windows of single- and double-interlayer construction types; the differences were on a scale of about 10% but could not be evaluated metrologically accurately due to some naturally occurring variations in the sunlight intensity during measurements.
Oblique-angle field measurements made with 1.1 m × 1.2 m solar windows at Murdoch University in February 2021 have revealed that the maximum measured Isc reached up to ~980–990 mA in windows of double-interlayer types, at the Voc near 60.5 V, in hot conditions (air temperature in excess of 30 °C and solar cell temperatures at near 50 °C). These datasets suggest that the field-conditions electric outputs reached ~33 Wp/m2.
PV arrays (13 of them in total; marked alphabetically as A, B, C, …M were mainly (all except one) composed of a group of 12 solar windows each, with all individual devices within each array connected electrically in parallel) were designed to be used in conjunction with 13 Enphase IQ7+ microinverters. The overall installation has been configured for exporting energy to the electricity grid through a three-phase smart meter and a system of current transformers to enable the real-time measurements of total electricity consumption, including the self-consumed energy, in each section of the greenhouse. Energy amounts exported into, and imported from the supply grid were also metered. Figure 3 shows the principal diagram of the PV window array arrangement over the greenhouse building envelope; part (b) shows the long-term energy production figures from several individual arrays containing windows mounted on the north-facing wall.
The relationship between the measured photovoltaic system parameters and the electric output power at the maximum-power point is described by the same equation (Pmax = Isc × Voc × FF, where Isc is short-circuit current, Voc is open-circuit voltage, and FF is fill factor dependent on the shape of the I-V characteristic curve), whether the system contains a single PV module (e.g., a solar window), or a parallel-connected bundle of multiple solar windows connected to microinverter input. Typical values of the fill factor were between 0.75–0.77. Array energy production figures were quantified in real time by the microinverter devices, which performed the time integration of electric power. Table 1 summarizes the solar window array nomenclature and orientation geometry, together with the details of their placement arrangement over the building envelope.
The amounts of solar energy harvested by the solar windows installation at the Murdoch University Solar Greenhouse (Building 899, Campus Drive South, South Street Campus) were data-logged continuously, enabled by Enphase Envoy Communication Gateway and Enphase Enlighten online data interface processing the live streamed data from each of the 13 microinverters connected to parallel-bundled solar window arrays. The data interface provided a comprehensive access to multiple data-logged parameters, including the date-specific and time-dependent electric outputs per each array (current, voltage, power, etc.), as well as the instantaneous or time-cumulative energy production output dependencies. Multiple datasets were obtained and analyzed during this study, which involved a long observation period. The main results and findings are reported in the following sections of article.

3. Results and Discussion

The monitoring results of the energy harvesting behavior of the greenhouse installation at a system level, as well as the systematic performance differences noted between the differently designed or differently mounted window groups have provided useful insights in relation to the practical application potential of high-transparency solar windows. Multiple findings made were originally unexpected and related primarily to the measured details in the seasonal and weather-related energy harvesting window behaviors.

3.1. Long-Term and Seasonal Greenhouse-Total and Array-Specific Energy Output Trends

Continuous observations of the recorded power and energy data were made throughout 2021–2022, and the observed energy production trends were also analyzed in comparison with a reference conventional (roof-based, near-optimally tilted) 6.6 kWp rooftop PV installation located in Perth metropolitan area. This reference roof-top PV installation is facing the north-western direction and is tilted at 22.5° to the horizontal plane; this combination of parameters provides the practically optimum year-round PV energy production in Perth, considering the local latitude and the applicable local industry-standard roof pitch angles. 
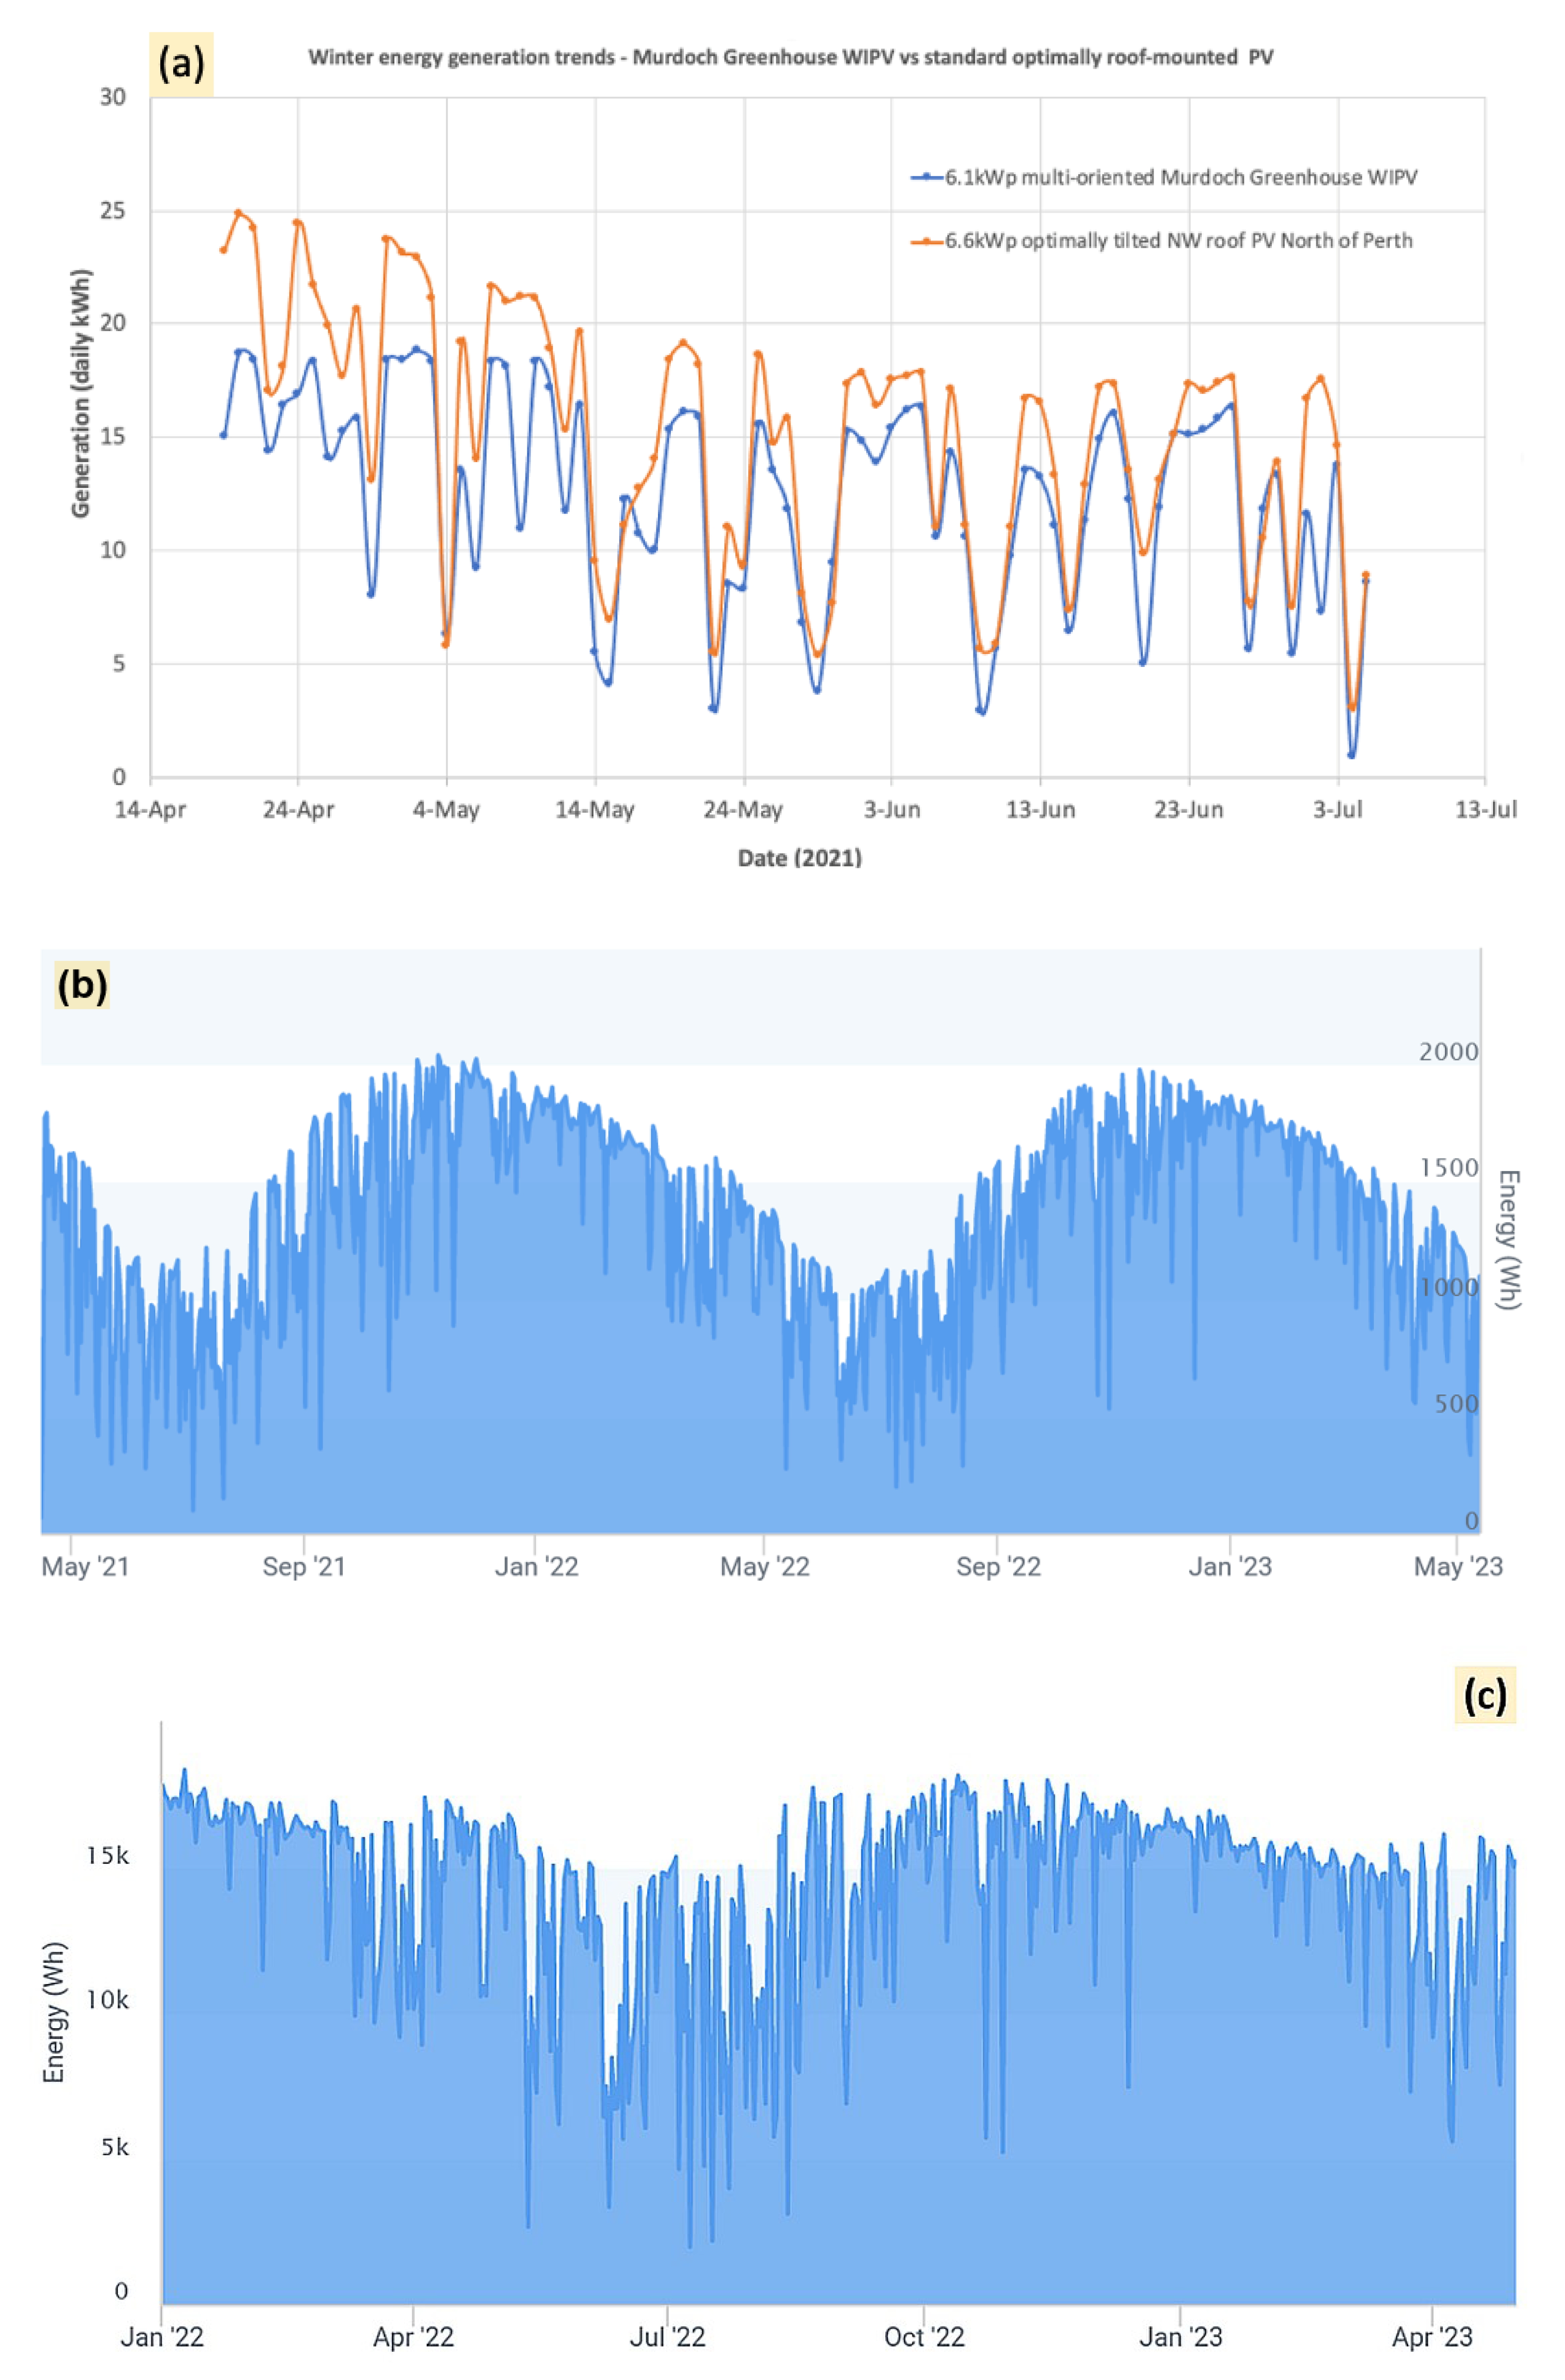
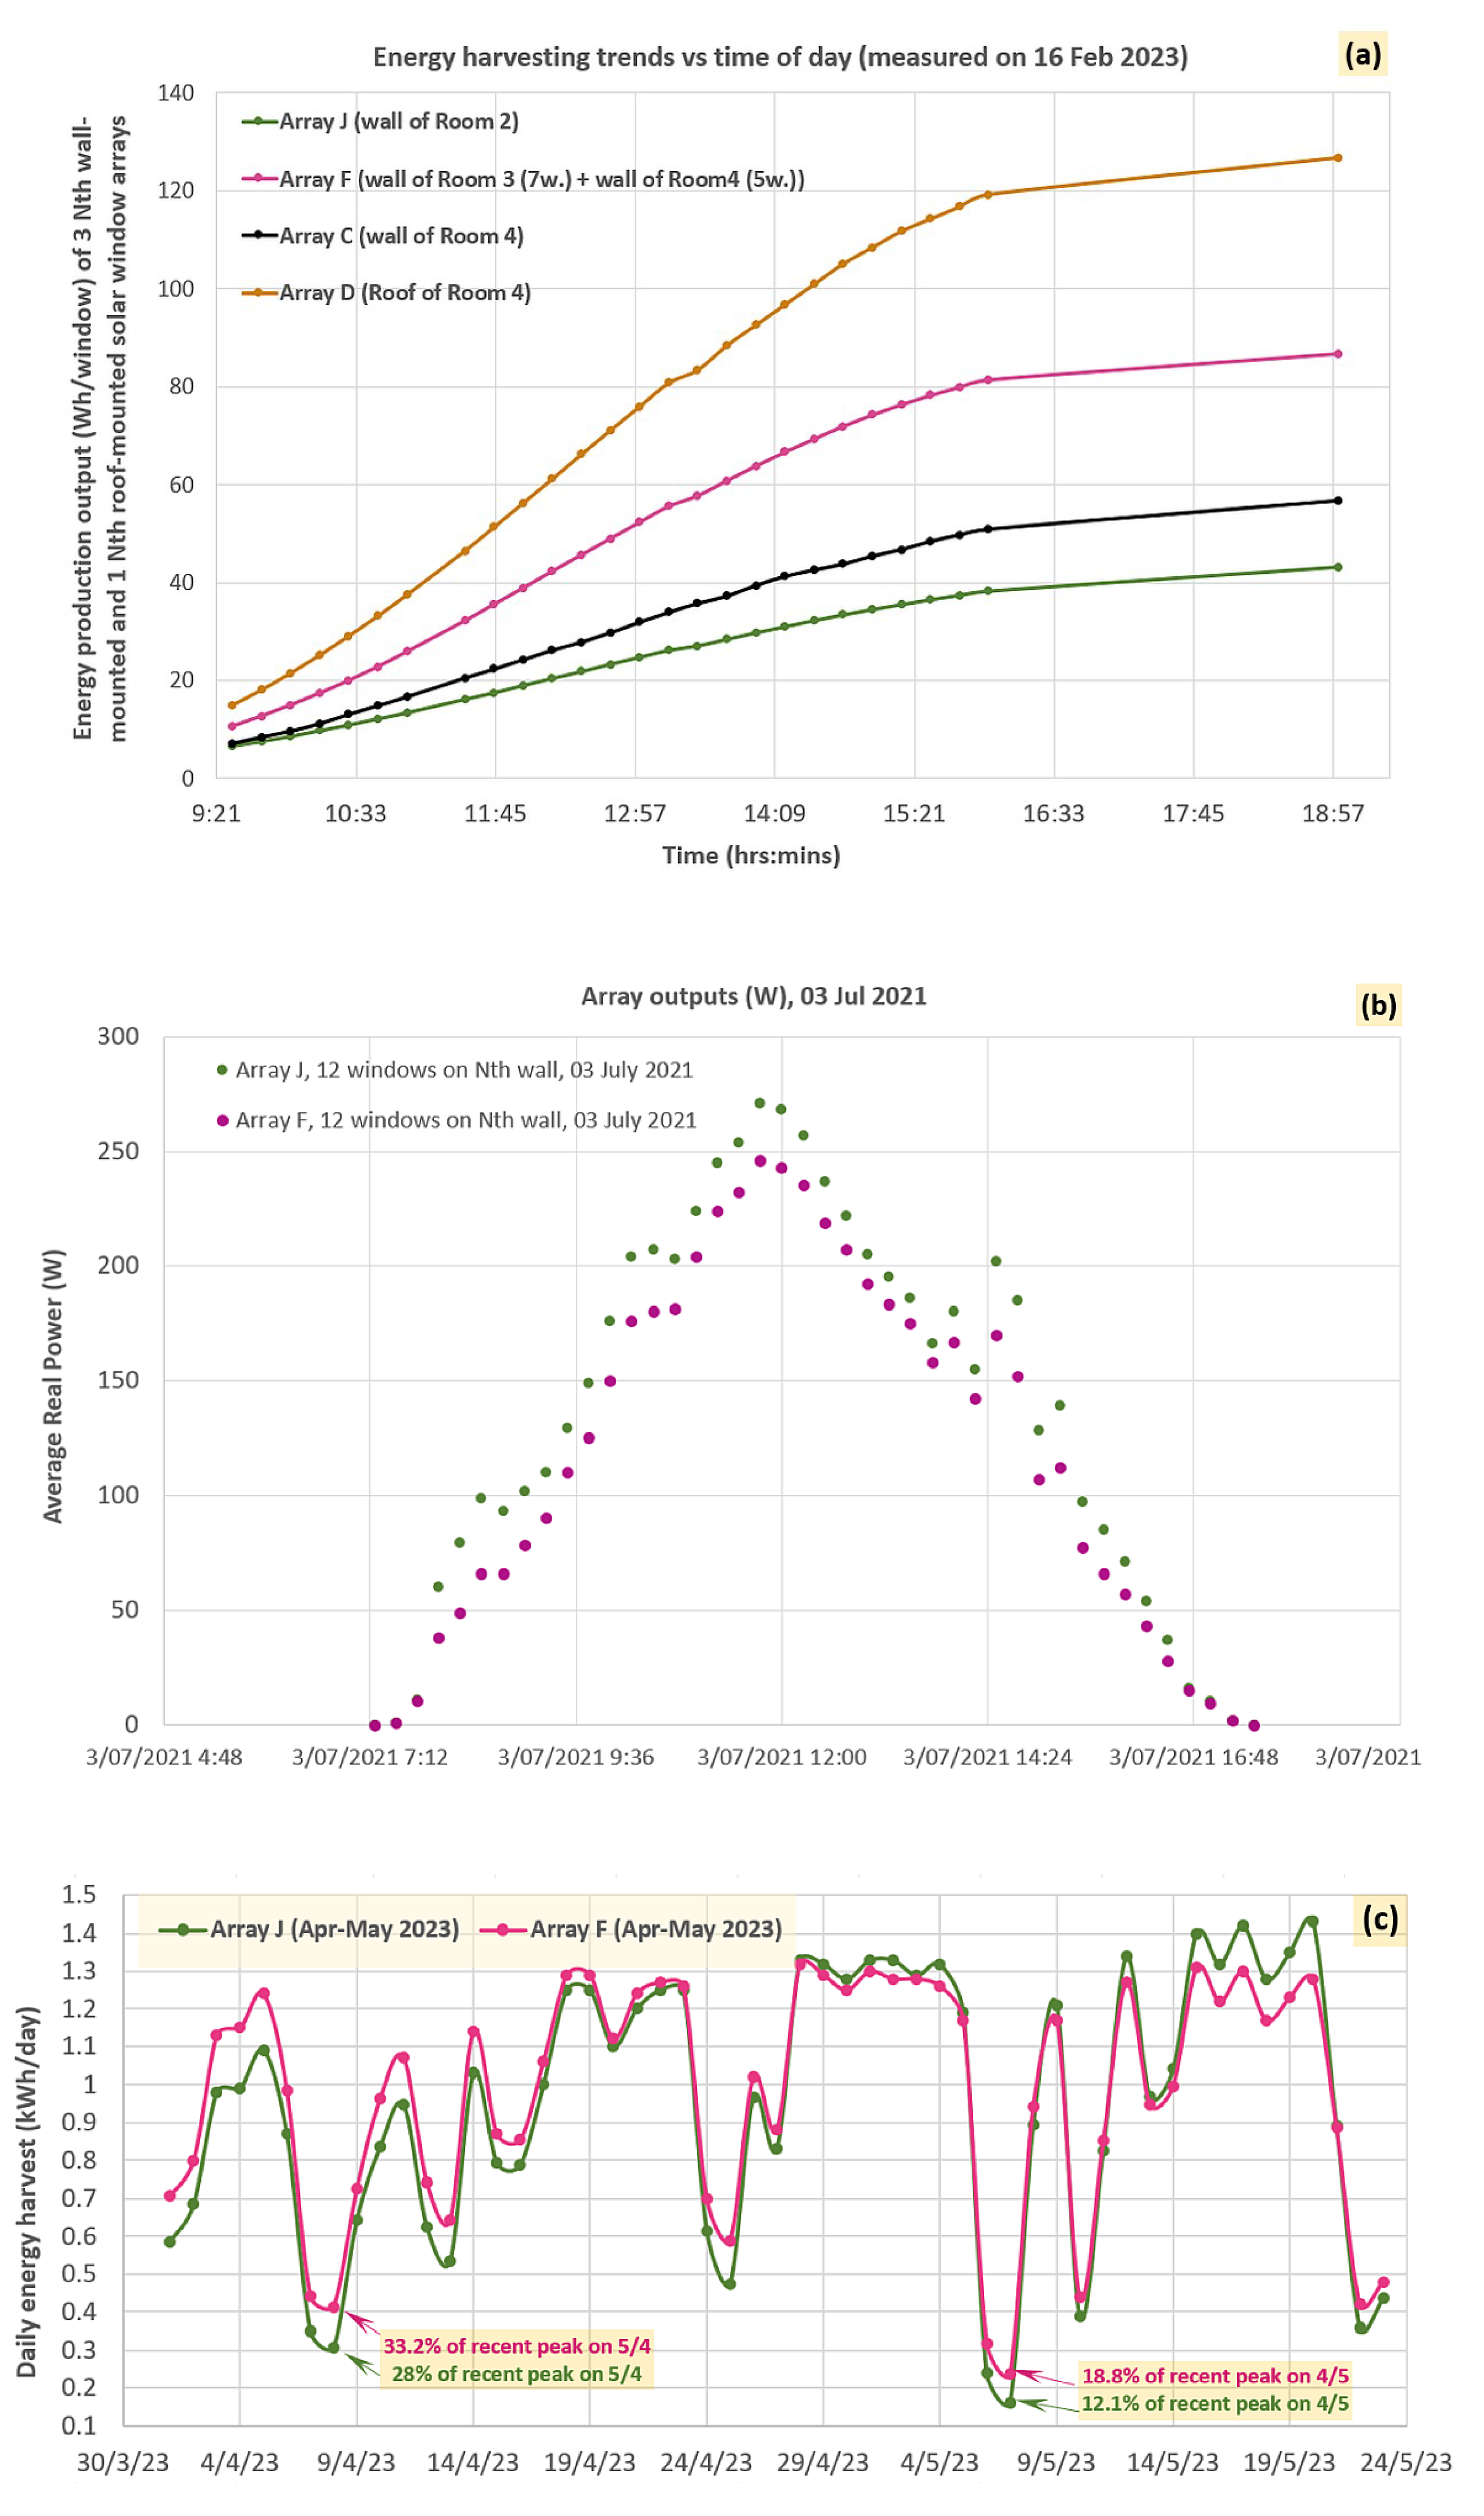
Figure 4a shows the comparative energy generation trends observed during the autumn and winter seasons of 2021, shortly after the greenhouse construction. A long-term daily energy generation datalog recorded from an array of 12 windows mounted on the roof of grow-room #3 is also shown in part (b), revealing the absence of any significant performance degradation and relative stability of daily energy outputs throughout seasons. The installation-total long-term daily energy production data trend (Figure 4c) shows that the season-dependent variations in the daily energy harvest were relatively small, considering the sunny days throughout months and years.
The initial measurement results analyzed over the autumn–winter of 2021 suggested that Murdoch University Solar Greenhouse demonstrated a relatively stable energy production output, despite having a large area of vertically oriented windows (e.g., on North and West Walls), and on some rainier days even outperformed a standard 6.6 kWp PV panels installation mounted on an optimally tilted roof area (considering the installed PV capacity difference; data shown in Figure 4a). Both the North and West wall areas performed stably in terms of energy harvesting, particularly on some wall areas in the summer months of 2021–2022, considering the non-optimum orientation/tilt angles, as well as the weather conditions during the winter of 2021. The energy amounts harvested daily approached ~19 kWh/day. Some energy harvesting limitations were also observed, arising due to the maximum AC power output limitations of microinverters used, and affecting primarily the roof-mounted arrays on summer days.
In can be noted from the data of Figure 4b presenting the long-term performance of a roof-mounted 12-window array, that throughout all seasons, the minimum rainy-day daily energy outputs were typically not below ~30% of a peak-day production for each corresponding week of the year. Compared with the summer-time daily energy production data also available from the same reference rooftop PV system, the seasonal variations in the daily energy outputs were smaller on the greenhouse roof. On sunny days, the greenhouse roof (Array G, roof of room #3) production from solar windows varied from approximately ~1.1 kWh/day in winter to ~2 kWh/day in summer. The season-dependent daily energy production variations of the reference 6.6 kWp conventional monocrystalline silicon-based rooftop PV system was larger, from approximately ~17 kWh/day on peak days in winter to ~40 kWh/day on peak days in summer. The total energy production output of greenhouse exceeded 11 MWh in late May of 2023.
The data of Figure 4 confirms that ClearVue solar windows are suitable for efficient solar energy harvesting in adverse environmental conditions (e.g., during rainy winter days), even when installed at a range of different azimuth and tilt angles, in an agricultural setting where dust contamination from nearby land areas is also a factor. This finding was expected, due to the window design features (multi-oriented PV modules and fluorescent interlayers) providing the capability of capturing the incoming sunlight energy from a wide range of incidence angles including in diffused irradiation conditions.
Significant energy savings were demonstrated in greenhouse grow-rooms fitted with ClearVue solar windows, which demonstrated approximately 40% of total (season-averaged) energy self-sufficiency, due to the renewable energy generated. 
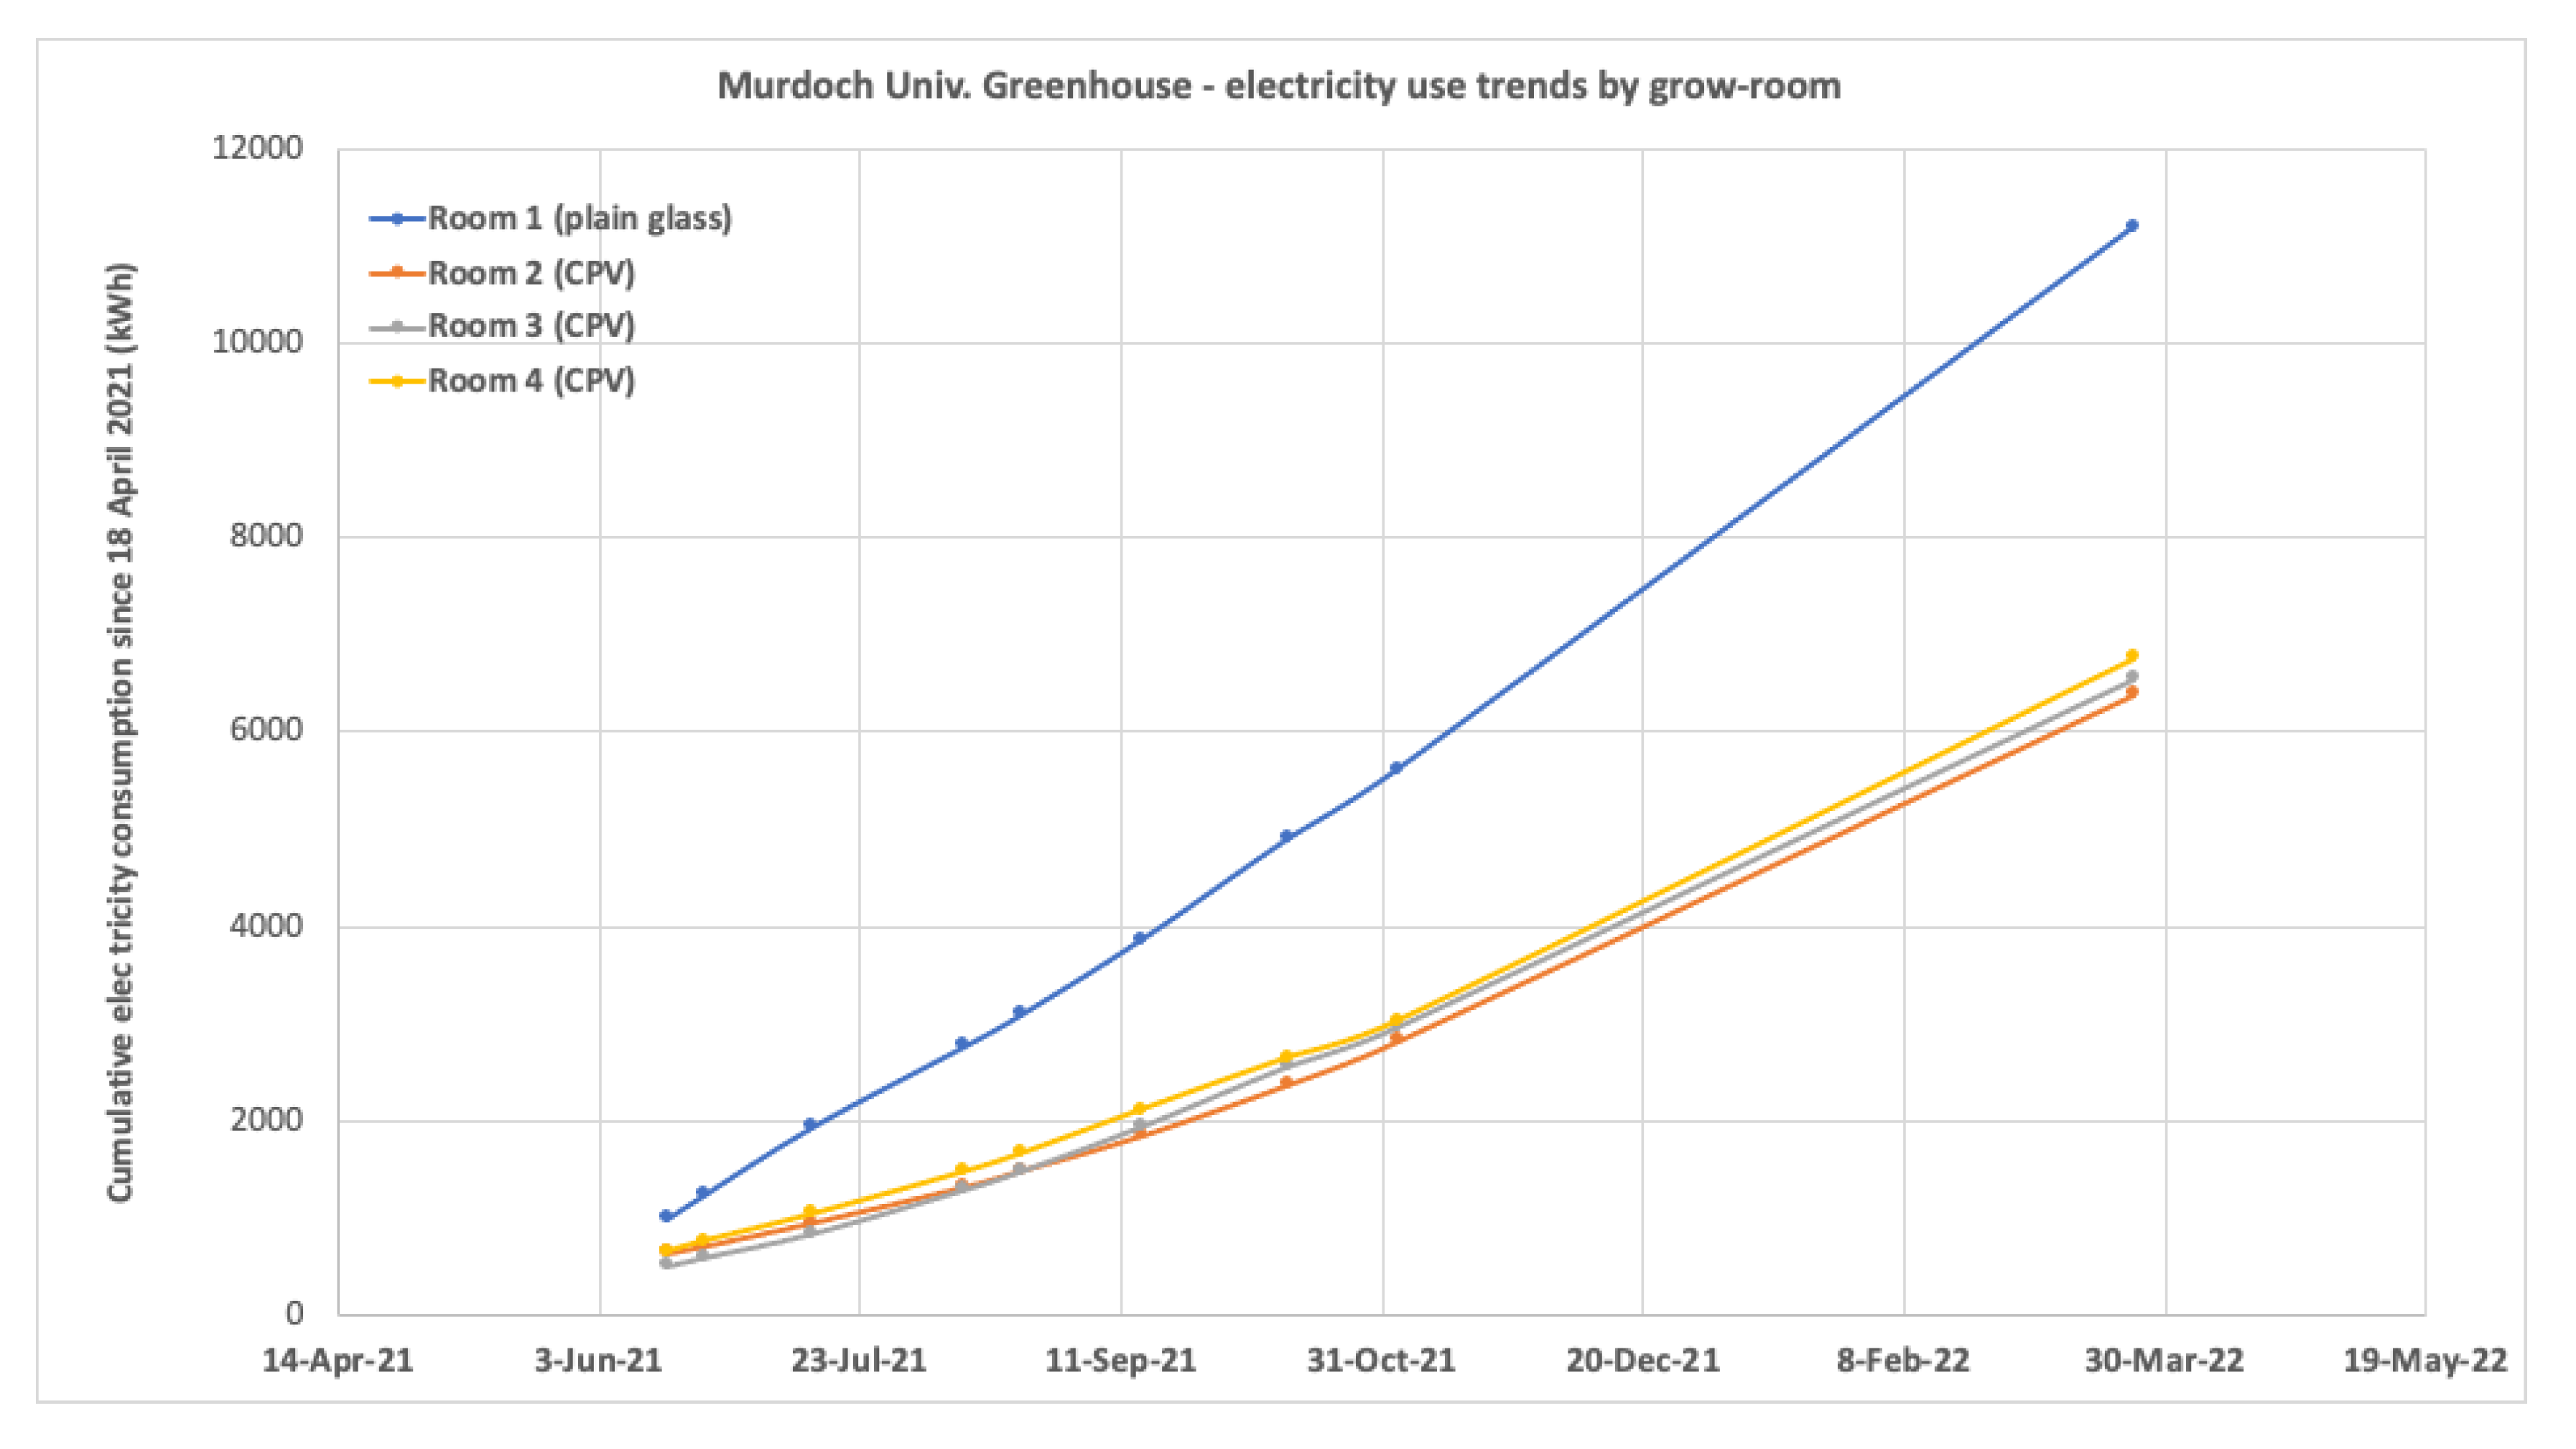
Figure 5 shows the measured electric energy consumption trends in all four grow-rooms, on a time scale of almost 1 year. Further optimizations to be applied to the internet-of-things (IoT) based HVAC control algorithms, involving more efficient air cooling applied through high-pressure evaporation of water mist, are expected to further improve the energy self-sufficiency, reducing the running time of high-power reverse-cycle air conditioners.
As was expected, conventionally glazed Room 1 used electricity at a significantly higher rate, compared to solar grow-rooms, due to its significantly larger (by almost 30%) solar heat gain coefficient. Marginal (few %) energy use differences were noted between grow-rooms fitted with solar windows, possibly also correlated with their slight solar heat gain differences. The electricity consumption figures were obtained from commercial energy metering equipment capable of 0.01 kWh display resolution, which ensured that the small differences in the energy use data observed between the solar-glazed rooms were still much greater than the error margins. The three monthly averaged energy self-sufficiency level (for all 3 CPV rooms) was equal to PV Generation Total/Total Energy Used = 1165 kWh/3082.42 kWh = 37.8%—averaged between 16 April to 21 July 2021, with the record rainy June and July months in 2021. On the other hand, during the same three-month period, the ratio of total energy generated in Rooms 2, 3, and 4 to the metered grid-imported energy was as high as 49.7%. The cost of importing from grid (only ~2.3 MWh in 3 months’ time) was approximately AUD 300/month, using off-peak Perth tariff of AUD 0.3896/kWh) indicates rather small running costs, compared to the expected running costs of energy in other R&D greenhouses at Murdoch Campus. No electric energy storage systems were used during this study, even though the energy performance of solar greenhouse would have been further improved if batteries were installed.
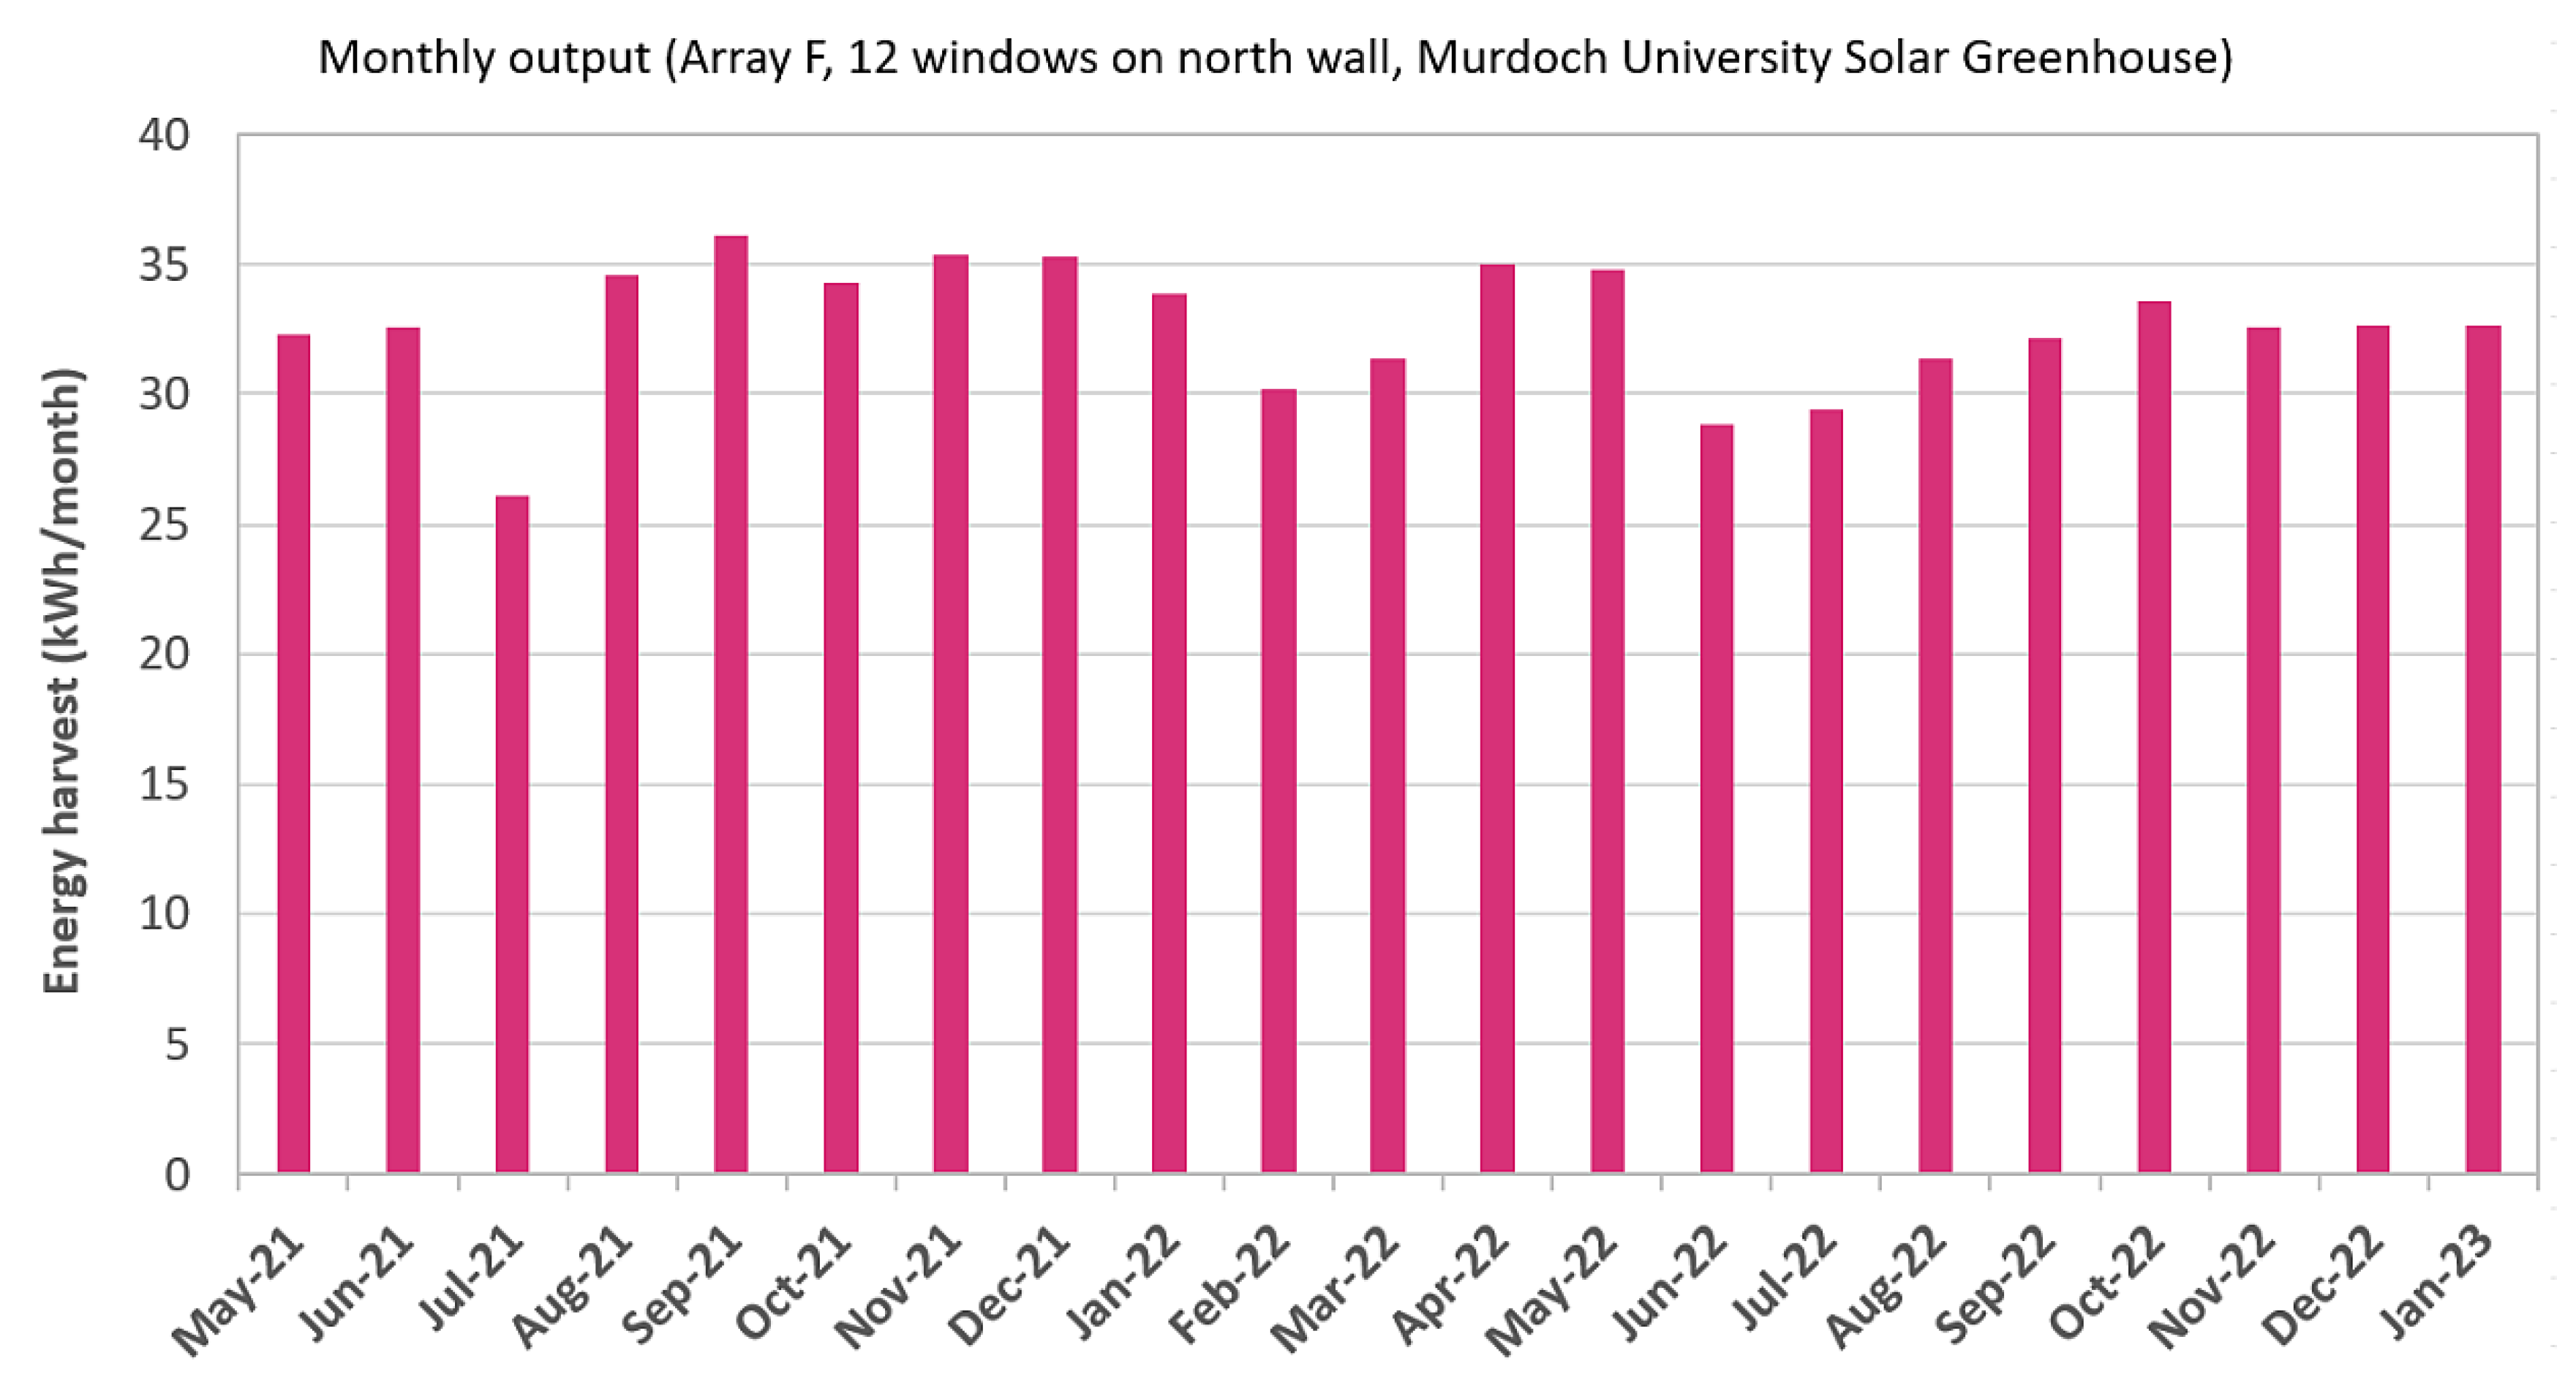
Figure 6 shows the remarkable stability of the monthly energy output from a 12-window array mounted vertically on the north-facing wall of greenhouse (Array F, with 7 windows on the wall of room #3 and 5 windows on the wall of room #4).
The superior stability of the monthly energy outputs was initially unexpected to be measured in any wall-mounted window array, considering the much stronger seasonal variations seen in roof-mounted PV (e.g., Figure 4a,b). The strong, season-dependent, and also weather-dependent performance and behavior differences between the nearby north-facing wall-mounted arrays of solar windows of slight design type differences were also not foreseen initially. As an example, windows of Array J (wall of Room 2) have consistently generated daily energy outputs very similar to Array F (mainly wall of Room 3) during sunny winter days; however, they also produced substantially weaker daily energy in either the very cloudy rainy autumn and winter conditions or during summer days. Windows of all PV arrays had identical glass and PV module dimensions and structure, and the same glazing system design including optical coatings. Windows of Array J had two strongly particle-loaded PVB interlayers of standard thickness 0.76 mm, while most of the Array F windows also used two particle-loaded fluorescent interlayers, one being of much smaller particle concentration. Windows of Room 4 design type (eg Arrays C and D) contained a single particle-loaded fluorescent interlayer of smaller concentration, and another standard (non-fluorescent) PVB interlayer.
These initially unexpected strong seasonal variations in the relative energy-output performance of Array J windows vs. Array F can be illustrated by plotting the intra-day energy production outputs of different window arrays, as well as intra-day array average power outputs. The data of Figure 7 (collected using Enphase Enlighten online data interface) clearly illustrate the large energy harvesting efficiency differences between different window designs (and also between the three different wall arrays and one roof array) seen in summer (16 February 2023) and also the much smaller differences for the wall arrays in winter (3 July 2021). The observation results were repeatable with each passing season; particular data acquisition dates were chosen for illustration purposes only.
It is particularly interesting to note that Array J (wall of Room 2) windows in fact outperformed Array F windows consistently in terms of the power output during some winter days (illustrated in Figure 7b), by several %, while following the identical power generation intraday time-dependency curve during practically all of the daylight hours. During rainy conditions between April and early June of 2023, Array J windows produced substantially smaller daily energy outputs compared to Array F (Figure 7c); the main observed trends were identical also back in 2021–2022.

3.2. Long-Term Performance Monitoring of Solar Photovoltaic Windows of Several Different Design Types

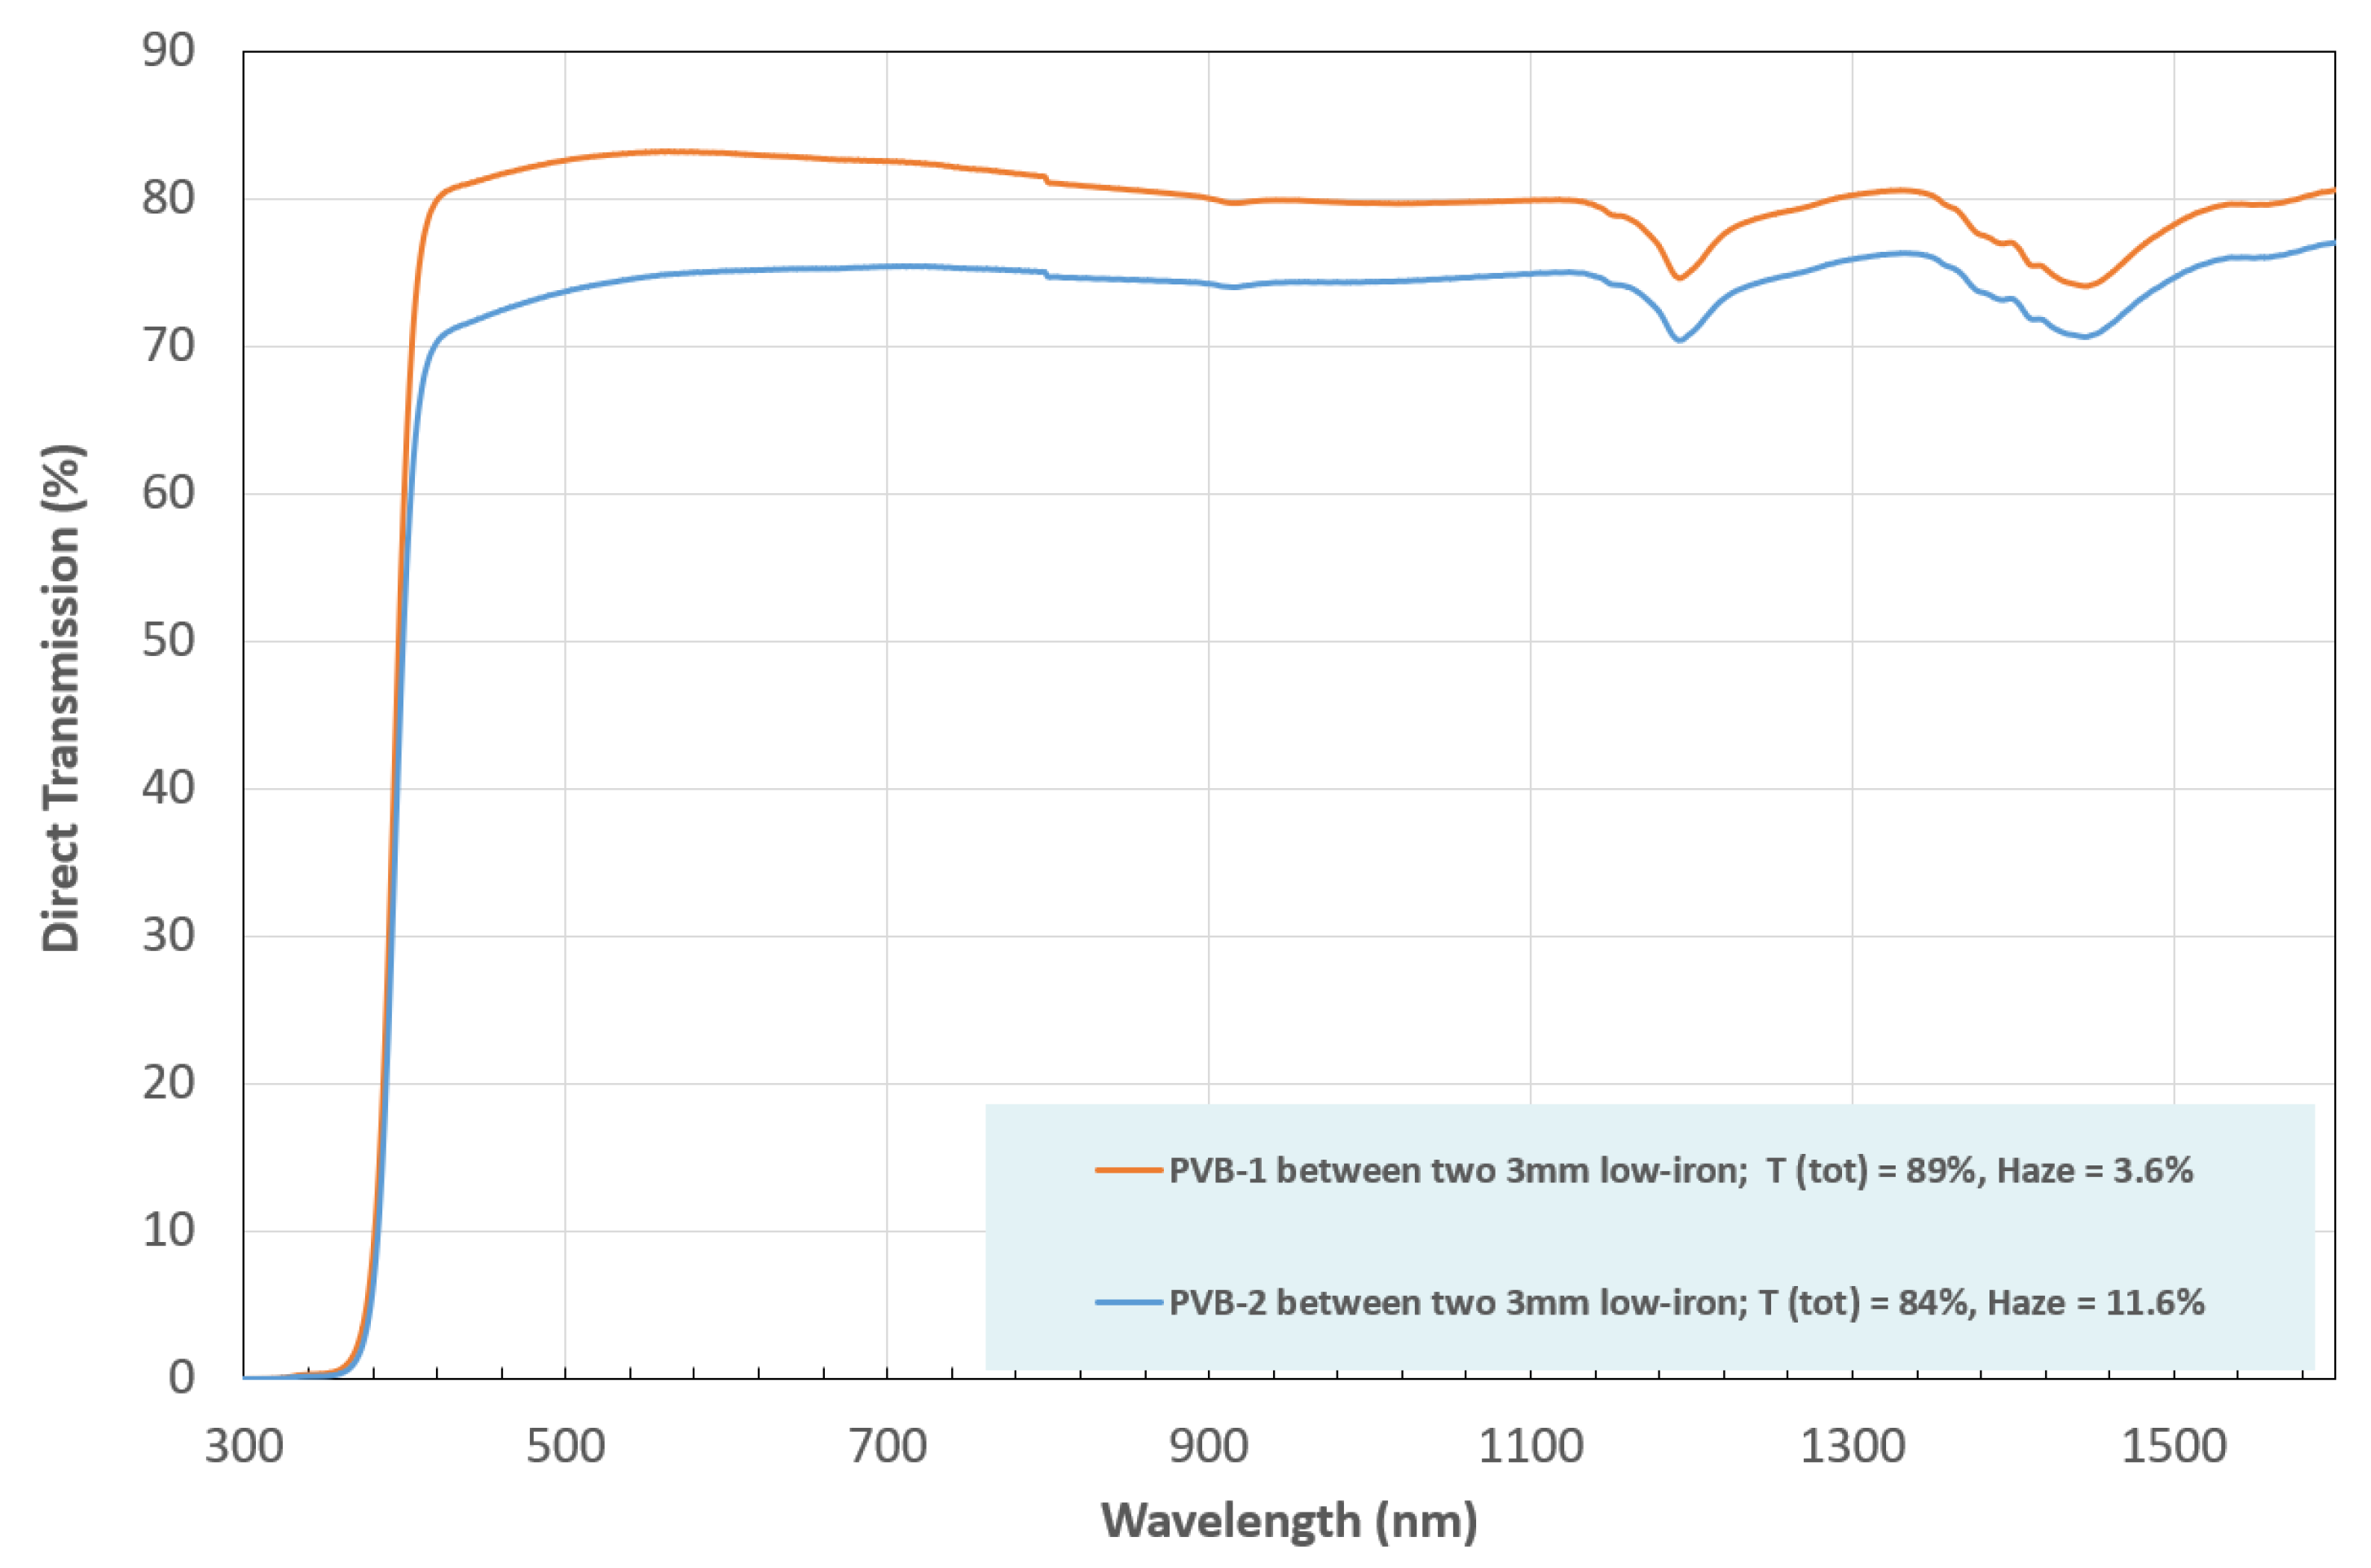
During the initial (pre-installation) field testing of all windows conducted at Murdoch Campus in February 2021 in outdoor natural-sunlight conditions, the performance differences between three different window design types were noted, even though testing at standard test conditions (STC) could not be then performed, and the prior factory tests revealed only marginal (few %) peak power-output performance differences when measured at normal incidence angle. The measured optical transmission spectra and haze characteristics of thin low-iron glass samples laminated with either the “PVB-1”, or “PVB-2” (Figure 8) confirm that “PVB-2” interlayers induce significantly more light scattering over a very broad spectral band (evident from the measurements of direct transmission, total transmission, and haze), and are also capable of absorbing a greater fraction of short-wavelength sunlight, compared to “PVB-1” interlayers. These findings were expected and correlated with the known (though not disclosed, for reasons of confidentiality) differences in photoluminescent material particle concentrations in different extruded PVB materials.
The following interlayer design differences related to the glazing design differences between grow-rooms 2, 3, and 4:
  • Room 2 windows used two slightly higher-haze, but identical interlayers (“PVB-2” + “PVB-2”);
  • Room 3 windows used two differently doped interlayers (“PVB-2” + “PVB-1”);
  • Room 4 windows used a single fluorescent interlayer (high-clarity “PVB-1”), with the other interlayer being “Ordinary PVB”.
Two PVB interlayers were needed to laminate the inner pane (integrated LSC-type panel) of each triple-glazed window system; each inner pane was itself composed of three 4 mm-thick low-iron glass plates.
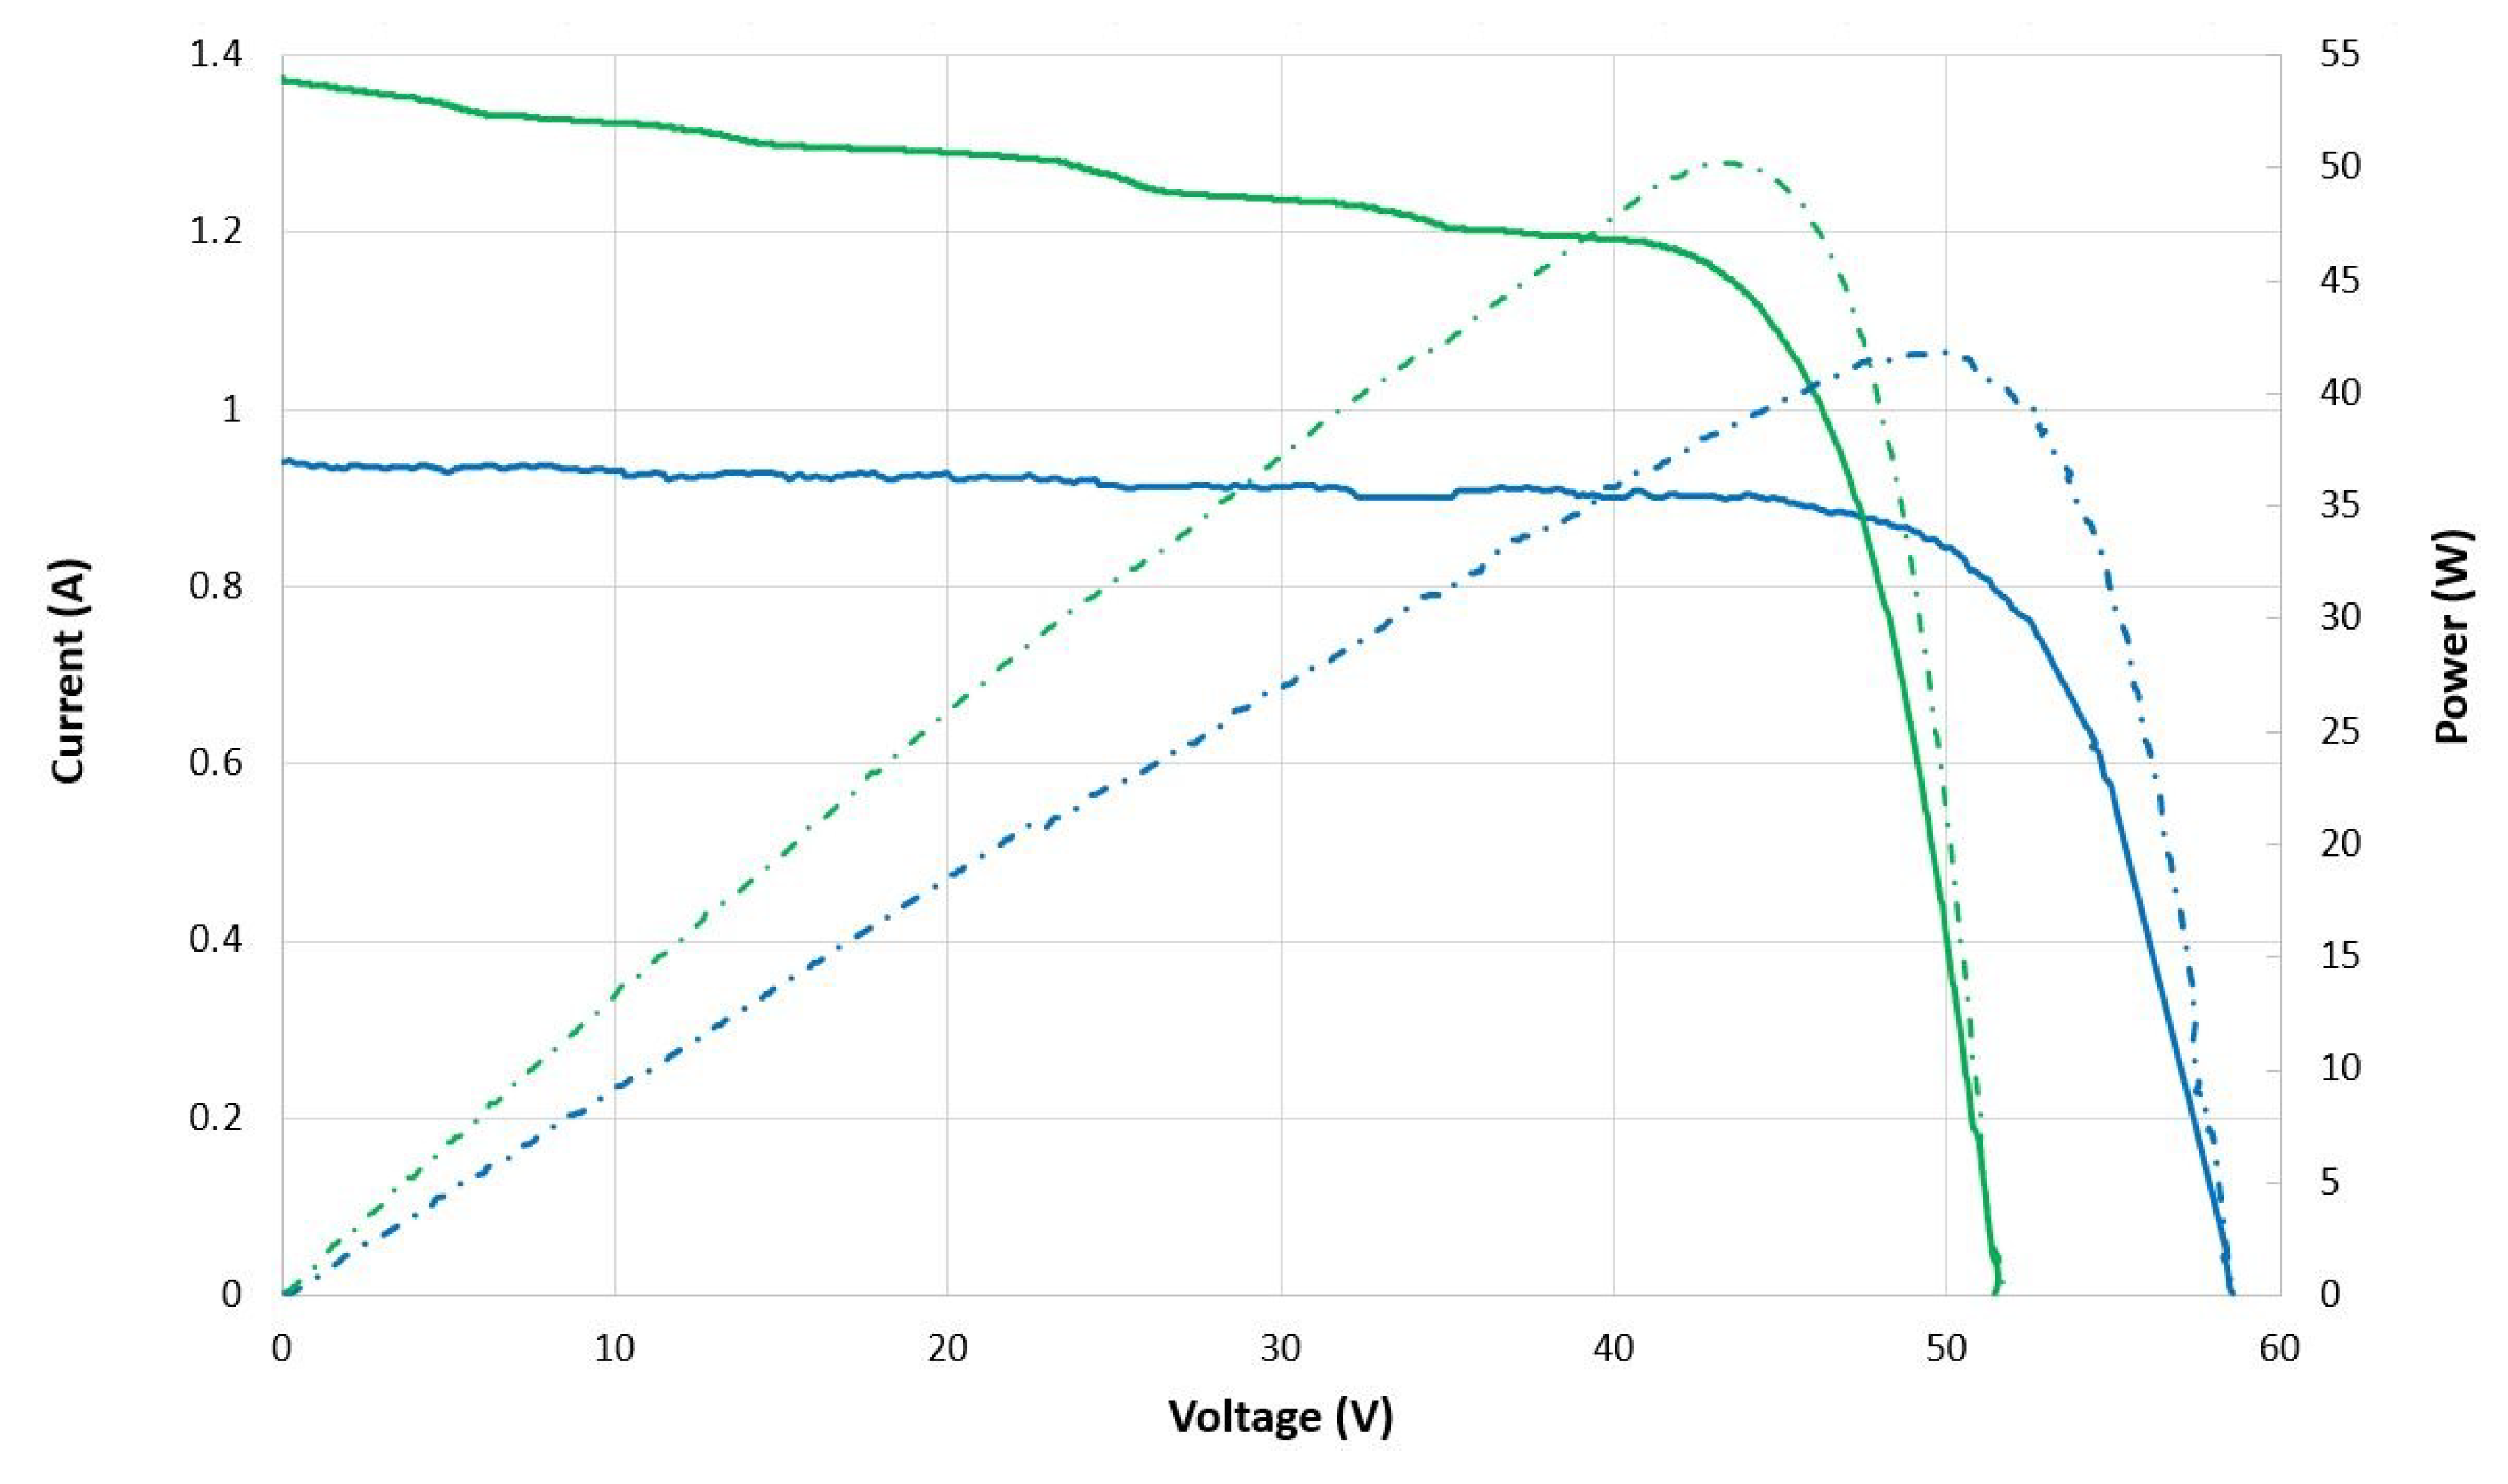
When measured at the optimized (by way of measuring the short-circuit current Isc) angles of incidence, and at peak outdoor sunlight irradiation during summer, the windows (expectedly) showed the same open-circuit voltages near 61 V; however, the measured Isc values differed systematically from ~840–860 mA in windows of Room 4 design, to ~950–980 mA in windows of Rooms 2 and 3. Therefore, the solar energy harvesting performance was initially expected to differ systematically by up to ~10% between the extremely-low-haze Room 4 and other ClearVue rooms 2 and 3, which used denser concentrations of functional materials in lamination interlayers.
Initial monthly PV production output comparisons made between the different rooms of the greenhouse during the winter of 2021 have revealed that an average (including all wall- and roof-mounted windows) north-oriented window in Room 3 generated up to ~4.46% more energy in July 2021, compared with Room4. During the same observation period, Room 3 windows have also produced approximately 1.46% more energy, compared with Room 2.
Due to the interlayer design differences being rather small (a small fraction of 1 wt% in the active materials concentration differences between different PVB types), a more conclusive evaluation of design-dependent window performance differences must be performed, based on the results of longer-term studies including the detailed analysis of seasonally dependent data trends. It was expected that energy harvesting performance differences between different interlayer types will be magnified during summer months, at higher sunlight intensities and at larger noon-time incidence angles of solar radiation onto wall windows. It can also be expected that the performance differences (however small) will be seen clearer from longer-term cumulative energy output observations.
Summer (December 2021) north-wall windows energy generation trends by windows of different designs were also studied. Active materials inside interlayers are expected to receive much stronger fluorescence excitation intensities during the summer months and therefore should respond stronger in terms of redistributing a fraction of incident light energy inside glazing structures. The roof-mounted windows did not show any substantial (exceeding several %) monthly energy harvesting differences between the three rooms during the summer season, as opposed to the wall windows, which may be related to the effects of stronger glass contamination, compared to wall-mounted windows. This contamination was expected to occur, due to the greenhouse location being close to other agricultural facilities operating in the open field and producing some dust emissions; Perth climate also features strong winds frequently. During the autumn and winter months, the roof windows of Room 3 have outperformed the roof windows of rooms 2 and 4; it is possible that the rains provided some surface cleaning effects, removing the dust contamination from the glass. Additionally, the window energy performance differences were expected to be maximized during the conditions where maximum-intensity near-noon sunlight is incident onto glass at a large oblique angle, and these conditions occurred more frequently on wall areas during summer months. The wall-based summer-time per-window energy output trends were different from what was originally expected (e.g., a denser double-interlayer of Array J in Room 2 has previously produced the largest recorded (of all wall arrays) winter-time per-window energy harvest of up to ~153 Wh/window/day in June of 2021, but the same array (J) was also generating around 50% of the daily energy output, compared to Array F during December 2021. Longer-term observations of the per-window energy yield differences between the different wall-mounted arrays made between April 2021 and October 2022 have revealed that the windows of Array J (Room 2) generated ~5.6% less total energy than the wall windows of Room 4. At the same time, the minimum long-term energy-harvesting outperformance of Room 3 wall windows, compared with Room 4 (wall windows of Array C), was ~12%. This figure also correlates well with the original field performance evaluation tests made prior to the installation of solar windows into the greenhouse structure.
The long-term differences between the best-performing roof-mounted solar window arrays measured as lifetime energy generation figures reported between April 2021 and 8 March 2023 were as follows (Table 2):
Even though the long-term data-logged outperformance of Array G over Array E was only ~2.92%, it is still a noticeable figure, considering the correlated higher performance of Room 3 wall windows, and other factors that were reducing the design-dependent performance differences for roof arrays particularly the contamination and higher glass and solar-cell temperatures affecting the peak-time performance of roof windows.
The data observations made it clear that different solar window designs have shown rather different energy harvesting behaviors, and that a multi-season extended study of energy harvesting outputs was still required to uncover the details of energy production differences. We developed custom methodologies for the investigation of window performance differences observed in correlation with varying solar geometry angles, seasonal sunlight intensity variations, and varying weather conditions.
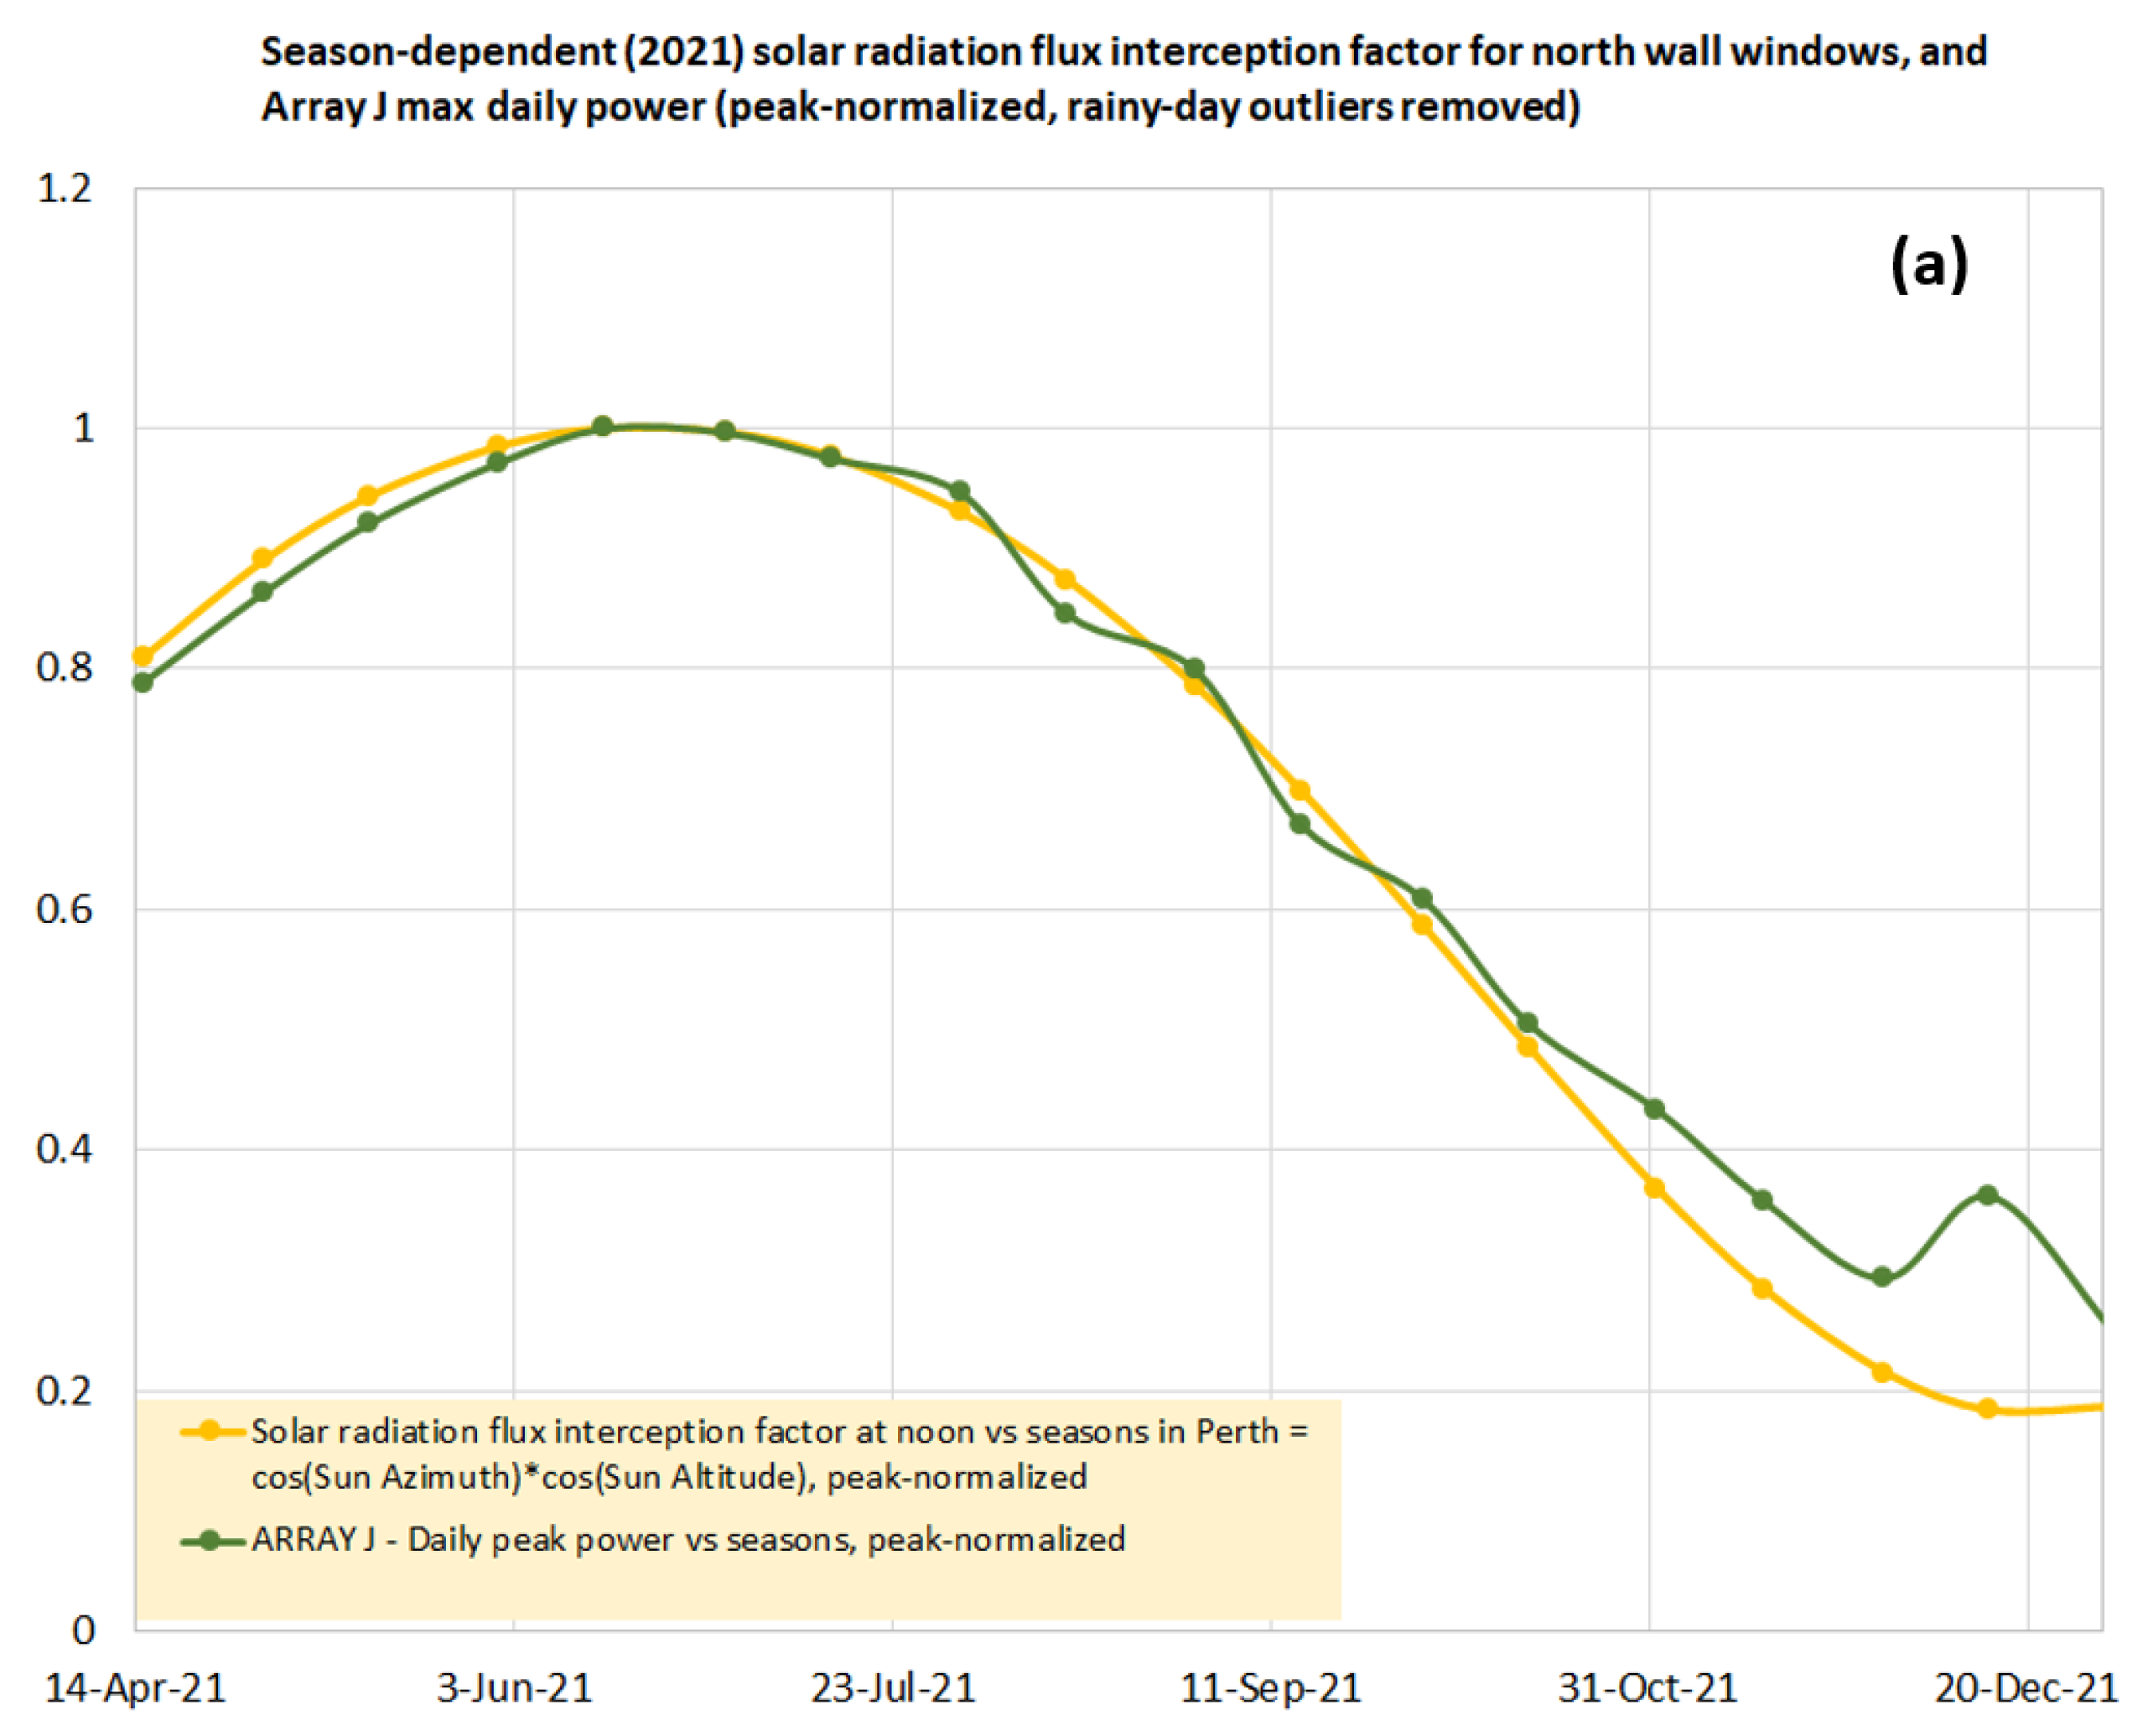
In order to systematically evaluate the design-dependent solar window performance differences, it is necessary to devise a way of comparing both the short-term (daily) and the long-term (seasonal) energy harvesting performances, which would minimize the effects of random variables on measurements such as glass surface contamination, intermittent shading, or window assembly quality variations. In lab conditions, an extended PV metrology study would be required to address all issues, documenting the exact (array-averaged) power generation outputs of all window types at all possible simulated solar radiation incidence conditions (at 25C, STC, AM1.5G standard solar spectrum), involving both the horizontal and vertical incidence angle variations across their full range. But the measured performance differences of different window types are more of interest to be measured in the “real-world” conditions, which also include the atmospheric path, air temperature, sunlight intensity, and weather conditions variations. It is possible to study the energy harvesting behaviors of different window types installed in greenhouses by way of correlating the year-long recorded maximum daily window-array power outputs (obtained at near noontime on each day), with the total solar radiation flux incident onto window-array surfaces, which is dependent on near-noon solar geometry and calendar date. Plotting the yearly peak-normalized maximum array daily power outputs versus the peak-normalized solar radiation flux interception factor by the installation plane of solar windows will reveal whether the maximum solar radiation energy intercepted by any window is the only factor governing the maximum electric output of PV windows at any possible combination of the angles of incidence and weather conditions, or if there exist any other, window design-related factors, which also affect the window efficiency in any particular conditions.
The date/time-dependent solar geometry (astronomy) data for the local noon-time Sun Altitude and Sun Azimuth angles are available from [31]; the data for the solar-angle and installation-angle-dependent solar radiation intensity falling onto arbitrarily oriented tilted window surfaces are readily available by using the relevant formula (Equation (1)) published in [32].
Smodule = Sincident ∗ {cos(α) ∗ sin(β) ∗ cos(ψ − ϴ) + sin(α) ∗ cos(β)},
where α is the sun elevation angle, β is the module tilt angle, Θ is the sun azimuth angle, and Ψ is the azimuth angle that the module faces. Smodule and Sincident are the direct-component light intensities on the module and of the incoming light in W/m2, respectively. The simplest case for the Southern hemisphere is the vertical wall of PV modules directly facing the North direction (azimuth angle 0 degrees, tilt 90 degrees). In order to remove the peak-power variations induced by intermittent clouds and/or rainy-day effects (weather outliers), it is possible to plot the maximum recorded array output power observed within 1 h from noon (12 pm), during a time period within ±3 days from any selected day on a fixed dates-grid (arranged as follows: 1 January, 15 January, 1 January, 15 January, ….). Due to noon-time solar geometry angles changing slowly with the calendar dates, this method effectively reveals the yearly power generation trends for plotting against the solar flux interception factor. 
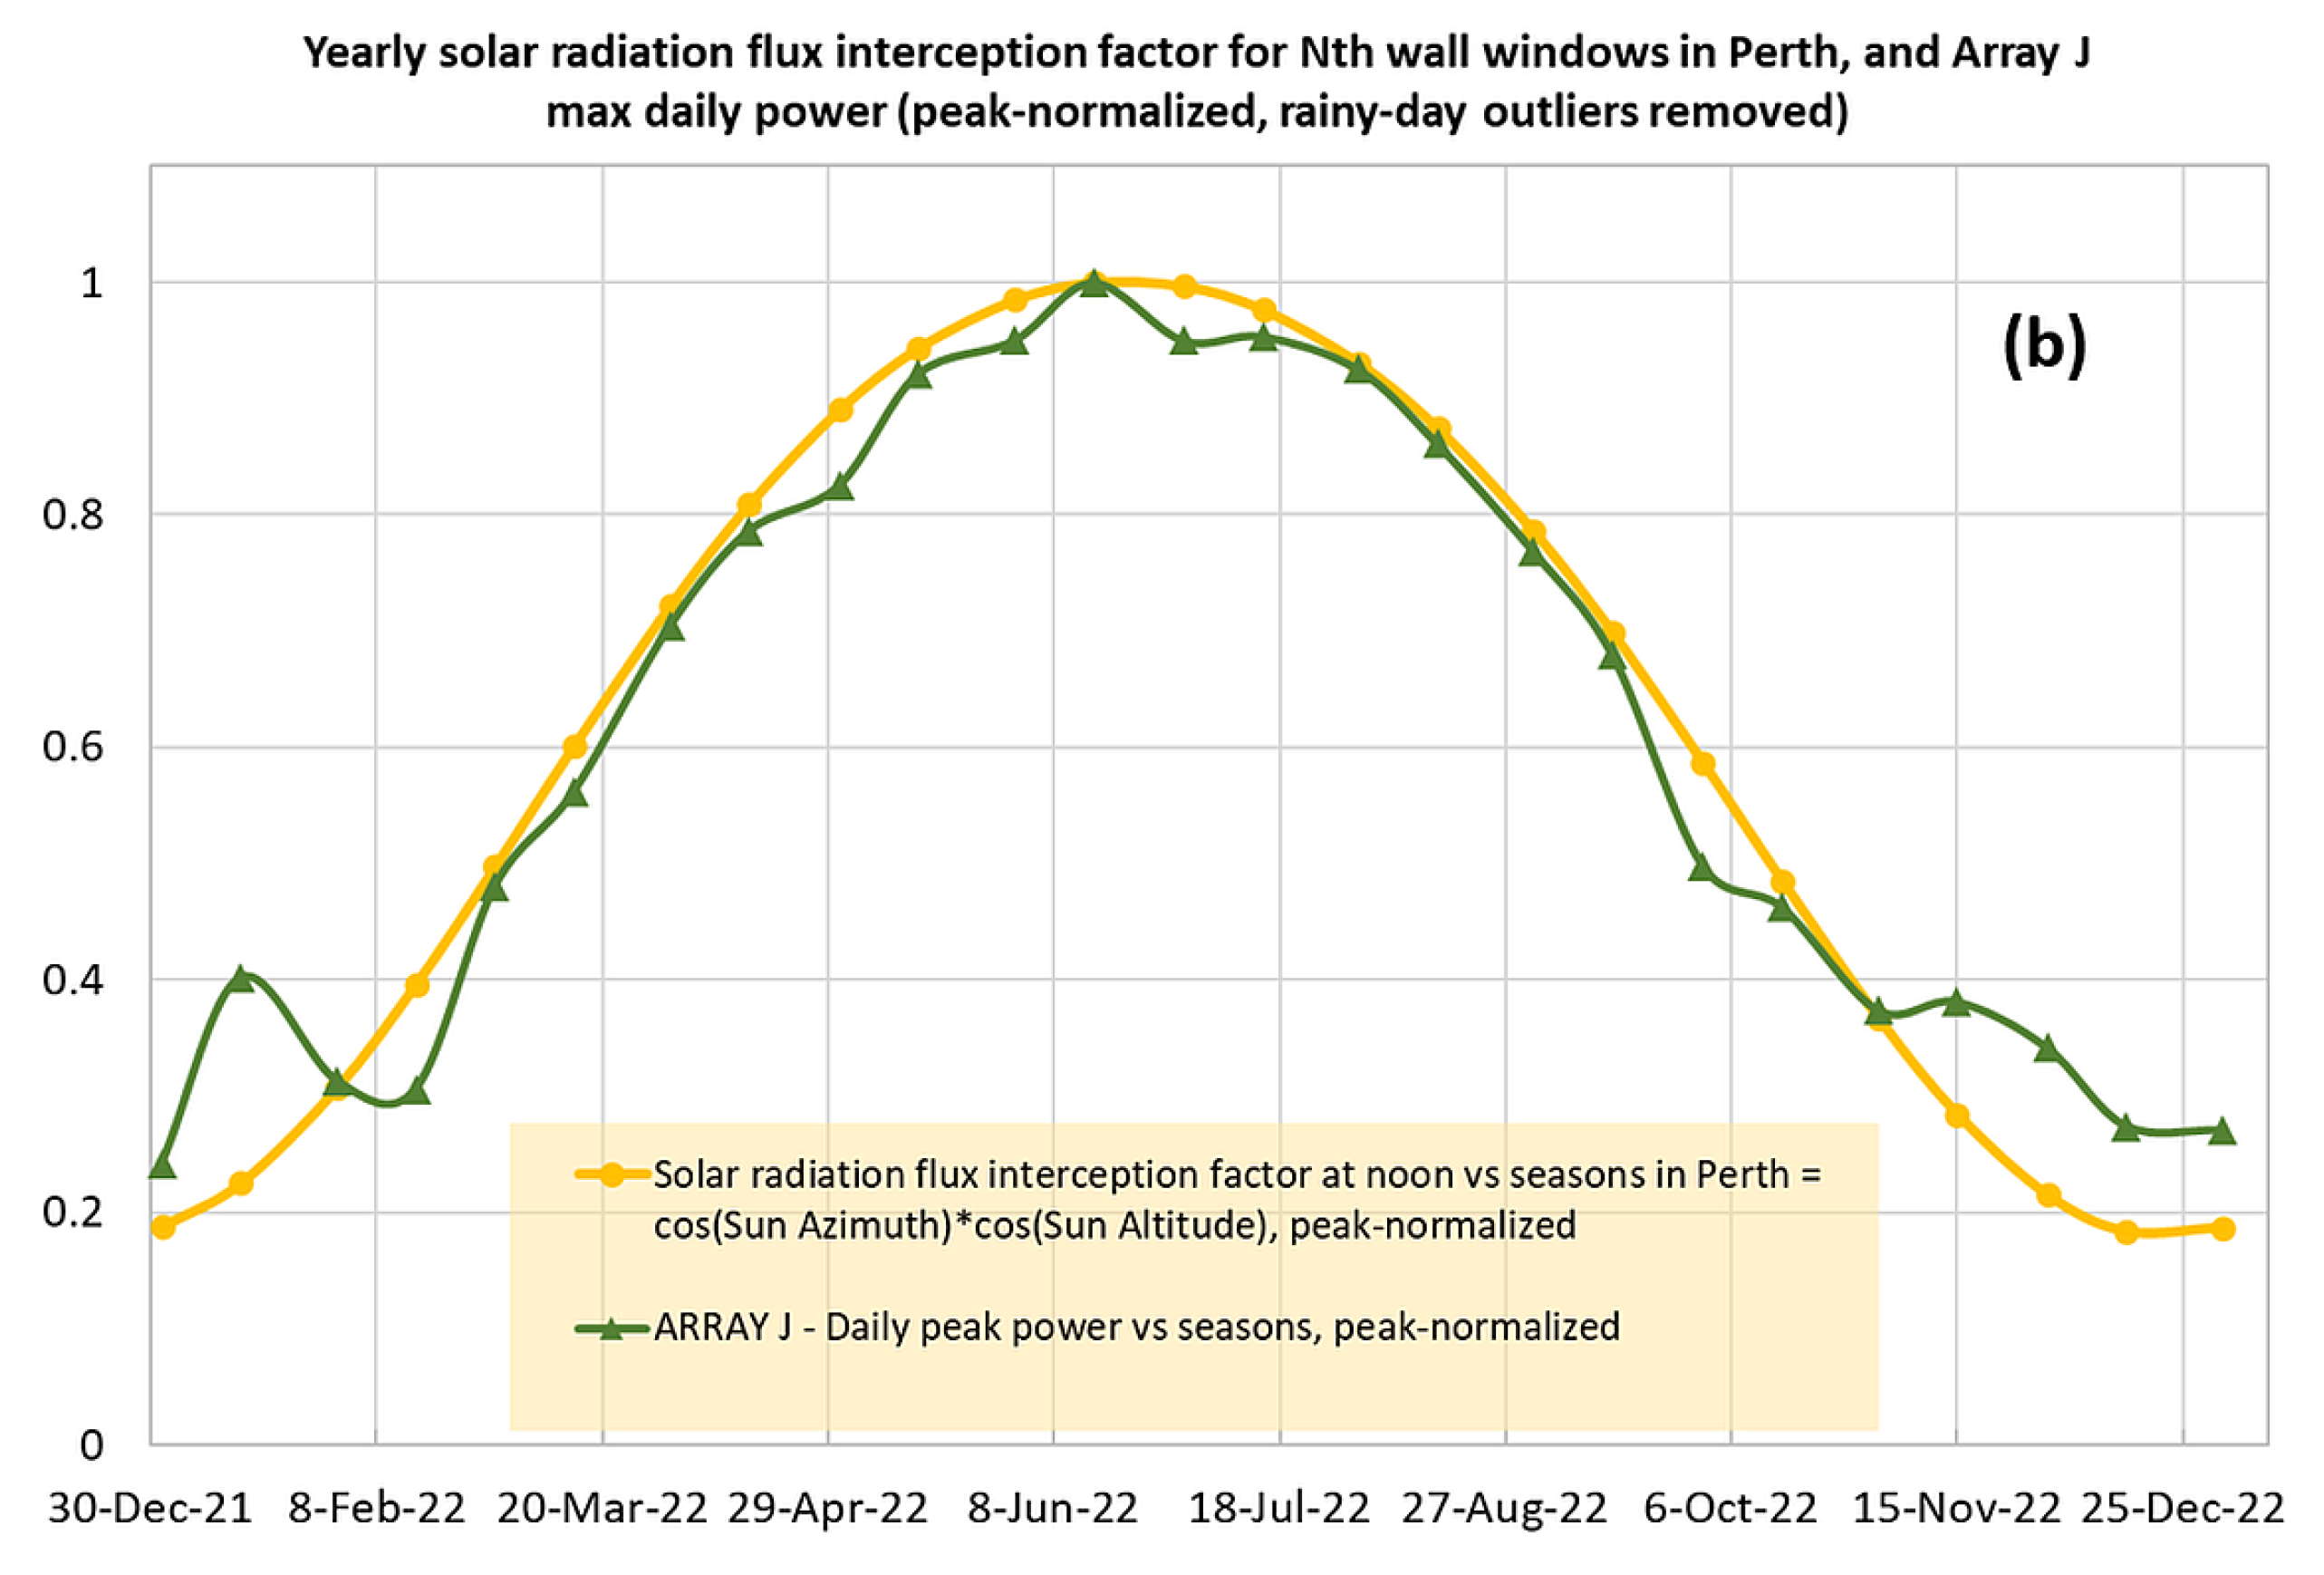
Figure 9 shows the highly correlated datasets obtained using the power generation data from Array J. The data are plotted for both 2021 and 2022, and the array power data correlations with the incident solar radiation flux component variations remained apparent throughout years.
The close correlation between the two datasets plotted in Figure 9 during most of the seasons is remarkable, and the departures from the close correlation of data during the summer months are also notable. Higher air temperatures and solar-cell surface temperatures expected during summer months would have normally reduced the max. daily power output of any conventional PV modules. Strong increases in the UV index in summer also would not fully account for the daily-maximum power improvements in conventional PV due to the low responsivity of silicon cells at short wavelengths.
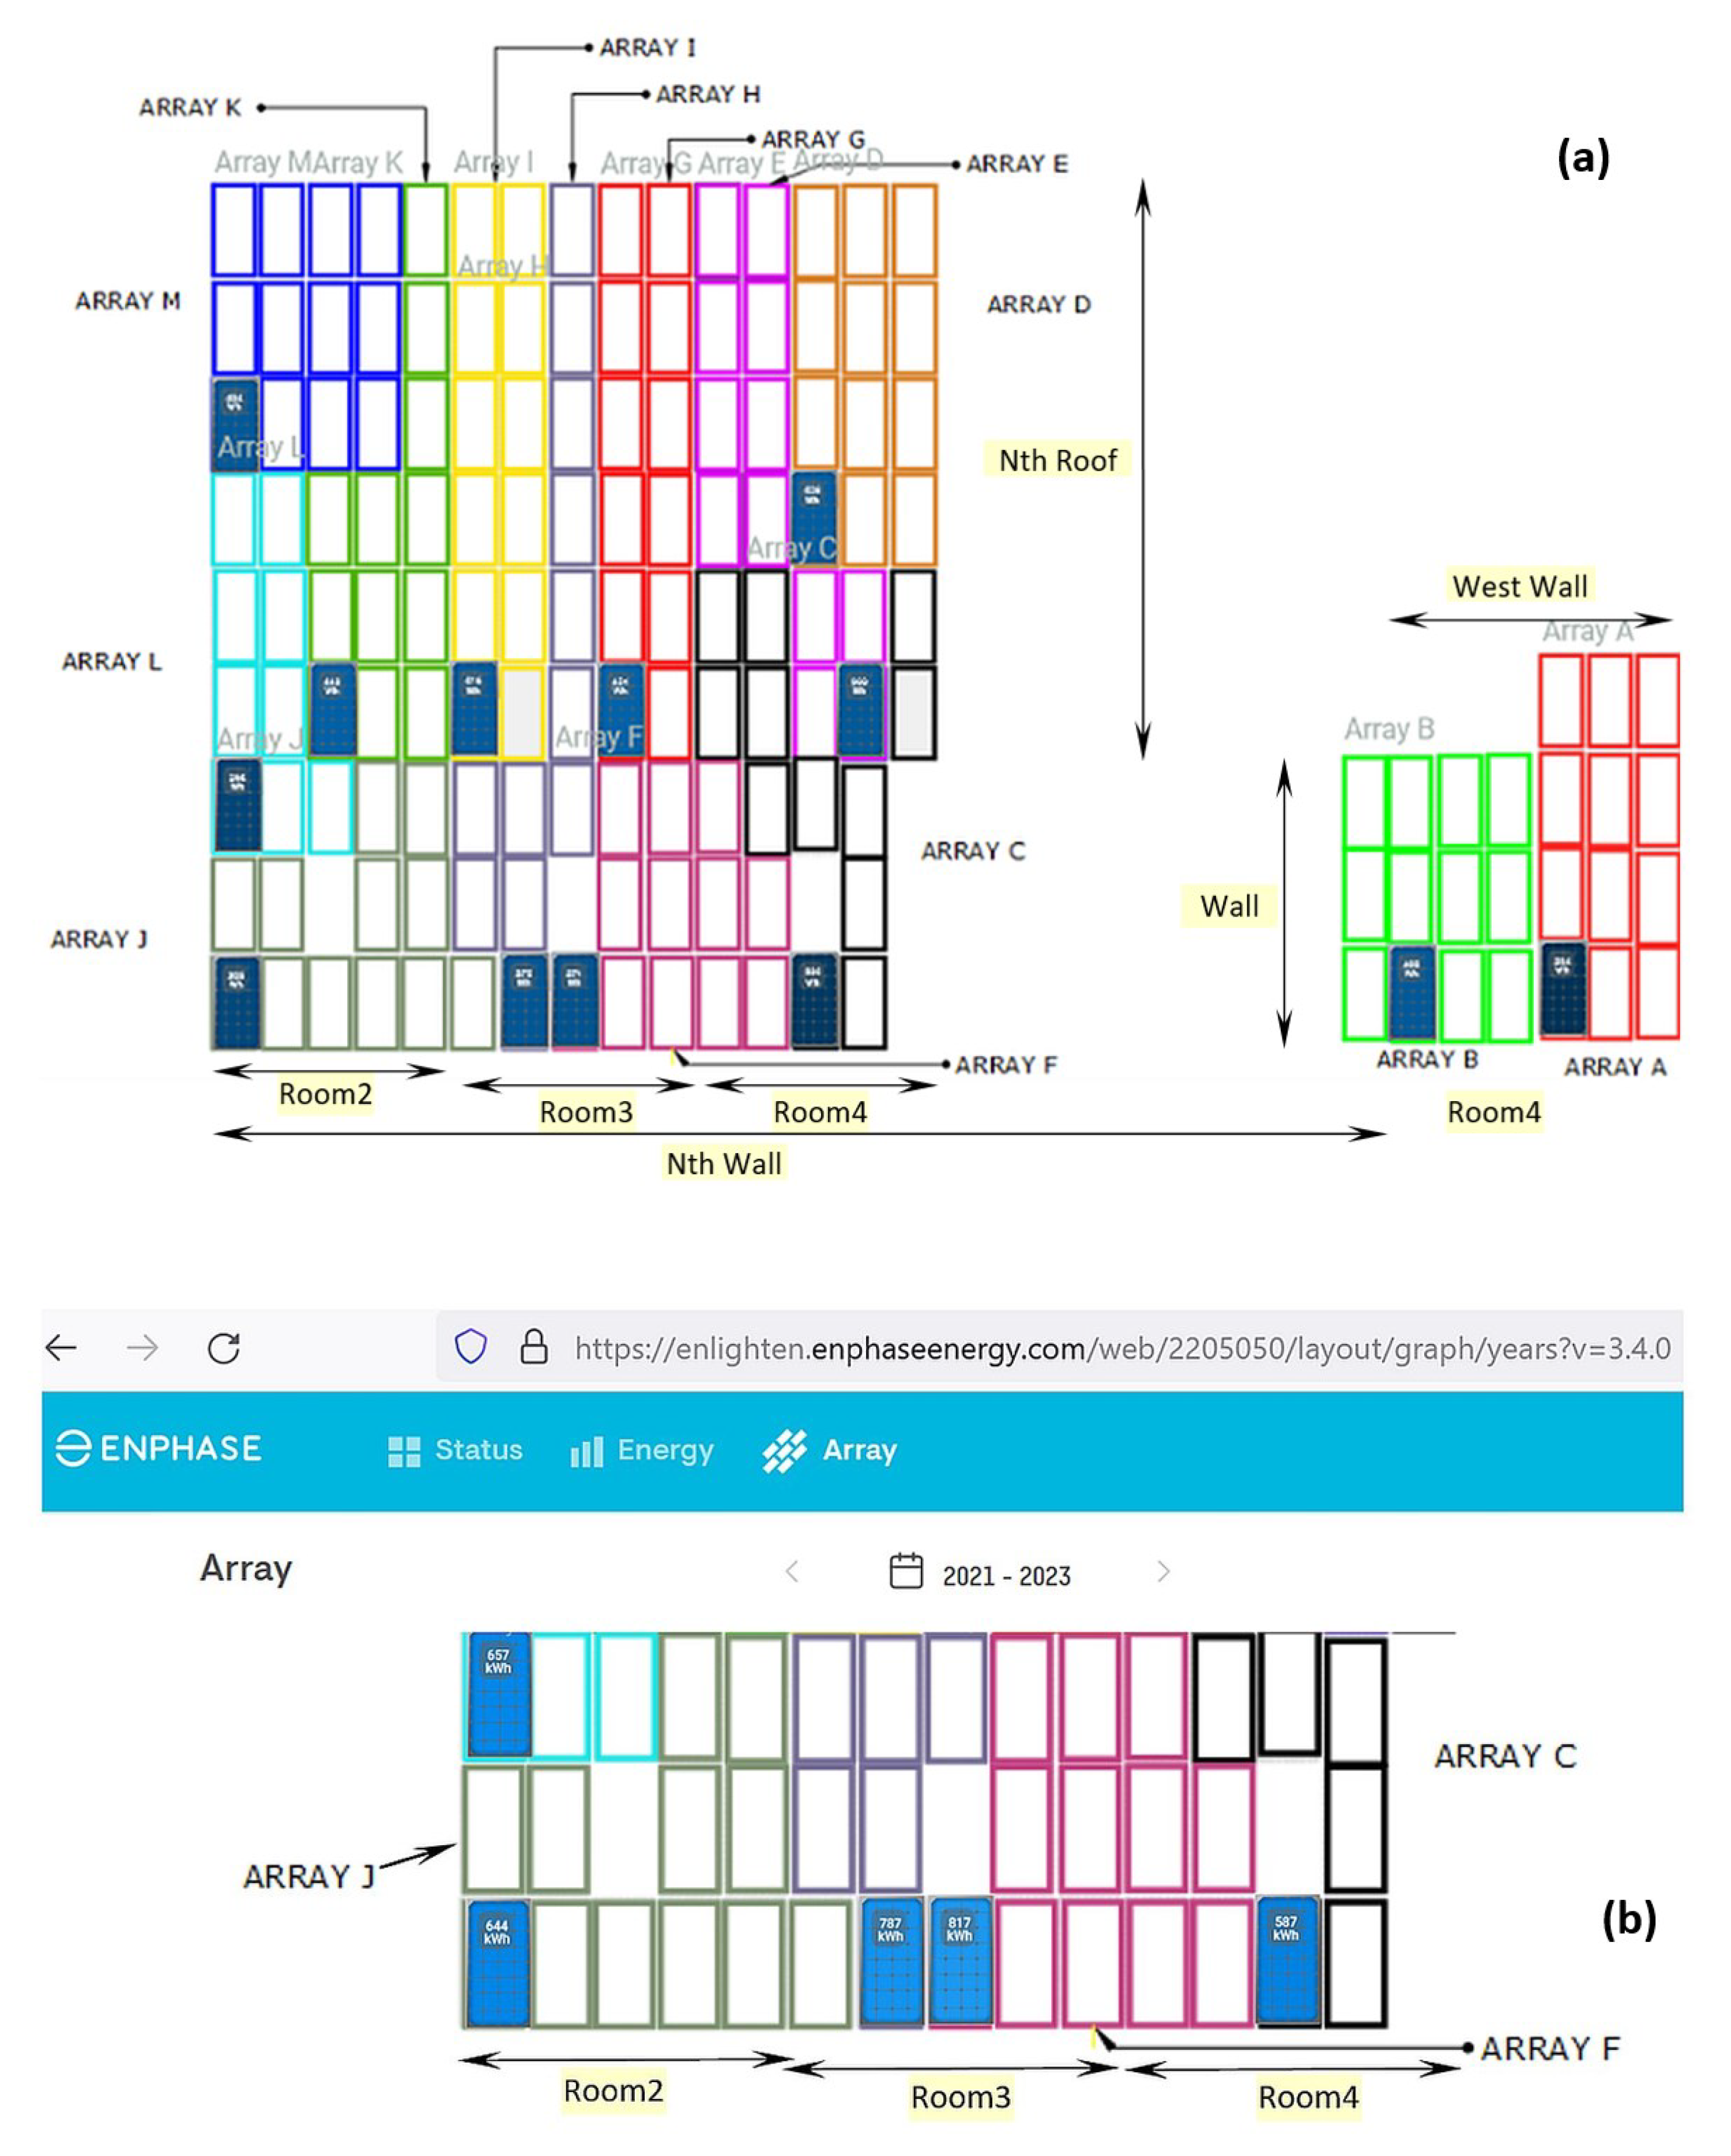
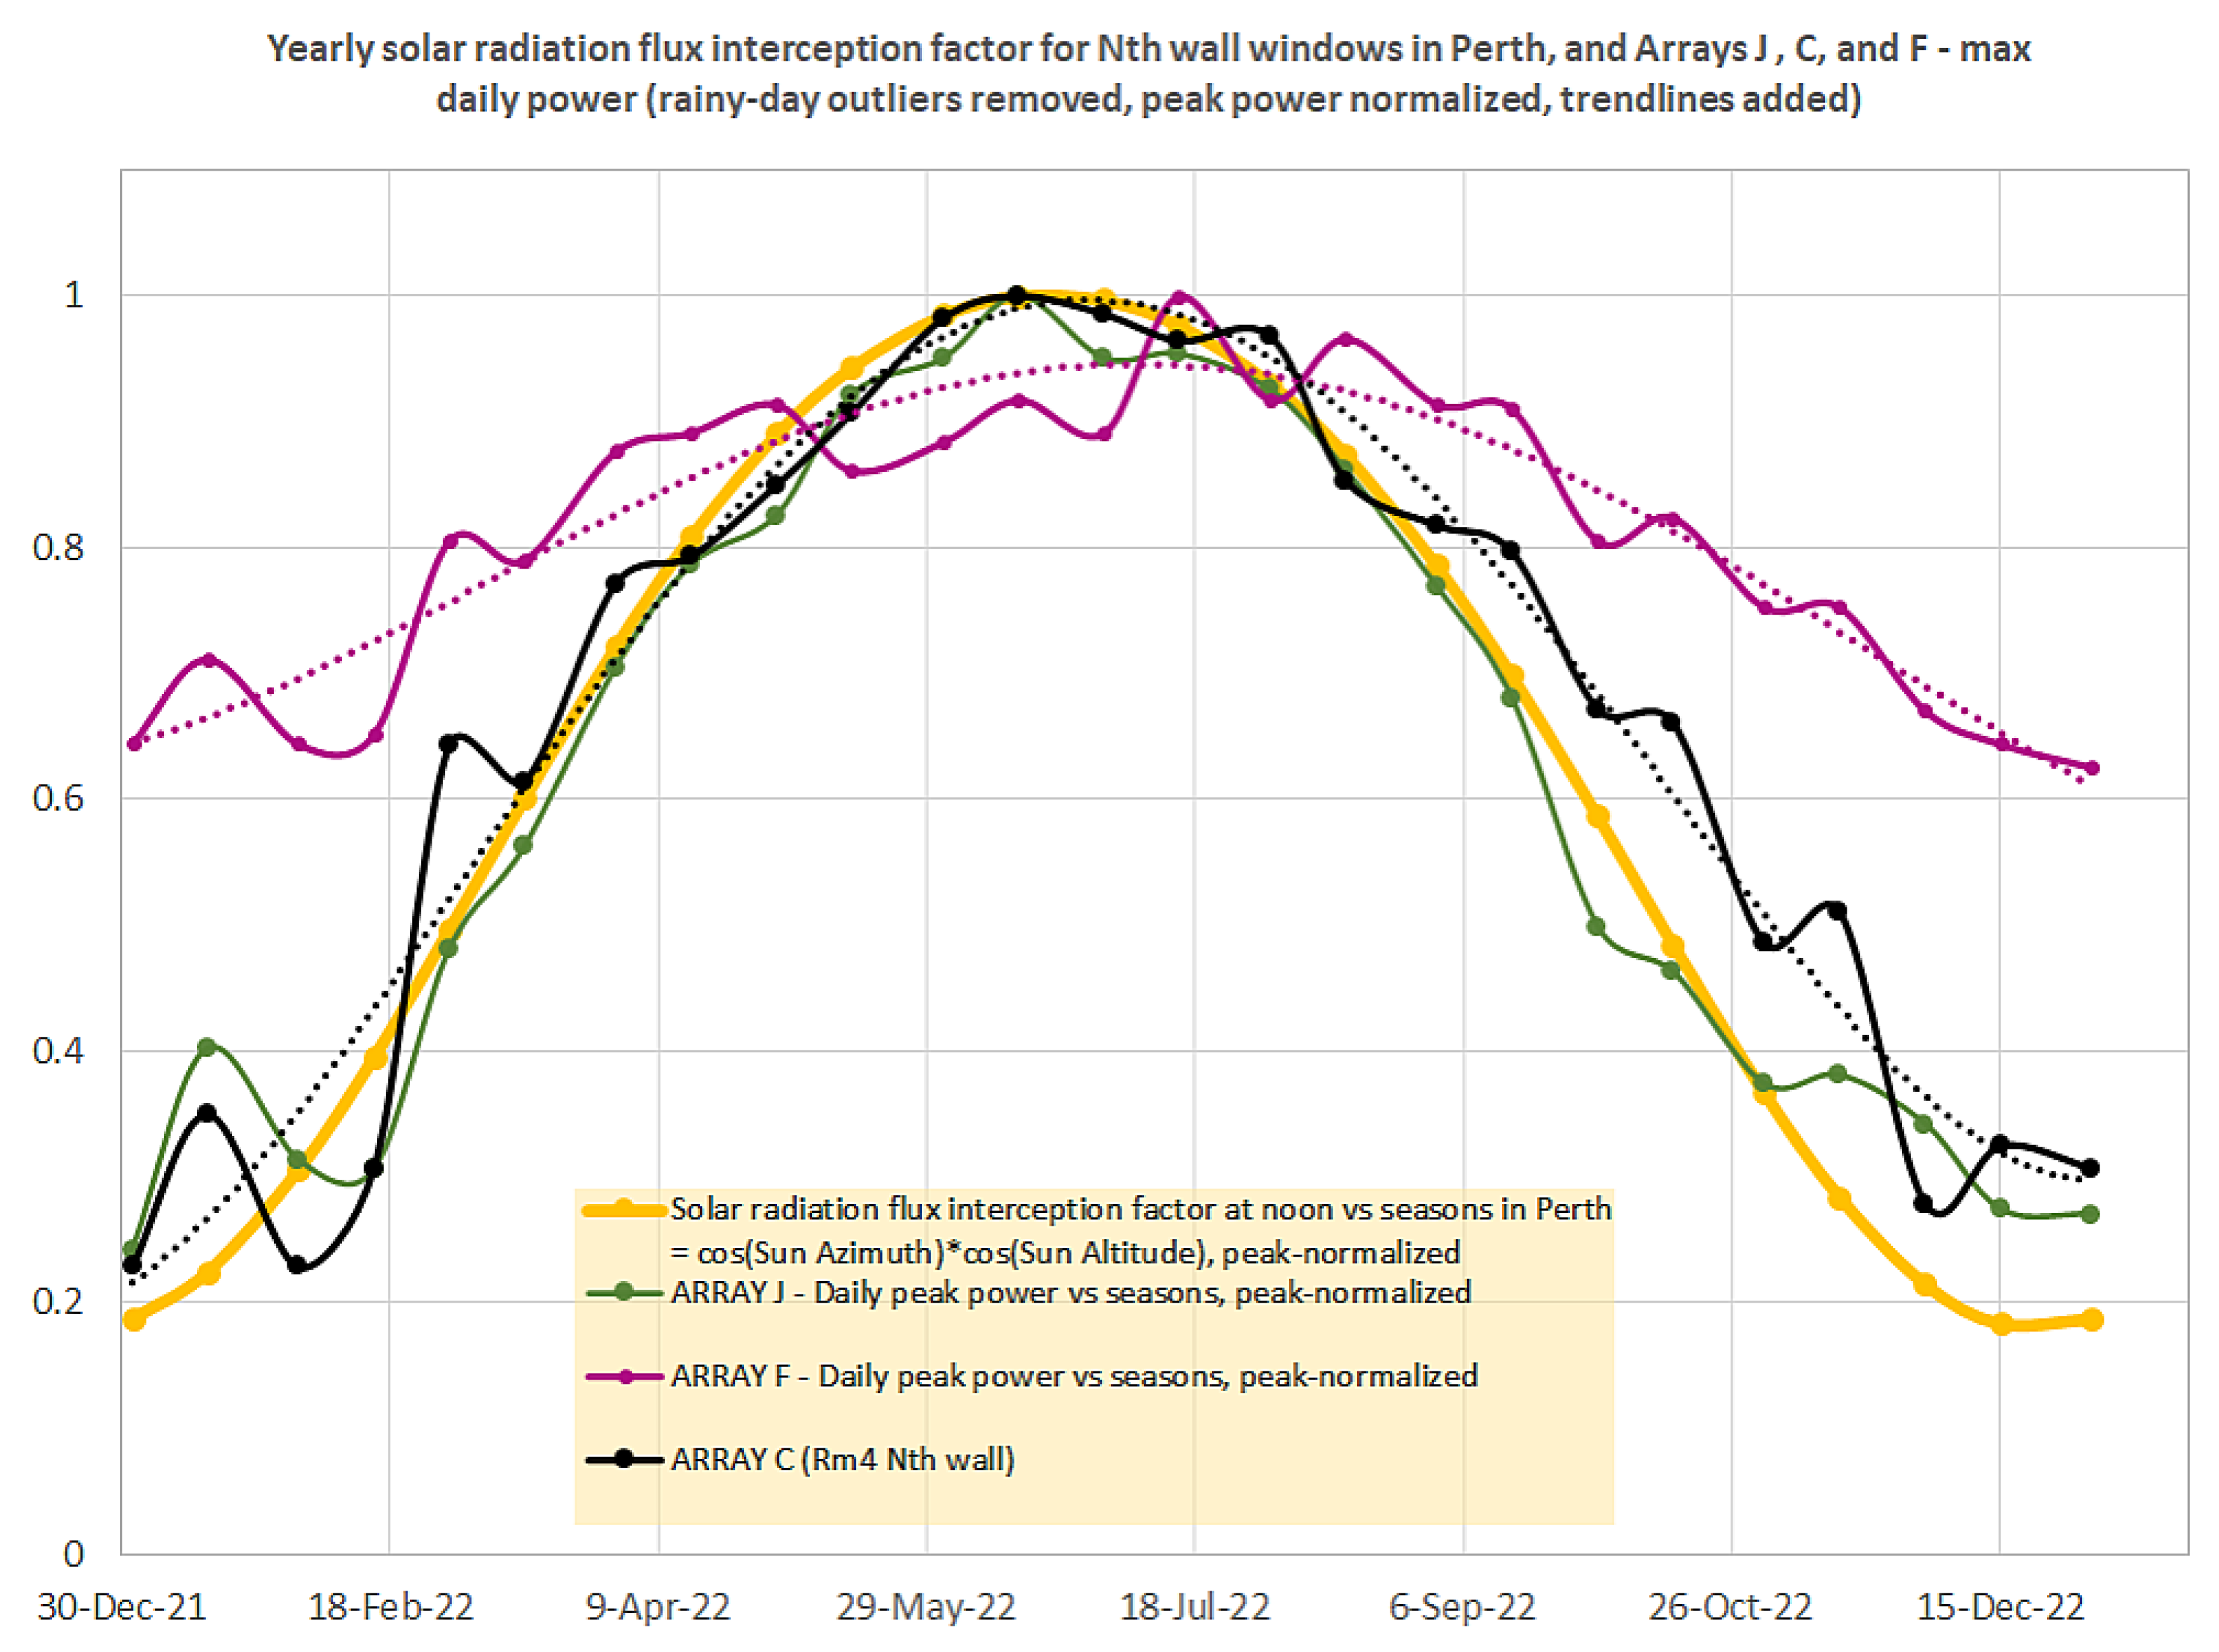
Figure 10 shows the same normalized solar flux-correlated daily peak power dependencies for all three north-facing wall-based arrays (J, C, and F); polynomial fitted trendlines are also added. PV array-specific data curves are color-coded using the same notation as array coloring codes in the diagram of Figure 3. The (minimum estimated) power output of the six wall-mounted windows of Array C were obtained by subtracting one half of the maximum nearby (Room 4) roof array output from the full measured Array C output. The resulting figures for Array C were then multiplied by two to compare the normalized data with the nearby 12-window wall-mounted arrays J and F.
It is notable that the peak-power trendlines of both other wall arrays (C and F) stay well above the solar flux interception curve throughout most of the warmer months, indicating weaker angular dependency of the power conversion efficiency, compared to Array J. The symmetry of all three window array datasets is still of the same character, with the normalized power generation peaking in winter (clearly correlated with the reducing Sun altitude angles near the winter solstice date) but dropping the power output at different rates with increasing Sun altitude angle in summer months. Even though more research may be required in this area, it is possible to evaluate the comparative trends in the energy harvesting behaviors of solar windows using this method. It is also possible to develop quantitative criteria for benchmarking the solar window performance characteristics versus the window design type using measured properties, e.g., the full width at half maximum (FWHM, measured in days) of the normalized maximum daily power generation curve of vertically mounted north-facing windows characterized over one year.
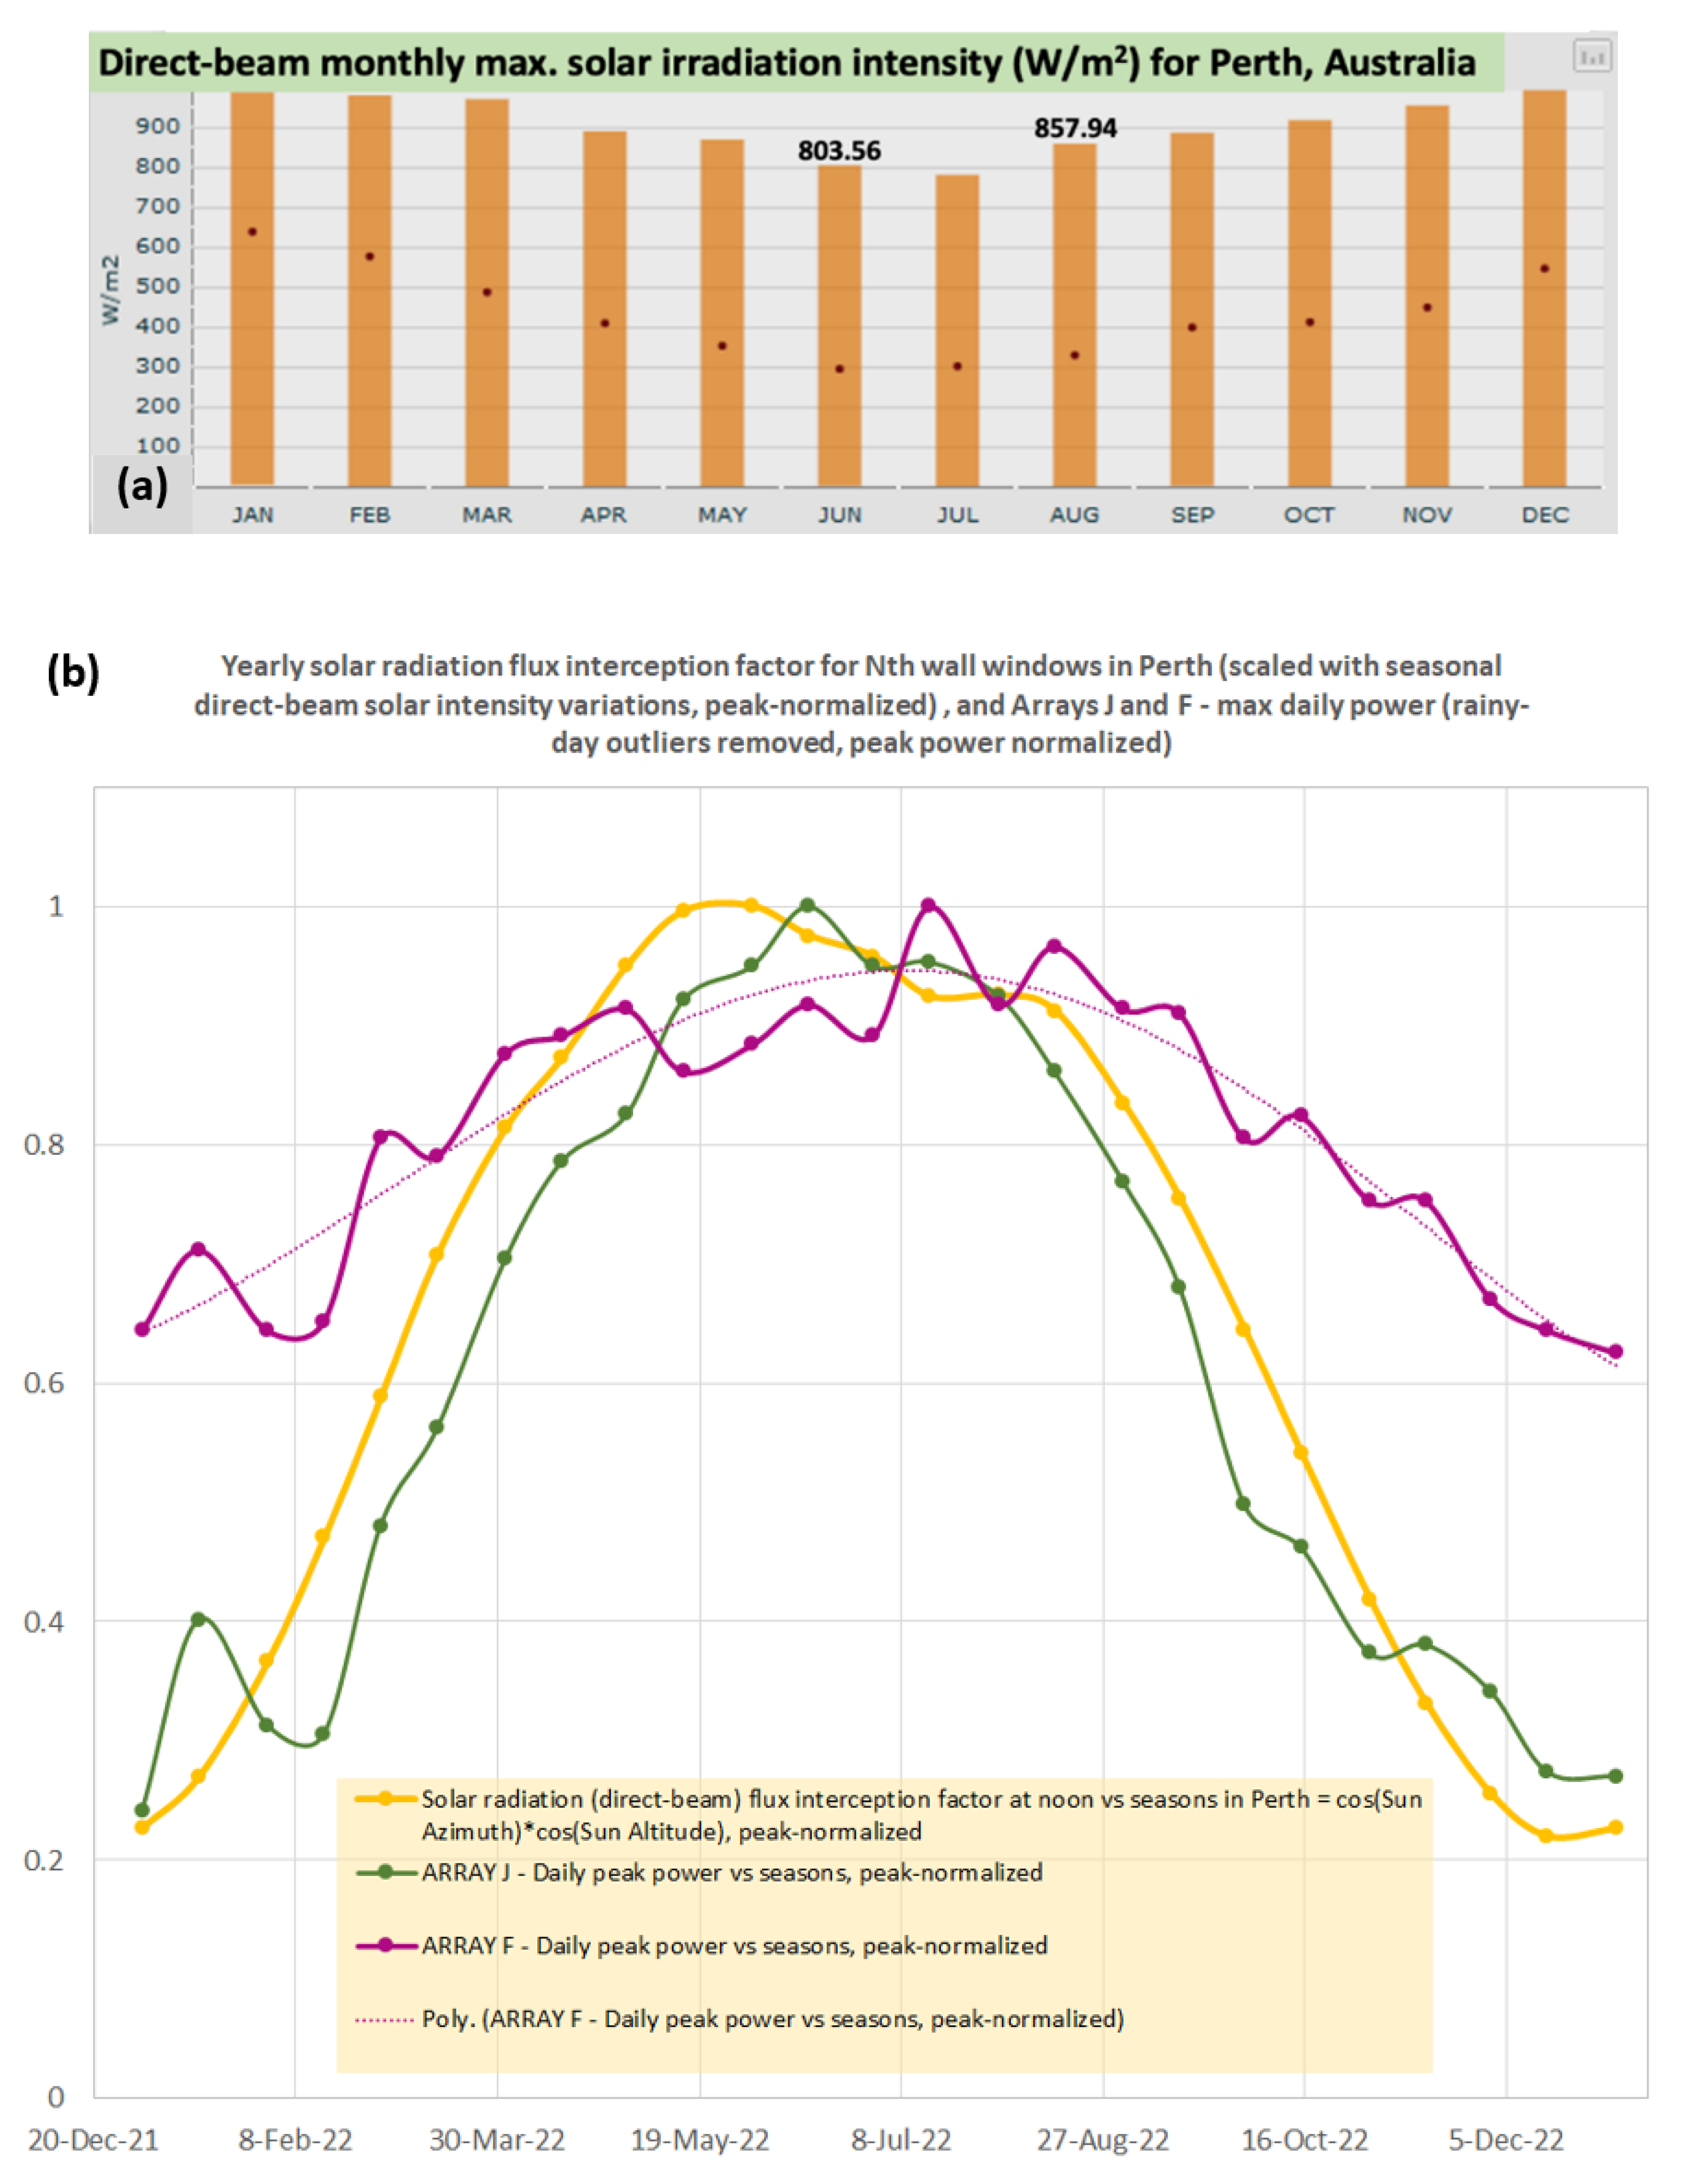
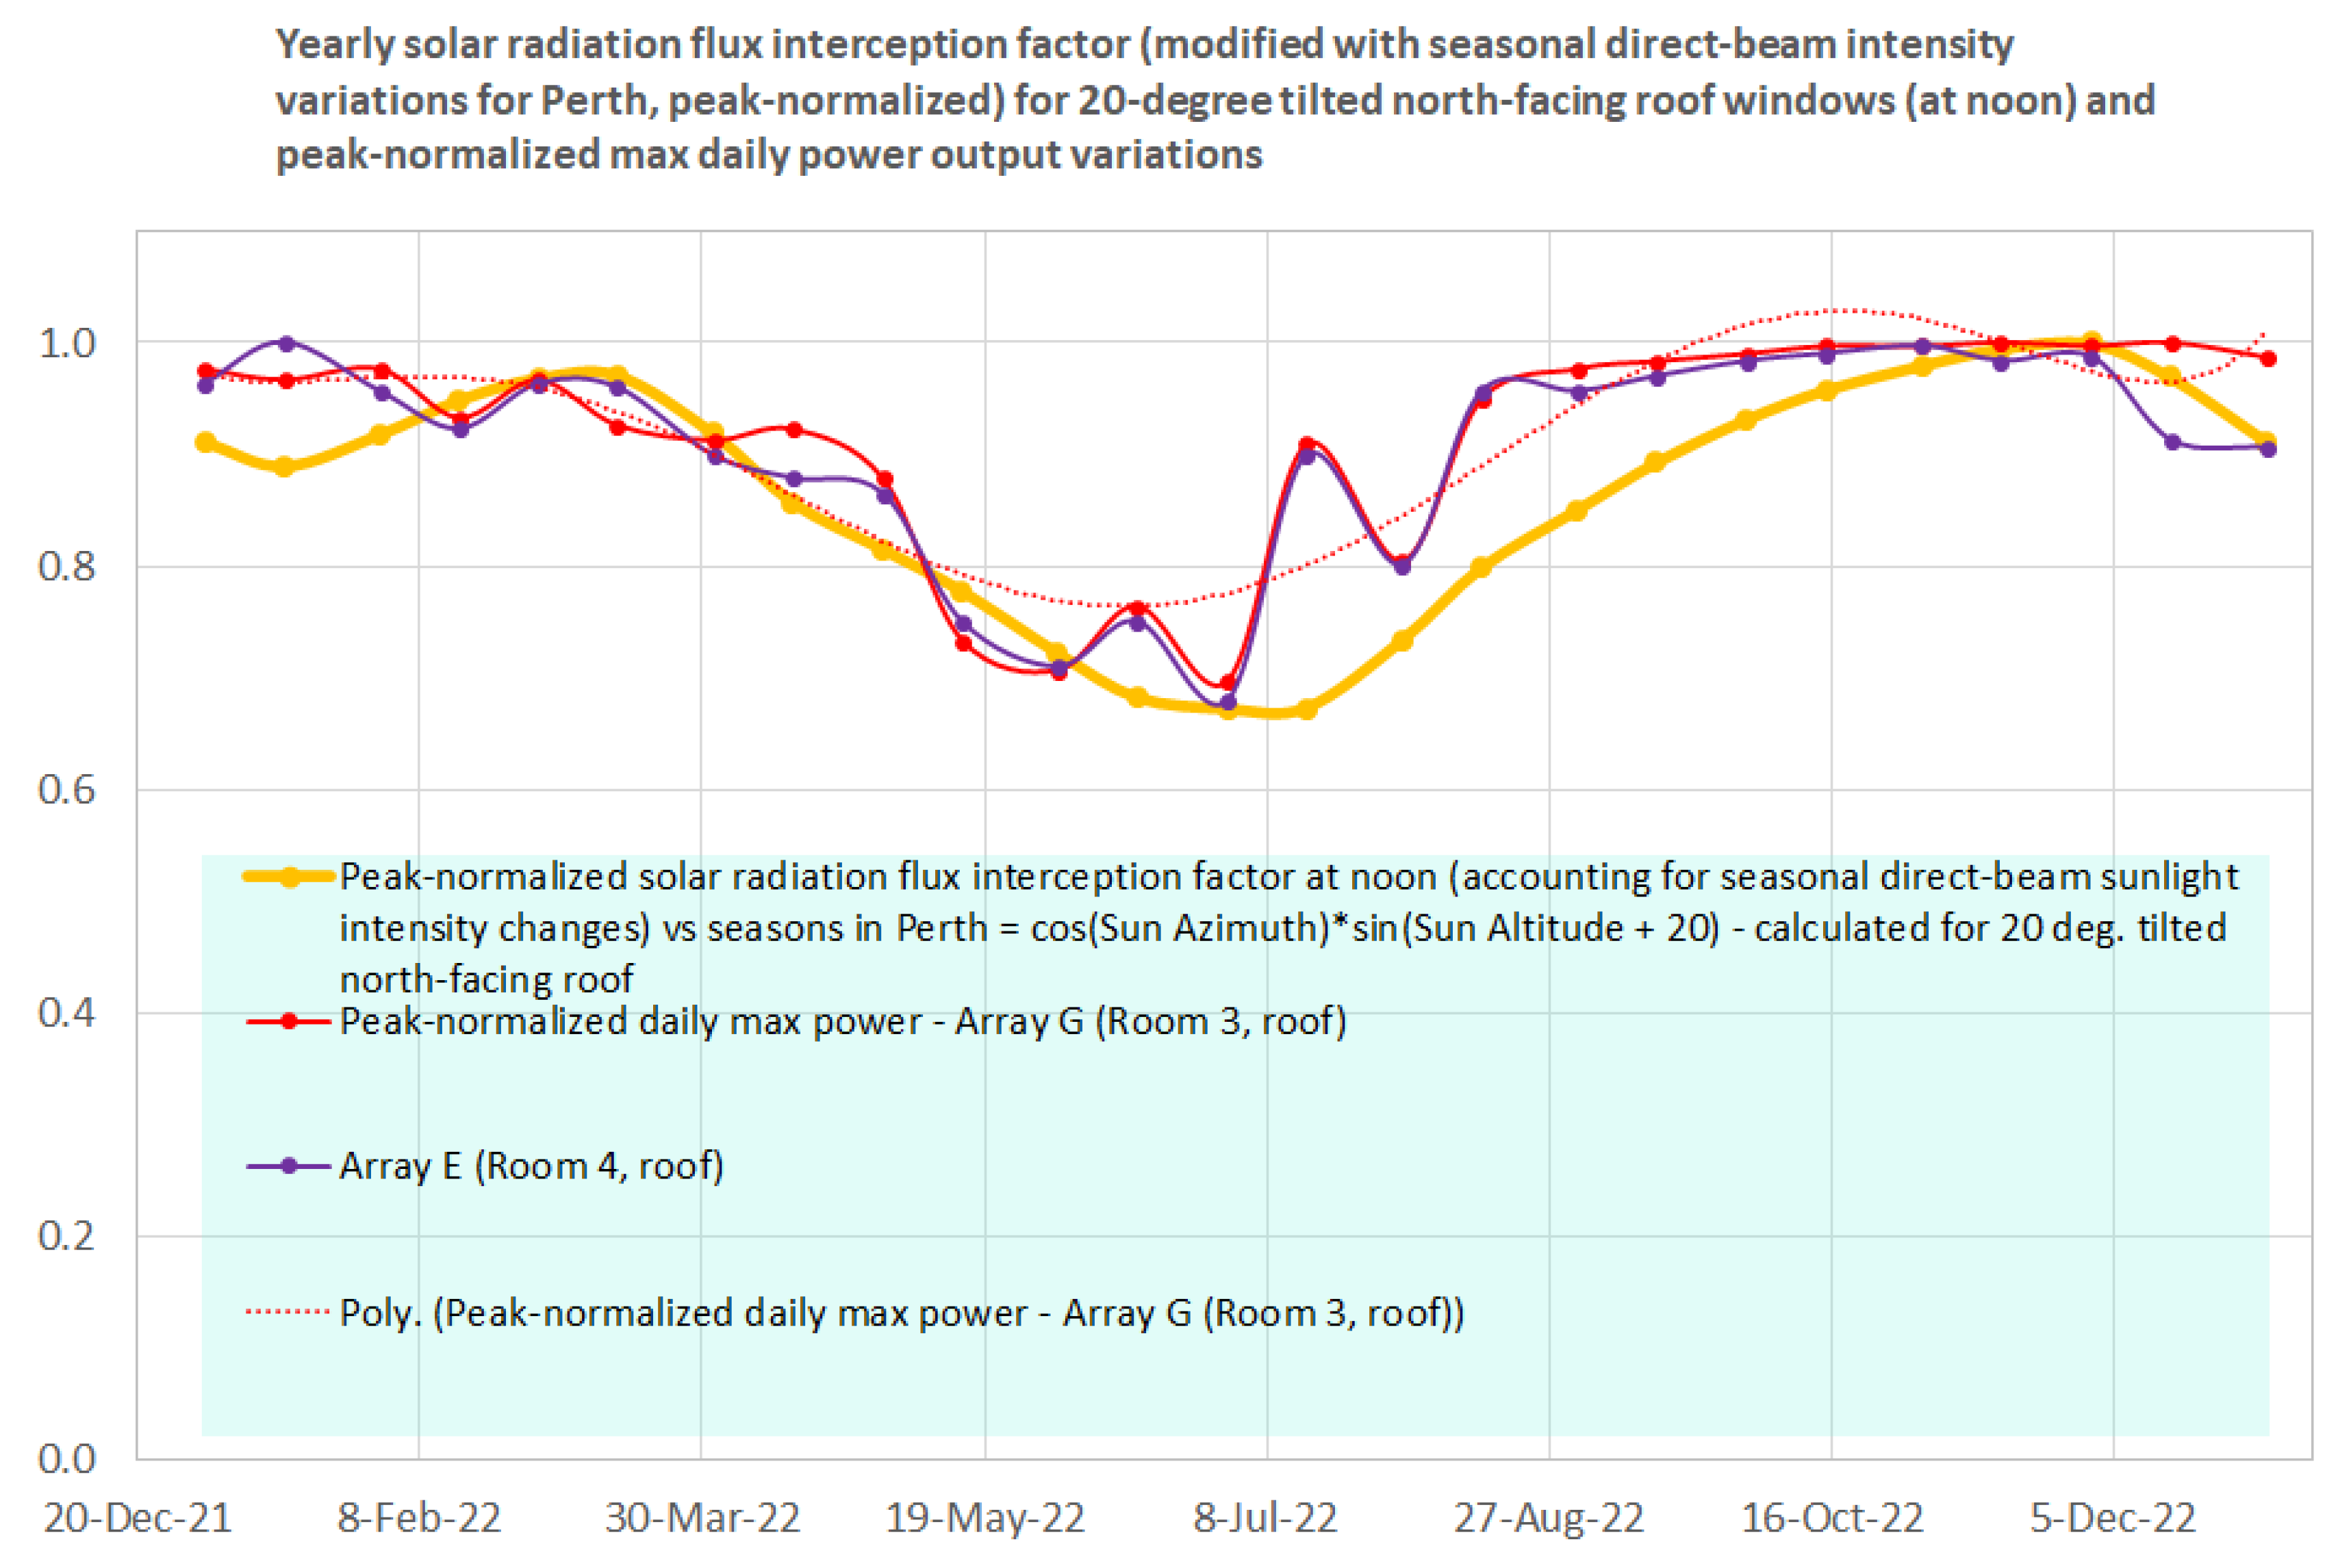
Figure 11a shows the monthly averaged yearly variations in the measured direct-beam solar radiation intensity for Perth; these data can also be included into the data normalizations used in previous datasets, to inspect whether the seasonal direct-beam solar intensity variations represent an additional major factor governing the solar window response functions plotted in Figure 9 and Figure 10. Figure 11b shows the corresponding normalized datasets of arrays J and F long-term daily peak near-noon power variations, together with the re-normalized seasonal variations in the (monthly maximum) solar direct-beam intensity.
Figure 11 shows essentially the same data dependencies as those presented in Figure 10, but with the solar radiation interception factor modified, accounting for the seasonal direct-beam intensity variations. Closer data correlations seen in Figure 9 and Figure 10 suggest that the Sun altitude angle is likely still the main governing factor, rather than the monthly maximum direct-beam intensity on its own. The window performance-related features in the data remain the same, showing that solar windows of different design types respond differently to sunlight incidence-angle changes. It is more evident from Figure 11 that the peaks of normalized array power distributions do not exactly coincide, suggesting different angle-dependent responses in different solar window designs.
Figure 12 shows the plots of normalized max. daily power output trends for two roof-based window arrays versus the solar geometry function governing the direct-beam intercepted solar radiation flux falling onto roof windows.
It is again notable from the data dependencies that the roof-mounted solar windows also show some outperformance (compared to the solar radiation flux scaling function) during most of the warmer months, particularly during the less-rainy period from August to February. The minima and maxima of the normalized power generation curves are shifted with respect to the corresponding extrema of the normalized direct-beam solar flux interception curve, again suggesting the maximized power output of roof windows being generated at orientations away from the normal incidence. Conventional roof-mounted PV modules would be expected to follow the solar radiation flux interception function much more closely over the seasons.
Another notable feature of unconventional photovoltaics based on LSC-type devices is their widely reported improved stability of energy outputs with respect to rainy-weather conditions, compared to ordinary PV. 
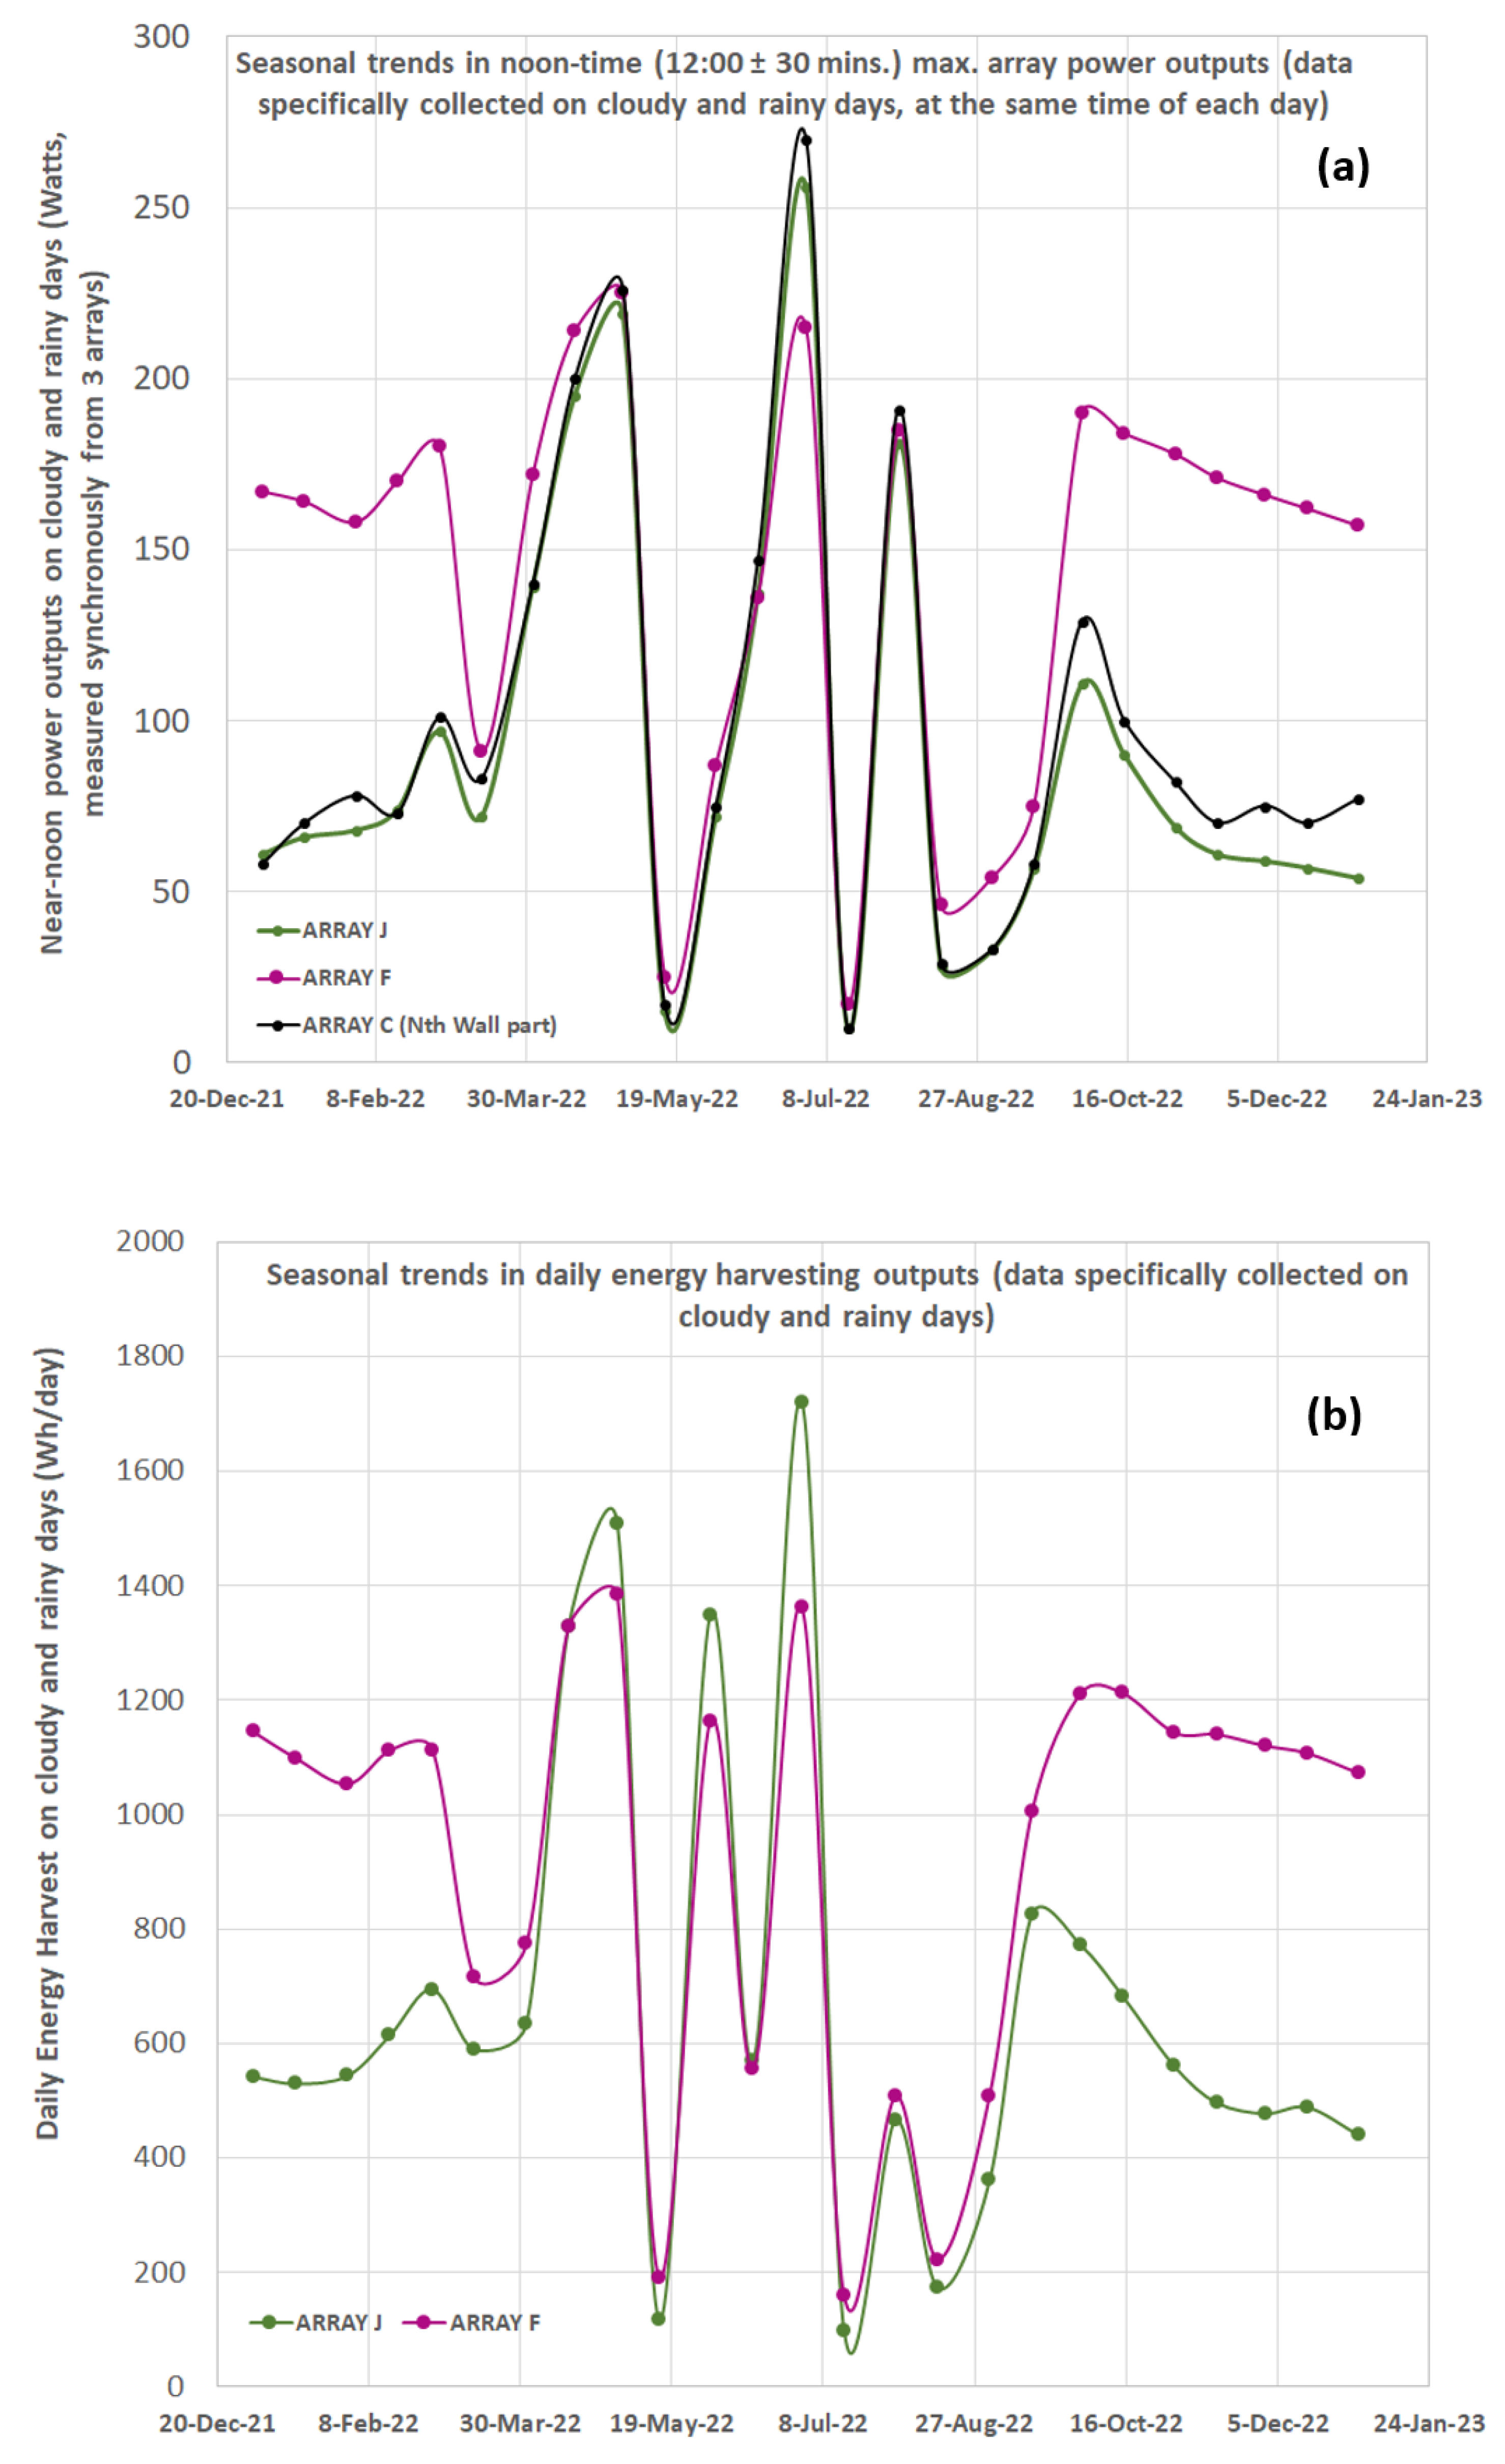
Figure 13 presents daily measured (near-noon) array power data points (collected at the same time from all arrays, on the same specifically selected cloudy days throughout 2022), and the corresponding daily energy harvesting amounts. Similarly, to the methodology used to collect solar geometry-related power output data, the data acquisition dates were selected within ±3 days from any selected day on the same fixed-dates calendar grid. Synchronous data collection timing (corresponding to the observed near-noon intraday local maxima of each array power) has ensured meaningful comparisons of the rainy-day array performance. It can be noted that Array F strongly outperformed Array J on the days of most adverse winter weather, but not during the relatively sunny cloudy winter days. These differences may be related to the variations in the solar spectrum-dependent and/or diffuse radiation collection behaviors between differently designed solar windows, which feature a different balance between the effects of luminescence and scattering on the energy collection. The substantially advantageous performance of Array F over other wall-mounted window arrays during the cloudier days throughout warm seasons is also evident from the data.
Again, strong seasonal and window design-dependent performance differences were seen, but these were no longer governed by the solar geometry variations, which was expected. The daily recorded energy outputs (Figure 13b) correlated with near-noon array power trends, and also showed large performance differences during summer months. The performance differences between different window designs were seen quite clearly during most of the year.
Energy harvesting behavior differences of the roof-mounted window arrays in rooms 2, 3, and 4 were much less notable, compared with wall arrays. These differences were also season- and weather-dependent. Running the daily energy-output statistics revealed better cloudy- and rainy-day stability of Room 3 roof windows. 
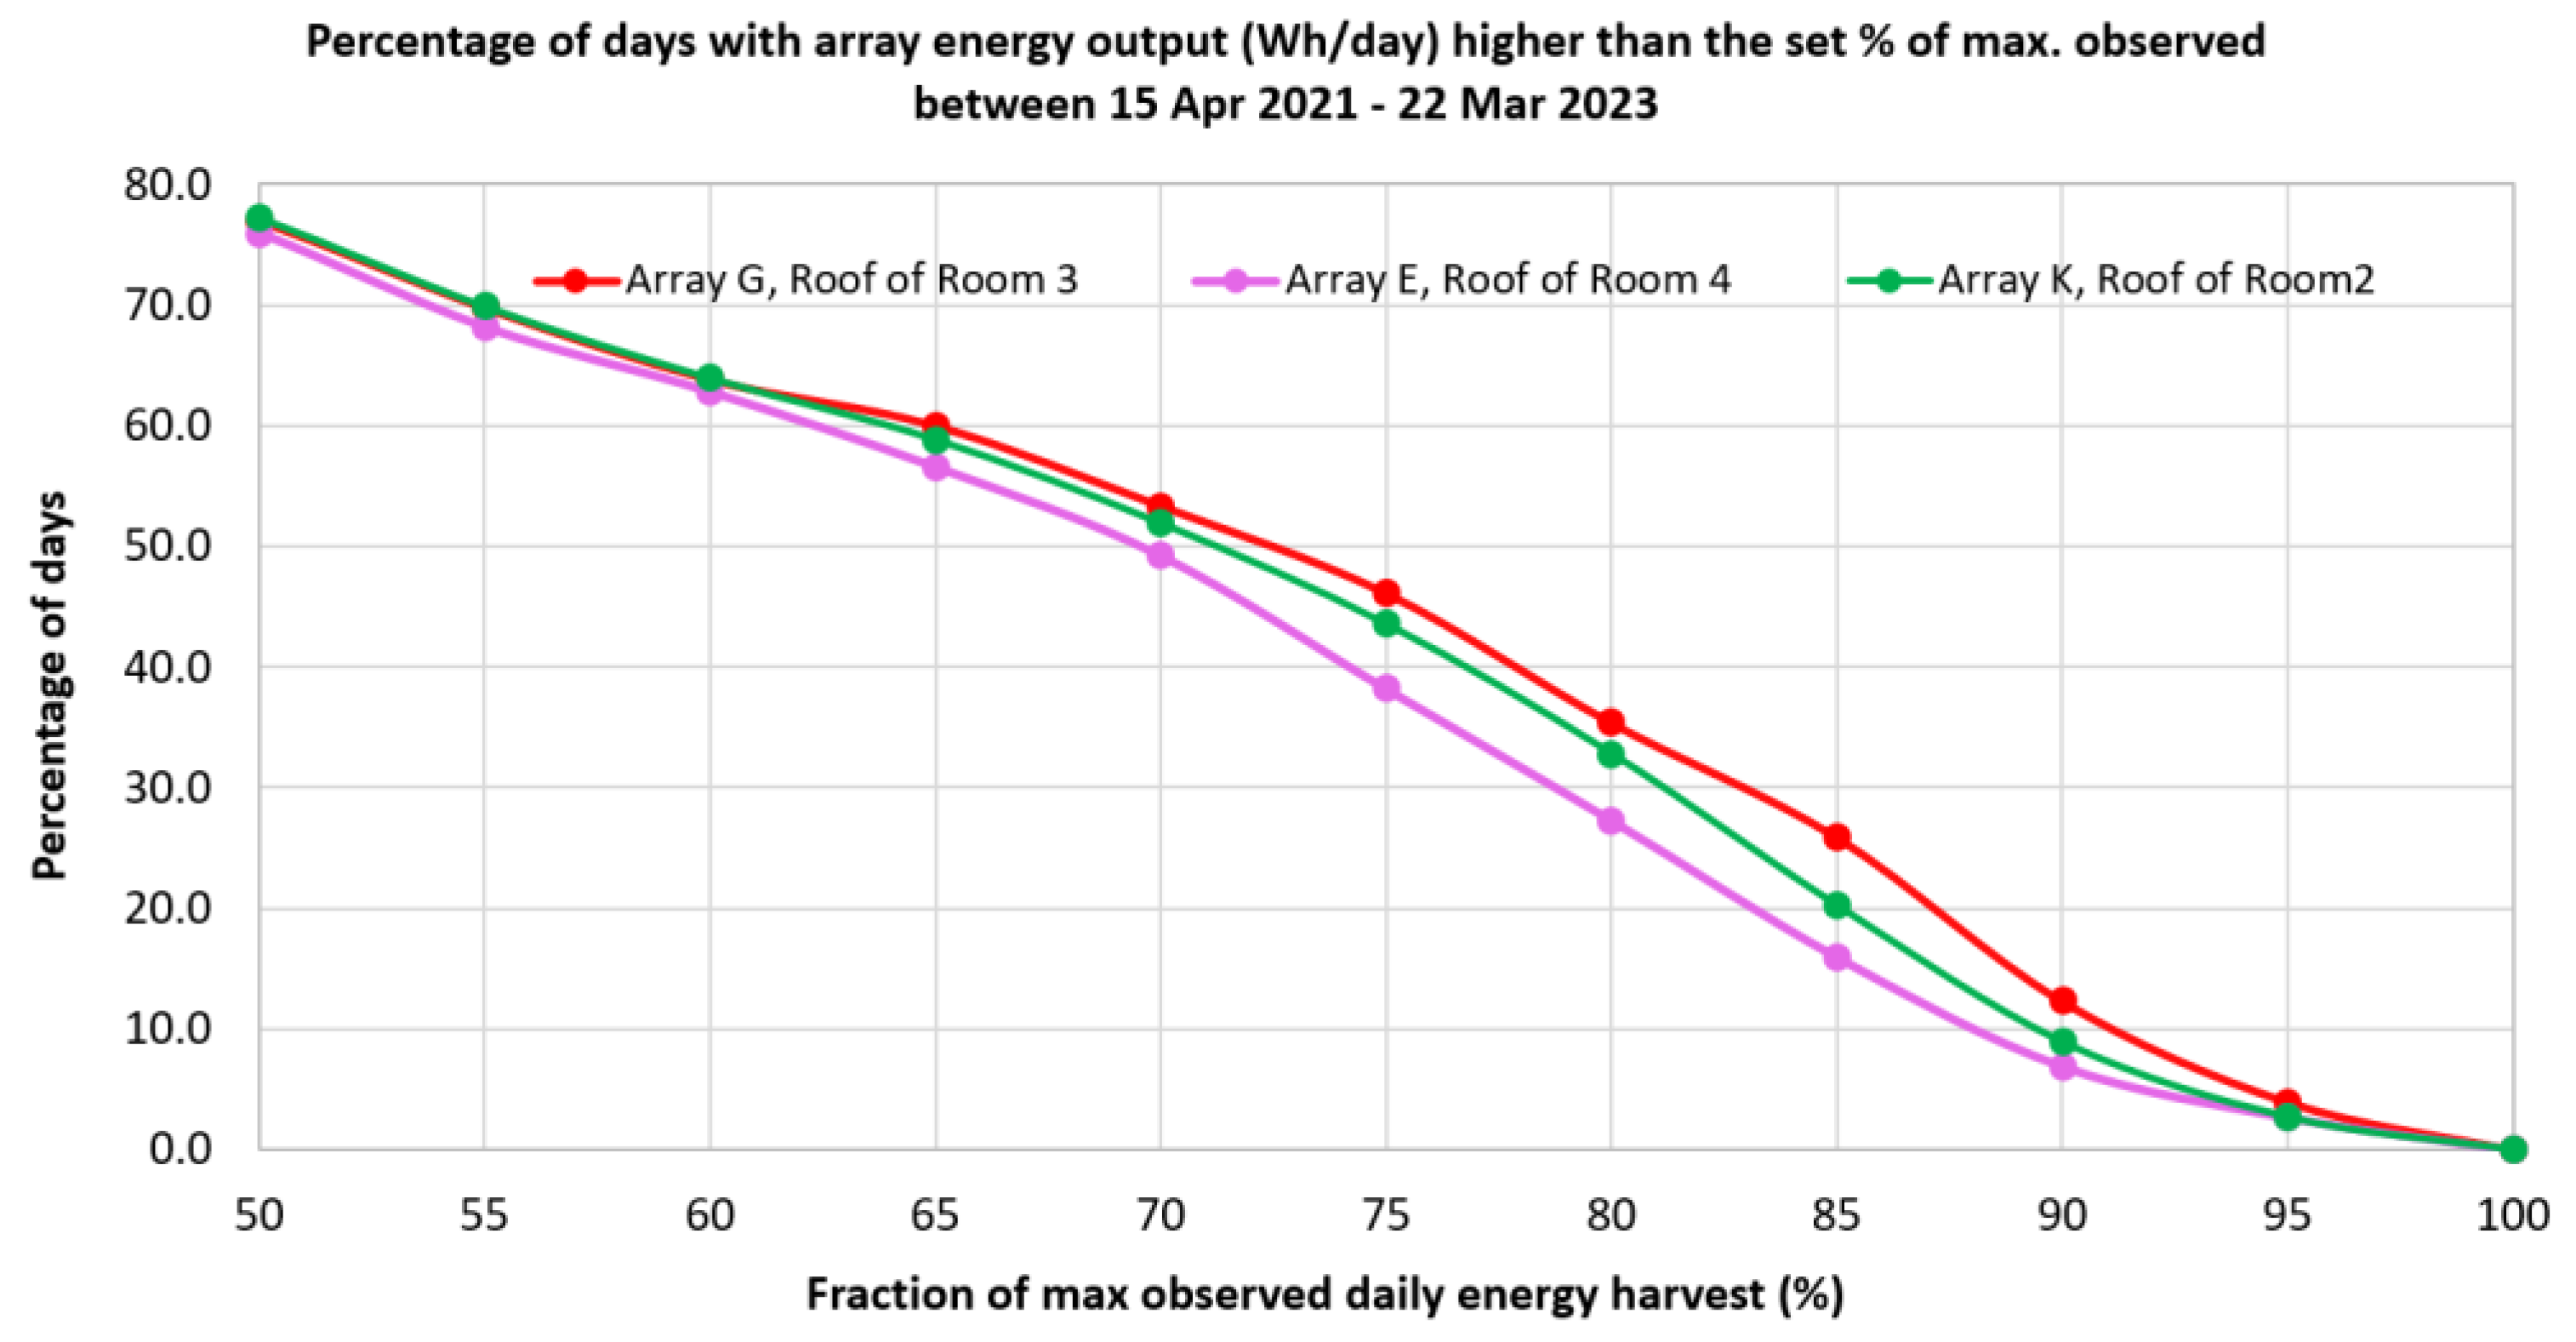
Figure 14 shows the long-term statistical distributions of the roof arrays’ energy output, plotted as the counted percentage of days between April 2021 and March 2022, during which the daily energy outputs have exceeded a given fraction of the maximum-observed daily energy harvest.
The roof of Room 3 generated higher daily energy outputs much more frequently, compared with other roof-mounted windows, almost regardless of weather changes. The daily energy harvests of Array G stayed in the top 10–25% of the maximum observed significantly more frequently than the energy outputs of nearby arrays on roofs of Rooms 2 and 4.

4. Conclusions

Novel high-transparency solar PV windows of several different design configurations were deployed over a greenhouse building envelope and field-tested to investigate their energy harvesting trends and performance potential. Window-integrated PV was designed to employ 3D-structured custom-shaped PV modules placed around window perimeter areas, also containing embedded glass-based luminescent solar concentrator panels and spectrally selective optical coatings. The energy harvesting behavior characteristics were demonstrated to be different from those usually seen in conventional photovoltaics, with some window designs showing strong performance in terms of power generation and energy production outputs throughout seasons, including in adverse weather conditions. We found that double-interlayer solar window designs provided more stable energy harvesting outputs, compared to single-interlayer windows of reduced haze and concentration-thickness product of the luminescent materials embedded within polyvinyl butyral. Even though more studies will be necessary to further optimize solar window designs in terms of energy yields, the current-generation high-transparency ClearVue solar windows have demonstrated a significant (~40%) reduction in the solar greenhouse energy use intensity, compared to a conventionally glazed alternative. New methods suitable for the identification and quantification of design-dependent field performance differences in solar PV windows have been reported. Innovative high-transparency agrivoltaic construction materials have been shown to reduce running costs in a research greenhouse environment built in a moderate climate. ClearVue solar windows installation showed rather stable daily energy harvest and small long-term reductions in the energy outputs over multiple months since installation in April 2021.

Author Contributions

Conceptualization, M.V., V.R. and J.L.; methodology, M.V., V.R. and J.L.; validation, M.V., D.G. and V.R.; formal analysis, M.V., V.R., J.L. and D.G.; investigation, M.V. and V.R.; data curation, M.V. and D.G.; writing—original draft preparation, M.V.; writing—review and editing, all authors; project administration, V.R. and J.L.; funding acquisition, V.R. and J.L. All authors have read and agreed to the published version of the manuscript.

Funding

This research was partially funded by the Australian Government’s Cooperative Research Centres Projects (CRC-P) Grant “Novel Glass Technologies and Photovoltaics in Protected Cropping”, 2017.

Conflicts of Interest

M.V., V.R and J.L. are employees of ClearVue Technologies Ltd., D.G. declares no conflict of interest.

References

  1. Capuano, L. International Energy Outlook 2018 (IEO2018); US Energy Information Administration: Washington, DC, USA, 2018. [Google Scholar]
  2. World Energy Outlook 2021; IEA Publications, International Energy Agency: Paris, France, 2022; p. 150.
  3. Biyik, E.; Araz, M.; Hepbasli, A.; Shahrestani, M.; Yao, R.; Shao, L.; Essah, E.; Oliveira, A.C.; del Cano, T.; Rico, E.; et al. A key review of building integrated photovoltaic (BIPV) systems. Eng. Sci. Technol. Int. J. 2017, 20, 833–858. [Google Scholar] [CrossRef]
  4. Vasiliev, M.; Nur-E-Alam, M.; Alameh, K. Recent Developments in Solar Energy-Harvesting Technologies for Building Integration and Distributed Energy Generation. Energies 2019, 12, 1080. [Google Scholar] [CrossRef] [Green Version]
  5. Moor, D.; Rosenberg, V.; Vasiliev, M. High Transparency Clear Glass Windows with Large PV Energy Outputs. In Proceedings of the Challenging Glass Conference, Ghent, Belgium, 20 June 2022; Volume 8. [Google Scholar] [CrossRef]
  6. Pillai, D.S.; Shabunko, V.; Krishna, A. A comprehensive review on building integrated photovoltaic systems: Emphasis to technological advancements, outdoor testing, and predictive maintenance. Renew. Sust. En. Rev. 2022, 156, 111946. [Google Scholar] [CrossRef]
  7. Toledo, C.; Scognamiglio, A. Agrivoltaic Systems Design and Assessment: A Critical Review, and a Descriptive Model towards a Sustainable Landscape Vision (Three-Dimensional Agrivoltaic Patterns). Sustainability 2021, 13, 6871. [Google Scholar] [CrossRef]
  8. Al Mamun, M.A.; Dargusch, P.; Wadley, D.; Zulkarnain, N.A.; Aziz, A.A. A review of research on agrivoltaic systems. Renew. Sustain. Energy Rev. 2022, 161, 112351. [Google Scholar] [CrossRef]
  9. Ela, E.; Diakov, V.; Ibanez, E.; Heaney, M. Impacts of Variability and Uncertainty in Solar Photovoltaic Generation at Multiple Timescales; Technical Report NREL/TP-5500-58274; NREL: Golden, CO, USA, 2013. [Google Scholar]
  10. Imteaz, M.A.; Ahsan, A. Solar panels: Real efficiencies, potential productions and payback periods for major Australian cities. Sust. Energy Technol. Assessm. 2018, 25, 119–125. [Google Scholar] [CrossRef]
  11. Ghazi, S.; Ip, K. The effect of weather conditions on the efficiency of PV panels in southeast of UK. Renew. Energy 2014, 69, 50–59. [Google Scholar] [CrossRef]
  12. Vasiliev, M.; Nur-E-Alam, M.; Alameh, K. Transparent heat regulation materials and coatings: Present status, challenges, and opportunity. In Energy Saving Coating Materials; Elsevier: Amsterdam, The Netherlands, 2020; pp. 57–82. [Google Scholar]
  13. Vasiliev, M.; Alameh, K.; Badshah, M.A.; Kim, S.-M.; Nur-E-Alam, M. Semi-Transparent Energy-Harvesting Solar Concentrator Windows Employing Infrared Transmission-Enhanced Glass and Large-Area Microstructured Diffractive Elements. Photonics 2018, 5, 25. [Google Scholar] [CrossRef] [Green Version]
  14. Debije, M.G.; Verbunt, P.P.C. Thirty Years of Luminescent Solar Concentrator Research: Solar Energy for the Built Environment. Adv. Energy Mater. 2012, 2, 12–35. [Google Scholar] [CrossRef]
  15. Reinders, A.; Kishore, R.; Slooff, L.; Eggink, W. Luminescent solar concentrator photovoltaic designs. Jpn. J. Appl. Phys. 2018, 57, 08RD10. [Google Scholar] [CrossRef]
  16. Ren, S.; Shou, C.; Jin, S.; Chen, G.; Han, S.; Chen, Z.; Chen, X.; Yang, S.; Guo, Y.; Tu, C.-C. Silicon quantum dot luminescent solar concentrators and downshifters with antireflection coatings for enhancing perovskite solar cell performance. ACS Photonics 2021, 8, 2392–2399. [Google Scholar] [CrossRef]
  17. Zhang, B.; Lyu, G.; Kelly, E.A.; Evans, R.C. Förster Resonance Energy Transfer in Luminescent Solar Concentrators. Adv. Sci. 2022, 9, 2201160. [Google Scholar] [CrossRef] [PubMed]
  18. Alameh, K.; Rosenberg, V.; Vasiliev, M. Device for generating electric energy. Patent US11162302B2, 2 November 2021. Available online: https://patents.google.com/patent/US11162302B2/en (accessed on 4 July 2023).
  19. Debije, M.G.; Rajkumar, V.A. Direct versus indirect illumination of a prototype luminescent solar concentrator. Sol. Energy 2015, 122, 334–340. [Google Scholar] [CrossRef]
  20. De Bruin, T.A.; Terricabres-Polo, R.; Kaul, A.; Zawacka, N.K.; Tim Prins, P.; Gietema, T.F.J.; de Waal, A.C.; de Boer, D.K.G.; Vanmaekelbergh, D.A.M.; Leblans, L.P.; et al. Analysis of the 1 Year Outdoor Performance of Quantum Dot Luminescent Solar Concentrators. Sol. RRL 2023, 7, 2201121. [Google Scholar] [CrossRef]
  21. Clearvue Technologies Website. Available online: https://www.clearvuepv.com/frequently-asked-questions/ (accessed on 31 May 2023).
  22. Vasiliev, M.; Nur-E-Alam, M.; Alameh, K. Initial Field Testing Results from Building-Integrated Solar Energy Harvesting Windows Installation in Perth, Australia. Appl. Sci. 2019, 9, 4002. [Google Scholar] [CrossRef] [Green Version]
  23. Tomita Technologies Website. Available online: http://tomitatechnologies.com/site/ (accessed on 31 May 2023).
  24. Alghamedi, R.; Vasiliev, M.; Nur-E-Alam, M.; Alameh, K. Spectrally-Selective All-Inorganic Scattering Luminophores For Solar Energy-Harvesting Clear Glass Windows. Sci. Rep. 2014, 4, 6632. [Google Scholar] [CrossRef] [PubMed] [Green Version]
  25. Yang, C.; Lunt, R.R. Limits of visibly transparent luminescent solar concentrators. Adv. Opt. Mater. 2017, 5, 1600851. [Google Scholar] [CrossRef]
  26. Warner, T.; Ghiggino, K.P.; Rosengarten, G. A critical analysis of luminescent solar concentrator terminology and efficiency results. Sol. Energy 2022, 246, 119–140. [Google Scholar] [CrossRef]
  27. Li, H.; Wu, K.; Lim, J.; Song, H.-J.; Klimov, V.I. Doctor-blade deposition of quantum dots onto standard window glass for low-loss large-area luminescent solar concentrators. Nat. Energy 2016, 1, 16157. [Google Scholar] [CrossRef]
  28. Ramachandran, A.M.; Sangeetha, M.S.; Thampi, A.S.; Singh, M.; Asok, A. A comprehensive review on optics and optical materials for planar waveguide-based compact concentrated solar photovoltaics. Results Eng. 2022, 16, 100665. [Google Scholar] [CrossRef]
  29. You, Y.; Tong, X.; Channa, A.I.; Zhi, H.; Cai, M.; Zhao, H.; Xia, L.; Liu, G.; Zhao, H.; Wang, Z. High-efficiency luminescent solar concentrators based on Composition-tunable Eco-friendly Core/shell quantum dots. Chem. Eng. J. 2023, 452 Pt 3, 139490. [Google Scholar] [CrossRef]
  30. Ferreira, R.A.S.; Correia, S.F.H.; Monguzzi, A.; Liu, X.; Meinardi, F. Spectral converters for photovoltaics—What’s ahead. Mater. Today 2020, 33, 105–121. [Google Scholar] [CrossRef] [Green Version]
  31. SunCalc Website. Available online: www.suncalc.org (accessed on 31 May 2023).
  32. PV Education Website. Available online: https://www.pveducation.org/pvcdrom/properties-of-sunlight/arbitrary-orientation-and-tilt (accessed on 31 May 2023).
Figure 1. Murdoch University solar greenhouse after its construction and fit-out were completed in Perth (Western Australia) in April 2021. The internal grow-room boundaries are marked; the direction to geographic north and the greenhouse location coordinates are also shown.
Technologies 11 00095 g001
Figure 2. Flashlamp standardized PV I-V curve and power–voltage curve measurement results of ClearVue solar windows. Typical I-V curve (continuous blue trace) and power-voltage curve (dash-dotted blue trace) of 1.1 m × 1.2 m solar windows of the triple-glazed design type installed at Murdoch University greenhouse, measured at normal incidence are shown; the typical electric output is ~30 Wp/m2. Measured PV performance datasets obtained from a large-area (1.9 m × 0.95 m, the solar window model installed at Aqua Ignis greenhouse, Sendai, Japan [23]) ClearVue triple-glazed insulated glass units demonstrating approx. 28 Wp/m2 rating are also shown (green continuous line shows an I-V curve and green dash-dotted line shows the power–voltage dependency).
Technologies 11 00095 g002
Figure 3. Online (Enphase Enlighten) data monitoring interface showing schematically the 13 PV window arrays (coded alphabetically as A,B,..M) and greenhouse room boundaries. (a) Overall (color-coded) array organization diagram and windows placement arrangement; (b) Arrays containing the windows installed into the north-facing wall of Murdoch greenhouse. Lifetime energy production figures (15 April 2021–23 May 2023) for the individual north-wall PV window arrays and internal room boundaries are also shown. Empty (white) rectangles indicate non-solar (louvre-type) windows installed in the middle parts of each room’s wall sections. Arrays J and F are composed of 12 windows each, distributed across the wall sections of (mainly) rooms 2 (arr. J) and 3 (arr. F). Array C is also composed of 12 windows, 6 on the north wall, and another 6 on north-facing roof of room 4 (shown in part (a)); the last vertical column of 3 windows in room 4 (shown in part (a)) was a part of a mainly west-facing array B.
Technologies 11 00095 g003
Figure 4. (a) Solar PV energy generation trends measured during winter of 2021. Murdoch University Solar Greenhouse installation performance shown in comparison with an optimally tilted, conventional rooftop PV installation in Perth. Data sources: Enphase Enlighten data (greenhouse), and Fronius Solar.Web app (home PV system owned by Dr M. Vasiliev); (b) long-term daily energy generation dataset recorded from an array of 12 windows mounted on the roof of grow-room #3; (c) greenhouse-total long-term daily energy generation dataset measured between Jan 2022 and May 2023.
Technologies 11 00095 g004
Figure 5. Electric energy consumption trends in Murdoch University Solar Greenhouse grow-rooms observed during 2021–2022. “CPV” glazing type abbreviation stands for ClearVue PV.
Technologies 11 00095 g005
Figure 6. Monthly energy production outputs from a 12-window array (Array F) mounted vertically on the north-facing wall of greenhouse.
Technologies 11 00095 g006
Figure 7. (a) Per-window energy production outputs from different north-facing solar window arrays vs. time of day, measured in hot summer conditions during 16 February 2023; (b) 12-window array-total electric power outputs vs. time of day measured from wall-mounted arrays J and F in winter conditions on 3 July 2021; (c) daily energy harvesting output trends of arrays J and F measured in autumn conditions, demonstrating systematically stronger energy output stability of array F windows during cloudy and rainy days.
Technologies 11 00095 g007
Figure 8. Measured optical direct transmission spectra of thin low-iron glass laminates manufactured using two different functionalized PVB material types. Both PVB materials (PVB-1 and PVB-2) contained a low-concentration (sub-1 wt%) mix of oxide- and sulfide-based fluorescent inorganic microparticles featuring the UV-violet (300–430 nm) and near-infrared (980 ± 40 nm) excitation bands and photoluminescent emissions in the near-infrared region. PVB-2 contained a slightly higher particle loading concentration, compared to PVB-1. Both functionalized PVB types also featured broadband scattering of the incident light, increasing the diffused transmission fraction. Both of these new PVB composition types were designed as derivatives of epoxy-based fluorescent scattering interlayers promoting the internal light redistribution in glass windows first reported in Ref. [24].
Technologies 11 00095 g008
Figure 9. Long-term (April 2021–December 2022) peak-normalized datasets for Array J daily peak power generation (Watts near noon) and the normalized solar-geometry dependent noon-time solar radiation flux interception factor for north-facing vertically oriented PV modules in Perth. (a) 2021 observations; (b) 2022 observations, repeating the highly correlated character of the two dependencies plotted.
Technologies 11 00095 g009aTechnologies 11 00095 g009b
Figure 10. Yearly peak-normalized data for Arrays J, C, and F—daily peak power generation (Watts near noon) and the normalized solar-geometry dependent noon-time solar radiation flux interception factor for north-facing vertically oriented PV modules in Perth during 2022. Polynomial fitted trendlines are added for illustration purposes to the datasets of arrays C and F.
Technologies 11 00095 g010
Figure 11. (a) Dataset for the direct-beam maximum (monthly averaged) solar radiation intensity for Perth, Australia. The data source is COMFEN 5.0 software; (b) Yearly peak-normalized and max. direct beam intensity-normalized data for Arrays J and F—daily peak power generation (Watts near noon) and the normalized solar-geometry dependent noon-time direct-beam solar radiation flux interception factor for north-facing vertically oriented PV modules in Perth during 2022.
Technologies 11 00095 g011
Figure 12. Normalized max. daily power output trends for 2 roof-based window arrays versus the solar geometry function.
Technologies 11 00095 g012
Figure 13. (a) Seasonal trends in the near-noon rainy-day (or cloudy-day) power outputs (power readings collected synchronously from 3 different north wall window arrays). The same cloudier days and power data collection times were specifically selected to correspond to the same near-noon local intraday maxima of power output measured in all arrays; (b) Seasonal trends in the rainy-day (or cloudy-day) daily energy production outputs of north wall arrays.
Technologies 11 00095 g013
Figure 14. Long-term roof-based window array performance metrics observations, plotted as observation time percentage versus the measured daily energy harvest (expressed as a fraction of the maximum observed daily energy harvest per a 12-window PV array).
Technologies 11 00095 g014
Table 1. Arrays of solar windows and the details of their placement over the building envelope of greenhouse.
Array NameOrientation/TiltMounting Location/Details/Room#
A270°/90°West wall/12 windows/Room 4
BMixed (270°, 0°)/90°West wall (9 w.), north wall (3 w.)/Room 4
C0°/Mixed (90°, 20°)North wall (6 w.), north roof (6 w.)/Room 4
D0°/20°North roof/12 windows/Room 4
E0°/20°North roof/12 windows/Room 4
F0°/90°North wall/(7 w., Room 3)/(5 w., Room 4)
G0°/20°North roof/12 windows/Room 3
H0°/Mixed (90°, 20°)North wall (6 w.), north roof (6 w.)/Room 3
I0°/20°North roof/12 windows/Room 3
J0°/90°North wall/(11 w., Room 2)/(1 w., Room 3)
K0°/20°North roof/12 windows/Room 2
L0°/Mixed (90°, 20°)North wall (3 w.), north roof (6 w.)/Room 2
M0°/20°North roof/12 windows/Room 2
Table 2. Long-term energy harvesting productivity measured in different roof-mounted PV window arrays.
Best-Performing Array/LocationArray K/Roof of Room 2Array G/Roof of Room 3Array E/Roof of Room 4
Lifetime energy production (kWh)931952925
Disclaimer/Publisher’s Note: The statements, opinions and data contained in all publications are solely those of the individual author(s) and contributor(s) and not of MDPI and/or the editor(s). MDPI and/or the editor(s) disclaim responsibility for any injury to people or property resulting from any ideas, methods, instructions or products referred to in the content.

