


Image-Based Quantification of Color and Its Machine Vision and Offline Applications


Abstract
1. Introduction
2. Experimental
3. Results
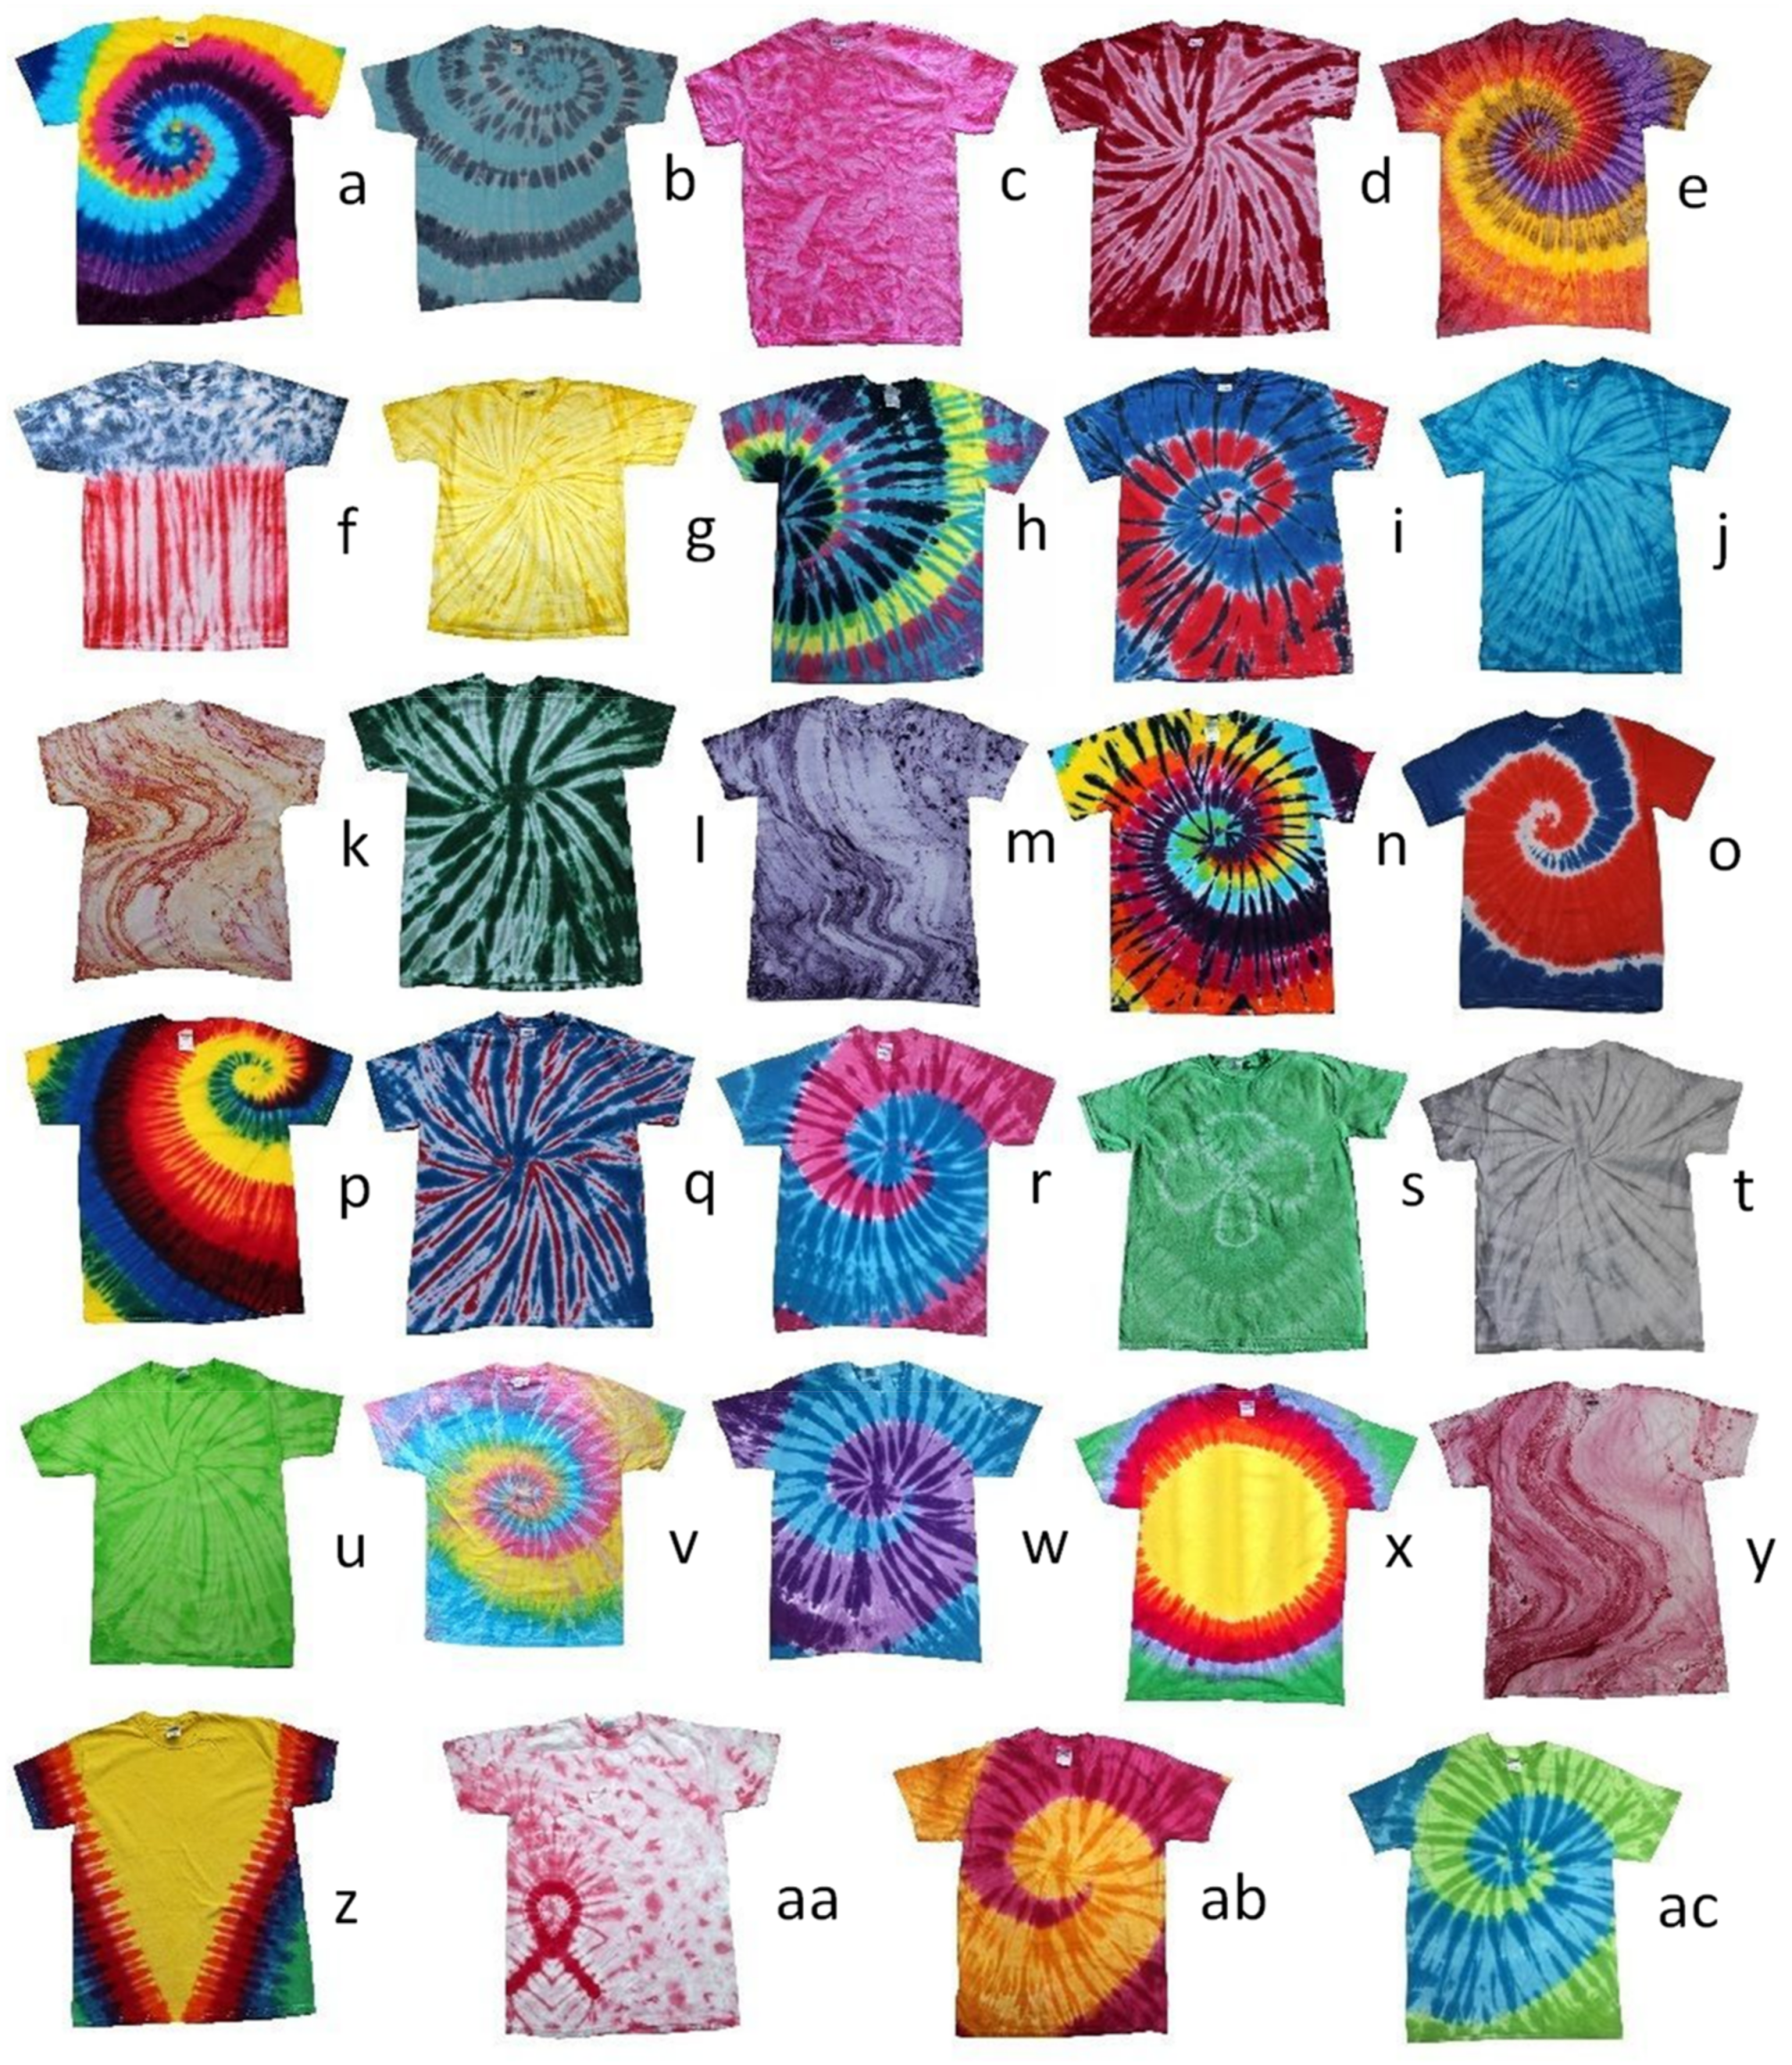
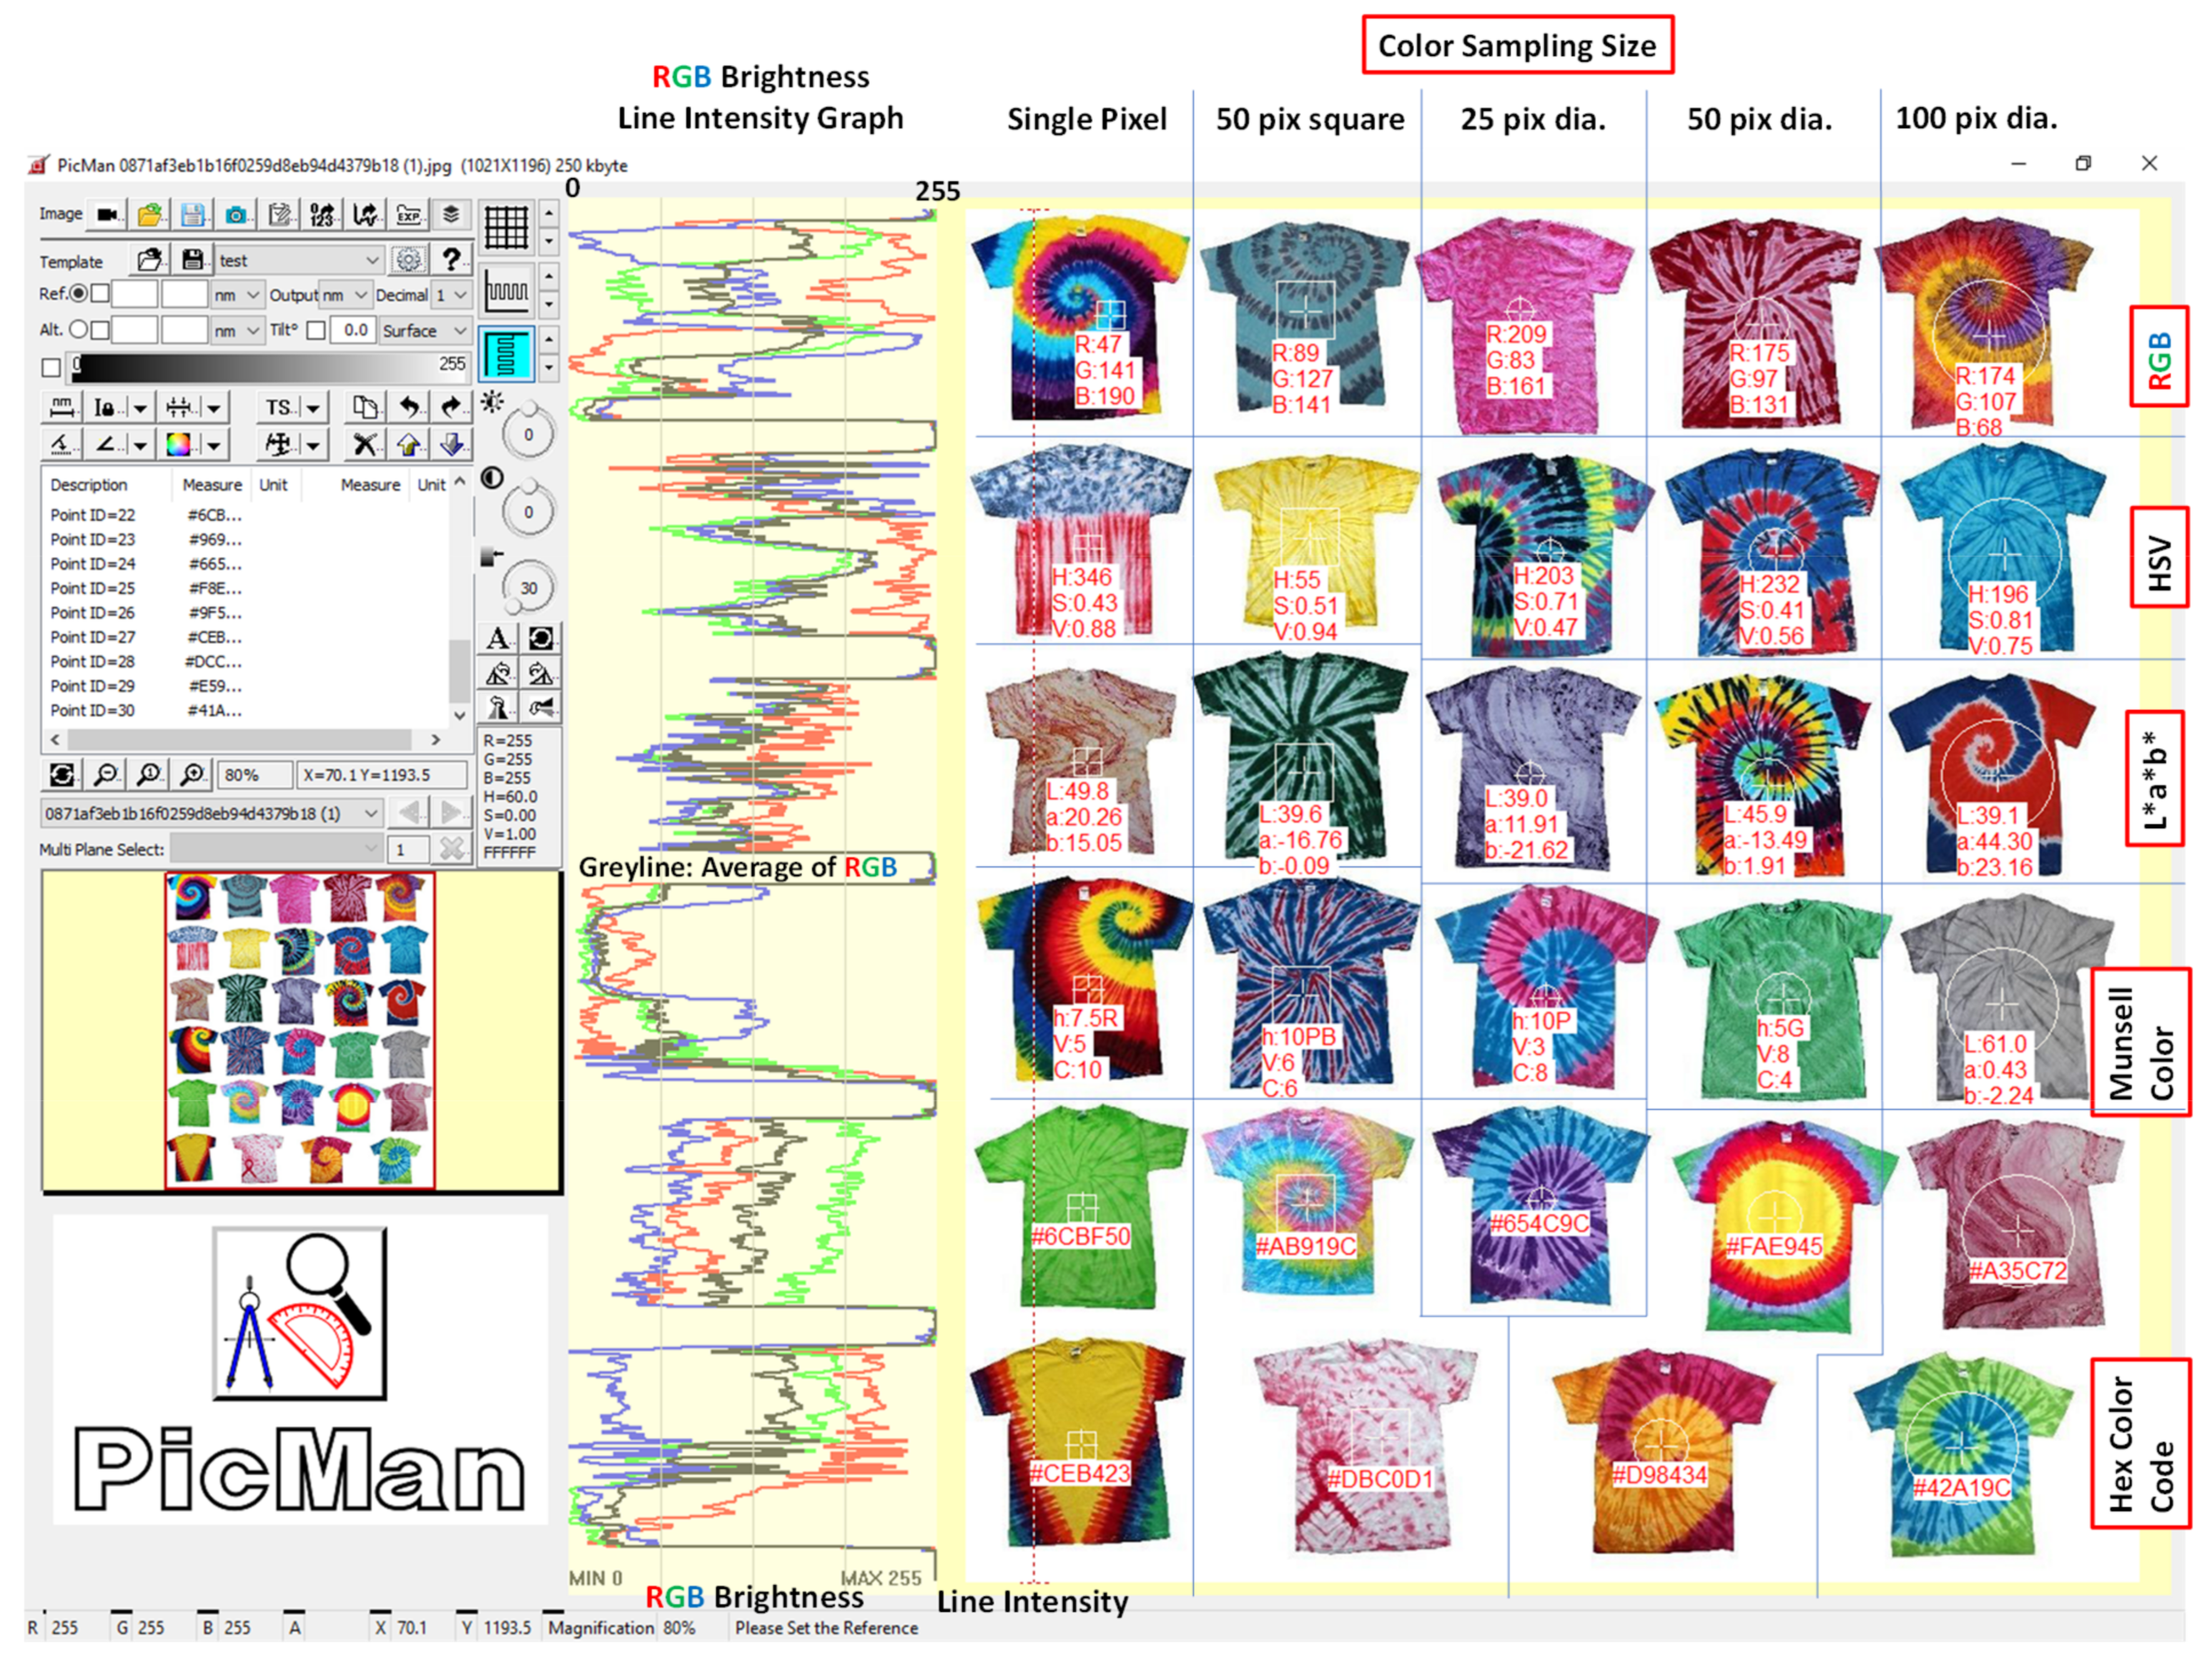
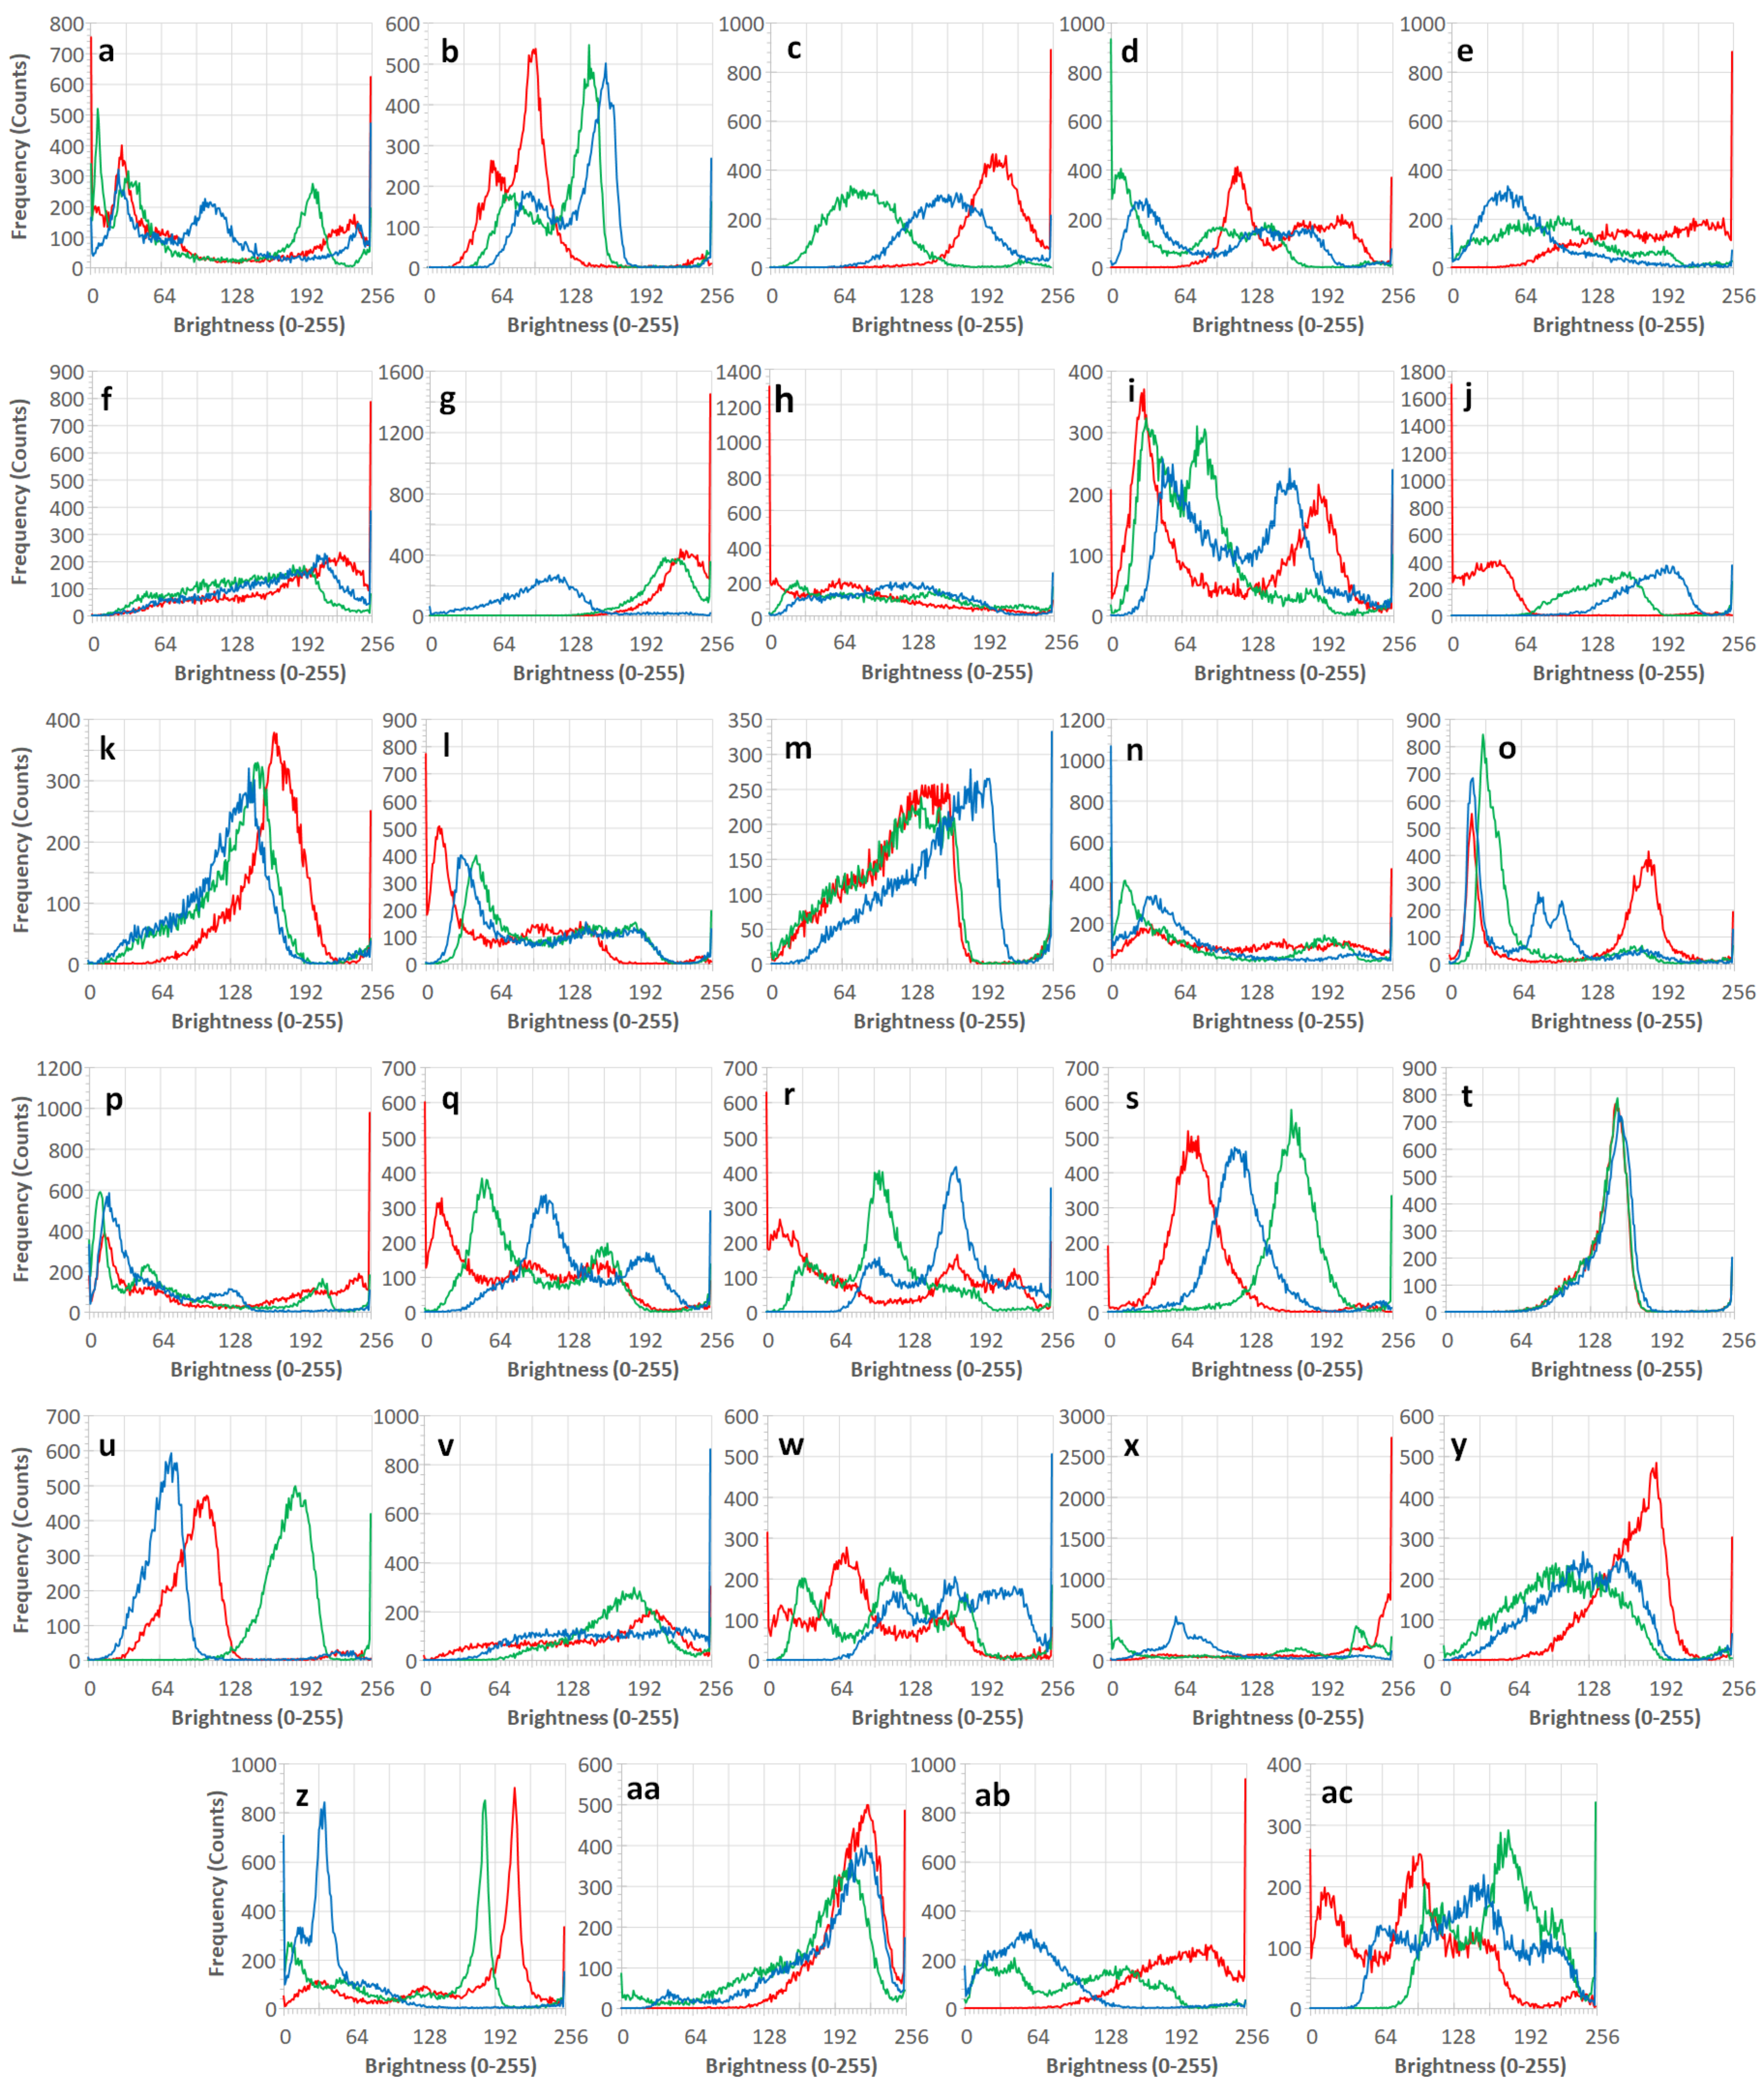
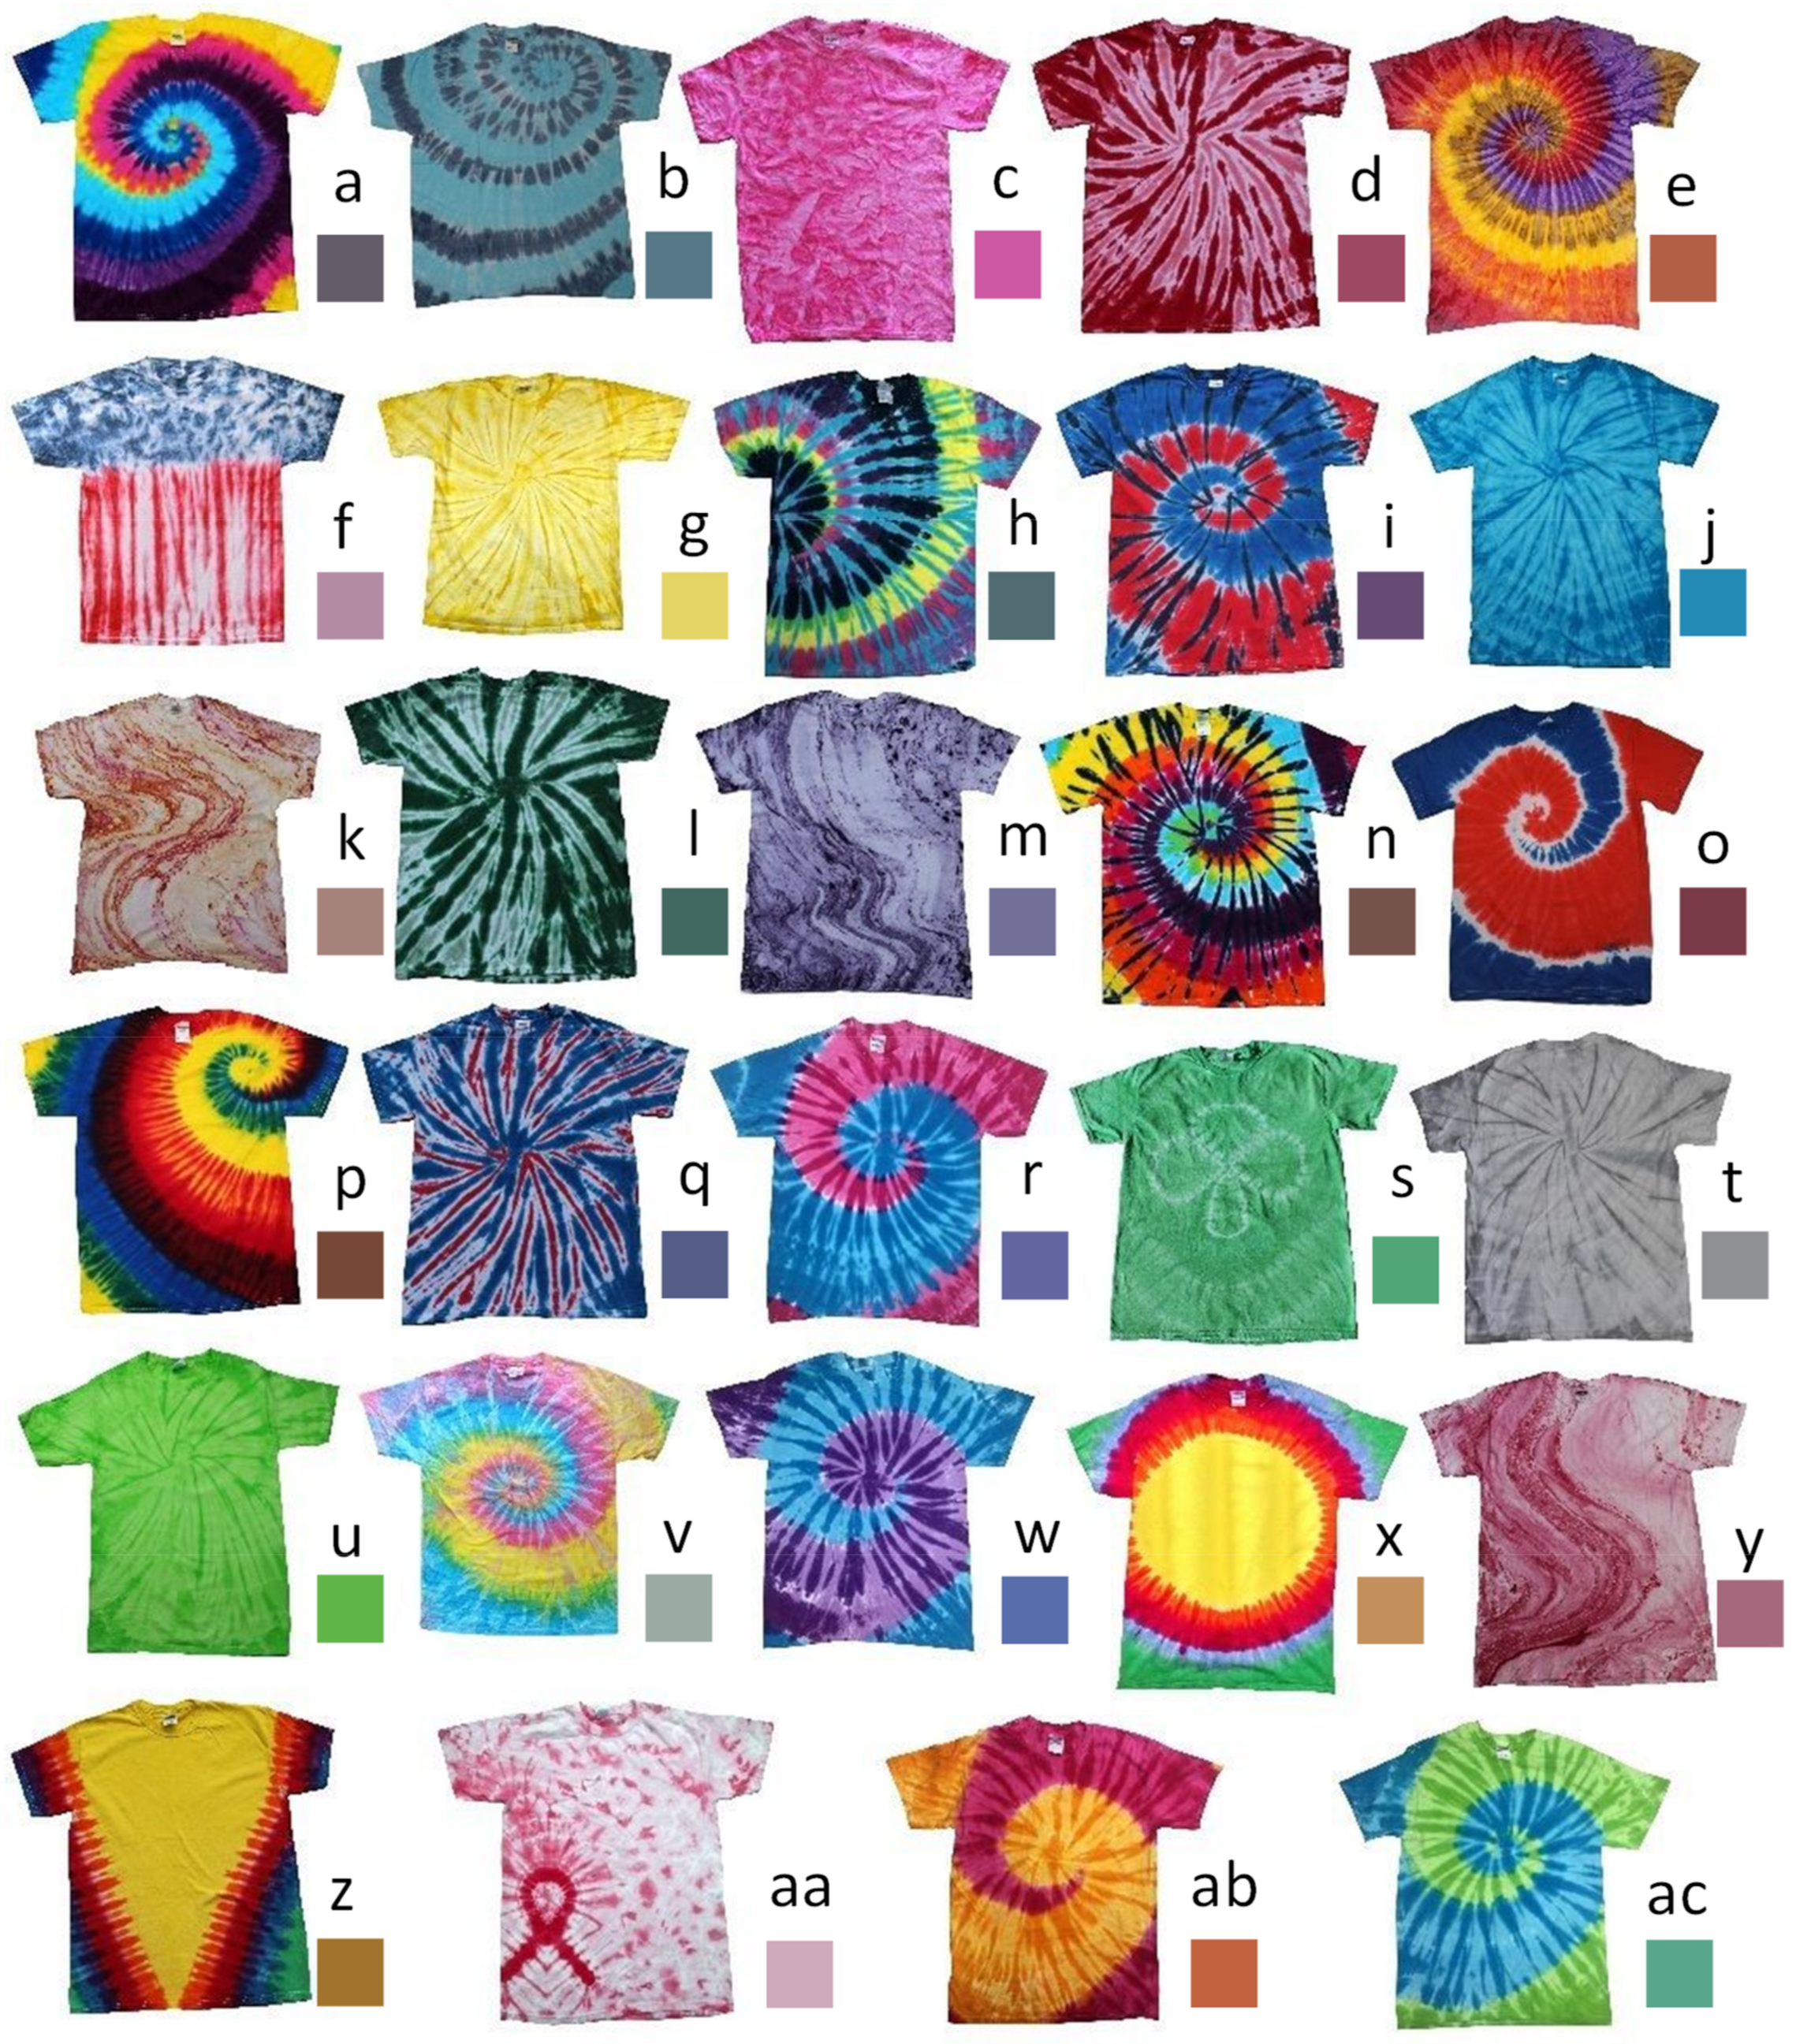
3.1. Dyed T-Shirts
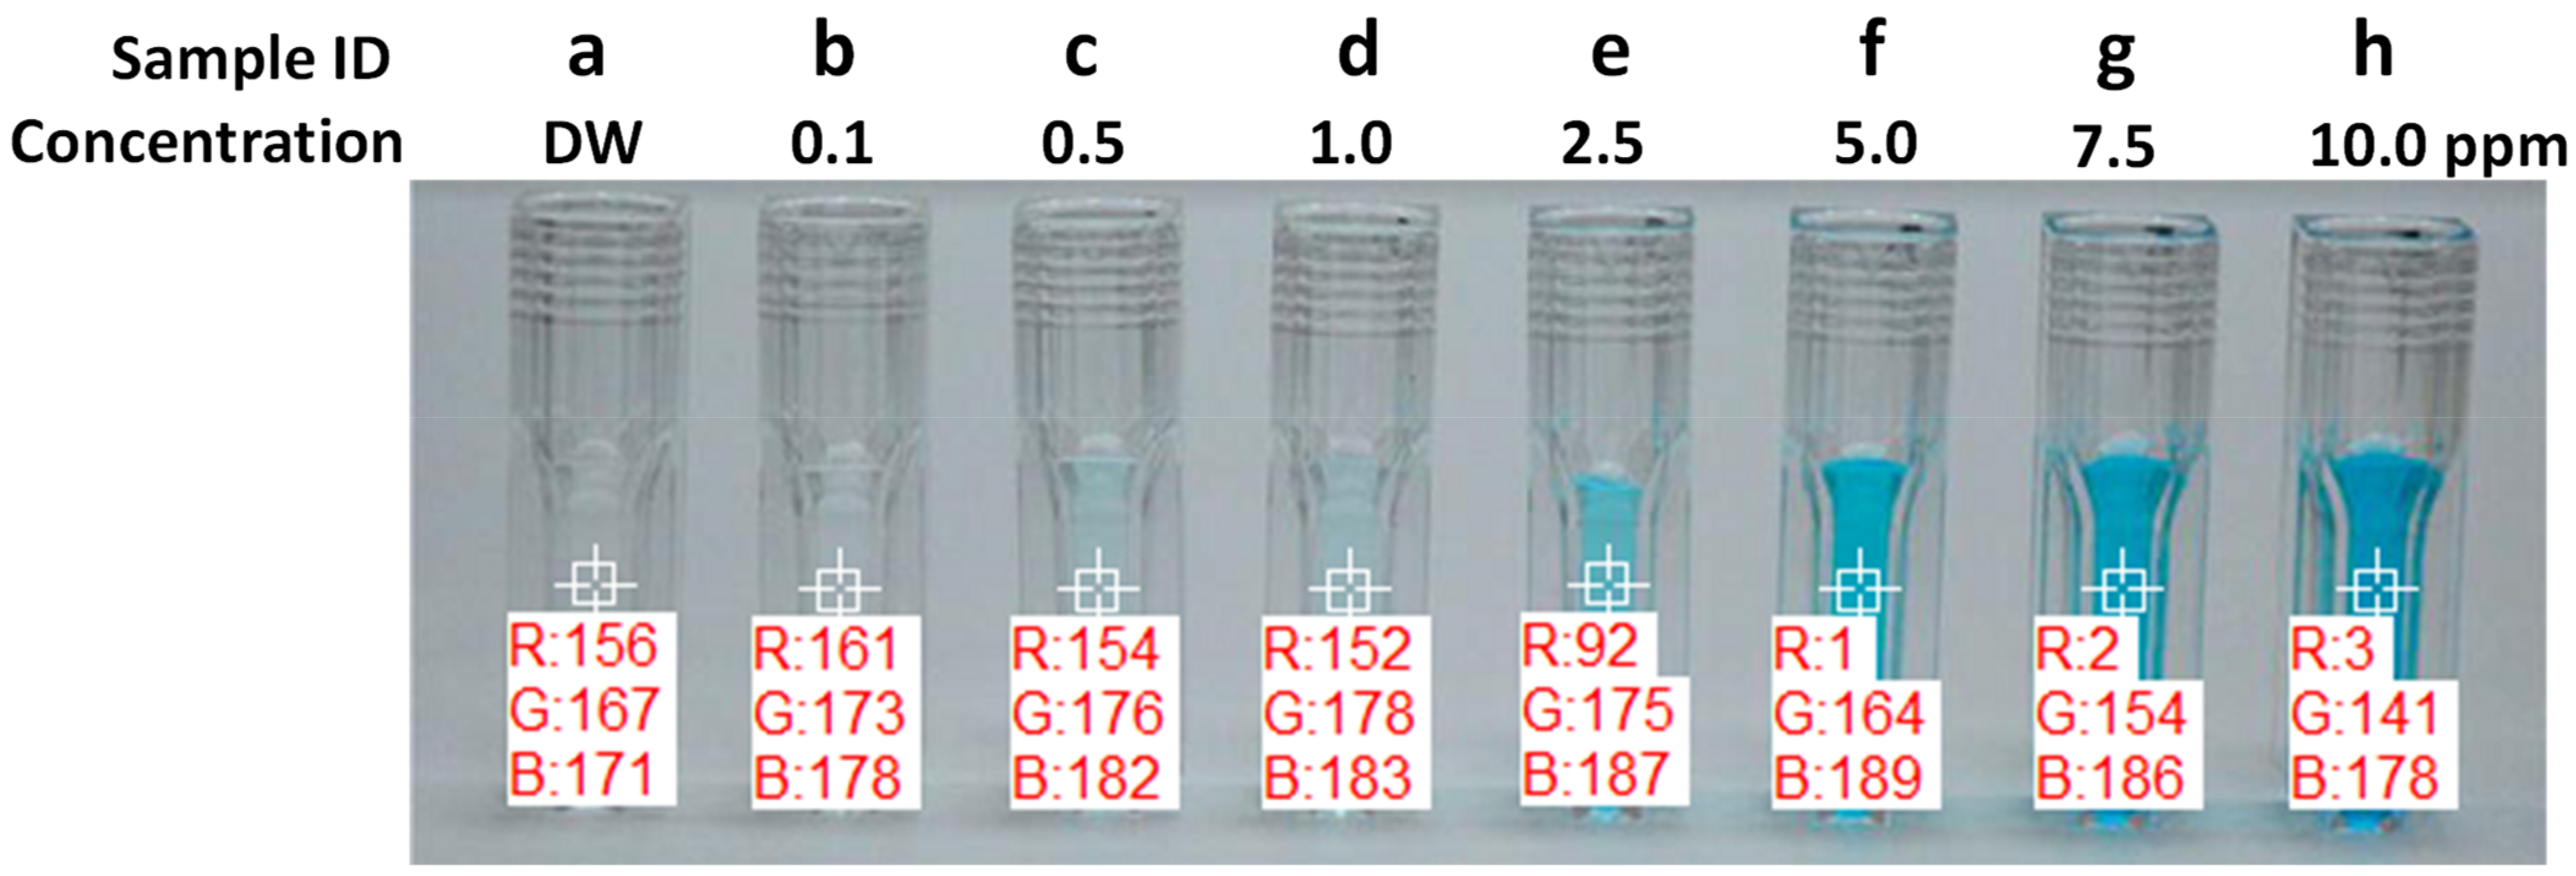
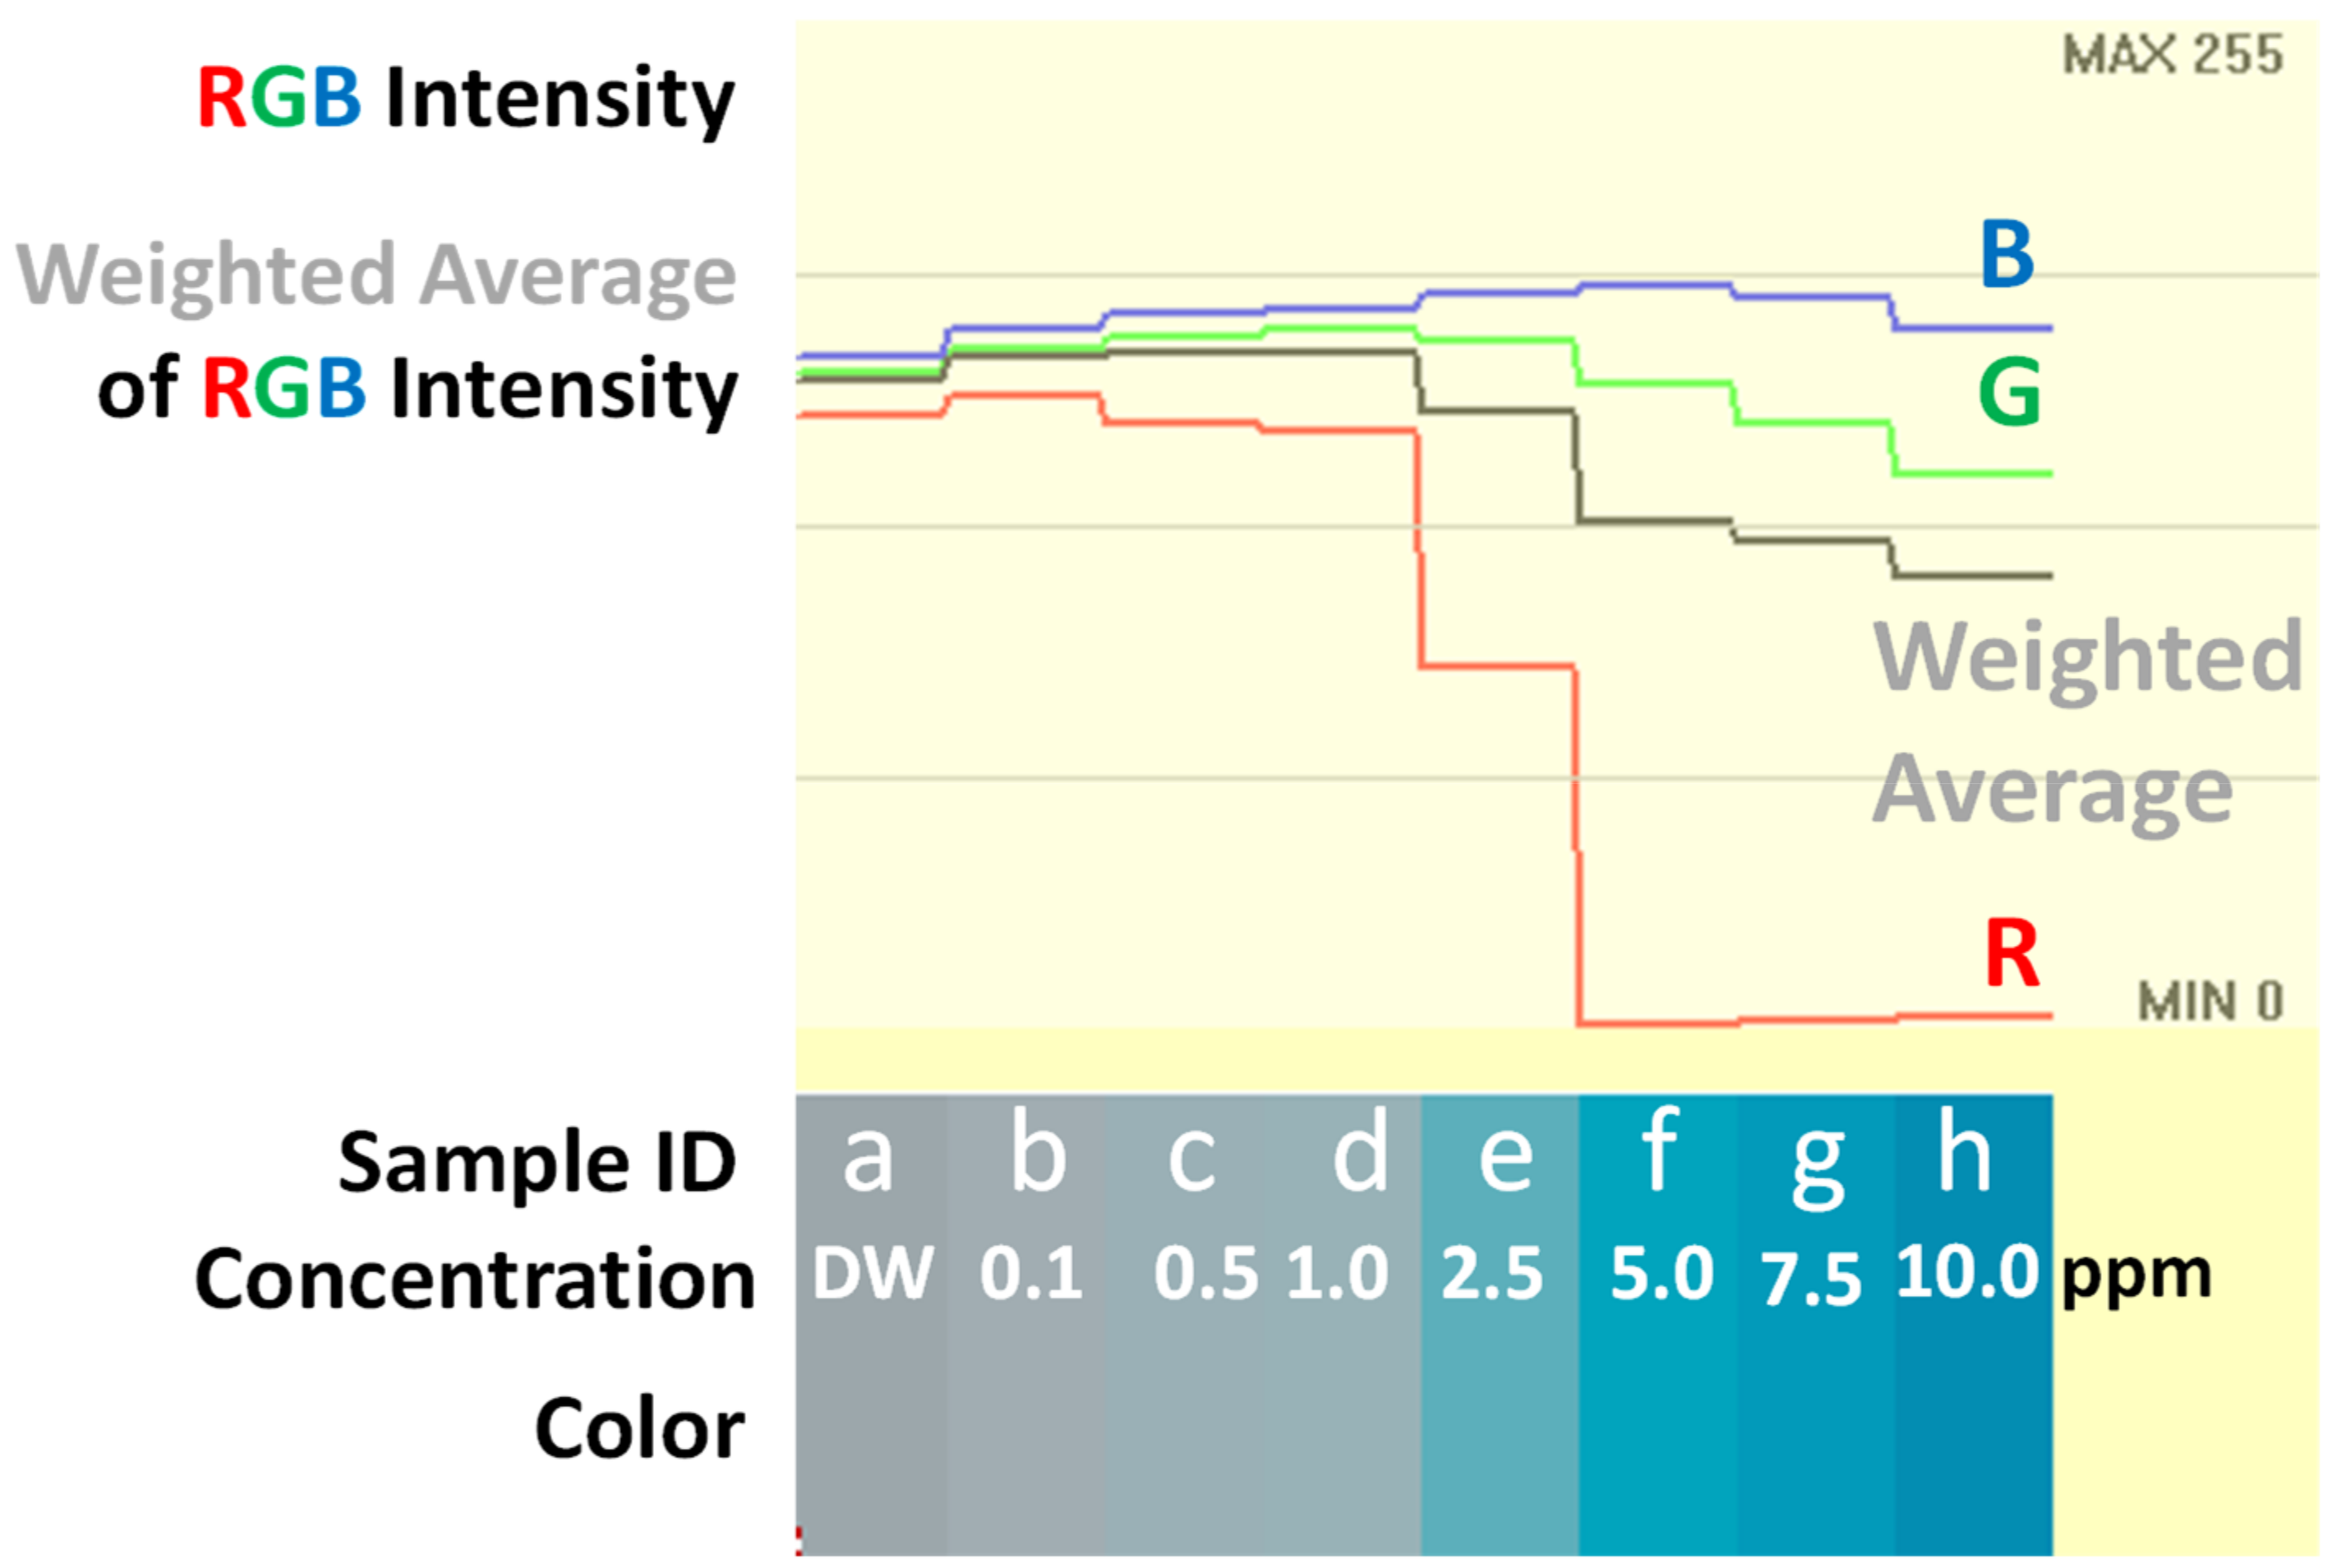
3.2. Methylene Blue (MB) Solutions
3.3. Water Quality Inspection Color Chart
3.4. Tongue Color
4. Discussion
5. Conclusions
Author Contributions
Funding
Conflicts of Interest
References
- Giesel, M.; Gegenfurtner, K.R. Color appearance of real objects varying in material, hue, and shape. J. Vis. 2010, 10, 1–21. [Google Scholar] [CrossRef] [PubMed]
- Dische, Z. Qualitative and quantitative colorimetric determination of heptoses. J. Biol. Chem 1953, 204, 983–998. [Google Scholar] [CrossRef] [PubMed]
- Nimeroff, I. Colorimetry, National Bureau of Standards Monograph 104. 1968. Available online: https://nvlpubs.nist.gov/nistpubs/Legacy/MONO/nbsmonograph104.pdf (accessed on 28 February 2023).
- Bäuml, K.H. Simultaneous color constancy: How surface color perception varies with the illuminant. Vis. Res. 1999, 39, 1531–1550. [Google Scholar] [CrossRef] [PubMed]
- Mohtasebi, A.; Broomfield, A.D.; Chowdhury, T.; Ravi Selvaganapathy, P.; Peter Kruse, P. Reagent-Free Quantification of Aqueous Free Chlorine via Electrical Readout of Colorimetrically Functionalized Pencil Lines. ACS Appl. Mater. Interfaces 2017, 9, 20748–20761. [Google Scholar] [CrossRef] [PubMed]
- Yoo, W.S.; Kim, J.G.; Kang, K.; Yoo, Y. Development of Static and Dynamic Colorimetric Analysis Techniques Using Image Sensors and Novel Image Processing Software for Chemical, Biological and Medical Applications. Technologies 2023, 11, 23. [Google Scholar] [CrossRef]
- Chua, L.; Quan, S.Z.; Yan, G.; Yoo, W.S. Investigating the Colour Difference of Old and New Blue Japanese Glass Pigments for Artistic Use. J. Conserv. Sci. 2022, 38, 1–13. [Google Scholar] [CrossRef]
- Eom, T.H.; Lee, H.S. A Study on the Diagnosis Technology for Conservation Status of Painting Cultural Heritage Using Digital Image Analysis Program. Heritage 2023, 6, 1839–1855. [Google Scholar] [CrossRef]
- Lehnert, M.S.; Balaban, M.O.; Emmel, T.C. A new method for quantifying color of insects. Fla. Entomol. 2011, 94, 201–207. [Google Scholar] [CrossRef]
- Taweekarn, T.; Wongniramaikul, W.; Limsakul, W.; Sriprom, W.; Phawachalotorn, C.; Choodum, A. A novel colorimetric sensor based on modified mesoporous silica nanoparticles for rapid on-site detection of nitrite. Microchim. Acta 2020, 187, 643. [Google Scholar] [CrossRef]
- Kim, J.; Wu, Y.; Luan, H.; Yang, D.S.; Cho, D.; Kwak, S.S.; Liu, S.; Ryu, H.; Ghaffari, R.; Rogers, J.A. A Skin-Interfaced, Miniaturized Microfluidic Analysis and Delivery System for Colorimetric Measurements of Nutrients in Sweat and Supply of Vitamins Through the Skin. Adv. Sci. 2022, 9, 2103331. [Google Scholar] [CrossRef]
- Horzov, L.; Goncharuk-Khomyn, M.; Hema-Bahyna, N.; Yurzhenko, A.; Melnyk, V. Analysis of tongue colorassociated features among patients with PCR-confirmed Covid-19 infection in Ukraine. Pesqui Bras. Odontopediatria Clín. Integr. 2021, 21, e0011. [Google Scholar] [CrossRef]
- Chen, H.S.; Chen, S.M.; Jiang, C.Y.; Zhang, Y.C.; Lin, C.Y.; Lin, C.E.; Lee, J.A. Computational tongue color simulation in tongue diagnosis. Color Res. Appl. 2021, 9, 2103331. [Google Scholar] [CrossRef]
- Segawa, M.; Iizuka, N.; Ogihara, H.; Tanaka, K.; Nakae, H.; Usuku, K.; Hamamoto, Y. Construction of a Standardized Tongue Image Database for Diagnostic Education: Development of a Tongue Diagnosis e-Learning System. Front. Med. Technol. 2021, 3, 760542. [Google Scholar] [CrossRef] [PubMed]
- Xie, J.; Congcong Jing, C.; Zhang, Z.; Xu, J.; Ye Duan, Y.; Xu, D. Digital tongue image analyses for health assessment. Med. Rev. 2021, 1, 172–198. [Google Scholar] [CrossRef]
- Sun, Z.M.; Zhao, J.; Qian, P.; Wang, Y.Q.; Zhang, W.F.; Guo, C.R.; Pang, X.Y.; Wang, S.C.; Li, F.F.; Li, Q. Metabolic markers and microecological characteristics of tongue coating in patients with chronic gastritis. BMC Complement. Altern. Med. 2013, 13, 227. Available online: http://www.biomedcentral.com/1472-6882/13/227 (accessed on 28 February 2023). [CrossRef] [PubMed]
- Kawanabe, T.; Kamarudin, N.D.; Ooi, C.Y.; Kobayashi, F.; Mi, X.; Sekine, M.; Wakasugi, A.; Odaguchi, H.; Hanawa, T. Quantification of tongue colour using machine learning in Kampo medicine. Eur. J. Integr. Med. 2016, 8, 932–941. [Google Scholar] [CrossRef]
- Zhang, B.; Wang, X.; You, J.; Zhang, D. Tongue Color Analysis for Medical Application. Evid.-Based Complement. Altern. Med. 2013, 2013, 264742. [Google Scholar] [CrossRef]
- Zhou, J.; Zhang, Q.; Zhang, B.; Chen, X. TongueNet: A Precise and Fast Tongue Segmentation System Using U-Net with a Morphological Processing Layer. Appl. Sci. 2019, 9, 3128. [Google Scholar] [CrossRef]
- Takahoko, K.; Iwasaki, H.; Sasakawa, T.; Suzuki, A.; Matsumoto, H.; Iwasaki, H. Unilateral Hypoglossal Nerve Palsy after Use of the Laryngeal Mask Airway Supreme. Case Rep. Anesthesiol. 2014, 2014, 369563. [Google Scholar] [CrossRef]
- Kılıç, V.; Alankus, G.; Horzum, N.; Mutlu, A.Y.; Bayram, A.; Solmaz, M.E. Single-Image-Referenced Colorimetric Water Quality Detection Using a Smartphone. ACS Omega 2018, 3, 5531–5536. [Google Scholar] [CrossRef]
- Alberti, G.; Zanoni, C.; Magnaghi, L.R.; Biesuz, R. Disposable and Low-Cost Colorimetric Sensors for Environmental Analysis. Int. J. Environ. Res. Public Health 2020, 17, 8331. [Google Scholar] [CrossRef] [PubMed]
- Kılıç, V.; Horzum, N.; Solmaz, M.E. From Sophisticated Analysis to Colorimetric Determination: Smartphone Spectrometers and Colorimetry. In Color Detection; IntechOpen: London, UK, 2018. [Google Scholar] [CrossRef]
- O’Donoghue, J. Simplified Low-Cost Colorimetry for Education and Public Engagement. J. Chem. Educ. 2019, 96, 1136–1142. [Google Scholar] [CrossRef]
- Hermida, I.D.P.; Prabowo, B.A.; Kurniawan, D.; Manurung, R.V.; Sulaeman, Y.; Ritadi, M.A.; Wahono, M.D. Use of Smartphone Based on Android as a Color Sensor. In Proceedings of the 2018 Electrical Power, Electronics, Communications, Controls and Informatics Seminar (EECCIS), Batu, Indonesia, 9–11 October 2018; pp. 424–429. [Google Scholar] [CrossRef]
- Han, P.; Dong, D.; Zhao, X.; Jiao, L.; Lang, Y. A smartphone-based soil color sensor: For soil type classification. Comput. Electron. Agric. 2016, 123, 232–241. [Google Scholar] [CrossRef]
- Alawsi, T.; Mattia, G.P.; Al-Bawa, Z.; Beraldi, R. Smartphone-based colorimetric sensor application for measuring biochemical material concentration. Sens. Bio-Sens. Res. 2021, 32, 100404. [Google Scholar] [CrossRef]
- Chellasamy, G.; Ankireddy, S.R.; Lee, K.N.; Govindaraju, S.; Yun, K. Smartphone-integrated colorimetric sensor array-based reader system and fluorometric detection of dopamine in male and female geriatric plasma by bluish-green fluorescent carbon quantum dots. Mater. Today Bio 2021, 12, 100168. [Google Scholar] [CrossRef]
- Böck, F.C.; Helfer, G.A.; da Costa, A.B.; Dessuy, M.B.; Flôres Ferrão, M. PhotoMetrix and colorimetric image analysis using smartphones. J. Chemom. 2020, 34, e3251. [Google Scholar] [CrossRef]
- Wongniramaikul, W.; Kleangklao, B.; Boonkanon, C.; Taweekarn, T.; Phatthanawiwat, K.; Sriprom, W.; Limsakul, W.; Towanlong, W.; Tipmanee, D.; Choodum, A. Portable Colorimetric Hydrogel Test Kits and On-Mobile Digital Image Colorimetry for On-Site Determination of Nutrients in Water. Molecules 2022, 27, 7287. [Google Scholar] [CrossRef]
- Yoo, Y.; Yoo, W.S. Turning Image Sensors into Position and Time Sensitive Quantitative Colorimetric Data Sources with the Aid of Novel Image Processing/Analysis Software. Sensors 2020, 20, 6418. [Google Scholar] [CrossRef]
- Kim, G.; Kim, J.G.; Kang, K.; Yoo, W.S. Image-Based Quantitative Analysis of Foxing Stains on Old Printed Paper Documents. Heritage 2019, 2, 2665–2677. [Google Scholar] [CrossRef]
- Yoo, W.S.; Kim, J.G.; Kang, K.; Yoo, Y. Extraction of Colour Information from Digital Images Towards Cultural Heritage Characterisation Applications. SPAFA J. 2021, 5, 1–14. [Google Scholar] [CrossRef]
- Yoo, W.S.; Kang, K.; Kim, J.G.; Yoo, Y. Extraction of Color Information and Visualization of Color Differences between Digital Images through Pixel-by-Pixel Color-Difference Mapping. Heritage 2022, 5, 3923–3945. [Google Scholar] [CrossRef]
- Yoo, Y.; Yoo, W.S. Digital Image Comparisons for Investigating Aging Effects and Artificial Modifications Using Image Analysis Software. J. Conserv. Sci. 2021, 37, 1–12. [Google Scholar] [CrossRef]
- Kim, J.G.; Yoo, W.S.; Jang, Y.S.; Lee, W.J.; Yeo, I.G. Identification of Polytype and Estimation of Carrier Concentration of Silicon Carbide Wafers by Analysis of Apparent Color using Image Processing Software. ECS J. Solid State Sci. Technol. 2022, 11, 064003. [Google Scholar] [CrossRef]
- Yoo, W.S.; Kang, K.; Kim, J.G.; Jung, Y.-H. Development of Image Analysis Software for Archaeological Applications. Adv. Southeast Asian Archaeol. 2019, 2, 402–411. [Google Scholar]
- Yoo, W.S.; Han, H.S.; Kim, J.G.; Kang, K.; Jeon, H.-S.; Moon, J.-Y.; Park, H. Development of a tablet PC-based portable device for colorimetric determination of assays including COVID-19 and other pathogenic microorganisms. RSC Adv. 2020, 10, 32946–32952. [Google Scholar] [CrossRef] [PubMed]
- Wakamoto, K.; Otsuka, T.; Nakahara, K.; Namazu, T. Degradation Mechanism of Pressure-Assisted Sintered Silver by Thermal Shock Test. Energies 2021, 14, 5532. [Google Scholar] [CrossRef]
- Jo, S.-I.; Jeong, G.-H. Single-Walled Carbon Nanotube Synthesis Yield Variation in a Horizontal Chemical Vapor Deposition Reactor. Nanomaterials 2021, 11, 3293. [Google Scholar] [CrossRef]
- Zhu, C.; Espulgar, W.V.; Yoo, W.S.; Koyama, S.; Dou, X.; Kumanogoh, A.; Tamiya, E.; Takamatsu, H.; Saito, M. Single Cell Receptor Analysis Aided by a Centrifugal Microfluidic Device for Immune Cells Profiling. Bull. Chem. Soc. Jpn. 2019, 92, 1834–1839. [Google Scholar] [CrossRef]
- Men’s T-Shirts. Available online: https://www.pinterest.com/pin/624733779558363886/ (accessed on 28 February 2023).
- AquaChek Color Chart. Available online: https://www.masterspaparts.com/aquachek-color-chart/ (accessed on 28 February 2023).
- What Is Chinese Tongue Diagnosis? Available online: https://www.lucyclarkeacupuncture.co.uk/what-is-chinese-tongue-diagnosis/ (accessed on 28 February 2023).
- Color Model. Available online: https://en.wikipedia.org/wiki/Color_model (accessed on 28 February 2023).
- Color Space. Available online: https://en.wikipedia.org/wiki/Color_space (accessed on 28 February 2023).
- Color Conversion. Available online: https://en.wikipedia.org/wiki/HSL_and_HSV (accessed on 28 February 2023).
- Palum, R. Image Sampling with the Bayer Color Filter Array. In PICS 2001: Image Processing, Image Quality, Image Capture, Systems Conference, Montréal, QC, Canada, 22–25 April 2001; The Society for Imaging Science and Technology: Cambridge, MA, USA; pp. 239–245. ISBN 0-89208-232-1.
- Zhao, M.; Liu, Q.; Jha, A.; Deng, R.; Yao, T.; Mahadevan-Jansen, A.; Tyska, M.J.; Millis, B.A.; Huo, Y. VoxelEmbed: 3D Instance Segmentation and Tracking with Voxel Embedding based Deep Learning. In Machine Learning in Medical Imaging; Lian, C., Cao, X., Rekik, I., Xu, X., Yan, P., Eds.; Lecture Notes in Computer Science; Springer: Cham, Switzerland, 2021; Volume 12966, pp. 437–446. [Google Scholar] [CrossRef]
- Yao, T.; Qu, C.; Liu, Q.; Deng, R.; Tian, Y.; Xu, J.; Jha, A.; Bao, S.; Zhao, M.; Fogo, A.B.; et al. Compound Figure Separation of Biomedical Images with Side Loss. In Deep Generative Models, and Data Augmentation, Labelling, and Imperfections; Lecture Notes in Computer Science; Springer: Cham, Switzerland, 2021; Volume 13003, p. 183. [Google Scholar] [CrossRef]
- Zheng, Q.; Yang, M.; Zhang, Q.; Zhang, X. Fine-grained image classification based on the combination of artificial features and deep convolutional activation features. In Proceedings of the 2017 IEEE/CIC International Conference on Communications in China (ICCC), Qingdao, China, 22–24 October 2017; pp. 1–6. [Google Scholar] [CrossRef]
- Zheng, Q.; Yang, M.; Tian, X.; Wang, X.; Wang, D. Rethinking the Role of Activation Functions in Deep Convolutional Neural Networks for Image Classification. Eng. Lett. 2020, 28, EL_28_1_11. [Google Scholar]
- Yoo, W.S. The World’s Oldest Book Printed by Movable Metal Type in Korea in 1239: The Song of Enlightenment. Heritage 2022, 5, 1089–1119. [Google Scholar] [CrossRef]
- Yoo, W.S. How Was the World’s Oldest Metal-Type-Printed Book (The Song of Enlightenment, Korea, 1239) Misidentified for Nearly 50 Years? Heritage 2022, 5, 1779–1804. [Google Scholar] [CrossRef]
- Yoo, W.S. Direct Evidence of Metal Type Printing in The Song of Enlightenment, Korea, 1239. Heritage 2022, 5, 3329–3358. [Google Scholar] [CrossRef]
- Yoo, W.S. Ink Tone Analysis of Printed Character Images towards Identification of Medieval Korean Printing Technique: The Song of Enlightenment (1239), the Jikji (1377) and the Gutenberg Bible (~1455). Heritage 2023, 6, 2559–2581. [Google Scholar] [CrossRef]
- PicManTV. Available online: https://www.youtube.com/@picman-TV (accessed on 28 February 2023).


| Brightness | RGB Values | HSV Values | CIELAB Values | Munsell Color | Average Color | |||||||||||||||
|---|---|---|---|---|---|---|---|---|---|---|---|---|---|---|---|---|---|---|---|---|
| ID | Area (Pixel) | Intensity Mean | Intensity StdDev | Red Mean | Red StdDev | Green Mean | Green StdDev | Blue Mean | Blue StdDev | H | S | V | L* | a* | b* | h | V | C | Hex Color Code | Color |
| a | 24,742 | 97.1 | 61.0 | 100.2 | 88.8 | 92.4 | 81.3 | 105.0 | 72.5 | 280.0 | 0.12 | 0.41 | 40.2 | 5.7 | −5.7 | 5 P | 3 | 4 | #645C68 | |
| b | 21,366 | 115.9 | 34.5 | 87.2 | 31.7 | 121.3 | 37.0 | 135.2 | 35.4 | 197.5 | 0.36 | 0.53 | 48.8 | −8.4 | −11.5 | 7.5 B | 5 | 2 | #577987 | |
| c | 25,275 | 136.3 | 32.3 | 205.5 | 25.5 | 89.0 | 36.9 | 163.1 | 35.5 | 321.5 | 0.57 | 0.80 | 54.7 | 54.8 | −17.9 | 2.5 RP | 5 | 12 | #CD58A3 | |
| d | 25,365 | 100.7 | 55.9 | 158.0 | 44.9 | 73.2 | 58.5 | 99.8 | 64.1 | 341.6 | 0.54 | 0.62 | 42.7 | 38.1 | 1.9 | 10 RP | 3 | 8 | #9E4963 | |
| e | 23,411 | 109.5 | 40.7 | 178.5 | 51.6 | 95.3 | 54.5 | 70.4 | 46.9 | 13.9 | 0.61 | 0.70 | 49.6 | 31.3 | 29.2 | 10 R | 5 | 8 | #B25F46 | |
| f | 21,958 | 155.8 | 46.4 | 179.8 | 58.2 | 140.0 | 53.5 | 164.9 | 54.8 | 323.1 | 0.22 | 0.70 | 62.5 | 18.8 | −7.0 | 10 P | 8 | 2 | #B38CA4 | |
| g | 19,368 | 189.5 | 25.5 | 227.8 | 20.3 | 214.2 | 23.2 | 103.3 | 42.1 | 53.7 | 0.55 | 0.89 | 84.7 | −9.5 | 55.6 | 7.5 Y | 8 | 8 | #E3D667 | |
| h | 23,574 | 102.6 | 56.1 | 81.2 | 61.6 | 108.4 | 67.1 | 113.7 | 52.8 | 189.4 | 0.28 | 0.44 | 43.8 | −8.6 | −6.0 | 10 BG | 3 | 2 | #516C71 | |
| i | 24,971 | 92.7 | 40.1 | 102.4 | 74.1 | 76.4 | 46.2 | 117.3 | 55.6 | 278.0 | 0.35 | 0.46 | 36.5 | 19.3 | −19.3 | 5 P | 5 | 6 | #664C75 | |
| j | 22,275 | 123.7 | 31.8 | 35.9 | 37.9 | 139.4 | 33.4 | 181.7 | 28.8 | 197.3 | 0.81 | 0.71 | 54.2 | −14.0 | −30.2 | 10 B | 7 | 10 | #238BB5 | |
| k | 19,739 | 137.4 | 36.6 | 165.0 | 30.6 | 131.6 | 39.4 | 122.7 | 40.4 | 12.6 | 0.26 | 0.65 | 57.7 | 11.6 | 9.8 | 10 R | 5 | 4 | #A5837A | |
| l | 25,247 | 92.9 | 58.7 | 65.3 | 56.0 | 105.0 | 58.7 | 97.9 | 62.3 | 168.0 | 0.38 | 0.41 | 41.4 | −16.1 | 0.0 | 2.5 BG | 4 | 2 | #416961 | |
| m | 23,587 | 122.2 | 46.5 | 114.5 | 45.4 | 112.7 | 47.6 | 150.3 | 45.8 | 243.2 | 0.25 | 0.59 | 48.7 | 9.4 | −20.3 | 10 PB | 6 | 2 | #727096 | |
| n | 24,079 | 89.6 | 62.3 | 118.5 | 76.1 | 83.7 | 77.5 | 74.1 | 65.2 | 12.3 | 0.37 | 0.46 | 38.8 | 13.3 | 11.1 | 10 R | 5 | 4 | #76534A | |
| o | 21,736 | 77.0 | 43.9 | 121.3 | 75.5 | 58.1 | 48.5 | 71.9 | 55.9 | 347.6 | 0.52 | 0.47 | 33.0 | 28.9 | 4.9 | 7.5 RP | 5 | 4 | #793A47 | |
| p | 24,273 | 79.3 | 56.0 | 117.1 | 92.3 | 73.7 | 72.5 | 54.1 | 49.8 | 18.1 | 0.54 | 0.46 | 35.6 | 16.5 | 19.1 | 2.5 YR | 4 | 6 | #754936 | |
| q | 25,645 | 102.1 | 51.5 | 84.5 | 62.3 | 95.0 | 52.2 | 135.7 | 49.5 | 228.2 | 0.38 | 0.53 | 40.6 | 6.9 | −24.1 | 7.5 PB | 5 | 4 | #545E87 | |
| r | 23,373 | 116.8 | 34.9 | 100.3 | 80.0 | 102.8 | 45.2 | 162.8 | 42.9 | 238.1 | 0.38 | 0.64 | 45.4 | 14.5 | −32.7 | 7.5 PB | 2 | 8 | #6466A2 | |
| s | 24,780 | 132.8 | 28.7 | 81.2 | 32.5 | 166.1 | 27.0 | 119.3 | 31.0 | 146.8 | 0.51 | 0.65 | 62.0 | −36.9 | 16.6 | 5 G | 7 | 4 | #51A677 | |
| t | 23,795 | 144.7 | 24.1 | 143.8 | 24.2 | 144.1 | 24.2 | 148.0 | 23.8 | 228.0 | 0.03 | 0.58 | 59.8 | 0.4 | −2.3 | 7.5 PB | 6 | 4 | #8F9094 | |
| u | 22,178 | 132.8 | 26.1 | 97.0 | 31.7 | 182.0 | 22.7 | 71.8 | 32.3 | 106.4 | 0.61 | 0.71 | 66.5 | −46.4 | 47.1 | 10 GY | 8 | 8 | #60B547 | |
| v | 20,812 | 164.5 | 28.9 | 153.6 | 63.8 | 171.6 | 36.7 | 162.7 | 58.5 | 150.0 | 0.11 | 0.67 | 68.4 | −8.1 | 2.5 | 7.5 G | 7 | 2 | #99ABA2 | |
| w | 22,275 | 119.0 | 46.7 | 88.0 | 54.9 | 109.3 | 54.5 | 171.0 | 46.6 | 224.8 | 0.49 | 0.67 | 46.9 | 9.7 | −35.6 | 7.5 PB | 7 | 6 | #586DAB | |
| x | 24,872 | 143.8 | 52.0 | 196.0 | 68.9 | 144.5 | 86.4 | 91.7 | 56.5 | 30.6 | 0.53 | 0.76 | 63.6 | 13.1 | 35.5 | 7.5 YR | 7 | 4 | #C3905B | |
| y | 25,236 | 125.0 | 40.3 | 164.7 | 30.6 | 106.0 | 45.5 | 124.6 | 42.1 | 340.7 | 0.36 | 0.64 | 51.2 | 26.3 | −0.7 | 5 RP | 4 | 2 | #A4697C | |
| z | 25,609 | 109.0 | 53.3 | 161.4 | 68.9 | 115.9 | 73.4 | 44.3 | 39.6 | 36.4 | 0.73 | 0.63 | 51.9 | 11.1 | 44.8 | 10YR | 7 | 8 | #A1732C | |
| aa | 26,092 | 183.5 | 42.9 | 206.9 | 26.6 | 170.2 | 52.1 | 188.3 | 46.0 | 330.0 | 0.17 | 0.81 | 73.2 | 16.1 | −4.3 | 2.5 RP | 7 | 4 | #CEAABC | |
| ab | 23,683 | 112.4 | 43.1 | 193.5 | 39.0 | 97.9 | 60.8 | 61.9 | 41.6 | 16.4 | 0.68 | 0.76 | 52.1 | 35.6 | 37.7 | 10 R | 7 | 8 | #C1613D | |
| ac | 23,160 | 140.8 | 36.6 | 88.4 | 54.9 | 167.4 | 41.4 | 141.4 | 51.8 | 160.3 | 0.47 | 0.65 | 63.0 | −30.7 | 6.0 | 10 G | 7 | 4 | #58A78D | |
| Sample ID | a | b | c | d | e | f | g | h | |
|---|---|---|---|---|---|---|---|---|---|
| Concentration (ppm) | DW | 0.1 | 0.2 | 0.5 | 1.0 | 2.5 | 5.0 | 10.0 | |
| Representing Color | |||||||||
| RGB Color | R | 156 | 161 | 154 | 152 | 92 | 1 | 2 | 3 |
| G | 167 | 173 | 176 | 178 | 175 | 164 | 154 | 141 | |
| B | 171 | 178 | 182 | 183 | 187 | 189 | 186 | 178 | |
| Average ** | 165 | 171 | 172 | 172 | 157 | 129 | 124 | 115 | |
| HSV Color | H | 196 | 197.6 | 192.9 | 189.7 | 187.6 | 188 | 190.4 | 192.7 |
| S | 0.09 | 0.1 | 0.15 | 0.17 | 0.51 | 0.99 | 0.99 | 0.98 | |
| V | 0.67 | 0.7 | 0.71 | 0.72 | 0.73 | 0.74 | 0.73 | 0.7 | |
| CIELAB Color | L | 67.8 | 70 | 70.4 | 70.8 | 66.9 | 61.9 | 58.7 | 54.3 |
| a | −3.06 | −3.18 | −6.29 | −7.8 | −21.91 | −26.39 | −22.26 | −18.15 | |
| b | −3.4 | −4.01 | −5.63 | −5.54 | −13.92 | −22.89 | −26.1 | −28.26 | |
| Munsell Color | Munsell-h | 7.5B | 7.5B | 5B | 5B | 2.5B | 2.5B | 2.5B | 7.5B |
| V | 8 | 6 | 8 | 8 | 9 | 5 | 7 | 6 | |
| C | 2 | 2 | 2 | 2 | 4 | 6 | 8 | 8 | |
| Hexadecimal Color | Color Code | #9CA7AB | #A1ADB2 | #9AB0B6 | #98B2B7 | #5CAFBB | #01A4BD | #029ABA | #038DB2 |
| R | G | B | Average ** | H | S | V | HexCode | Color | Remarks | ||
|---|---|---|---|---|---|---|---|---|---|---|---|
| Total Hardness | Pre Test | 64 | 43 | 160 | 77.5 | 250.8 | 0.73 | 0.63 | #402BA0 | Pre Test | |
| 0 | 4 | 25 | 146 | 50.0 | 231.1 | 0.97 | 0.57 | #041992 | Low | ||
| 100 | 39 | 56 | 171 | 80.5 | 232.3 | 0.77 | 0.67 | #2738AB | Low | ||
| 250 | 66 | 43 | 158 | 77.5 | 252.0 | 0.73 | 0.62 | #422B9E | OK | ||
| 500 | 135 | 59 | 158 | 102.8 | 286.1 | 0.63 | 0.62 | #873B9E | OK | ||
| 1000 | 145 | 32 | 139 | 87.0 | 303.2 | 0.78 | 0.57 | #91208B | High | ||
| Total Chlorine (ppm) Total Bromine | Pre Test | 188 | 220 | 150 | 194.5 | 87.4 | 0.32 | 0.86 | #BCDC96 | Pre test | |
| 0 | 254 | 255 | 168 | 233.0 | 60.7 | 0.34 | 1.00 | #FEFFA8 | |||
| 0.5 | 241 | 254 | 171 | 230.0 | 69.4 | 0.33 | 1.00 | #F1FEAB | |||
| 1 | 232 | 246 | 159 | 220.8 | 69.7 | 0.35 | 0.96 | #E8F69F | OK | ||
| 3 | 185 | 216 | 139 | 189.0 | 84.2 | 0.36 | 0.85 | #B9D88B | Ideal | ||
| 5 | 146 | 197 | 121 | 165.3 | 100.3 | 0.39 | 0.77 | #92C579 | OK | ||
| 10 | 77 | 162 | 97 | 124.5 | 134.1 | 0.52 | 0.64 | #4DA261 | |||
| Free Chroline (ppm) | Pre Test | 184 | 160 | 226 | 182.5 | 261.8 | 0.29 | 0.89 | #B8A0E2 | Pre Test | |
| 0 | 254 | 253 | 206 | 241.5 | 58.8 | 0.19 | 1.00 | #FEFDCE | Low | ||
| 0.5 | 246 | 249 | 228 | 243.0 | 68.6 | 0.08 | 0.98 | #F6F9E4 | Low | ||
| 1 | 231 | 223 | 217 | 223.5 | 25.7 | 0.06 | 0.91 | #E7DFD9 | Poor | ||
| 3 | 173 | 139 | 208 | 164.8 | 269.6 | 0.33 | 0.82 | #AD8BD0 | Spa OK | ||
| 5 | 159 | 106 | 189 | 140.0 | 278.3 | 0.44 | 0.74 | #9F6ABD | Spa OK | ||
| 10 | 128 | 29 | 153 | 84.8 | 287.9 | 0.81 | 0.60 | #801D99 | High | ||
| pH | Pre Test | 225 | 79 | 37 | 105.0 | 13.4 | 0.84 | 0.88 | #E14F25 | Pre Test | |
| 6.2 | 242 | 174 | 63 | 163.3 | 37.2 | 0.74 | 0.95 | #F2AE3F | Low | ||
| 6.8 | 235 | 106 | 45 | 123.0 | 19.3 | 0.81 | 0.92 | #EB6A2D | Low | ||
| 7.2 | 227 | 54 | 37 | 93.0 | 5.4 | 0.84 | 0.89 | #E33625 | OK | ||
| 7.8 | 224 | 45 | 33 | 86.8 | 3.8 | 0.85 | 0.88 | #E02D21 | OK | ||
| 8.4 | 214 | 45 | 34 | 84.5 | 3.7 | 0.84 | 0.84 | #D62D22 | High | ||
| Total Alkalinity (ppm) | Pre Test | 91 | 116 | 71 | 98.5 | 93.3 | 0.39 | 0.45 | #5B7447 | Pre Test | |
| 0 | 229 | 190 | 66 | 168.8 | 45.6 | 0.71 | 0.90 | #E5BE42 | Low | ||
| 40 | 163 | 168 | 53 | 138.0 | 62.6 | 0.68 | 0.66 | #A3A835 | Low | ||
| 80 | 138 | 158 | 60 | 128.5 | 72.2 | 0.62 | 0.62 | #8A9E3C | OK | ||
| 120 | 73 | 110 | 57 | 87.5 | 101.9 | 0.48 | 0.43 | #496E39 | OK | ||
| 180 | 35 | 82 | 48 | 61.8 | 136.6 | 0.57 | 0.32 | #235230 | High | ||
| 240 | 35 | 88 | 98 | 77.3 | 189.5 | 0.64 | 0.38 | #235862 | High | ||
| Cyanuric Acid (ppm) | Pre Test | 205 | 99 | 37 | 110.0 | 22.1 | 0.82 | 0.80 | #CD6325 | Pre Test | |
| 0 | 229 | 136 | 49 | 137.5 | 29.0 | 0.79 | 0.90 | #E58831 | Low | ||
| 30–50 | 207 | 93 | 38 | 107.8 | 19.5 | 0.82 | 0.81 | #CF5D26 | OK | ||
| 100 | 190 | 38 | 32 | 74.5 | 2.3 | 0.83 | 0.75 | #BE2620 | OK | ||
| 150 | 177 | 37 | 124 | 93.8 | 322.7 | 0.79 | 0.69 | #B1257C | High | ||
| 300 | 121 | 27 | 127 | 75.5 | 296.4 | 0.79 | 0.50 | #791B7F | High |
| No. | Region of Interest | Area (Pixel) | Red | Green | Green | Hexadecimal Color | HSV | CIELAB | Munsell Color | |||||||||||||||||||
|---|---|---|---|---|---|---|---|---|---|---|---|---|---|---|---|---|---|---|---|---|---|---|---|---|---|---|---|---|
| Mean | Min | Max | Range | Stdev | Mean | Min | Max | Range | Stdev | Mean | Min | Max | Range | Stdev | Hex Code | Color | H | S | V | L* | a* | b* | h | V | C | |||
| 1 | Heart | 5495 | 202.6 | 47 | 227 | 180 | 30.9 | 105.7 | 81 | 217 | 136 | 12.7 | 106.1 | 67 | 230 | 163 | 18.0 | #CA696A | 359.4 | 0.48 | 0.79 | 55.8 | 38.5 | 17.1 | 2.5 R | 7 | 6 | |
| 2 | Lung | 19,641 | 214.5 | 47 | 244 | 197 | 24.1 | 122.3 | 82 | 217 | 135 | 12.0 | 123.3 | 82 | 230 | 148 | 13.0 | #D67A7B | 359.3 | 0.43 | 0.84 | 61.3 | 35.8 | 15.2 | 2.5 R | 7 | 6 | |
| 3 | Spleen, Stomach | 11,939 | 215.8 | 47 | 252 | 205 | 39.7 | 129.7 | 82 | 220 | 138 | 16.5 | 130.9 | 88 | 230 | 142 | 15.8 | #D78182 | 359.3 | 0.4 | 0.84 | 63.1 | 33.3 | 13.8 | 2.5 R | 7 | 6 | |
| 4 | Liver, Gallbladder (Left) | 49,115 | 227.7 | 47 | 255 | 208 | 21.0 | 150.3 | 82 | 225 | 143 | 17.7 | 150.1 | 113 | 230 | 117 | 17.4 | #E39696 | 0 | 0.34 | 0.89 | 69.7 | 29.0 | 12.0 | 5 R | 6 | 2 | |
| 5 | Liver, Gallbladder (Right) | 12,972 | 224.4 | 47 | 255 | 208 | 21.8 | 135.4 | 82 | 217 | 135 | 15.7 | 133.5 | 87 | 230 | 143 | 16.0 | #E08785 | 1.3 | 0.41 | 0.88 | 65.6 | 33.8 | 15.7 | 5 R | 6 | 10 | |
| 6 | Kidney, Bladder, Intestines | 28,219 | 205.0 | 47 | 255 | 208 | 32.5 | 129.5 | 26 | 217 | 191 | 28.9 | 126.9 | 29 | 230 | 201 | 29.9 | #CD817E | 2.3 | 0.39 | 0.8 | 61.8 | 29.0 | 14.0 | 2.5 R | 8 | 4 | |
Disclaimer/Publisher’s Note: The statements, opinions and data contained in all publications are solely those of the individual author(s) and contributor(s) and not of MDPI and/or the editor(s). MDPI and/or the editor(s) disclaim responsibility for any injury to people or property resulting from any ideas, methods, instructions or products referred to in the content. |
© 2023 by the authors. Licensee MDPI, Basel, Switzerland. This article is an open access article distributed under the terms and conditions of the Creative Commons Attribution (CC BY) license (https://creativecommons.org/licenses/by/4.0/).
Share and Cite
Yoo, W.S.; Kang, K.; Kim, J.G.; Yoo, Y. Image-Based Quantification of Color and Its Machine Vision and Offline Applications. Technologies 2023, 11, 49. https://doi.org/10.3390/technologies11020049
Yoo WS, Kang K, Kim JG, Yoo Y. Image-Based Quantification of Color and Its Machine Vision and Offline Applications. Technologies. 2023; 11(2):49. https://doi.org/10.3390/technologies11020049
Chicago/Turabian StyleYoo, Woo Sik, Kitaek Kang, Jung Gon Kim, and Yeongsik Yoo. 2023. "Image-Based Quantification of Color and Its Machine Vision and Offline Applications" Technologies 11, no. 2: 49. https://doi.org/10.3390/technologies11020049
APA StyleYoo, W. S., Kang, K., Kim, J. G., & Yoo, Y. (2023). Image-Based Quantification of Color and Its Machine Vision and Offline Applications. Technologies, 11(2), 49. https://doi.org/10.3390/technologies11020049