Article

The Impact of Patient Capital on Innovation Quantity and Quality Among SMEs

School of Economics and Management, Beijing Jiaotong University, Beijing 100044, China
*
Author to whom correspondence should be addressed.
Int. J. Financ. Stud. 2026, 14(8), 221; https://doi.org/10.3390/ijfs14080221
Submission received: 17 June 2026 / Revised: 11 August 2026 / Accepted: 14 August 2026 / Published: 17 August 2026

Abstract

Drawing on panel data from firms listed on the SME Board and Growth Enterprise Market (GEM) between 2010 and 2024, this study examines how patient capital influences SME innovation. It considers both the quantity and quality of innovation and investigates the underlying mechanisms. Using the China Industrial Enterprises Database (2000–2014), it further explores the innovation effects of patient capital on unlisted SMEs. The empirical findings are as follows. First, patient capital, measured by the proportion of relationship-based debt and stable equity, exhibits a significant and robust positive association with the output and quality of SME innovation, and this association gradually strengthens over time. Second, heterogeneity analyses show that relationship-based debt is more strongly associated with innovation in state-owned enterprises and national-level “Little Giant” firms (specialized, refined, distinctive, innovative SMEs), whereas stable equity is significantly associated with innovation only in private and ordinary enterprises. The association between stable equity and innovation is more pronounced in non-regulated industries, while the association for relationship-based debt remains consistent across industries. Third, mechanism tests reveal that patient capital is linked to SME innovation through four channels: alleviating financing constraints, fostering university–industry–research collaboration, improving knowledge conversion efficiency, and strengthening market power. Fourth, an extended analysis confirms that patient capital is also significantly associated with innovation among unlisted SMEs, indicating strong external validity of the study’s conclusions. Based on these findings, this paper advocates for establishing a long-term financing mechanism oriented toward patient capital, with differentiated allocation and optimization of institutional environments across industries. Such an approach should facilitate three transmission channels—university–industry–research collaboration, knowledge transfer, and market power—while extending policy coverage to unlisted SMEs, thereby nurturing a virtuous cycle ecosystem of “long-term capital → sustained R&D → high-quality innovation.”

1. Introduction and Literature Review

Small and medium-sized enterprises (SMEs) constitute a vital force within global innovation systems. Across both developed and developing economies, SMEs contribute substantially to technological innovation and employment growth (Acs & Audretsch, 1990; Beck & Demirguc-Kunt, 2006). Nevertheless, these enterprises face systemic disadvantages in innovation financing. Innovation activities involve high uncertainty, extended return cycles, information asymmetries, and intangible knowledge assets. These characteristics create a fundamental structural mismatch between SME financing needs and the short-term orientation of conventional capital markets (Carpenter & Petersen, 2002; Hall et al., 2010). Compared to larger firms, SMEs typically lack credit histories, collateral assets, and mature financial disclosure mechanisms, further exacerbating their difficulties in securing external innovation finance (Beck et al., 2008; Hadjimanolis, 2000). Addressing the innovation financing constraints confronting SMEs remains a critical concern for both academia and policymakers.
In recent years, scholarly attention has increasingly focused on the role of capital’s “temporal dimension” in shaping corporate innovation behavior. Central to this line of inquiry is the question of how investors’ holding periods and their tolerance for short-term losses influence firms’ innovation decisions and outcomes (Aghion et al., 2013; Chemmanur et al., 2014).
Patient capital, characterized by its long-term investment orientation, is regarded as an effective mechanism for counteracting the suppressive effect of short-termism on corporate R&D. It achieves this by providing stable financing, alleviating managerial myopia, and enabling firms to undertake innovation projects entailing higher risk and extended time horizons (Ferreira et al., 2014; Tian & Wang, 2014).
Existing research on patient capital and SME innovation can be grouped into three main streams. The first concerns the conceptual definition of patient capital. Studies typically define patient capital along two dimensions. The first is the investment horizon and objective dimension, which emphasizes a long-term commitment beyond short-term profit pursuit (Deeg & Hardie, 2016; Ivashina & Lerner, 2019; Friedman, 2010). The second is the risk preference and behavioral characteristics dimension, which emphasizes a high tolerance for risk under uncertainty (Kaplan & Strömberg, 2009). Building on this foundation, scholars have situated patient capital within broader institutional and ecological contexts. Adner (2016) argues from an ecosystem perspective that constructing a complete development ecosystem is a prerequisite for patient capital to achieve comprehensive returns. Nanda and Rhodes-Kropf (2017) demonstrate that when investors anticipate limited future funding, they retreat from the most innovative ventures; this finding underscores the value of patient, long-horizon capital in supporting novel technologies that would otherwise be abandoned during downturns. Ferreira et al. (2014) systematically outline a logical framework in which patient capital resolves the capital myopia dilemma through mechanisms such as strategic anchoring, resource integration, value creation, and risk-sharing. These studies converge on a fundamental consensus: patient capital is a form of capital defined by long-term holding and high risk tolerance, capable of supporting firms across economic cycles while enabling continuous accumulation of innovation capacity.
The second stream addresses the primary measurement approaches for patient capital, focusing on relational debt and stable equity. In terms of relational debt, long-term bank financing can alleviate information asymmetry between banks and innovative enterprises (Majumdar, 2011; Herrera & Minetti, 2007). It can therefore enhance firms’ willingness and capacity to invest in R&D. However, some scholars caution that excessive reliance on relational debt may raise agency costs.
Regarding stable equity, Aghion et al. (2013) find that long-term institutional investors effectively incentivize R&D investment through active participation in corporate governance, whereas short-term institutional investors exert negligible influence on innovation, highlighting the critical role of investor holding horizons in shaping innovation output. Manso (2011) proposes that stronger patient capital can reshape firms’ innovation trajectories by shifting them from incremental improvement toward disruptive transformation. This mechanism operates through a tripartite framework of management cognition, the R&D process, and organizational resources. In the context of the digital economy, Xu and Sun (2025) find that equity-based patient capital promotes key digital technology innovation more strongly than debt-based patient capital. Improvements in the credit environment positively moderate this effect.
The third stream explores the determinants of SME innovation. Owing to their limited scale, weaker risk-bearing capacity, and constrained access to formal financing channels, SMEs exhibit heightened sensitivity to the external institutional and financial environment (Hadjimanolis, 2000); hence, a robust institutional framework is indispensable for supporting their innovation. In this vein, Brown et al. (2012) report that technology finance, with patient capital as its vehicle, effectively elevates the innovation level of technology-based SMEs by alleviating financing constraints, reducing information asymmetry, and increasing risk-taking willingness. Harrison et al. (2016) note that patient capital—characterized by long-termism, value investment, and high risk tolerance—can effectively resolve the financing difficulties of SMEs and private enterprises. From the perspective of sci-tech enterprises, optimizing the supply of patient capital—manifested as “proactive investment,” “bold investment,” and “capable investment”—is crucial for driving the high-quality development of such enterprises. Additionally, Wang et al. (2025) find that patient capital formed through government-guided funds and the attraction of social capital can significantly expand firms’ access to external knowledge resources, thereby enhancing both the quantity and quality of invention patents.
Although the aforementioned studies have laid an important foundation for understanding the relationship between patient capital and corporate innovation, three key deficiencies remain that warrant further investigation and elaboration. First, the analytical framework suffers from fragmentation. Most existing studies examine the innovation effects of patient capital from a single dimension. They focus either on relationship-based debt financing (Herrera & Minetti, 2007) or on stable institutional equity (Aghion et al., 2013; Bushee, 1998). Few studies have integrated both types into a unified comparative framework. In practice, however, most small and medium-sized enterprises (SMEs) rely simultaneously on debt and equity financing. The direction and intensity of the impact of these two types of patient capital on innovation may differ substantially, necessitating an integrated analytical framework for clear differentiation. Second, the mechanism through which patient capital operates remains underspecified. Existing work attributes its innovation effect primarily to the alleviation of financing constraints. Tian and Wang (2014) find that patient capital significantly improves firm innovation quality via two routes: increasing R&D investment and elevating risk-taking levels. Aghion et al. (2013) reveal a dual mechanism in which patient capital enhances corporate total factor productivity through improved innovation efficiency and reduced uncertainty perception. These studies establish that patient capital relaxes a resource constraint. They do not explain why the relaxation must come from patient capital in particular. Suppose the binding constraint were simply the volume of available funds. Then any large enough injection of capital would produce the same effect. This distinction has not been drawn explicitly. It matters most for SMEs, whose external finance is short in horizon as well as scarce. Third, there is a lack of heterogeneity analysis. The positive association between patient capital and innovation may exhibit significant heterogeneity depending on firm ownership (state-owned vs. private), technological qualification (specialized and new “little giant” enterprises vs. ordinary firms), and industry regulatory environment (regulated vs. competitive industries). Ren et al. (2025) preliminarily reveal the unique advantages of state-owned enterprises in leveraging patient capital to drive breakthrough innovation, while Harrison et al. (2016) attend to the differential effects of patient capital on private firms. Nevertheless, systematic examination of these boundary conditions remains inadequate. Clarifying these moderating factors is of great significance for both theoretical advancement and precise policy design.
More critically, existing empirical evidence is primarily derived from large listed companies in mature capital markets—firms with well-established governance structures and diversified financing channels. Their experiences cannot be directly generalized to SMEs, the group that faces the most severe innovation financing constraints. Whether and how patient capital promotes innovation in this enterprise segment remains an unanswered academic question. Against this backdrop, the present study seeks to systematically examine the differential effects of debt-based and equity-based patient capital on SME innovation within a unified analytical framework, to delve into the underlying mechanisms, and to identify key heterogeneous boundary conditions. In doing so, it aims to contribute new academic insights to both the theoretical refinement of patient capital and the optimization of SME innovation policy.
Firm innovation is not the outcome of any single input; it emerges from the interaction of financial resources, external collaboration networks, internal knowledge processes, and market positioning. The central question is therefore not whether external capital increases innovation inputs, but how a particular type of capital acts on these different dimensions of the firm’s innovation activity.
China provides an ideal context for investigating the role of patient capital in SME innovation for three reasons. First, China hosts the world’s largest number of SMEs, which contribute over 70% of technological innovations yet have limited access to formal financing—approximately 90% of their R&D expenditures are internally funded, signaling a substantial external financing gap. Second, although China ranked 10th in the 2024 Global Innovation Index and has rapidly improved its overall innovation capacity, its SMEs still lag in innovation quality. For instance, among “specialized and new” and “little giant” firms, the average invention patent grant rate is only 36.03%, and nearly 80% of these firms lack Patent Cooperation Treaty (PCT) applications. Third, China has recently elevated patient capital to a national policy priority. In April 2024, the Political Bureau of the CPC Central Committee explicitly called for “developing venture capital and strengthening patient capital” to promote new quality productive forces. This policy shift provides a unique institutional environment for empirically examining how patient capital influences SME innovation.
Building on the above analysis, this study systematically investigates the relationship between patient capital and SME innovation. The analysis uses data from firms listed on the Growth Enterprise Market (GEM) and the Small and Medium Enterprise Board from 2010 to 2024. It also uses the China Industrial Enterprise Database from 2000 to 2014. Patient capital is operationalized along two dimensions: the relational debt ratio (share of long-term bank loans in total debt) and stable equity (ratio of institutional investor ownership to its three-year standard deviation). Innovation is measured in terms of both quantity (log of patent grants) and quality (log of average forward citations per patent in the subsequent year).
The empirical strategy proceeds through four levels of analysis. First, baseline regressions are estimated using two-way fixed effects at the firm and year levels. Second, an instrumental variable constructed as the interaction between a firm’s geographic distance from Shenzhen and year is employed in a two-stage least squares framework to mitigate reverse causality. Robustness is assessed through a battery of tests, including the inclusion of city-level controls, alternative measures of core variables, subsample regressions, exclusion of the COVID-19 shock, balanced panel specifications, and varying fixed effects. Third, heterogeneity is examined across three dimensions: ownership type, firm qualification, and degree of industry regulation. Fourth, four mechanisms—financing constraints, industry–university–research collaboration, knowledge conversion efficiency, and market power—are tested. External validity is further evaluated using a sample of unlisted industrial firms. The main findings indicate that patient capital, measured by the share of relationship-based debt and stable equity, exhibits a significant and robust positive association with both the quantity and quality of innovation among small and medium-sized enterprises (SMEs). This association holds across a range of endogeneity and robustness checks. The strength of the association differs across firm types. Relationship-based debt matters more for state-owned enterprises and for “little giant” firms. Stable equity matters more for private firms, for ordinary firms, and for firms in competitive industries. Mechanism tests identify four channels: financing constraints, industry–academia–research collaboration, knowledge conversion efficiency, and market power. An extension to unlisted industrial firms shows that these results are not confined to listed SMEs.
The marginal contributions of this paper are threefold. First, this study measures patient capital using two dimensions: relationship-based debt and stable equity. It directly compares their differential effects on SME innovation. This approach addresses the limitations of single-dimension analyses and provides a more complete empirical picture of the heterogeneous effects of different forms of patient capital. Second, this study identifies the condition under which these channels operate. Our contribution is not to discover new pathways. Financing constraints, collaboration, knowledge conversion, and market power are all well established. Our contribution is to show that each pathway is gated by time rather than by capital volume. Patient capital is therefore the relevant activating condition, not external finance in general. This also explains a pattern in the data. SMEs have the shortest-horizon external finance. They are also the firms in which these channels remain most underactivated. Third, heterogeneity analyses across ownership type, firm qualification, and industry regulatory environment provide micro-level empirical evidence for differentiated patient capital allocation policies, while the extension to unlisted SMEs establishes the broad applicability of the findings.
The remainder of the paper is organized as follows. Section 2 develops the theoretical framework and proposes research hypotheses. Section 3 describes the data sources, variable definitions, and empirical model. Section 4 presents baseline regression results, endogeneity treatment, robustness checks and heterogeneity analysis. Section 5 examines the mechanisms. Section 6 conducts an extension analysis using the sample of unlisted firms. Section 7 summarizes the conclusions and discusses policy implications.

2. Theoretical Analysis

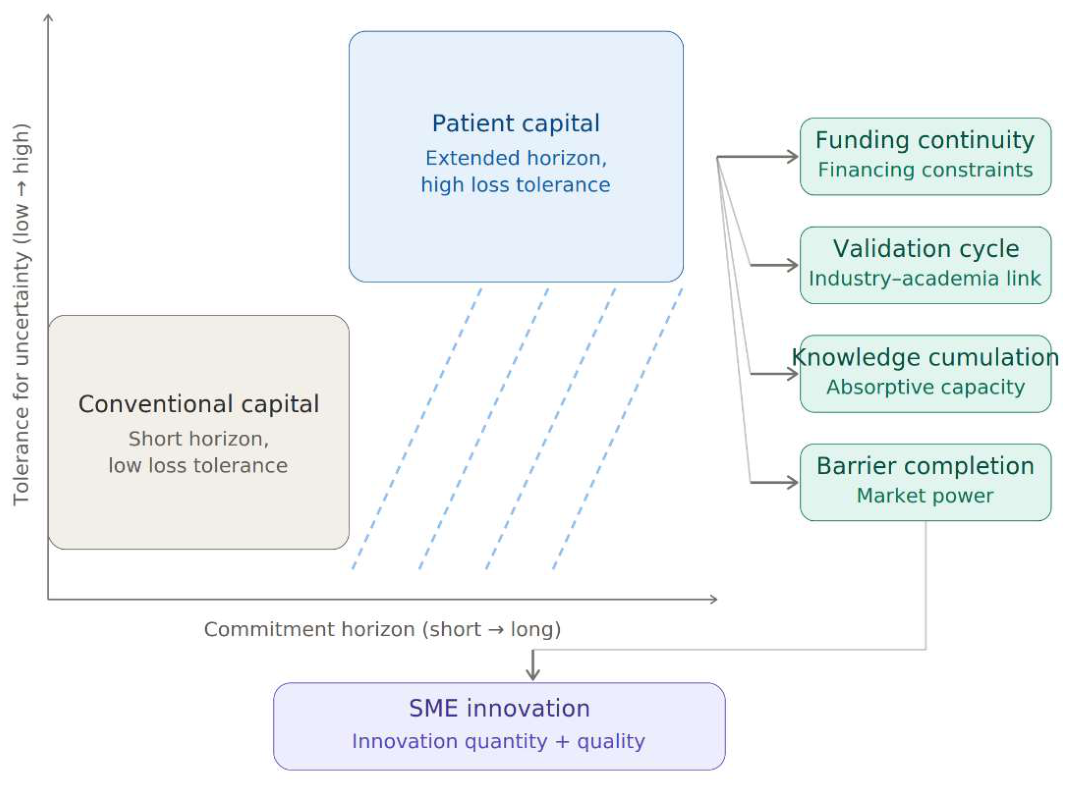
As shown in Figure 1, this section analyzes four mechanisms: financing constraints, industry–academia–research collaboration, absorptive capacity for knowledge, and market power. Most SMEs possess the latent capacity for all four, but it remains unrealized because it is bound by a temporal constraint that conventional capital cannot relax, however abundant that capital may be.
Patient capital differs from capital in general in two respects. First, it lengthens the firm’s effective decision horizon, which is set not by what managers would choose but by what financiers permit: when capital demands short-term returns, managers shorten their planning window regardless of a project’s underlying economics (Bushee, 1998). Second, it reduces intertemporal uncertainty, because long-horizon investors do not withdraw when interim results disappoint. Their tolerance for short-term losses turns a stochastic funding stream into a predictable one, lowering the probability that a multi-period project is abandoned mid-course for reasons unrelated to its technological merit (Tian & Wang, 2014; Manso, 2011).
These properties matter because each mechanism carries a time threshold below which it does not function. Financing constraints must be relaxed not in a single period but continuously across the full R&D cycle. Industry–academia–research collaboration spans basic research, applied development, pilot validation, and industrial-scale production, and a funding gap at any stage renders all prior stages worthless. Absorptive capacity is accumulated through sustained R&D, so cutting R&D in one period forfeits both that period’s output and part of the firm’s capacity to absorb knowledge later. Market power requires barriers built across multiple product generations, and a partially built barrier confers no pricing power.
Because these thresholds are defined in time rather than in money, the mechanisms are more sensitive to the temporal character of capital than to its quantity: a large but impatient injection cannot cross them, which is why the channels stay underactivated in SMEs and why patient capital, not external capital in general, is the relevant activating condition.
The four mechanisms are thus four dimensions of a single firm-level innovation system governed by the same temporal constraint; patient capital acts on that constraint, and the mechanisms are the channels through which its relaxation becomes observable. The association is therefore systemic rather than isolated, and no single channel characterizes it fully. Accordingly, we test all four rather than emphasizing the financing channel alone, as prior work has predominantly done.

2.1. Financial Constraints

By providing long-term, stable financial support, patient capital can ease the financing constraints that SMEs face in innovation, and is thereby associated with their innovation.
Innovation is high-risk, uncertain, and long-cycle, demanding substantial funding. Internal financing is limited, since SMEs’ modest profitability cannot sustain ongoing R&D from retained earnings alone. External financing involves government fiscal support and financial system funding, whose coverage is limited and cannot consistently meet the needs of numerous SMEs. The capital market’s short-term return orientation is structurally misaligned with the long-term capital innovation requires, and together with information asymmetry and project risk this leaves SMEs’ innovation under severe external financing constraints (Hall & Lerner, 2010). Tech-based SMEs and startups, lacking credit histories and collateral, face the gap most acutely, which markedly constrains their innovation capacity (Hadlock & Pierce, 2010).
Given its long horizon and high risk tolerance, patient capital eases SMEs’ financing constraints through two mechanisms. First, it supplies sufficient and continuous funding. The R&D of core technologies is highly exploratory, requiring large outlays with long payback periods that ordinary investors are reluctant to bear; patient capital, with ample resources and long-term commitment, sustains such high-risk, high-potential projects, enabling forward-looking research and higher-quality patents (Millet-Reyes, 2004).
Second, it relieves the short-term performance pressure that leads firms to curtail long-cycle, high-risk R&D to meet benchmarks, since it does not demand excessive short-term returns (Lehrer & Celo, 2016; O’Brien, 2003; Manso, 2011). Its risk tolerance means it does not withdraw when interim earnings disappoint or projects fail, preventing precautionary cuts to R&D and creating a stable funding environment for innovation.
The threshold here is continuity: an R&D program pays off only if funding survives every intervening period, since one interruption forces work-in-progress to be written off at near-zero salvage. Conventional capital may supply an equal sum but under a renewal option the investor can decline at any point, and it is this possibility of withdrawal, not withdrawal itself, that suppresses commitment to long-cycle projects. Patient capital removes the option, relaxing not only the level of the constraint but its variance across time—a dimension short-horizon funds cannot replicate regardless of scale.

2.2. Industry–Academia–Research Collaboration

By funding deep, sustained collaboration among SMEs, universities, and research institutes, patient capital helps cultivate an industry–academia–research innovation ecosystem that is associated with SME innovation.
Technological innovation is a systemic undertaking requiring coordinated engagement by governments, universities, research institutions, firms, and the financial system. Governments improve the institutional environment and fund basic research, universities supply inquiry and talent, enterprises commercialize technology, and the financial system provides long-term capital, together forming an ecosystem of deep industry–academia–research integration that bridges basic research to industrial application (Minshall et al., 2016). However, this collaboration in China faces two structural impediments: the core technologies at its center carry high knowledge-transmission costs and long validation cycles from R&D through pilot testing to deployment, while many research outputs are immature early on, with return horizons that exceed conventional capital’s patience. Constrained by limited resources, SMEs often cannot bear these long-cycle risks and are excluded from the collaborative network.
Patient capital helps embed SMEs into industry–academia–research networks through two mechanisms. First, it provides sustained funding across the full collaboration cycle—basic research, applied development, pilot validation, and industrial scaling—where a gap at any stage can jeopardize the whole prior investment; its long-term orientation and tolerance for short-term losses let it span this cycle (Wang et al., 2025) and prevent termination from capital-chain interruptions. Second, patient capital in the form of government-guided funds acts as an information bridge and credit enhancer between SMEs and research institutions: it maintains a repository of technology-transfer projects as standardized investment opportunities, commissions third-party feasibility assessments that lower SMEs’ evaluation costs, and, through project selection and monitoring, alleviates information asymmetry between investors and technology-commercialization entities, thereby attracting additional long-term funding into the industry–academia–research domain.
The threshold here is the validation cycle: collaboration proceeds sequentially, and the value of each completed stage depends on funding the next, so abandonment at the pilot stage destroys the basic and applied research already financed. Because the full cycle typically exceeds the patience of conventional capital, SMEs are often excluded ex ante, since research partners are reluctant to commit to a counterparty whose financing may lapse mid-project. Patient capital changes the firm’s standing from unreliable to credible; the mechanism operates through the commitment its funds signal, which is what admits the SME to the collaborative network in the first place.

2.3. Absorptive Capacity for Knowledge

Patient capital is associated with SME innovation by improving the efficiency with which firms convert both internal and external knowledge into innovation outputs.
Under the knowledge-based view, knowledge is an indispensable strategic resource and firms are collections of productive knowledge (Grant, 1996). A firm’s knowledge stock has two dimensions: depth, the mastery of a specific domain, and breadth, the range of fields it spans (Wu & Shanley, 2009).
SMEs face a dual challenge. On one hand, knowledge accumulated through daily operations comes mainly from “peer” relationships within the same industrial chain; depth is reinforced, but excessive accumulation in one domain narrows opportunities for reinvention and makes it hard to escape established technological trajectories (March, 1991). On the other hand, constrained by business scope and information access, SMEs struggle to expand breadth through “non-peer” relationships (Wernerfelt, 1984), so much external knowledge cannot be effectively identified, absorbed, or transformed into innovation outputs.
Patient capital improves SMEs’ knowledge-conversion efficiency through two mechanisms. First, a stable financial foundation lets firms raise R&D intensity, strengthening internal knowledge generation and conversion, since R&D is a core input to the firm’s knowledge production function (Grant, 1996). Because financial constraints often force SMEs to cut R&D, accumulation slows and reserves thin, and even externally acquired knowledge cannot be converted without investment in digestion and absorption. By easing short-term performance pressure, patient capital frees resources for R&D, accelerating the accumulation, recombination, and commercialization of knowledge and shortening the lag from basic research to applied development. Second, patient capital broadens knowledge breadth through its cross-industry base and external networks. To diversify risk, most patient capital is not confined to one industry (Yu et al., 2025), so it holds multidisciplinary reserves and wide connections that deepen with the investment horizon. Collaborating with SMEs, it identifies the diverse knowledge and partnerships needed for disruptive innovation and helps firms assess and access external knowledge, giving SMEs heterogeneous resources beyond their original trajectories and enabling technological breakthroughs.
The threshold here is cumulation. Absorptive capacity is a stock that depreciates when R&D is interrupted, and this depreciation is not symmetric with accumulation: a firm that suspends R&D does not resume where it stopped, because the tacit knowledge, technical personnel, and research relationships that constitute the stock dissipate faster than they can be rebuilt. By forcing procyclical R&D adjustment, short-horizon capital thus imposes a persistent rather than temporary cost on absorptive capacity, whereas patient capital renders R&D acyclical with respect to short-term performance pressure, protecting the accumulated stock rather than merely adding to the current flow.

2.4. Market Power

Patient capital is associated with the market power of SMEs, helping establish a virtuous cycle of “innovation–market power–profit accumulation–re-innovation” that sustains firm-level innovation.
Market power is a firm’s ability to price above marginal cost through differentiation or technological advantage, capturing supra-competitive profits (A. P. Lerner, 1934). Schumpeter’s creative destruction holds that some market power is a prerequisite for innovation, since only the prospect of monopoly rents sustains R&D (Schumpeter, 1942). Yet SMEs usually operate in highly competitive, homogeneous markets with weak pricing power and small market share, making it hard to earn the excess profits needed to cover R&D, so the positive feedback for innovation investment remains underdeveloped.
Patient capital strengthens SME market power through three mechanisms, and is thereby linked to innovation. First, sustained funding lets SMEs build technological barriers. Core innovation outputs such as patents and differentiated products are key sources of market power (Tirole, 1988), but building them requires long-cycle, large-scale R&D that short-term capital cannot sustain. With high loss tolerance and a long horizon, patient capital funds multiple product cycles, letting SMEs accumulate core-technology capabilities, establish defensible moats, and strengthen pricing power and market share.
Second, strategic empowerment expands SMEs’ market space. Institutional investors, as typical purveyors of patient capital, bring industrial resources and market networks that help SMEs enter new markets, build customer relationships, and optimize supply chains (Chemmanur et al., 2011), broadening revenue sources and market share. Larger share then yields economies of scale and scope, lowering per-unit innovation costs and enabling larger-scale innovation.
Third, market power feeds back into innovation through profits and risk buffering. Profits above competitive levels supply internally controlled R&D funds, cutting reliance on external financing and the risk of capital interruption (Tang et al., 2022), while market power also raises firms’ capacity to absorb risk. Well-positioned firms can absorb a failed R&D project on the strength of existing products, making them more willing to pursue high-risk, long-cycle breakthroughs. Market power thus captures “innovation rents” whose excess returns further incentivize R&D, reinforcing the “innovation–market power–profit–re-innovation” cycle.
The threshold here is barrier completion: returns to technological barriers are discontinuous, since a patent portfolio, differentiated line, or proprietary process confers pricing power only once defensible, and a half-built barrier is competitively worthless. Because returns accrue in a lump at the end of a multi-generation path whose interim periods show cost without revenue, short-horizon investors will not finance it; patient capital’s tolerance for this loss profile is what permits the barrier to be completed. Once completed, it generates the retained earnings and risk-bearing capacity that finance subsequent innovation internally, so patient capital’s role is to carry the firm across the threshold, after which the innovation–market power–profit–reinnovation cycle becomes largely self-sustaining.

3. Research Design

3.1. Data Source

The data were obtained from three primary sources. (1) The CSMAR database (2010–2024) provides financial and governance data for listed firms. (2) The Chinese Industrial Enterprise Database (2000–2014) provides firm-level operational and innovation information. (3) The China City Statistical Yearbook (2001–2025) provides city-level control variables. To mitigate the influence of outliers on the regression results, we implemented three data-processing procedures. (i) We eliminated observations flagged as ST, *ST, PT, or delisted. (ii) We excluded firms in the financial and real estate sectors. (iii) We winsorized all continuous variables at the 1st and 99th percentiles. For sample segmentation, small and medium-sized enterprises (SMEs) among listed firms were identified based on their listing on the Growth Enterprise Market (GEM) or the Small and Medium Enterprise Board. SMEs in the industrial sector were defined in accordance with the Standards for the Classification of Small and Medium-sized Enterprises, specifically those with annual operating revenues below 400 million yuan. The final dataset comprised an unbalanced panel of 21,170 observations.

3.2. Variable Selection

3.2.1. Corporate Innovation

Existing studies have primarily measured firm innovation across four dimensions. First, innovation input is assessed through R&D capital and personnel investment (Griliches, 1990; Hall et al., 2010). Second, innovation output is captured by indicators such as new product value, number of new processes (Zhou et al., 2021), and patent applications (Kong et al., 2017; Galasso & Simcoe, 2011). Third, innovation quality is evaluated using several indicators. Knowledge breadth measures patent quality (J. Lerner, 1994). Forward patent citations capture firm-level innovation quality (Bradley et al., 2017; Hall et al., 2005; Chang et al., 2015). Overall and average patent citation counts measure aggregate and mean innovation quality (Denis & McConnell, 2003). Fourth, innovation efficiency is measured as the number of patent applications per unit of R&D input (Quan & Yin, 2017). Additionally, some scholars have examined firm innovation from the perspectives of innovation decisions and behaviors (Hadlock & Pierce, 2010).
However, innovation input does not necessarily lead to new product development or technological improvement (Flor & Oltra, 2004). Moreover, such measures are predominantly applicable to large enterprises, as small and medium-sized enterprises often have limited or no formal R&D investment. Innovation entails the commercialization of inventions into marketable products. Patent counts alone capture only the volume of inventive activity and cannot fully represent innovation; thus, using patent numbers as a proxy may overestimate actual innovation. Furthermore, Chinese firms have long suffered from a “patent bubble” (Caillaud & Duchene, 2011). Under government innovation incentives, corporate R&D efficiency has remained low, and patent application motives have become distorted, resulting in a proliferation of low-quality patents. Consequently, relying on R&D investment or patent counts to measure firm innovation yields biased estimates.
Therefore, the measurement of firm innovation must simultaneously capture both its quantity and quality. This paper argues that a single indicator is insufficient for evaluating innovation, thus adopting a two-dimensional framework: innovation quantity and innovation quality. Drawing upon existing research (Niu et al., 2019), innovation quantity ( p a t e n t ) is operationalized as the logarithm of the number of granted patents. Further borrowing from existing work (Hall et al., 2005), innovation quality ( i n n o v ) is proxied by the logarithm of the average number of citations received in the following year for a firm’s patent applications.

3.2.2. Patient Capital

Drawing on existing research (Deeg & Hardie, 2016), this paper measures patient capital from two perspectives.
First, the proportion of relationship-based debt ( d e b t ): Following existing research methods on relationship-based debt (David et al., 2008; Brown & Petersen, 2011), all bank loans are treated as relationship-based debt. The bank extending a loan to a firm effectively acts as a lending consortium led by the bank, representing all small and medium-sized lenders in exercising de facto oversight over the borrowing firm. Given the long-term nature of relationship debt, this paper defines the proportion of relationship debt as the ratio of total long-term bank loans to total debt (proportion of relationship debt = total long-term bank loans/(bank loans + bonds payable + notes payable)).
Second, stable equity ( i n v e s t ): Drawing on existing research on stable equity (Wahal & McConnell, 2000; Healy & Palepu, 2001), we use the overall shareholding ratio of institutional investors to measure their aggregate shareholding level. Based on this, we calculate the stability of institutional investors, defined as the ratio of Company i’s investor shareholding ratio in year t to the standard deviation of its shareholding ratios over the past three years. A higher value indicates greater stability of institutional investors over time.

3.2.3. Controlled Variables

Drawing on existing research (Deeg & Hardie, 2016; Yang & Tang, 2025; Dushnitsky & Lenox, 2005; Gompers & Lerner, 2001), this study selected the following controlled variables to examine the impact of patient capital on innovation in small and medium-sized enterprises. The debt-to-equity ratio ( l e v ) is used to control for the constraints imposed by financial leverage on a firm’s ability to bear innovation investment risks. The return on assets ( r o a ) reflects a firm’s profitability, which in turn influences the extent to which internal cash flows support innovation activities. The proportion of fixed assets ( f i x e d ) measures the collateralizability of a firm’s assets and its capital intensity, which is related to the availability of external financing and the allocation of innovation resources. The shareholding ratio of the top five shareholders ( t o p 5 ) captures equity concentration, reflecting the supervision and alignment of interests among major shareholders or the “tunnel effect”. Tobin’s Q ratio ( t o b i n q ) characterizes a firm’s growth opportunities and market valuation, controlling for innovation incentives driven by investment demand. Company age ( a g e ) depicts the firm’s life cycle and accumulated experience, influencing the inertia of the innovation organization and the stock of knowledge. The degree of equity balance ( b a l a n c e ) measures the mutual checks and balances among major shareholders, reflecting the moderating role of corporate governance structures on the efficiency of innovation decision-making. By incorporating the above variables, this paper aims to more clearly identify the net effect of patient capital on the innovation behavior of small and medium-sized enterprises. Variable definitions and descriptive statistics are shown in Table 1.

3.3. Empirical Model

To examine the effect of patient capital on innovation in small and medium-sized enterprises (SMEs), this study constructs a baseline model grounded in the preceding theoretical analysis, as specified below:
p a t e n t i , t = α 0 + α 1 P C i , t + α 2 X i , t + μ j + λ t + ε j , t
i n n o v i , t + 1 = α 0 + α 1 P C i , t + α 2 X i , t + μ j + λ t + ε j , t
The variable p a t e n t i , t represents the natural logarithm of the number of patents granted to firm i in year t, capturing innovation quantity. i n n o v i , t + 1 is defined as the natural logarithm of the average number of forward citations received by patents filed by firm i in year t + 1, reflecting innovation quality. P C i , t denotes patient capital, operationalized through two indicators: the share of relationship-based debt and the proportion of stable equity holdings. X i , t is a vector of control variables, encompassing the asset–liability ratio ( l e v ), return on total assets ( r o a ), fixed asset ratio ( f i x e d ), the shareholding concentration of the top five shareholders ( t o p 5 ), Tobin’s q ( t o b i n q ), firm age ( a g e ), and equity balance ( b a l a n c e ). To control for macroeconomic and industry-level influences, as well as unobserved firm-specific heterogeneity, the regression model incorporates year fixed effects ( λ t ) and firm fixed effects ( μ j ). ε j , t denotes the stochastic error term.

4. The Innovation Effects of Patient Capital

4.1. Baseline Estimation Results

The estimated effects of patient capital on SME innovation are presented in Table 2. Columns 1–2 and 5–6 report estimates without control variables, while Columns 3–4 and 7–8 include controls. Regardless of specification, patient capital exerts a significantly positive influence on SME innovation, providing preliminary evidence of robustness.
Taking the controlled estimates as an example, Columns 3 and 4 respectively display the impact of relationship-based debt ratio and stable equity on innovation quantity. The estimated coefficients for relationship-based debt ratio and stable equity are 0.552 and 0.110, both significant at the 1% level. A one-unit increase in relationship-based debt ratio is associated with a 55.2% increase in the number of granted patents among SMEs; a one-unit increase in stable equity corresponds to an 11.0% increase. Patient capital thus is substantially and positively associated with the innovation quantity of SMEs.
Columns 7 and 8 examine the effects on innovation quality. The estimated coefficients for relationship-based debt ratio and stable equity are 0.299 and 0.111, both significant at the 1% level. A one-unit increase in relationship-based debt ratio raises the average forward citation count per patent application by 29.9%; a one-unit increase in stable equity raises it by 11.1%. Patient capital also significantly improves the innovation quality of SMEs.
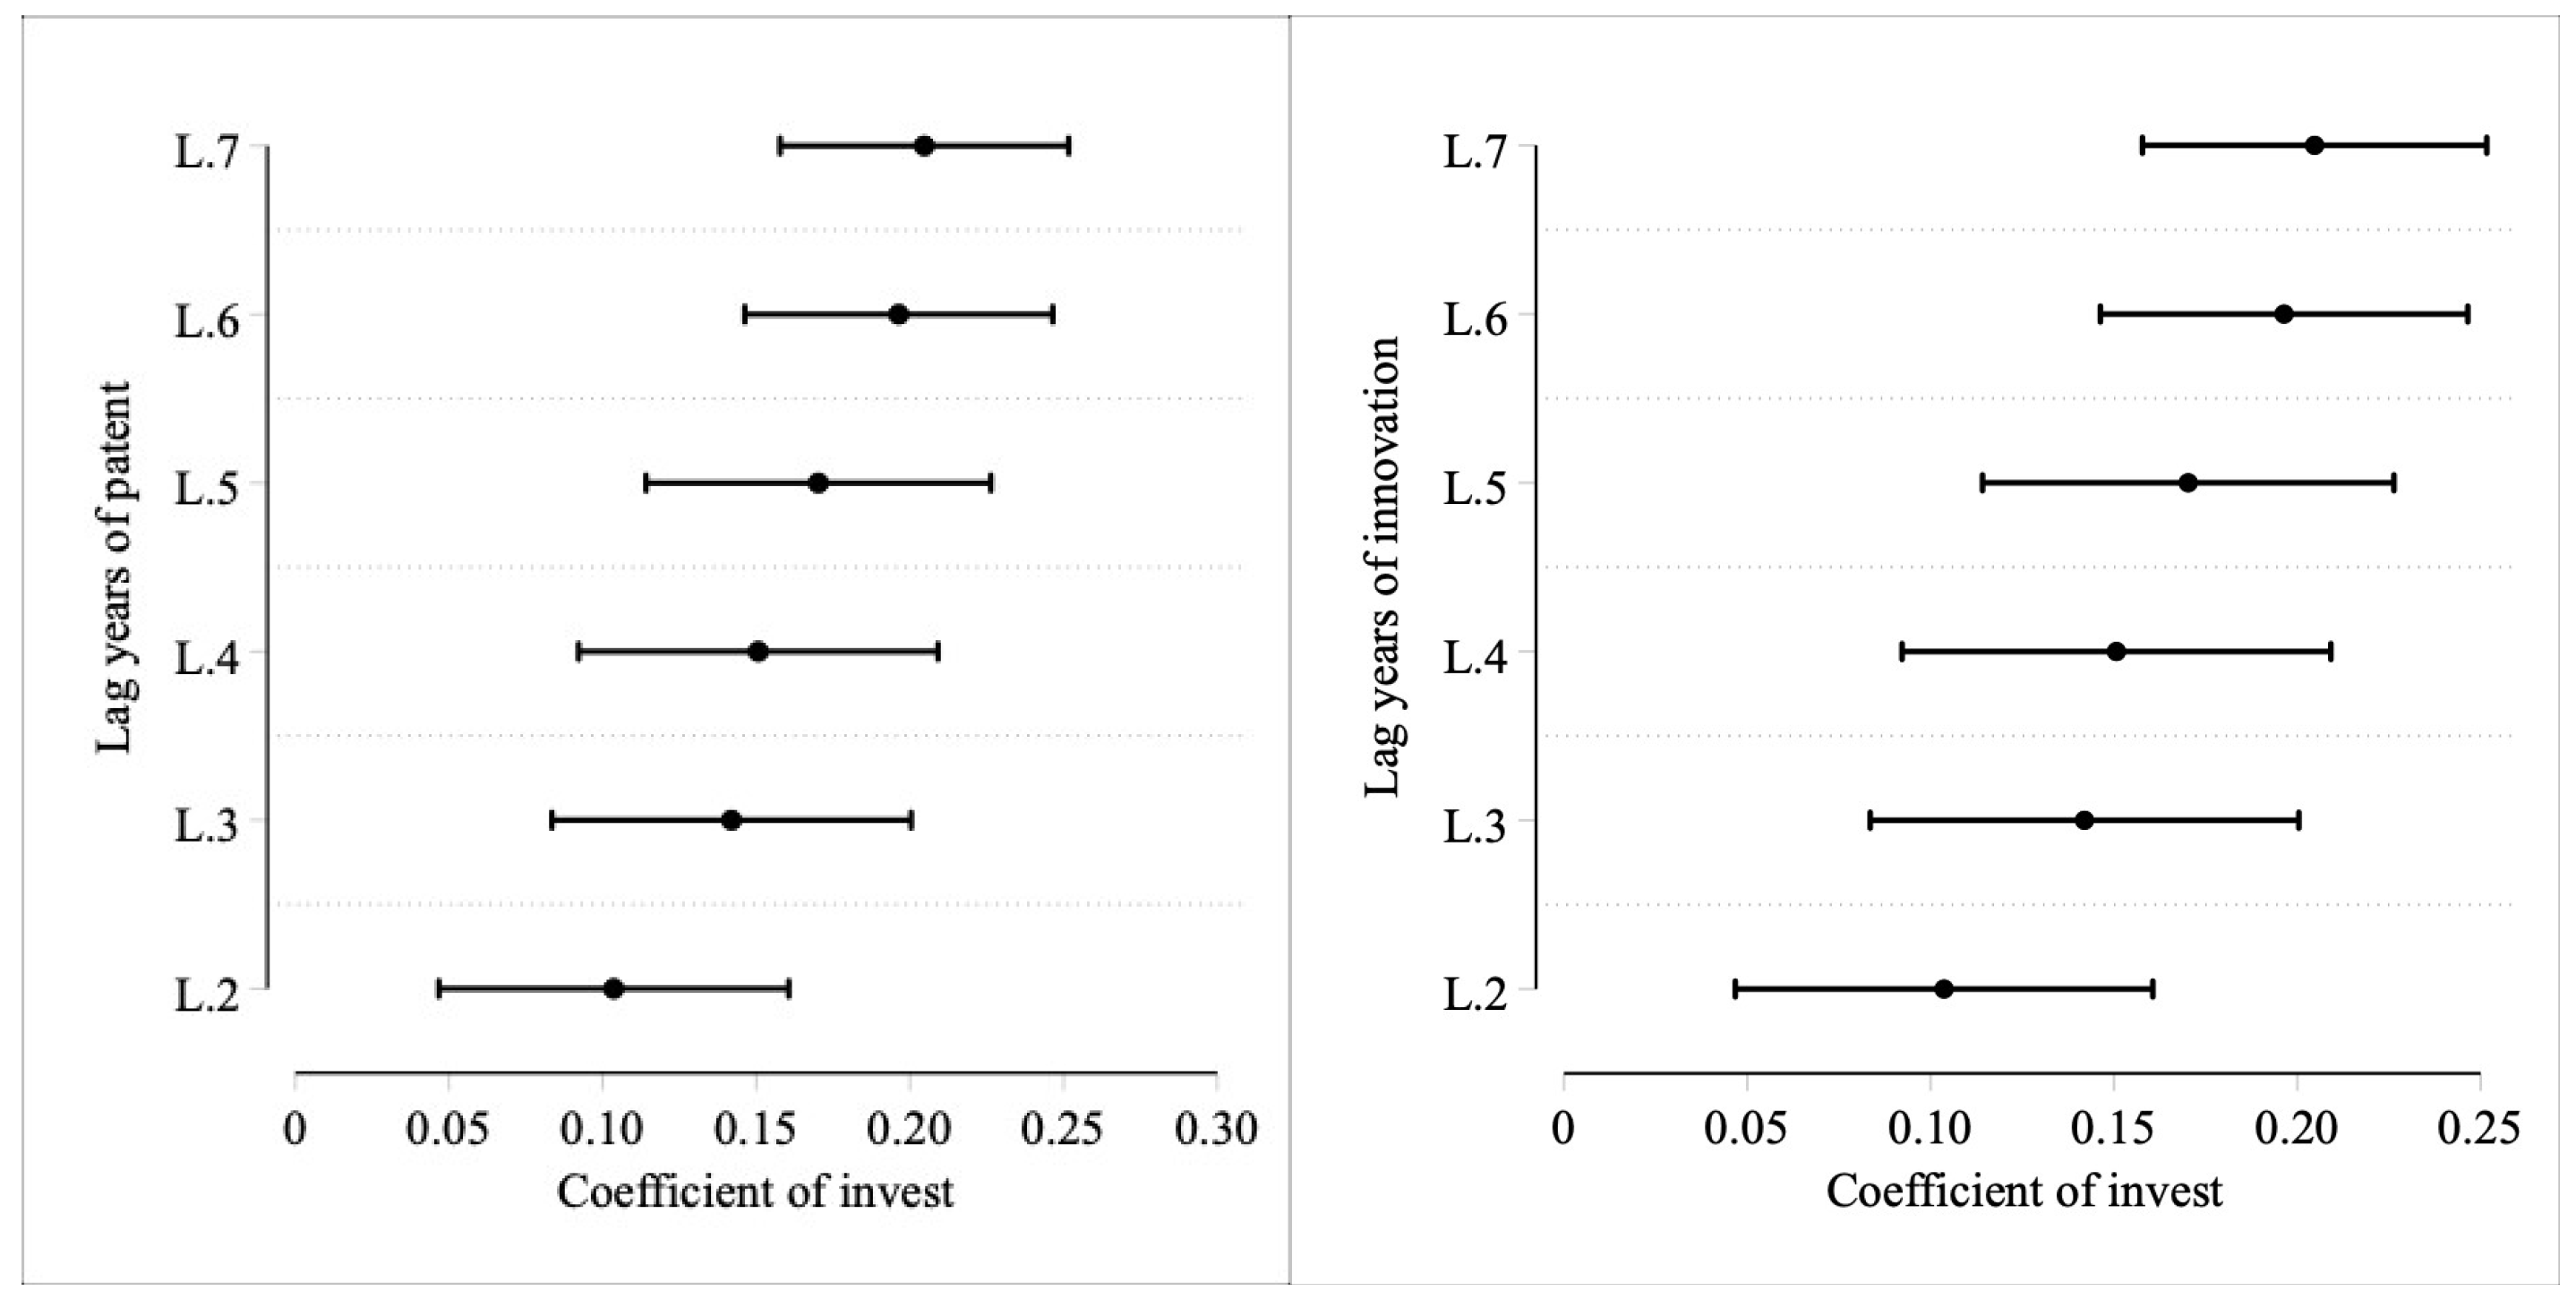
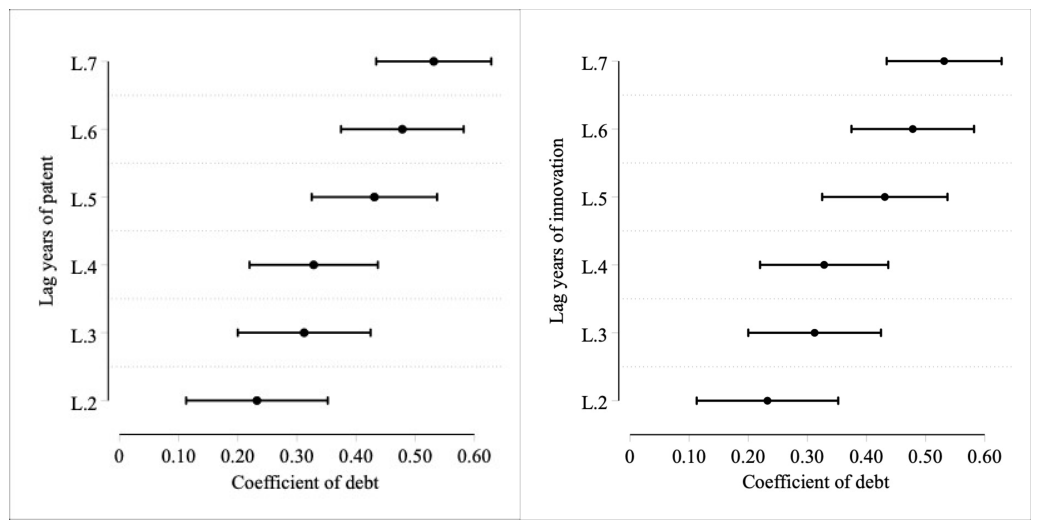
To further examine the dynamic effects of patient capital on SME innovation, this study estimates the impact of patient capital on innovation outcomes with two-to seven-year lags. The estimated results are shown in Figure 2. The estimated effects of patient capital become stronger as the lag period increases. These results suggest that the positive association between patient capital and innovation is not short-lived; rather, it gradually accumulates and becomes more pronounced over time. Compared with short-term financing, patient capital provides firms with a more stable funding environment and reduces pressure for immediate returns.

4.2. Internal Issues

4.2.1. Reverse Causality

To mitigate endogeneity issues caused by reverse causality, this paper uses the interaction term between the geographical distance of SME registered locations from Shenzhen and year as an instrumental variable ( i v ) for patient capital. First, there may be a bidirectional causal relationship between patient capital and SME innovation (Hirukawa & Ueda, 2011). On the one hand, patient capital is associated with corporate innovation by providing long-term, stable financial support and participating in corporate governance. On the other hand, improvements in corporate innovation performance may attract more patient capital, thereby leading to estimation bias.
Second, the interaction instrumental variable constructed in this study satisfies the relevance and exclusion restrictions. Regarding relevance, Shenzhen is one of the major hubs for patient capital in China, especially venture capital and private equity. SMEs located closer to Shenzhen are more likely to be exposed to local capital networks, investor attention, information spillovers, and financing opportunities. Geographical proximity can reduce investors’ search, information, and monitoring costs, thereby increasing the likelihood that nearby SMEs obtain patient capital (Sorenson & Stuart, 2001). At the same time, as financial geographical barriers gradually weaken and cross-regional capital flows strengthen over time, the influence of geographical distance on firms’ access to patient capital also changes across years (Zhang & Gu, 2021). Therefore, the interaction term between distance and year can effectively predict the level of patient capital obtained by firms.
Regarding the exclusion restriction and exogeneity, the geographical distance between a firm’s registered location and Shenzhen is determined by historical and natural factors. It is not subject to feedback effects from individual firms’ innovation behavior and thus constitutes an exogenous geographical characteristic. Furthermore, after controlling for firm fixed effects, year fixed effects, and other firm-level characteristics, this distance is expected to influence firm innovation mainly through its effect on access to patient capital. There is no clear theoretical evidence suggesting that geographical distance directly determines the innovation capacity of SMEs through channels other than patient capital; therefore, it satisfies the exclusion restriction.
Based on the above valid instrumental variable, we employ a two-stage least squares (2SLS) method for estimation. The estimation results are shown in Table 3. Columns 1–2 present the results of the first stage, while columns 3–6 present the results of the second stage. Specifically, in the first-stage estimation, the instrumental variables have significant effects on both the proportion of relational debt and stable equity. The Kleibergen–Paap rk LM statistics for the unidentifiable instrumental variables are 21.478 and 223.970, respectively, while the Kleibergen–Paap rk Wald F-statistics for weak instrumental variables were 21.402 and 225.343, respectively. This indicates that the interaction term between the geographical distance of SME registered locations from Shenzhen and the year serves as an effective instrumental variable for patient capital.
In the second-stage estimation, the estimated coefficients for the proportion of relationship-based debt and stable equity on the quantity of innovation were 23.656 and 1.622, respectively, while the coefficients on innovation quality were 11.868 and 0.814, respectively. All four of the above estimated coefficients are significant at the 1% level. Notably, these IV estimates are substantially larger than their baseline OLS counterparts. This pattern is common because measurement error and omitted-variable bias often attenuate OLS estimates downward. In contrast, the IV estimator identifies the local average treatment effect for the subpopulation of compliers induced by the instruments. These compliers typically exhibit stronger marginal responses to the treatment. Hence, after controlling for potential endogeneity, patient capital (including relationship-based debt and stable equity) still has a significant positive association with SME innovation activities.

4.2.2. Variables Omitted

To mitigate endogeneity issues caused by omitted variables, the previous approach of including only firm-level control variables may be insufficient. Firms’ innovation activities are influenced by their own financial and governance characteristics. They also depend substantially on the external environment of the cities in which firms operate (Liang et al., 2025; Audretsch & Feldman, 1996). Relevant city characteristics include economic development, industrial structure, public education investment, human capital, information infrastructure, and technological support. If these city-level factors are simultaneously correlated with the distribution of patient capital and directly influence firm innovation, their omission would lead to omitted variable bias in the estimation results. Accordingly, the regression model incorporates six city-level control variables. These are the level of economic development (log of per capita regional GDP), the sophistication of the industrial structure (value added of the tertiary sector/value added of the secondary sector), and the level of education expenditure (education expenditure/general local government expenditure). The remaining controls are human capital (students enrolled in regular higher education institutions/total population at year-end), mobile phone penetration (mobile phones at year-end/registered population), and the level of science and technology (science and technology expenditure/general local government expenditure).
The estimation results incorporating city-level control variables are shown in Table 4. For innovation quantity, the estimated coefficients on relationship-based debt and stable equity are 0.493 and 0.102, respectively. For innovation quality, the corresponding coefficients are 0.321 and 0.114. All four coefficients are statistically significant at the 1% level. After controlling for omitted variables, patient capital continues to have a significant impact on the quantity and quality of innovation among SMEs.

4.2.3. Measurement Error

As a construct reflecting long-term, stable financial support, the original measurement methods for patient capital may be subject to measurement errors. Indicators such as the proportion of relationship-based debt or the ratio of stable equity used in previous studies are subject to sample limitations and biases in corporate disclosures concerning data availability and definition. These limitations make it difficult to accurately capture the true level of patient capital. To avoid the endogeneity issues caused by the aforementioned measurement errors, this paper employs two alternative measures of patient capital for re-estimation. First, the natural logarithm of long-term debt ( l o n g _ d e b t ) is used to measure the long-term, stable sources of funding obtained by firms on the debt side, reflecting the absolute scale of relationship-based debt. Second, the proportion of shares held by institutional investors (invest_total)—defined as the ratio of shares held by institutional investors to total outstanding shares—is used to characterize the degree of stable capital participation on the equity side. These two indicators characterize patient capital from different dimensions and using different data sources, helping to reduce overreliance on the original measurement method.
The estimation results based on these alternative indicators are shown in Table 5. Debt-based patient capital is measured by the natural logarithm of long-term liabilities. Equity-based patient capital is measured by the proportion of institutional investor holdings (number of shares held by institutional investors/total issued shares). Both measures have significantly positive estimated coefficients for the quantity and quality of innovation among SMEs. This indicates that after replacing the core measurement method for patient capital—and thereby effectively mitigating potential measurement errors in the original metrics—patient capital still exhibits a robust positive association with the innovation activities of SMEs.

4.3. Robustness Test

4.3.1. Replace Innovation Indicators

First, regarding the number of innovations, we used the natural logarithm of the weighted sum of granted invention patents, utility model patents, and design patents (with weights of 3:2:1, respectively) as a proxy variable ( p a t e n t _ 321 ). The estimation results are shown in columns 1 and 2 of Table 6. The estimated coefficients for both the proportion of relationship-based debt and stable equity are significantly positive for this weighted measure of innovation volume, indicating that the positive association with quality-adjusted patent output persists.
Second, using the natural logarithm of the number of granted invention patents ( i n v e n t ) as another proxy for innovation volume—which focuses more on high-tech innovation output—the estimation results are shown in columns 3–4 of Table 6. The coefficients for the proportion of relationship-based debt and stable equity remain significantly positive, indicating that the positive association with substantive innovation activities persists under this narrower metric.
Finally, from the perspective of innovation quality, we use the natural logarithm of the total number of citations received by patents applied for by the firm in the following year plus one ( i n n o v _ t o t a l ) as a proxy indicator. This measure reflects the subsequent knowledge spillovers and technological influence of patents. The estimation results are shown in columns 5–6 of Table 6. The estimated coefficients for the proportion of relationship-based debt and stable equity regarding the total number of citations received by patents applied for by the firm in the following year are also significantly positive.

4.3.2. Subsample Estimation

First, we restricted the estimation to a sample of industrial firms. This restriction eliminates potential confounding effects arising from differences in industry characteristics and R&D accounting practices among non-industrial firms. It allows us to test whether the impact of patient capital on innovation holds in the industrial sector, which is characterized by greater productivity and standardized R&D records. As shown in columns 1–4 of Table 7, the estimated coefficients for patient capital remain significantly positive for both the quantity and quality of innovation.
Second, we excluded samples with zero patents. A large number of zero-patent observations may indicate that firms have not yet engaged in substantive innovation activities. They may also indicate the presence of an R&D threshold effect. Including these observations could dilute or distort the estimates because of the presence of non-innovative firms in the sample. By focusing on samples with positive patent counts, we can assess the robustness of patient capital’s marginal contribution to innovation. As shown in columns 5–6 of Table 7, the estimated coefficients for the proportion of relationship-based debt and stable equity regarding innovation volume remain significantly positive.
Finally, samples where the number of citations for patents applied for by the firm in the following year was zero were excluded, primarily to eliminate low-quality or zero-impact patents that, although held, did not generate any subsequent knowledge spillovers. This avoids estimation bias in innovation quality indicators caused by a large number of zero values, allowing for a clearer identification of the impact of patient capital on innovation activities that truly possess technological diffusion value. As shown in columns 7–8 of Table 7, the estimated coefficients for the proportion of relationship-based debt and stable equity on innovation quality remain significantly positive.

4.3.3. Excluding Other Shocks

To eliminate the potential interference of major exogenous shocks on the estimation results, this paper further excludes the impact of the COVID-19 public health crisis. Specifically, during the COVID-19 pandemic, firms faced multiple pressures, including supply chain disruptions, tightening financing conditions, interruptions in R&D activities, and shrinking demand. The risk preferences and allocation behaviors of patient capital may also have experienced abnormal fluctuations, thereby disrupting the stable relationship between patient capital and innovation that exists under normal conditions. This paper therefore excludes data from 2020 and beyond and re-estimates the model. As shown in Table 8, the estimated coefficients for both the proportion of relationship-based debt and stable equity on innovation quantity and quality remain significantly positive, consistent with the baseline findings. This indicates that the baseline regression results were not driven by the pandemic shock; after excluding the impact of this extreme period, the positive association between patient capital and SME innovation remains robust.

4.3.4. Balance Panel

In unbalanced panels, firms’ entry into or exit from the sample window may be associated with their own characteristics or innovation activities, thereby introducing sample selection bias and affecting the consistency of the estimates. In contrast, a balanced panel requires all firms to be continuously present throughout the observation period. This requirement controls for disturbances caused by changes in firm survival status. It also helps ensure that the estimates reflect variation in the core explanatory variables rather than changes in sample composition. Therefore, robustness tests were conducted using balanced panel data, and the estimation results are shown in Table 9. After using the balanced panel, the estimated coefficients for both the proportion of relational debt and stable equity on the quantity and quality of innovation remained significantly positive. This indicates that the baseline estimation results were not driven by sample entry or attrition in the unbalanced panel and are robust.

4.3.5. Modification of Fixed Effects

First, firm-level fixed effects can control for firm heterogeneity that does not change over time, but they may over-absorb long-term differences driven by industry characteristics. Industry-level fixed effects control for systematic industry characteristics that do not change over time. These characteristics include technological intensity, competitive structure, and the regulatory environment. This specification therefore examines the relationship between patient capital and innovation from a more aggregate perspective. This paper further conducts robustness tests by replacing firm-level fixed effects with industry-level fixed effects. The estimation results are shown in columns 1–4 of Table 10. After incorporating industry-level fixed effects, the estimated coefficients on relationship-based debt and stable equity remain significantly positive for both innovation quantity and quality. The baseline results are therefore not specific to the firm-level fixed-effects specification and are robust across models.
Second, this study further incorporates a year-industry interaction fixed effect. This interaction term simultaneously controls for industry-specific shocks that vary over time, thereby more rigorously excluding time-varying industry confounders that may simultaneously influence both patient capital allocation and innovation activities. Compared to controlling for year fixed effects and industry fixed effects separately, the interaction fixed effect provides a higher-dimensional identification condition. As shown in columns 5–8 of Table 10, after incorporating the year-industry interaction fixed effects, the estimated coefficients for the share of relationship-based debt and stable equity on innovation quantity and quality remain significantly positive. This result indicates that the baseline conclusions are not affected by the choice of fixed-effects specification.

4.4. Heterogeneity Analysis

4.4.1. State-Owned Enterprises and Private Enterprises

Enterprises with different ownership structures exhibit systemic differences in terms of resource access, governance structures, policy support, and incentives for innovation (Megginson & Netter, 2001). State-owned enterprises typically enjoy implicit government guarantees, preferential credit access, and policy resources, but their management may face multiple objective constraints and agency problems. Private enterprises, on the other hand, generally face stronger financing constraints and market competition pressures, but their governance mechanisms are more flexible, and their innovation incentives are more direct. Therefore, the impact of patient capital (relational debt and stable equity) on innovation in these two types of enterprises may exhibit heterogeneity; identifying such differences helps deepen our understanding of the conditions and boundaries under which patient capital plays a role.
The results of the group-specific estimates for SOEs and private enterprises are shown in Table 11. Given that the distributions and variances of the two sample groups are inconsistent after grouping, we adopt a Fisher combined test using a 1000-replication bootstrap method, following prior research (Li et al., 2023), to test for differences in coefficients between groups. For innovation quantity, the estimated coefficient on relationship-based debt is 0.636 for SOEs and 0.518 for private enterprises. The difference between the two coefficients is significant. Relationship-based debt therefore has a stronger positive effect on innovation quantity in SOEs. Stable equity has no significant effect on innovation quantity in SOEs. In contrast, its effect is significantly positive in private enterprises. Stable equity therefore has a stronger positive effect on innovation quantity in private enterprises. Regarding innovation quality, the estimated coefficient for the proportion of relationship-based debt is not significant for SOEs but is significantly positive for private enterprises, indicating that relationship-based debt has a stronger positive association with the innovation quality of private enterprises. The estimated coefficients of stable equity on innovation quality are 0.098 for SOEs and 0.117 for private enterprises. The difference between the coefficients is significant. Stable equity therefore has a stronger positive effect on innovation quality in private enterprises.

4.4.2. Nationally Recognized “Specialized, Refined, Distinctive, and Innovative” “Little Giant” Enterprises and Other Enterprises

National-level “Specialized, Refined, Unique, and Innovative” (SRUI) “Little Giant” enterprises differ significantly from other firms in terms of innovation capacity, technological foundation, financing environment, and policy support (Gambardella, 1990; Hellmann & Puri, 2002). SRUI “Little Giant” enterprises typically focus on niche markets, possess core technologies, maintain high R&D intensity, and benefit from targeted government support. In contrast, other SMEs are relatively weaker in terms of technological accumulation, resource acquisition, and market recognition. These structural differences may lead to variations in the direction and intensity of the impact of patient capital (relationship-based debt and stable equity) on innovation for the two types of enterprises. Identifying this heterogeneity helps clarify the conditions under which patient capital is effective and provides a basis for designing differentiated policies.
The results of the group-specific estimates for national-level “Specialized, Refined, Unique, and Innovative” “Little Giant” enterprises and other enterprises are shown in Table 12. Similarly, a Fisher combined test using 1000 bootstrap samples was employed to test for differences in coefficients between groups. For innovation quantity, the estimated coefficient on relationship-based debt is 0.646 for “Little Giant” enterprises and 0.513 for other enterprises. The difference between the coefficients is significant. Relationship-based debt therefore has a stronger positive effect on innovation quantity in “Little Giant” enterprises. Stable equity has no significant effect on innovation quantity in “Little Giant” enterprises. Its effect is significantly positive in other enterprises. Stable equity therefore has a stronger positive effect on innovation quantity in other enterprises. For innovation quality, the estimated coefficient on relationship-based debt is 0.348 for “Little Giant” enterprises and 0.282 for other enterprises. The difference between the coefficients is significant. Relationship-based debt therefore has a stronger positive effect on innovation quality in “Little Giant” enterprises. Stable equity has no significant effect on the innovation quality of “Little Giant” enterprises, whereas it has a significant positive effect on the innovation quality of other enterprises, indicating that stable equity has a stronger positive association with the innovation quality of other enterprises.

4.4.3. Regulated and Unregulated Industries

Regulated and unregulated industries differ fundamentally in terms of the degree of market competition, the intensity of government intervention, barriers to entry, and the scope for autonomous decision-making by firms (Shao et al., 2021). Regulated industries are typically subject to strict entry restrictions, price regulation, or policy protection; firm behavior is more constrained by administrative directives and regulations, and incentives for innovation may be weakened. In contrast, unregulated industries face more vigorous market competition, and firms rely more on independent innovation to gain a competitive edge. Therefore, the allocation efficiency and innovation outcomes of patient capital may vary significantly across different industry environments. Identifying this heterogeneity helps clarify the moderating roles of market mechanisms and government regulation in the functioning of patient capital.
The results of the group-specific estimates for regulated and non-regulated industries are shown in Table 13. We again employed a Fisher combined test with 1000 bootstrap samples to test for differences in coefficients between groups. In terms of the number of innovations, the estimated coefficients for the proportion of relationship-based debt in regulated and non-regulated industries were 0.646 and 0.513, respectively. The difference in coefficients between the groups was not significant, indicating that the positive association of relationship-based debt on the number of innovations for the two types of firms was not significantly different. The estimated coefficients for stable equity in regulated and non-regulated industries were 0.071 and 0.114, respectively, with a significant difference between the groups, indicating that stable equity has a stronger positive association with the number of innovations in non-regulated industries. Regarding innovation quality, the estimated coefficients for the proportion of relationship-based debt in regulated and non-regulated industries were 0.269 and 0.310, respectively, with a significant difference between the groups. Similarly, the estimated coefficients for stable equity in regulated and non-regulated industries were 0.098 and 0.119, respectively, with a significant difference between the groups. This indicates that relationship-based debt and stable equity have a stronger positive association with the innovation quality of non-regulated industry firms.

5. Mechanism Analysis

To thoroughly elucidate the intrinsic mechanisms through which patient capital relates to innovation in small and medium-sized enterprises (SMEs), this paper examines the underlying mechanisms from four dimensions: alleviating financing constraints, industry–academia–research collaboration, knowledge transfer efficiency, and market power.
First, one of the greatest challenges enterprises face in the innovation process is financial constraints. Enterprises developing core technologies operate in cutting-edge fields, where innovation activities are highly exploratory, requiring substantial capital over extended periods. Ordinary investors often find it difficult to bear the high risks and uncertainties associated with such ventures. In contrast, patient capital combines sufficient financial strength with a long investment horizon. It is therefore willing to invest continuously in high-risk enterprises with high expected value (Levine et al., 2000). This study examines whether patient capital promotes SME innovation by alleviating financing constraints. It uses the absolute value of the SA index as an indicator of firms’ financing constraints because this index exhibits strong exogeneity (Hadlock & Pierce, 2010). The results of the financing constraint mechanism test, as shown in columns 1–2 of Table 14, indicate that both the proportion of relationship-based debt and patient capital represented by stable equity significantly reduce firms’ financing constraints. On the one hand, the alleviation of financing constraints increases the internal retained earnings and external financing available to firms for R&D activities, thereby enhancing the intensity and sustainability of R&D investment. On the other hand, it reduces firms’ incentives to cut or abandon long-cycle, high-risk innovation projects due to short-term debt repayment pressures, enabling them to undertake more forward-looking R&D activities. Thus, patient capital empowers SME innovation by alleviating financing constraints.
Second, patient capital is characterized by its long-term nature, stability, and tolerance for short-term losses. It effectively aligns with the features of industry–academia–research collaboration—namely, long R&D cycles, delayed returns, and shared risks—thereby serving as a crucial financial foundation for driving firms’ integration into external innovation networks (Wu & Shanley, 2009). Consequently, to examine the mechanism through which patient capital facilitates innovation in SMEs via industry–academia–research collaboration, this paper conducts an analysis across two dimensions: willingness to engage in such collaboration and the scale of its outputs. We use “participation in industry–academia–research collaboration ( i a r _ c )” and “number of patents resulting from such collaboration ( i a r _ c _ p )” as proxy variables. The former reflects whether a firm has established industry–academia–research partnerships, indicating the breadth of external connections within the innovation network and the openness of knowledge acquisition channels. The latter directly measures the substantive technological output of such collaborations, providing a more precise depiction of the depth of knowledge synergy and the effectiveness of technology transfer. The two variables are complementary, capturing the existence of the industry–academia–research mechanism at the levels of behavioral occurrence and output generation, respectively. The results of the analysis on industry–academia–research mechanisms are shown in columns 3–6 of Table 14. Both the proportion of relationship-based debt and patient capital represented by stable equity significantly increased the probability of firms participating in industry–academia–research collaboration as well as the number of collaborative patents. Industry–academia–research collaboration enables SMEs to absorb cutting-edge external knowledge, enhance their own innovation capabilities, and ultimately achieve dual growth in both the quantity and quality of innovation. Therefore, patient capital can empower SME innovation through industry–academia–research collaboration.
Furthermore, innovation in small and medium-sized enterprises (SMEs) depends on sustained R&D investment and the ability to absorb knowledge. By alleviating financing constraints and short-sighted behavior, patient capital can significantly enhance the efficiency of internal knowledge conversion—that is, the rate at which R&D expenditures are transformed into innovative outcomes. Therefore, to examine the mechanism through which patient capital is associated with innovation in SMEs via knowledge conversion, this paper uses “the ratio of annual R&D expenditure to operating revenue ( R D _ r a t i o )” as a proxy for knowledge conversion capacity. This indicator reflects the level of investment enterprises make in converting internal resources into technological knowledge stock and serves as a key measure of the efficiency of knowledge production, absorption, and application. The results of the testing of the knowledge conversion mechanism, as shown in columns 1–2 of Table 15, indicate that patient capital—represented by the proportion of relationship-based debt and stable equity—significantly increases the ratio of R&D expenditure to operating revenue. As a core input in the knowledge production function, increased R&D investment accelerates the accumulation, reorganization, and commercialization of technological knowledge. This process shortens the time lag between basic research and applied development and thereby significantly enhances both the quantity and quality of innovation in SMEs. Therefore, patient capital can empower SME innovation through knowledge transformation.
Finally, market power reflects a firm’s ability to capture excess profits through differentiation or technological advantages. Innovation supported by patient capital is more likely to translate into market rents, thereby creating a virtuous cycle (Tang et al., 2022). Consequently, to examine the mechanism through which patient capital is associated with innovation in SMEs via market power, this paper conducts an analysis across two dimensions: pricing power and market share. The “Lerner Index ( l e r n e r )” and the “ratio of operating revenue to total industry revenue ( o p e r a t _ r a t i o )” are used as proxy variables for market power, respectively. The Lerner Index measures a firm’s monopolistic pricing power in the product market, reflecting its pricing margin beyond marginal cost and its profit buffer capacity. The revenue ratio, meanwhile, characterizes a firm’s relative scale and competitive position within the industry, reflecting its market dominance and level of resource concentration. These two measures complement each other, capturing the existence of market power mechanisms at the levels of price premiums and market share, respectively. The results of the market power mechanism tests, as shown in columns 3–6 of Table 15, indicate that patient capital—represented by the proportion of relationship-based debt and stable equity—significantly increases both the firm’s Lerner Index and revenue ratio. The strengthening of market power, in turn, provides SMEs with the financial flexibility and risk buffers necessary for sustained R&D through channels such as the accumulation of excess profits, enhanced risk-bearing capacity, and the capture of innovation rents. Simultaneously, it reinforces incentives for firms to engage in high-risk, long-cycle innovation projects, ultimately achieving dual growth in both the quantity and quality of innovation. Therefore, patient capital can empower SME innovation through market power.

6. Further Analysis

We further examine the impact of patient capital on innovation among unlisted small and medium-sized enterprises (SMEs) using the 1998–2014 China Industrial Enterprise Database and matched patent data. Due to limitations in data and variable availability, this chapter constructs measures of innovation levels, patient capital, and relevant control variables for Chinese industrial SMEs. Specifically, innovation volume is measured by the logarithm of the number of patents granted to a firm in a given year ( p a t e n t _ t ), a variable that reflects the overall scale of a firm’s innovation output. Innovation quality is measured by the logarithm of the number of invention patents granted ( i n v e n t _ t ). Compared to utility models and design patents, invention patents represent greater technological breakthroughs and better characterize innovation quality. The proportion of relationship-based debt within patient capital is proxied by the ratio of long-term debt to total debt ( d e b t ), consistent with the previous analysis. Additionally, relationship-based investment ( d e b t _ i , i.e., long-term investment/total investment) is used as a new proxy variable for patient capital. Control variables include basic financial and operational characteristics of firms, such as the debt-to-equity ratio ( l e v ), return on assets ( r o a ), proportion of fixed assets ( f i x e d ), and firm age ( a g e ). The definitions and descriptive statistics of these variables are presented in Table 16.
Using the SME data from the China Industrial Enterprise Database, we analyzed the impact of patient capital on corporate innovation. The estimation results are shown in Table 17. Columns 1–2 present the estimated effects of patient capital—measured by relational debt—on innovation, while columns 3–4 present the estimated effects of patient capital—measured by relational investment—on innovation. The estimated coefficients for relational debt on innovation quantity and innovation quality are 0.425 and 0.331, respectively, and both are significantly positive. For every one-unit increase in the proportion of relational debt, the number of authorized patents held by SMEs in the industrial sector increases by 42.5%, and the number of authorized invention patents increases by 33.1%. Similarly, the estimated coefficients for relational investment on innovation quantity and quality are 2.743 and 0.718, respectively, and both are significantly positive. For every one-unit increase in the proportion of relational investment, the number of authorized patents for SMEs in the industrial sector increases by 274.3%, and the number of authorized invention patents increases by 71.8%. This indicates that patient capital also plays a significant role in promoting the quantity of innovation among unlisted SMEs.
The core findings are highly consistent across samples. Regardless of whether a firm is listed or unlisted, relationship-based debt significantly increases patent output among SMEs. This variable is measured by the proportion of long-term liabilities, and the result holds for both total patents and granted invention patents. This robust cross-sample replication effectively rules out the alternative explanation that “the results for listed firms stem solely from the unique environment of capital markets,” thereby reinforcing the intrinsic logic linking patient capital to innovation. A long-term, stable supply of capital supports corporate innovation output by alleviating financing constraints and risk-sharing issues faced by innovation activities, and this mechanism holds true across a broader population of industrial enterprises. Furthermore, the dual evidence from listed and unlisted firms mutually corroborates each other, indicating that the positive impact of patient capital on SME innovation is robust across market status, sample periods, and data sources. The analysis of listed firms on the SME Board and the Growth Enterprise Market (GEM) uses more precise variable measurements and more comprehensive mechanism tests. It therefore constitutes the core pillar of this paper’s conclusions. The analysis of unlisted firms based on the China Industrial Enterprise Database provides strong support for the external validity of the findings. Together, these two approaches establish the credibility of the core finding that patient capital is associated with innovation in SMEs.

7. Research Summary and Policy Implications

This study uses data from companies listed on the SME Board and the Growth Enterprise Market (GEM) from 2010 to 2024. It systematically examines the impact of patient capital on the quantity and quality of innovation among small and medium-sized enterprises (SMEs). It also investigates the underlying mechanisms. Furthermore, using the China Industrial Enterprises Database from 2000 to 2014, we investigate the effects of patient capital on innovation among unlisted SMEs. The main findings are as follows:
Theoretically, this study shows that the four channels linking patient capital to SME innovation are gated by time rather than by capital volume. Patient capital is therefore the relevant activating condition, not external finance in general.
First, patient capital, represented by the proportion of relationship-based debt and stable equity, significantly promotes both the quantity and quality of innovation among SMEs, and this positive effect gradually strengthens over time. This positive effect remains robust across a series of tests. These tests use instrumental variables to mitigate reverse causality, city-level controls to address omitted-variable bias, and alternative measures of patient capital to reduce measurement error. They also use alternative innovation indicators, subsample regressions, exclusion of the COVID-19 period, balanced-panel estimation, and alternative fixed-effects specifications. These findings indicate that patient capital is significantly and robustly associated with innovation in SMEs.
Second, heterogeneity analysis reveals that the association between patient capital and SME innovation varies significantly depending on the firm’s ownership structure, technological capabilities, and the degree of industry regulation. In terms of ownership structure, relationship-based debt has a stronger positive effect on the quantity of innovation in state-owned enterprises, while stable equity has a significant positive impact only on the quality of innovation in private enterprises. Private enterprises are better positioned to achieve dual improvements in both the quantity and quality of innovation through these two types of patient capital. In terms of enterprise type, relationship-based debt has a markedly stronger positive association with innovation among national-level “Specialized, Refined, Unique, and Innovative” (SRUI) “Little Giant” enterprises than among ordinary enterprises, whereas stable equity is only significantly associated with innovation in ordinary enterprises. The positive effect of relationship-based debt on innovation quantity does not depend on whether an industry is regulated. In contrast, the positive effects of stable equity on innovation quantity and quality are stronger in non-regulated industries. A competitive market environment is therefore an important condition for equity-based patient capital to promote innovation.
Third, mechanism tests reveal that patient capital is linked to SME innovation through four channels: alleviating financing constraints, fostering industry–academia–research collaboration, enhancing knowledge conversion efficiency, and strengthening market power. Patient capital significantly reduces firms’ financing constraints, increases the probability of their participation in industry–academia–research collaborations, and boosts the number of collaborative patents, thereby promoting innovation output. It also increases firms’ R&D intensity and accelerates the processes of knowledge production and commercialization. Patient capital enhances firms’ Lerner indices and the proportion of revenue derived from innovation, creating a virtuous cycle through the accumulation of excess profits and the capture of innovation rents.
Fourth, an extended analysis based on the China Industrial Enterprise Database confirms that patient capital exerts a significant positive impact on innovation in unlisted SMEs as well. The conclusions of this chapter demonstrate strong external validity, meaning that the driving effect of patient capital on SME innovation is not contingent on whether a firm is listed, and thus holds broad universal significance.
Through its long-term, stable financial support and in-depth governance empowerment, patient capital can effectively resolve the financing constraints and short-sightedness dilemmas that SMEs commonly face in their innovation activities. It is worth noting that the impact of patient capital is not uniform but exhibits significant heterogeneity depending on firm characteristics and industry environments. In emerging industries characterized by rapid technological iteration and high patent barriers, the governance-empowering effects of patient capital are often more pronounced. In contrast, in traditional manufacturing sectors, the stability of financial support is more critical. The findings of this chapter not only reveal the underlying mechanisms and boundary conditions of patient capital’s impact on SME innovation but also provide robust micro-level evidence and clear policy implications for improving China’s patient capital cultivation system and implementing differentiated innovation incentive policies.
Based on the above research conclusions, this paper proposes the following policy implications:
First, establish a long-term financing mechanism oriented toward patient capital. Commercial banks should be encouraged to develop relationship-based debt financing and reduce their reliance on short-term collateral. Long-term investors, including social security, insurance, and pension funds, should be guided to invest in SMEs through stable equity. Policymakers should also strengthen incentives to supply long-term capital by establishing guiding funds, optimizing fund lifespans, improving the error-tolerance mechanism for state-owned capital, and providing tax incentives. Second, implement differentiated patient capital allocation strategies. For state-owned enterprises, policy should prioritize relationship-based debt instruments. For private enterprises, it should emphasize stable equity financing and improved corporate governance. For “Little Giant” enterprises, policy should prioritize wider access to relationship-based debt. Ordinary SMEs should rely more on equity-based patient capital, with targeted support from regional equity markets and science and technology innovation mother funds. Third, optimize the institutional environment for equity-based patient capital across industries. Reduce administrative intervention in competitive sectors and encourage long-term equity investors to participate in corporate governance; in regulated industries, prioritize reforms in competitive segments to create institutional conditions for stable equity to drive innovation. Fourth, unblock the three key channels through which patient capital delivers value. Policymakers should establish special subsidies or risk-sharing funds for industry–academia–research collaboration. They should provide tax and fiscal incentives for R&D activities supported by patient capital, particularly for long-cycle projects. Within the antitrust framework, they should appropriately protect the market power of innovative enterprises and improve mechanisms for capturing innovation rents. Fifth, extend policy coverage to unlisted small and medium-sized enterprises (SMEs). Prioritize support for channels supplying patient capital to unlisted enterprises, such as regional equity markets, local guidance funds, community banks, and technology-focused micro-lending companies, and establish innovative disclosure and credit evaluation systems to reduce information asymmetry.


Author Contributions

Conceptualization, Y.L. and H.F.; methodology, Y.L.; software, Y.L., Y.S. and Z.Z.; validation, Y.L., Y.S. and H.F.; formal analysis, Y.L. and Y.S.; investigation, Y.L.; resources, Y.L. and H.F.; data curation, Y.L., Y.S. and Z.Z.; writing—original draft preparation, Y.L.; writing—review and editing, Y.L. and Z.Z.; supervision, H.F. All authors have read and agreed to the published version of the manuscript.

Funding

This research was funded by Major Program of the National Social Science Fund of China, grant number 26ZDA016, and the APC was funded by National Social Science Fund of China.

Institutional Review Board Statement

Not applicable.

Informed Consent Statement

Not applicable.

Data Availability Statement

Data available in a publicly accessible repository. The research data come from three main sources. The CSMAR database from 2010 to 2024 provides financial and governance data for listed companies. The Chinese Industrial Enterprise Database from 2000 to 2014 provides operating and innovation information at the industrial-enterprise level. The China Urban Statistical Yearbook from 2001 to 2025 provides selected city-level control variables.

Acknowledgments

During the preparation of this manuscript, the authors used AI-assisted tool (Claude 3.5) solely for language editing and improving readability. All content was reviewed and edited by the authors, who take full responsibility for the manuscript. No AI tools were used to generate research data, analyses, or conclusions.

Conflicts of Interest

The authors declare no conflicts of interest.

References

  1. Acs, Z. J., & Audretsch, D. B. (1990). Innovation and small firms. MIT Press. [Google Scholar]
  2. Adner, R. (2016). Ecosystem as structure: An actionable construct for strategy. Journal of Management, 43(1), 39–58. [Google Scholar]
  3. Aghion, P., Van Reenen, J., & Zingales, L. (2013). Innovation and institutional ownership. American Economic Review, 103, 277–304. [Google Scholar] [CrossRef] [Scilit]
  4. Audretsch, D. B., & Feldman, M. P. (1996). R&D spillovers and the geography of innovation and production. The American Economic Review, 86, 630–640. [Google Scholar]
  5. Beck, T., & Demirguc-Kunt, A. (2006). Small and medium-size enterprises: Access to finance as a growth constraint. Journal of Banking & Finance, 30, 2931–2943. [Google Scholar] [CrossRef] [Scilit]
  6. Beck, T., Demirguc-Kunt, A., & Maksimovic, V. (2008). Financing patterns around the world: Are small firms different? Journal of Financial Economics, 89, 467–487. [Google Scholar] [CrossRef] [Scilit]
  7. Bradley, D., Kim, I., & Tian, X. (2017). Do unions affect innovation? Management Science, 63, 2251–2271. [Google Scholar] [CrossRef] [Scilit]
  8. Brown, J. R., Martinsson, G., & Petersen, B. C. (2012). Do financing constraints matter for R&D? European Economic Review, 56, 1512–1529. [Google Scholar] [CrossRef] [Scilit]
  9. Brown, J. R., & Petersen, B. C. (2011). Cash holdings and R&D smoothing. Journal of Corporate Finance, 17, 694–709. [Google Scholar] [CrossRef] [Scilit]
  10. Bushee, B. J. (1998). The influence of institutional investors on myopic R&D investment behavior. Accounting Review, 73(3), 305–333. [Google Scholar] [CrossRef] [Scilit]
  11. Caillaud, B., & Duchene, A. (2011). Patent office in innovation policy: Nobody’s perfect. International Journal of Industrial Organization, 29, 242–252. [Google Scholar] [CrossRef] [Scilit]
  12. Carpenter, R. E., & Petersen, B. C. (2002). Capital market imperfections, high-tech investment, and new equity financing. The Economic Journal, 112, F54–F72. [Google Scholar] [CrossRef] [Scilit]
  13. Chang, X., Fu, K., Low, A., & Zhang, W. (2015). Non-executive employee stock options and corporate innovation. Journal of Financial Economics, 115, 168–188. [Google Scholar] [CrossRef] [Scilit]
  14. Chemmanur, T. J., Krishnan, K., & Nandy, D. K. (2011). How does venture capital financing improve efficiency in private firms? A look beneath the surface. The Review of Financial Studies, 24, 4037–4090. [Google Scholar] [CrossRef] [Scilit]
  15. Chemmanur, T. J., Loutskina, E., & Tian, X. (2014). Corporate venture capital, value creation, and innovation. The Review of Financial Studies, 27, 2434–2473. [Google Scholar] [CrossRef] [Scilit]
  16. David, P., O’Brien, J. P., & Yoshikawa, T. (2008). The implications of debt heterogeneity for R&D investment and firm performance. The Academy of Management Journal, 51, 165–181. Available online: https://ink.library.smu.edu.sg/cgi/viewcontent.cgi?article=3908&context=lkcsb_research (accessed on 15 June 2026). [CrossRef] [Scilit]
  17. Deeg, R., & Hardie, I. (2016). What is patient capital and who supplies it? Socio-Economic Review, 14, 627–645. [Google Scholar] [CrossRef] [Scilit]
  18. Denis, D. K., & McConnell, J. J. (2003). International corporate governance. Journal of Financial and Quantitative Analysis, 38, 1–36. [Google Scholar] [CrossRef] [Scilit]
  19. Dushnitsky, G., & Lenox, M. J. (2005). When do firms undertake R&D by investing in new ventures? Strategic Management Journal, 26, 947–965. [Google Scholar] [CrossRef] [Scilit]
  20. Ferreira, D., Manso, G., & Silva, A. C. (2014). Incentives to innovate and the decision to go public or private. The Review of Financial Studies, 27, 256–300. [Google Scholar] [CrossRef] [Scilit]
  21. Flor, M. L., & Oltra, M. J. (2004). Identification of innovating firms through technological innovation indicators: An application to the Spanish ceramic tile industry. Research Policy, 33, 323–336. [Google Scholar] [CrossRef] [Scilit]
  22. Friedman, B. M. (2010). The moral consequences of economic growth. Vintage. [Google Scholar]
  23. Galasso, A., & Simcoe, T. S. (2011). CEO overconfidence and innovation. Management Science, 57, 1469–1484. [Google Scholar] [CrossRef] [Scilit]
  24. Gambardella, A. (1990). Complementarity and external linkages: The strategies of the large firms in biotechnology. The Journal of Industrial Economics, 38, 361. [Google Scholar] [CrossRef] [Scilit]
  25. Gompers, P., & Lerner, J. (2001). The venture capital revolution. Journal of Economic Perspectives, 15, 145–168. [Google Scholar] [CrossRef] [Scilit]
  26. Grant, R. M. (1996). Toward a knowledge-based theory of the firm. Strategic Management Journal, 17, 109–122. [Google Scholar] [CrossRef] [Scilit]
  27. Griliches, Z. (1990). Patent statistics as economic indicators: A survey. Journal of Economic Literature, 28, 1661–1707. [Google Scholar]
  28. Hadjimanolis, A. (2000). An investigation of innovation antecedents in small firms in the context of a small developing country. R&D Management, 30, 235–246. [Google Scholar] [CrossRef] [Scilit]
  29. Hadlock, C. J., & Pierce, J. R. (2010). New evidence on measuring financial constraints: Moving beyond the KZ index. Review of Financial Studies, 23(5), 1909–1940. [Google Scholar] [CrossRef] [Scilit]
  30. Hall, B. H., Jaffe, A., & Trajtenberg, M. (2005). Market value and patent citations. The RAND Journal of Economics, 36, 16–38. Available online: https://eml.berkeley.edu/~bhhall/papers/HallJaffeTrajtenberg03.pdf (accessed on 15 June 2026).
  31. Hall, B. H., & Lerner, J. (2010). The financing of R&D and innovation. In Handbook of the economics of innovation (pp. 609–639). Elsevier. [Google Scholar]
  32. Hall, B. H., Mairesse, J., & Mohnen, P. (2010). Measuring the returns to R&D. In B. H. Hall, & N. Rosenberg (Eds.), Handbook of the economics of innovation (Vol. 2, pp. 1033–1082). North-Holland. [Google Scholar]
  33. Harrison, R. T., Botelho, T., & Mason, C. M. (2016). Patient capital in entrepreneurial finance: A reassessment of the role of business angel investors. Socio-Economic Review, 14, 669–689. [Google Scholar] [CrossRef] [Scilit]
  34. Healy, P. M., & Palepu, K. G. (2001). Information asymmetry, corporate disclosure, and the capital markets: A review of the empirical disclosure literature. Journal of Accounting and Economics, 31, 405–440. [Google Scholar] [CrossRef] [Scilit]
  35. Hellmann, T., & Puri, M. (2002). Venture capital and the professionalization of start-up firms: Empirical evidence. The Journal of Finance, 57, 169–197. [Google Scholar] [CrossRef] [Scilit]
  36. Herrera, A. M., & Minetti, R. (2007). Informed finance and technological change: Evidence from credit relationships. Journal of Financial Economics, 83, 223–269. [Google Scholar] [CrossRef] [Scilit]
  37. Hirukawa, M., & Ueda, M. (2011). Venture capital and innovation: Which is first? Pacific Economic Review, 16, 421–465. [Google Scholar] [CrossRef] [Scilit]
  38. Ivashina, V., & Lerner, J. (2019). Patient capital: The challenges and promises of long-term investing. In Patient capital. Princeton University Press. [Google Scholar]
  39. Kaplan, S. N., & Strömberg, P. (2009). Leveraged buyouts and private equity. Journal of Economic Perspectives, 23, 121–146. [Google Scholar] [CrossRef] [Scilit]
  40. Kong, D., Xu, M., & Kong, G. (2017). Intrafirm wage gaps and innovation. Economic Research, 52, 144–157. [Google Scholar]
  41. Lehrer, M., & Celo, S. (2016). German family capitalism in the 21st century: Patient capital between bifurcation and symbiosis. Socio-Economic Review, 14, 729–750. [Google Scholar] [CrossRef] [Scilit]
  42. Lerner, A. P. (1934). The concept of monopoly and the measurement of monopoly power. The Review of Economic Studies, 1, 157–175. [Google Scholar] [CrossRef] [Scilit]
  43. Lerner, J. (1994). The importance of patent scope: An empirical analysis. The RAND Journal of Economics, 25, 319–333. [Google Scholar] [CrossRef] [Scilit]
  44. Levine, R., Loayza, N., & Beck, T. (2000). Financial intermediation and growth: Causality and causes. Journal of Monetary Economics, 46, 31–77. [Google Scholar] [CrossRef] [Scilit]
  45. Li, J., Lian, G., & Xu, A. (2023). Breaking the deadlock in corporate green transformation under the ‘dual carbon’ vision: An empirical study of digitalization driving green transformation. Journal of Quantitative and Technical Economics, 40, 27–49. [Google Scholar] [CrossRef]
  46. Liang, Z., Qiu, K., Zhuang, J., & Zhang, Q. (2025). Business environment optimization and corporate sustainable innovation: Evidence from China. Finance Research Letters, 71, 106441. [Google Scholar] [CrossRef] [Scilit]
  47. Majumdar, S. K. (2011). Retentions, relations and innovation: The financing of R&D in India. Economics of Innovation and New Technology, 20, 233–257. [Google Scholar] [CrossRef] [Scilit]
  48. Manso, G. (2011). Motivating innovation. The Journal of Finance, 66, 1823–1860. [Google Scholar] [CrossRef] [Scilit]
  49. March, J. G. (1991). Exploration and exploitation in organizational learning. Organization Science, 2, 71–87. [Google Scholar] [CrossRef] [Scilit]
  50. Megginson, W. L., & Netter, J. M. (2001). From state to market: A survey of empirical studies on privatization. Journal of Economic Literature, 39, 321–389. [Google Scholar] [CrossRef] [Scilit]
  51. Millet-Reyes, B. (2004). R&D intensity and financing constraints. Journal of Business and Economic Studies, 10, 38–53. [Google Scholar]
  52. Minshall, T., Mortara, L., & Ulrichsen, T. (2016). University-industry partnerships and open innovation. SSRN Electronic Journal. [Google Scholar] [CrossRef] [Scilit]
  53. Nanda, R., & Rhodes-Kropf, M. (2017). Financing risk and innovation. Management Science, 63, 901–918. [Google Scholar] [CrossRef] [Scilit]
  54. Niu, J., Li, S., Yang, Y., & Dong, C. (2019). Executive pay gaps, governance models, and corporate innovation. Management Science, 32, 77–93. Available online: https://kns.cnki.net/kcms2/article/abstract?v=Jz5IuRg0t00Uhai1YPEBwDNJqeb0RxPRlQw6v0bZvTHYREoX3gbbRQeiu-kc4vbK_pYsDR5_U9kcVufrDVY8xg4fIdnFzxm7smDoYqiiOq1AQ2nHsE5yTt9sXeQllDv3db2gasT_zwkIJsK9Uo68_GO_rG4Ngt9XbrVmJP8xuQSZLmg4N4a5WkFPQETG73gV&uniplatform=NZKPT&language=CHS (accessed on 10 June 2026).
  55. O’Brien, J. P. (2003). The capital structure implications of pursuing a strategy of innovation. Strategic Management Journal, 24, 415–431. [Google Scholar] [CrossRef] [Scilit]
  56. Quan, X., & Yin, H. (2017). The Chinese short-selling mechanism and corporate innovation: A natural experiment based on the phased expansion of margin trading. Management World, 1, 128–144. [Google Scholar] [CrossRef]
  57. Ren, G., Chen, X., & Xue, K. (2025). The logical mechanisms and implementation pathways of breakthrough innovation in China driven by patient capital in state-owned enterprises. Henan Social Sciences, 33, 39–46. Available online: https://link.cnki.net/urlid/41.1213.C.20251022.1632.004 (accessed on 23 May 2026).
  58. Schumpeter, J. A. (1942). Capitalism, socialism and democracy. Harper & Brothers. [Google Scholar]
  59. Shao, Z., Ni, S., & Wang, C. (2021). Service sector liberalization, foreign investment controls, and firm innovation: Theory and the Chinese experience. Economics (Quarterly), 21, 1411–1432. [Google Scholar] [CrossRef]
  60. Sorenson, O., & Stuart, T. E. (2001). Syndication networks and the spatial distribution of venture capital investments. American Journal of Sociology, 106, 1546–1588. [Google Scholar] [CrossRef] [Scilit] [PubMed]
  61. Tang, Y., Wang, Y., & Tang, C. (2022). The digital economy, market structure, and innovation performance. China Industrial Economics, 10, 62–80. [Google Scholar] [CrossRef]
  62. Tian, X., & Wang, T. Y. (2014). Tolerance for failure and corporate innovation. The Review of Financial Studies, 27, 211–255. [Google Scholar] [CrossRef] [Scilit]
  63. Tirole, J. (1988). The theory of industrial organization. MIT Press. [Google Scholar]
  64. Wahal, S., & McConnell, J. J. (2000). Do institutional investors exacerbate managerial myopia? Journal of Corporate Finance, 6, 307–329. [Google Scholar] [CrossRef] [Scilit]
  65. Wang, X., Cheng, Y., & Li, B. (2025). To inhibit or to promote: How does patient capital affect firm new quality productivity in China? Finance Research Letters, 86, 108787. [Google Scholar]
  66. Wernerfelt, B. (1984). A resource-based view of the firm. Strategic Management Journal, 5, 171–180. [Google Scholar] [CrossRef] [Scilit]
  67. Wu, J., & Shanley, M. T. (2009). Knowledge stock, exploration, and innovation: Research on the united states electromedical device industry. Journal of Business Research, 62, 474–483. [Google Scholar] [CrossRef] [Scilit]
  68. Xu, S. H., & Sun, N. H. (2025). Patient capital, critical digital technological innovation, and credit environment: Evidence from A-share digital enterprises. Xinjiang Social Sciences, (4), 21–33+174. [Google Scholar]
  69. Yang, G., & Tang, L. (2025). The impact of patient capital on corporate resilience. Financial Science, 3, 15–29. [Google Scholar] [CrossRef]
  70. Yu, Y., Hu, P., & Zhu, Z. (2025). Patience capital and disruptive innovation in enterprises: A perspective from institutional investors. China Industrial Economics, 10, 59–77. [Google Scholar] [CrossRef]
  71. Zhang, J., & Gu, Q. (2021). Turning a curse into a blessing: Contingent effects of geographic distance on startup–VC partnership performance. Journal of Business Venturing, 36, 106108. [Google Scholar] [CrossRef] [Scilit]
  72. Zhou, B., Li, Y., Sun, F., & Zhou, Z. (2021). Executive compensation incentives, risk level and corporate innovation. Emerging Markets Review, 47, 100798. [Google Scholar] [CrossRef] [Scilit]
Figure 1. Patient capital and the temporal constraint on SME innovation.
Ijfs 14 00221 g001
Figure 2. The lagging effect of patient capital on innovation in small and medium-sized enterprises. Note: (1) The horizontal line in the figure represents the 95% confidence interval of the estimated coefficient, and the circle represents the estimated coefficient. (2) Each estimate includes Year specific fixed effects, Firm specific fixed effects, and control variables, Control variables include debt-to-equity ratio (lev), return on assets (roa), proportion of fixed assets (fixed), shareholding ratio of the top five shareholders (top5), Tobin’s Q (tobinq), firm age (age), and equity balance (balance).
Ijfs 14 00221 g002aIjfs 14 00221 g002b
Table 1. Variable definitions and descriptive statistics.
VariablesDefinitionNMeanStandard Deviation
p a t e n t Logarithm of the number of patents granted21,1702.6821.520
i n n o v The logarithm of the average number of citations per patent filed by a company in the following year21,1701.0550.891
d e b t Long-term debt/Total liabilities21,1700.1040.147
i n v e s t Institutional Investor Holdings/Outstanding Shares21,1700.2180.601
l e v Total Liabilities/Total Assets21,1700.3750.201
r o a Total Revenue/Total Assets21,1700.0380.400
f i x e d Ratio of Net Fixed Assets to Total Assets21,1700.1850.132
t o p 5 Number of shares held by the top five shareholders/Total number of shares21,1700.5160.150
t o b i n q Tobin’s Q ratio21,1702.1801.478
a g e The reference year—The founding year of the entity21,1702.8510.372
b a l a n c e The ratio of the second-largest shareholder’s ownership to the largest shareholder’s ownership.21,1700.4150.283
Table 2. The impact of patient capital on the quantity and quality of innovation in small and medium-sized enterprises.
(1)(2)(3)(4)(5)(6)(7)(8)
P a t e n t P a t e n t P a t e n t P a t e n t I n n o v I n n o v I n n o v I n n o v
d e b t 0.692 *** 0.552 *** 0.392 *** 0.299 ***
(0.090) (0.093) (0.057) (0.058)
i n v e s t 0.114 *** 0.110 *** 0.104 *** 0.111 ***
(0.028) (0.027) (0.019) (0.018)
l e v 0.313 ***0.477 *** 0.281 ***0.370 ***
(0.120)(0.115) (0.071)(0.068)
r o e 0.081 *0.088 * −0.007−0.004
(0.049)(0.053) (0.027)(0.025)
f i x e d −0.059-0.013 0.546 ***0.575 ***
(0.166)(0.167) (0.103)(0.102)
t o p 5 0.406 **0.406 ** −0.987 ***−0.995 ***
(0.182)(0.182) (0.109)(0.108)
t o b i n q −0.056 ***−0.060 *** 0.020 ***0.017 ***
(0.009)(0.009) (0.007)(0.006)
a g e 0.535 ***0.537 *** 0.200 **0.195 **
(0.178)(0.177) (0.097)(0.097)
b a l a n c e 0.0420.028 −0.001−0.013
(0.074)(0.074) (0.048)(0.048)
Constant2.610 ***2.657 ***0.883 *0.8581.015 ***1.033 ***0.714 **0.710 **
(0.009)(0.006)(0.526)(0.524)(0.006)(0.004)(0.290)(0.290)
Year-specific fixed effects ControlledControlledControlledControlledControlledControlledControlledControlled
Firm-specific fixed effectsControlledControlledControlledControlledControlledControlledControlledControlled
N21,17021,17021,17021,17021,17021,17021,17021,170
R20.7330.7320.7360.7360.5580.5580.5680.569
Note: The figures in parentheses represent robust standard errors aggregated to the firm level. *, **, and *** indicate significance at the 10%, 5%, and 1% levels, respectively.
Table 3. Instrumental variables estimation.
(1)(2)(3)(4)(5)(6)
D e b t I n v e s t P a t e n t P a t e n t I n n o v I n n o v
i v −0.004 ***−0.056 ***
(0.001)(0.004)
d e b t 23.656 *** 11.868 ***
(5.452) (2.848)
i n v e s t 1.622 *** 0.814 ***
(0.169) (0.103)
Kleibergen-Paap rk LM statistic21.478223.970
Kleibergen-Paap rk Wald F statistic21.402225.343
Controlled variablesControlledControlledControlledControlledControlledControlled
Year-specific fixed effects ControlledControlledControlledControlledControlledControlled
Firm-specific fixed effectsControlledControlledControlledControlledControlledControlled
N 21,09921,09921,09921,099
Centered R2 −5.693−0.366−3.306−0.193
Note: The figures in parentheses represent robust standard errors aggregated to the firm level. *** denote significance at the 1% levels, respectively. Control variables include debt-to-equity ratio (lev), return on assets (roa), proportion of fixed assets (fixed), shareholding ratio of the top five shareholders (top5), Tobin’s Q (tobinq), firm age (age), and equity balance (balance). Unless otherwise specified, the same applies to the tables in this.
Table 4. Estimation results incorporating city-level control variables.
(1)(2)(3)(4)
P a t e n t P a t e n t I n n o v I n n o v
d e b t 0.493 *** 0.321 ***
(0.099) (0.061)
i n v e s t 0.102 *** 0.114 ***
(0.029) (0.019)
Controlled variablesControlledControlledControlledControlled
Year-specific fixed effects ControlledControlledControlledControlled
Firm-specific fixed effectsControlledControlledControlledControlled
N18,50218,50218,50218,502
R20.7400.7400.5740.575
Note: The figures in parentheses represent robust standard errors aggregated to the firm level. *** denote significance at 1% level.
Table 5. Estimated results for mitigating measurement errors.
(1)(2)(3)(4)
P a t e n t P a t e n t I n n o v I n n o v
l o n g _ d e b t 0.014 *** 0.006 ***
(0.002) (0.001)
i n v e s t _ t o t a l 0.084 *** 0.074 ***
(0.021) (0.013)
Controlled variablesControlledControlledControlledControlled
Year-specific fixed effects ControlledControlledControlledControlled
Firm-specific fixed effectsControlledControlledControlledControlled
N17,92721,17017,92721,170
R20.7460.7360.5670.569
Note: The figures in parentheses represent robust standard errors aggregated to the firm level. *** denote significance at 1% level.
Table 6. Robustness tests: replacing the innovation indicator.
(1)(2)(3)(4)(5)(6)
P a t e n t _ 321 P a t e n t _ 321 I n v e n t I n v e n t I n n o v _ t o t a l I n n o v _ t o t a l
d e b t 0.362 *** 0.253 *** 0.836 ***
(0.102) (0.072) (0.088)
i n v e s t 0.062 ** 0.050 ** 0.176 ***
(0.030) (0.026) (0.027)
Controlled variablesControlledControlledControlledControlledControlledControlled
Year-specific fixed effectsControlledControlledControlledControlledControlledControlled
Firm-specific fixed effectsControlledControlledControlledControlledControlledControlled
N21,17021,17021,17021,17021,17021,170
R20.7260.7260.6680.6680.8120.811
Note: The figures in parentheses represent robust standard errors aggregated to the firm level. **, *** denote significance at the 5%, 1% levels, respectively.
Table 7. Robustness tests: sub-sample estimates.
(1)(2)(3)(4)(5)(6)(7)(8)
P a t e n t P a t e n t I n n o v I n n o v P a t e n t P a t e n t I n n o v I n n o v
d e b t 0.593 *** 0.335 *** 0.534 *** 0.305 ***
(0.098) (0.067) (0.083) (0.065)
i n v e s t 0.092 *** 0.113 *** 0.113 *** 0.121 ***
(0.031) (0.021) (0.026) (0.019)
Controlled variablesControlledControlledControlledControlledControlledControlledControlledControlled
Year-specific fixed effects ControlledControlledControlledControlledControlledControlledControlledControlled
Firm-specific fixed effectsControlledControlledControlledControlledControlledControlledControlledControlled
N15,56715,56715,56715,56718,75318,75317,30717,307
R20.7240.7230.5670.5680.7150.7140.4970.499
Note: The figures in parentheses represent robust standard errors aggregated to the firm level. *** denote significance at the 1% levels, respectively.
Table 8. Robustness tests: controlling for other shocks.
(1)(2)(3)(4)
P a t e n t P a t e n t I n n o v I n n o v
d e b t 0.428 *** 0.255 ***
(0.113) (0.075)
i n v e s t 0.125 *** 0.114 ***
(0.032) (0.021)
Controlled variablesControlledControlledControlledControlled
Year-specific fixed effects ControlledControlledControlledControlled
Firm-specific fixed effectsControlledControlledControlledControlled
N11,78111,78111,78111,781
R20.7460.7460.6290.630
Note: The figures in parentheses represent robust standard errors aggregated to the firm level. *** denote significance at 1% level.
Table 9. Robustness tests: balanced panel estimates.
(1)(2)(3)(4)
P a t e n t P a t e n t I n n o v I n n o v
d e b t 0.368 ** 0.270 ***
(0.173) (0.103)
i n v e s t 0.075 * 0.080 ***
(0.040) (0.028)
Controlled variablesControlledControlledControlledControlled
Year-specific fixed effects ControlledControlledControlledControlled
Firm-specific fixed effectsControlledControlledControlledControlled
N7408740874087408
R20.7350.7350.5500.559
Note: The figures in parentheses represent robust standard errors aggregated to the firm level. *, **, and *** indicate significance at the 10%, 5%, and 1% levels, respectively.
Table 10. Robustness tests: replacing fixed effects.
(1)(2)(3)(4)(5)(6)(7)(8)
P a t e n t P a t e n t I n n o v I n n o v P a t e n t P a t e n t I n n o v I n n o v
d e b t 0.304 ** 0.216 *** 0.321 ** 0.229 ***
(0.128) (0.064) (0.128) (0.070)
i n v e s t 0.218 *** 0.093 *** 0.214 *** 0.093 ***
(0.038) (0.024) (0.040) (0.024)
Controlled variablesControlledControlledControlledControlledControlledControlledControlledControlled
Year-specific fixed effects ControlledControlledControlledControlledControlledControlledControlledControlled
Industry fixed effectsControlledControlledControlledControlledControlledControlledControlledControlled
Year × Industry interaction fixed effectsControlledControlledControlledControlledControlledControlledControlledControlled
N21,16921,16921,16921,16921,05421,05421,05421,054
R20.3430.3500.2070.2090.3580.3640.2300.233
Note: ** and *** denote significance at the 5% and 1% levels, respectively.
Table 11. Analysis of heterogeneity between state-owned and private enterprises.
(1)(2)(3)(4)(5)(6)(7)(8)
P a t e n t P a t e n t P a t e n t P a t e n t I n n o v I n n o v I n n o v I n n o v
SOEPrivateSOEPrivateSOEPrivateSOEPrivate
d e b t 0.636 **0.518 *** 0.0820.358 ***
(0.246)(0.099) (0.147)(0.062)
i n v e s t 0.0690.123 *** 0.098 ***0.117 ***
(0.050)(0.033) (0.032)(0.021)
Test for Differences in Coefficients0.117 ***−0.053 ***−0.276 ***−0.019 ***
Controlled variablesControlledControlledControlledControlledControlledControlledControlledControlled
Year-specific fixed effects ControlledControlledControlledControlledControlledControlledControlledControlled
Firm-specific fixed effectsControlledControlledControlledControlledControlledControlledControlledControlled
N386117,309386117,309386117,309386117,309
R20.7540.7330.7530.7330.5460.5750.5490.575
Note: The figures in parentheses represent robust standard errors aggregated to the firm level. ** and *** indicate significance at the 5% and 1% levels, respectively.
Table 12. Analysis of heterogeneity between national-level “specialized, refined, unique, and innovative” “little giant” enterprises and other enterprises.
(1)(2)(3)(4)(5)(6)(7)(8)
P a t e n t P a t e n t P a t e n t P a t e n t I n n o v I n n o v I n n o v I n n o v
Little GiantOtherLittle GiantOtherLittle GiantOtherLittle GiantOther
d e b t 0.646 ***0.513 *** 0.348 **0.282 ***
(0.180)(0.103) (0.157)(0.062)
i n v e s t 0.0210.119 *** 0.0480.119 ***
(0.055)(0.030) (0.066)(0.018)
Test for Differences in Coefficients0.133 ***−0.098 ***0.067 ***−0.071 ***
Controlled variablesControlledControlledControlledControlledControlledControlledControlledControlled
Year-specific fixed effects ControlledControlledControlledControlledControlledControlledControlledControlled
Firm-specific fixed effectsControlledControlledControlledControlledControlledControlledControlledControlled
N307718,093307718,093307718,093307718,093
R20.6810.7420.6790.7420.5520.5710.5510.573
Note: The figures in parentheses represent robust standard errors aggregated to the firm level. ** and *** indicate significance at the 5% and 1% levels, respectively.
Table 13. Analysis of heterogeneity among firms in regulated and unregulated industries.
(1)(2)(3)(4)(5)(6)(7)(8)
P a t e n t P a t e n t P a t e n t P a t e n t I n n o v I n n o v I n n o v I n n o v
RegulatoryNon-RegulatedRegulatoryNon-RegulatedRegulatoryNon-RegulatedRegulatoryNon-Regulated
d e b t 0.563 ***0.551 *** 0.269 ***0.310 ***
(0.154)(0.110) (0.097)(0.071)
i n v e s t 0.071 *0.114 *** 0.098 ***0.119 ***
(0.038)(0.035) (0.030)(0.022)
Test for Differences in Coefficients0.012−0.043 ***−0.042 *−0.021 ***
Controlled variablesControlledControlledControlledControlledControlledControlledControlledControlled
Year-specific fixed effects ControlledControlledControlledControlledControlledControlledControlledControlled
Firm-specific fixed effectsControlledControlledControlledControlledControlledControlledControlledControlled
N630414,852630414,852630414,852630414,852
R20.7190.7470.7180.7460.5770.5750.5770.576
Note: The figures in parentheses represent robust standard errors aggregated to the firm level. * and *** indicate significance at the 10% and 1% levels, respectively.
Table 14. Mechanisms for industry–academia–research collaboration and knowledge transfer.
(1)(2)(3)(4)(5)(6)
SASA I a r _ c I a r _ c I a r _ c _ p I a r _ c _ p
d e b t −0.807 *** 0.101 *** 0.765 ***
(0.211) (0.025) (0.235)
i n v e s t −1.218 *** 0.017 ** 0.107 **
(0.075) (0.007) (0.050)
Controlled variablesControlledControlledControlledControlledControlledControlled
Year-specific fixed effects ControlledControlledControlledControlledControlledControlled
Firm-specific fixed effectsControlledControlledControlledControlledControlledControlled
N21,17021,17021,17021,17021,17021,170
R20.7290.7520.3380.3370.4330.433
Note: The figures in parentheses represent robust standard errors aggregated to the firm level. ** and *** indicate significance at the 5% and 1% levels, respectively.
Table 15. Knowledge absorption and market power mechanisms.
(1)(2)(3)(4)(5)(6)
R D _ r a t i o R D _ r a t i o L e r n e r L e r n e r O p e r a t _ r a t i o O p e r a t _ r a t i o
d e b t 0.049 ** 0.041 *** 0.003 **
(0.024) (0.010) (0.001)
i n v e s t 0.041 *** 0.004 * 0.003 ***
(0.014) (0.002) (0.000)
Controlled variablesControlledControlledControlledControlledControlledControlled
Year-specific fixed effects ControlledControlledControlledControlledControlledControlled
Firm-specific fixed effectsControlledControlledControlledControlledControlledControlled
N21,17021,17020,67920,67920,67920,679
R20.2560.2580.6350.6340.7660.768
Note: The figures in parentheses represent robust standard errors aggregated to the firm level. *, **, and *** indicate significance at the 10%, 5%, and 1% levels, respectively.
Table 16. Descriptive statistics for small and medium-sized enterprises in the China industrial enterprise database.
VariablesDefinitionNMeanStandard Deviation
p a t e n t _ t Logarithm of the number of patents granted3,906,9960.64122.5
i n v e n t _ t Logarithm of the number of granted invention patents3,906,9960.2314.944
d e b t Long-term debt/Total liabilities3,906,9960.0560.137
d e b t _ i Long-term investments/Total investments2,199,7590.010.04
l e v Total Liabilities/Total Assets3,906,9960.5922.864
r o a Total Returns/Net Assets3,906,9960.10919.858
f i x e d Ratio of Net Fixed Assets to Total Assets3,906,9960.3661.441
a g e The reference year—The founding year of the entity3,906,99611.7358.559
Note: Since the China Industrial Enterprises Database does not provide data on the long-term investment variable for 2008 and beyond, the d e b t _ i variable is only available for the period 1998–2007.
Table 17. The impact of patient capital on innovation in China’s industrial SMEs.
(1)(2)(3)(4)
P a t e n t _ t I n v e n t _ t P a t e n t _ t I n v e n t _ t
d e b t 0.425 *0.331 **
(0.226)(0.134)
d e b t _ i 2.743 ***0.718 **
(0.583)(0.222)
Controlled variablesControlledControlledControlledControlled
Year-specific fixed effects ControlledControlledControlledControlled
Firm-specific fixed effectsControlledControlledControlledControlled
N3,906,9963,906,9962,199,7592,199,759
R20.0010.0000.0000.000
Note: The figures in parentheses represent robust standard errors aggregated to the firm level. *, **, and *** indicate significance at the 10%, 5%, and 1% levels, respectively. The control variables include debt-to-equity ratio ( l e v ), return on assets ( r o a ), proportion of fixed assets ( f i x e d ), and company age ( a g e ).
Disclaimer/Publisher’s Note: The statements, opinions and data contained in all publications are solely those of the individual author(s) and contributor(s) and not of MDPI and/or the editor(s). MDPI and/or the editor(s) disclaim responsibility for any injury to people or property resulting from any ideas, methods, instructions or products referred to in the content.