1. Introduction
Recent developments in the international financial system have intensified debates over currency diversification and the resilience of payment networks (
Eichengreen & Woods, 2016). Renewed attention to sanction effectiveness and settlement-channel reconfiguration has further elevated the relevance of non-traditional currency options. Against this backdrop, RMB usage has expanded—particularly among emerging and developing economies—in trade settlement and, to a lesser extent, reserve holdings. A distinctive feature of RMB internationalization from the holder-side perspective is the pronounced heterogeneity of adoption: major RMB holders are not always China’s largest trading partners, and RMB-related exposure appears uneven across income groups and regions. This “complementary-currency” trajectory is consistent with assessments that view RMB internationalization as incremental and context-dependent rather than as a linear transition toward dominant-currency status (
Eichengreen & Lombardi, 2017). This pattern raises a foundational question: is greater holder-side RMB-related exposure systematically associated with differences in macroeconomic performance efficiency, and are the observed patterns consistent with identifiable transmission channels?
The holder-side literature has documented potential benefits of RMB usage grounded in classic international currency functions (
Cohen, 1971;
Kenen, 1983;
Chinn & Frankel, 2007). Empirical studies show that RMB movements can affect local currency dynamics and generate regional spillovers (
J. Liu et al., 2019;
Falianty, 2019;
Zhan et al., 2025), and that RMB settlement can reduce transaction costs in cross-border payments (
Quadros & Azevedo, 2023;
IMF, 2023). However, much existing evidence evaluates outcomes using single macroeconomic indicators. This leaves two gaps: whether holder-side RMB-related exposure is associated with overall macroeconomic performance when multiple objectives must be achieved jointly, and whether such associations are more consistent with exchange-rate, settlement, or production-network channels.
A trade-only explanation is insufficient to account for the observed heterogeneity in RMB-related exposure. Experience with dominant currencies suggests that currency holdings and usage affect holders through multiple mechanisms beyond trade settlement: pricing conventions, balance-sheet exposures, and the organization of trade and investment can jointly shape macroeconomic outcomes (
Bordo, 2007;
Mehrling, 2010;
Norrlof, 2014;
McNally, 2015). The macroeconomic implications of holding or using a foreign currency therefore depend not only on trade intensity, but also on how currency-related conditions interact with price transmission and value creation across production networks.
Motivated by this perspective, this paper evaluates whether holder-side RMB-related exposure and RMB-internationalization conditions are associated with macroeconomic performance efficiency, defined as the efficiency with which an economy translates key input resources into multiple macroeconomic objectives. Rather than assessing performance through a single indicator, we adopt a multi-objective framework because macroeconomic policy is inherently a joint optimization problem: economies simultaneously pursue growth, price stability, employment, and external balance. This motivates our central research question: do economies with different levels of holder-side RMB-related exposure exhibit different levels of macroeconomic performance efficiency, and are the observed associations consistent with ERPT- and GVC-related transmission channels?
We do not assume that RMB exposure mechanically improves macroeconomic performance efficiency. Instead, RMB-related exposure is treated as a reduced-form indicator of an economy’s connection to RMB-relevant trade, settlement, valuation, and production-network conditions. Its association with macroeconomic performance efficiency may arise through exchange-rate pass-through, transaction-cost and settlement-cost reductions, or value-chain linkages. At the same time, these mechanisms may overlap with broader globalization, trade integration, financial development, and domestic institutional capacity. Therefore, the empirical analysis interprets RMB-related variables as conditional exposure proxies rather than direct causal measures of RMB usage.
To connect currency exposure to macroeconomic outcomes, we focus on two complementary channels. First, from a global value chain (GVC) perspective, performance efficiency depends on an economy’s role in cross-border production networks and its ability to generate value added (
Antràs et al., 2012;
Chor et al., 2014;
Ju & Yu, 2015;
Fukumoto, 2022). Second, from an exchange-rate pass-through (ERPT) perspective, currency conditions matter insofar as exchange-rate movements transmit into domestic prices and macroeconomic trade-offs (
Frankel, 1979). These channels provide the conceptual basis for examining whether RMB-related exposure is associated with macroeconomic performance efficiency through price-transmission and production-network pathways.
Empirically, we implement a two-stage design. In the first stage, we estimate macroeconomic performance efficiency using a Data Envelopment Analysis (DEA) framework and apply a cross-efficiency refinement to improve comparability across economies. In the second stage, we relate the estimated efficiency scores to RMB-related exchange-rate and China-related value-added linkage proxies that capture holder-side exposure conditions. The panel regressions are aligned with the ERPT and GVC channels and are supplemented by robustness checks that distinguish RMB-specific exposure from broader trade integration, financial development, institutional capacity, and other structural conditions.
This study contributes to the RMB-internationalization literature in three ways. First, it introduces a macro-level, multi-objective efficiency metric as an outcome of interest in holder-side analyses, shifting the focus from currency scale, economic size, or single indicators to joint macroeconomic performance. Second, it offers a mechanism-oriented empirical design that links holder-side RMB-related exposure to macroeconomic performance efficiency through ERPT- and GVC-related pathways. Third, it provides cross-country evidence within a unified framework that combines efficiency estimation, panel regressions, and robustness analyses, while explicitly treating the estimated relationships as conditional associations rather than causal effects.
Our results suggest a positive and statistically significant but economically modest ERPT association under the DEA specification (p < 0.01), while the GVC evidence is weaker and should be interpreted as suggestive rather than confirmatory. These findings highlight the importance of examining how RMB-related exposure may interact with price transmission and production-network structures when evaluating its macroeconomic implications for RMB-holding economies.
2. Theory of Macroeconomic Performance Efficiency
Macroeconomic performance is commonly evaluated using aggregate indicators such as GDP growth, inflation, or unemployment. While informative, these do not account for the efficiency with which an economy transforms inputs into macroeconomic results. Growth theory distinguishes between expansion driven by factor accumulation and improvements driven by efficiency gains (
Kumar & Russell, 2002;
Los & Timmer, 2005;
Yang, 2011). A sole focus on output levels may obscure differences in how effectively economies utilize resources to deliver multi-dimensional outcomes.
Macroeconomic performance efficiency captures the relative ability of an economy to achieve multiple policy objectives under given input conditions, distinguishing economies relying on input expansion from those achieving superior outcomes through more effective allocation (
Golany & Roll, 1989;
Seiford & Thrall, 1990;
J. S. Liu et al., 2013). This is particularly suitable for the holder-side discussion because reserve accumulation and cross-border currency usage involve opportunity costs and valuation effects. What matters is not only whether RMB usage expands, but also whether RMB-related linkages are associated with better overall performance relative to inputs.
From a holder-side perspective, the macroeconomic implications of RMB-related exposure may operate through two complementary channels: the global value chain (GVC) channel and the exchange-rate pass-through (ERPT) channel. These channels emphasize how RMB-related integration may operate through (i) the organization of production and value creation in cross-border trade, and (ii) the transmission of exchange-rate fluctuations into domestic macroeconomic trade-offs.
2.1. The GVC Channel: Value Creation, Trade Linkages, and Efficiency
Within the global value chain framework, the value of a product or service increases as it passes through successive stages of production. Countries differ in their positions within the chain depending on technological capabilities, factor endowments, and institutional environments (
Antràs et al., 2012;
Chor et al., 2014;
Ju & Yu, 2015). Different positions within global value chains are associated with different value-added capacities, upgrading opportunities, and production-efficiency conditions.
For economies interacting with China, RMB-related integration may be reflected in deeper value-added linkages in trade. When cross-border settlement and financing frictions are reduced, participation in value chains can strengthen and the composition of trade can shift toward higher value-added segments. From the holder-side viewpoint, this implies that the macroeconomic implications of RMB allocation can be proxied by changes in value-added exposure associated with China-related trade linkages. Concretely, variations in China-related export and import value-added linkages capture how an economy is embedded in production networks that may be facilitated by RMB usage in trade settlement and related financial arrangements. If such linkages support better allocation of resources and upgrading, they are expected to correlate with higher macroeconomic performance efficiency.
Operationalizing the GVC channel for the holder-side analysis requires an explicit mapping between the theoretical mechanism and observable variables. We adopt four value-added measures from the OECD-TiVA framework (
Antràs et al., 2012;
Chor et al., 2014). VAEC—China’s value added in the gross exports of the sample economy—captures the extent to which the economy’s exports rely on Chinese intermediate inputs, and is interpretable as a measure of upstream linkage to China-related production networks. VAIC—China’s value added in the gross imports of the sample economy—captures the extent to which Chinese final and intermediate products are absorbed in domestic demand, and is interpretable as a measure of downstream demand linkage. VAIU—U.S. value added in gross imports—is a benchmark for the alternative dominant-currency GVC channel, allowing us to identify the China-specific margin net of general dominant-currency integration. VAE—domestic value added in gross exports—controls for the country’s own GVC position. The maintained hypothesis is that, conditional on VAE and VAIU, variation in VAEC and VAIC helps distinguish the China-related GVC margin that is plausibly connected to RMB usage in trade settlement and supply-chain financing (
IMF, 2023). The empirical analog of the GVC channel in our regression specifications is therefore the joint coefficient on (VAEC, VAIC) in the CCR–GVC and CED–GVC specifications.
2.2. The ERPT Channel: Exchange-Rate Movements and Macro Trade-Offs
The exchange-rate pass-through mechanism provides a second channel linking RMB-related financial exposure to macroeconomic performance efficiency. Exchange-rate fluctuations affect the domestic currency value of imports, external liabilities, and balance-sheet positions. When pass-through is strong, exchange-rate movements translate into domestic price changes, influencing macroeconomic trade-offs among inflation, output, employment, and external balance (
Frankel, 1979;
Gopinath et al., 2020).
The strength of exchange-rate transmission depends on exposure structures and adjustment frictions, implying heterogeneous pass-through across economies (
Flodén et al., 2008). From the holder-side perspective, RMB allocation may be associated with greater relevance of RMB exchange-rate dynamics for domestic macro-outcomes. Empirically, this mechanism implies that exchange-rate exposure should matter more in economies with greater import dependence or tighter external-balance constraints.
Operationalizing the ERPT channel parallels the GVC mapping. The empirical proxy is the CNY/SDR exchange rate, which captures the relative price of the RMB against a multilateral basket. Conditional on USD/SDR (the alternative dominant-currency benchmark) and X/SDR (the local-currency reference), the coefficient on CNY/SDR captures the RMB-specific exchange-rate exposure margin relative to other external valuation channels (
Gopinath et al., 2020). Two interpretive caveats deserve emphasis. First, this is a reduced-form mapping; the structural model would relate efficiency to the pass-through coefficient itself rather than to the exchange-rate level, but the pass-through coefficient is not separately identified at the aggregate level for the SDR-basket cross-rates over our annual sample. Second, the ERPT channel and the GVC channel are not orthogonal: economies with deeper Chinese value-added linkages may also exhibit higher RMB pass-through. We therefore estimate the two channels in separate equations and interpret the results as complementary reduced-form associations rather than competing structural identifications.
2.3. RMB-Specific Exposure, General Integration, and Macroeconomic Performance Efficiency
RMB-related exposure may be correlated with broader external integration. Economies that are more exposed to RMB-related conditions may also be more open to trade, more financially developed, more institutionally capable, or more deeply integrated into China-related production networks. Therefore, it would be inappropriate to interpret CNY/SDR or China-related value-added linkages as pure causal measures of RMB internationalization. In this study, RMB-related exposure is conceptualized as a conditional exposure margin embedded in broader trade, financial, and production-network structures.
To distinguish the RMB-specific margin from general globalization, the empirical framework uses three layers of separation. First, the ERPT specification includes USD/SDR and local currency/SDR alongside CNY/SDR, so that the CNY coefficient is interpreted relative to alternative exchange-rate valuation channels. Second, the GVC specification includes U.S. value added in gross imports (VAIU) and domestic value added in gross exports (VAE), so that China-related value-added coefficients are interpreted relative to dominant-currency and domestic GVC benchmarks. Third, additional robustness regressions include controls for trade openness, financial development, government effectiveness, and domestic investment conditions. These steps do not establish causality, but they reduce the risk that the reported associations merely capture general globalization or domestic development capacity.
2.4. Integrated Framework and Empirical Implications
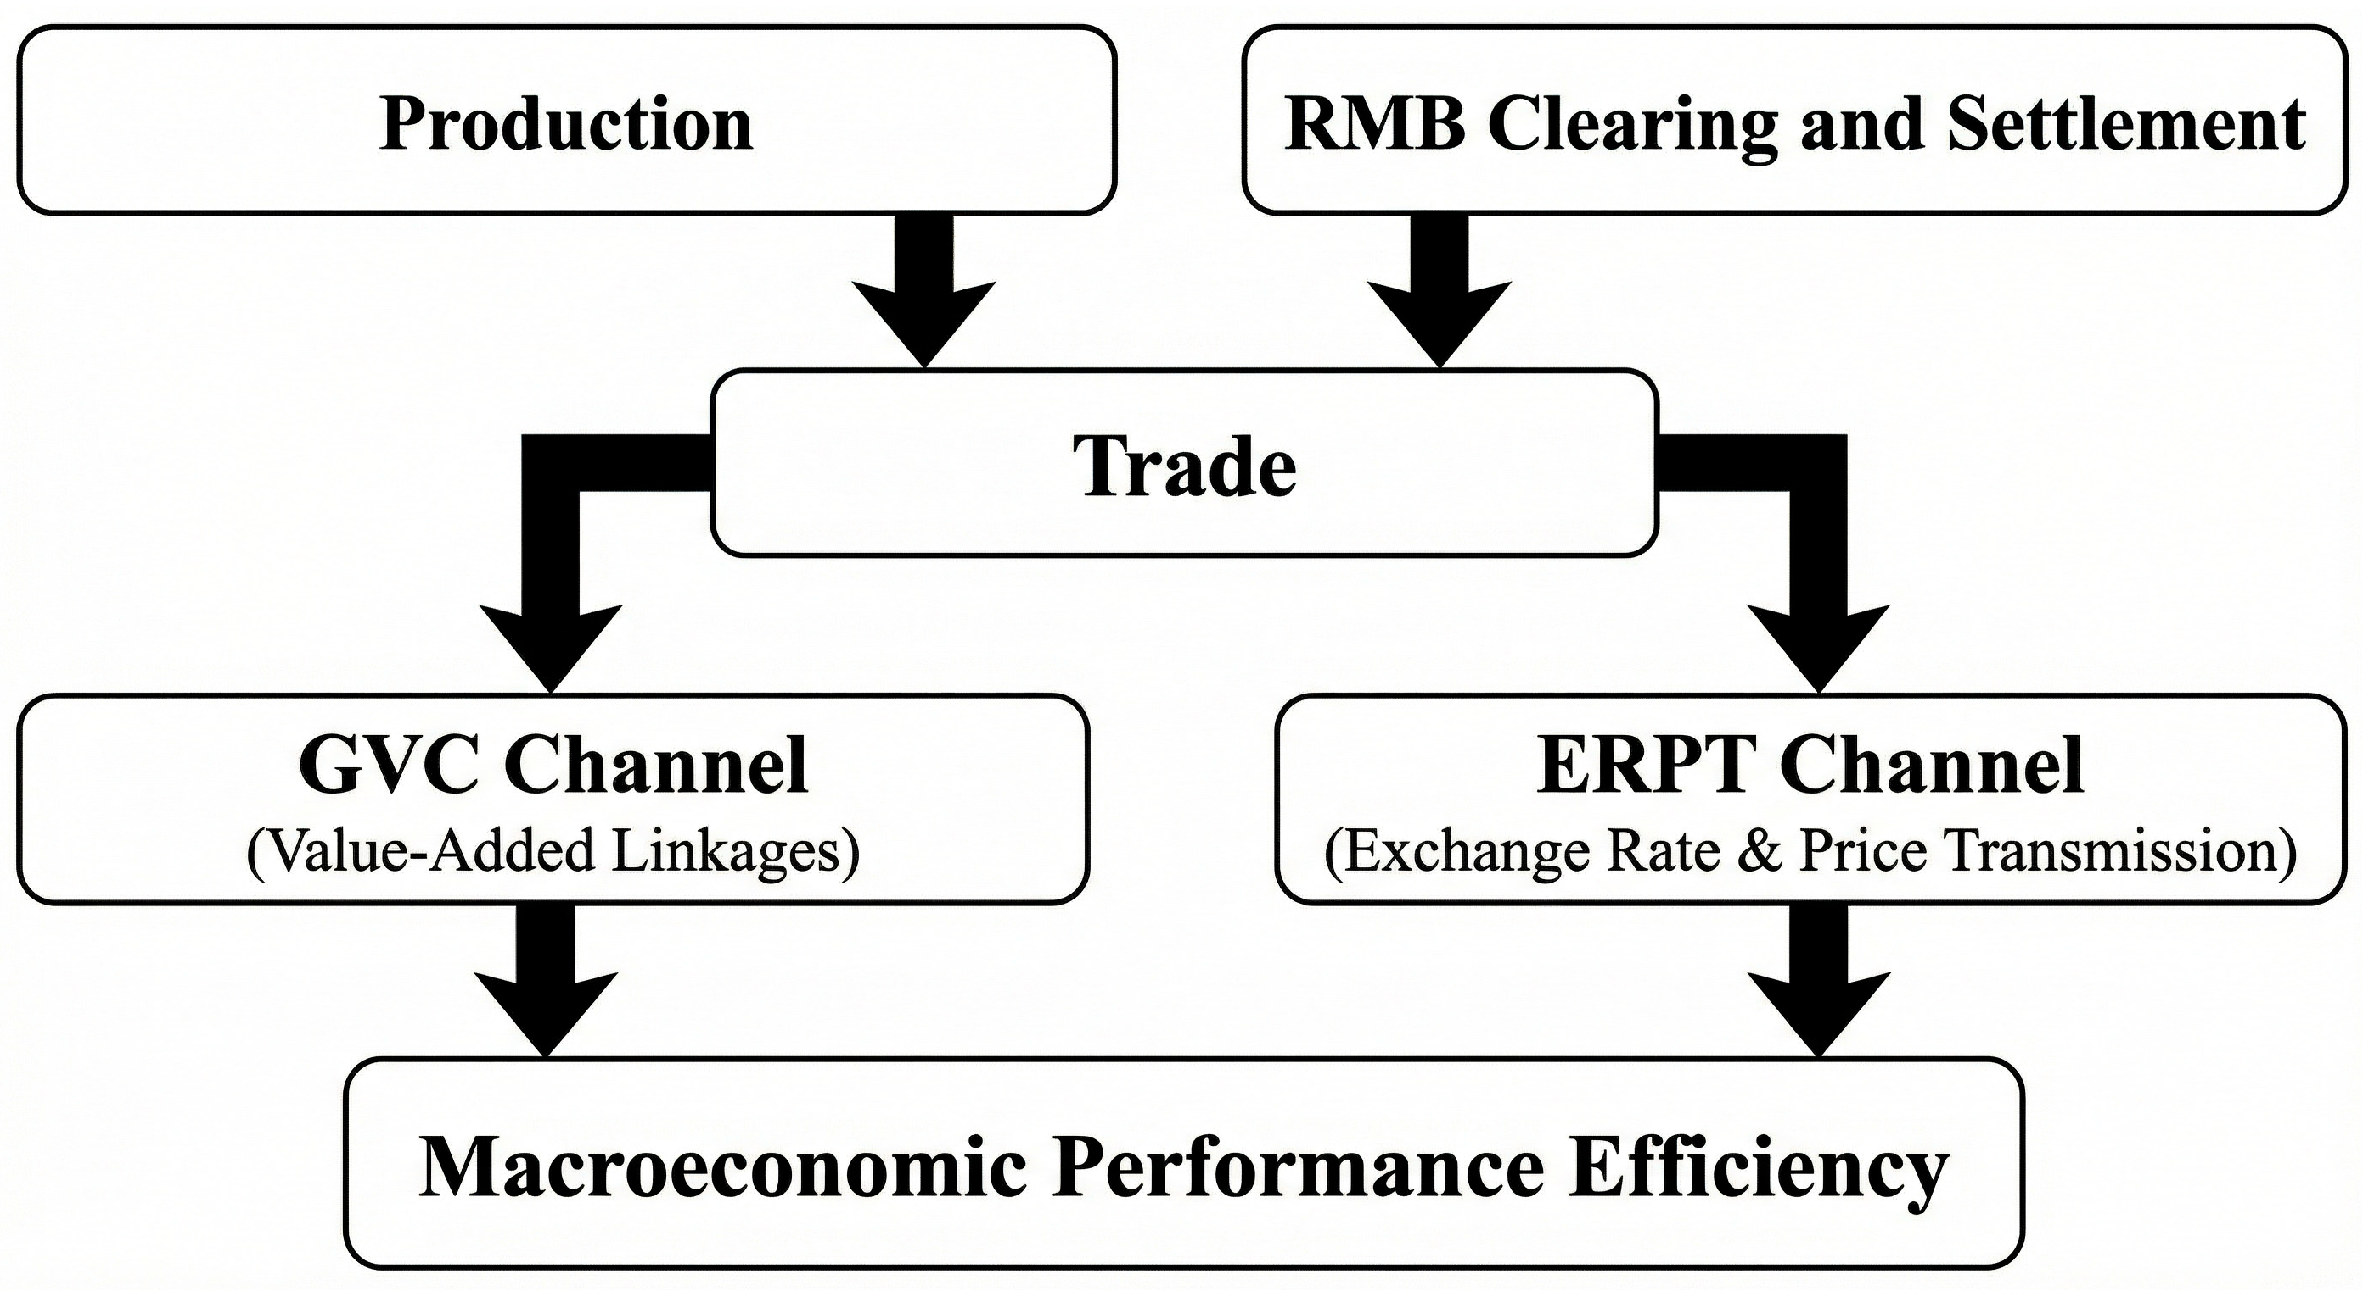
Figure 1 summarizes the integrated framework linking production, trade, and RMB settlement. The GVC channel emphasizes that RMB-related integration may be reflected in value-added linkages and production-network embedding associated with China-related trade. The ERPT channel emphasizes that RMB exchange-rate dynamics may influence domestic macro trade-offs through price transmission and valuation effects. Together, these mechanisms provide the conceptual basis for evaluating RMB allocation from the holder-side perspective using a multi-objective efficiency metric.
This framework motivates the empirical strategy adopted in the next section: macroeconomic performance efficiency is first measured in a multi-objective setting and then related to GVC- and ERPT-related proxies that capture the trade and financial mechanisms through which RMB allocation may matter.
3. Models and Hypotheses
3.1. DEA and Game Cross-Efficiency DEA
We measure macroeconomic performance efficiency using Data Envelopment Analysis (DEA), a non-parametric approach that evaluates the relative efficiency of homogeneous decision-making units (DMUs) with multiple inputs and outputs (
Cooper et al., 2006;
Zhu, 2015). DEA is suitable for this study for three reasons. First, our outcome space includes four heterogeneous macroeconomic objectives—growth, inflation performance, unemployment performance, and current-account balance—for which no consensus production function exists. Parametric alternatives such as Stochastic Frontier Analysis would require stronger assumptions about functional form and the distribution of inefficiency. Second, DEA accommodates multiple inputs and outputs without imposing ex ante weights, allowing each economy to be evaluated relative to best-practice peers. Third, the CCR specification under constant returns to scale (CRS) provides a common overall-efficiency benchmark for economies that differ substantially in size. To assess sensitivity to the CRS assumption, Section Data Envelopment Analysis reports a pooled BCC specification under variable returns to scale (VRS), with country-level comparisons in
Appendix A Table A1 (
Banker et al., 1984).
The CCR specification is retained as the baseline because the object of this study is overall macroeconomic performance efficiency relative to a common intertemporal frontier. Under this interpretation, scale efficiency is part of the phenomenon being evaluated rather than a component that must necessarily be removed. Economies differ not only in pure technical or allocative efficiency, but also in the scale at which labor, capital, human capital, and communication infrastructure are transformed into macroeconomic outcomes. The CCR score therefore provides an overall-efficiency benchmark incorporating both pure technical efficiency and scale efficiency.
The VRS/BCC specification is used as a complementary first-stage sensitivity check. It allows us to assess whether the economy-level efficiency pattern is driven primarily by the constant-returns-to-scale assumption. Consistent with the two-stage DEA reasoning discussed by
Boubaker et al. (
2025), observable structural heterogeneity and economy-specific effects are addressed in the second-stage models, although these controls do not eliminate all cross-economy heterogeneity.
We construct a single pooled common intertemporal frontier using all 348 economy-year observations simultaneously (25 economies × 14 years). Each economy-year observation is treated as a separate DMU, and all DMUs are evaluated against the same frontier. We do not estimate separate frontiers for each year.
This pooled-frontier design is adopted to mitigate the curse of dimensionality that would arise if only 25 DMUs were evaluated annually using four inputs and four outputs. With a small annual cross-section relative to the number of input-output dimensions, yearly DEA would tend to classify a disproportionately large number of observations as efficient. Pooling increases the number of comparison units and provides a more discriminating common benchmark.
In this study, we adopt the CCR model under the assumption of constant returns to scale (CRS). Let x
m0 and y
r0 denote the m-th input and r-th output of the evaluated DMU and let u
m and v
r denote the corresponding input and output weights. The CCR model is presented in Equations (1)–(3):
A practical limitation of the CCR model is that the optimal weights may be non-unique and may reflect a self-appraisal mechanism, reducing discrimination across DMUs. The pooled design expands the comparison set and thereby mitigates, although it does not eliminate, the dimensionality concern. To address this issue, we also employ the Game Cross-efficiency DEA approach (
Liang et al., 2008;
Xu et al., 2020). Unlike conventional CCR-DEA, which allows each DMU to choose the most favorable weights for itself, Game Cross-efficiency introduces peer appraisal by evaluating each DMU under weights generated through interactions with other DMUs. The procedure imposes a strategic consistency condition: each DMU seeks to improve its own cross-efficiency without reducing the average cross-efficiency of its peer evaluators. Through repeated mutual evaluation, the process converges to a Nash-equilibrium weighting structure, and the final score is obtained as the average of peer-evaluated cross-efficiency values. We refer to this measure as the Game Cross-efficiency DEA score (CED) and use it as an alternative efficiency benchmark in the subsequent panel regressions.
3.2. Maverick Index and Peer-Evaluation Diagnostics
To further assess the difference between self-evaluated and peer-evaluated efficiency, we compute the maverick index following
Doyle and Green (
1994). The maverick index captures the relative deviation between the CCR self-evaluation score and the optimized Game Cross-efficiency score. A larger value indicates that a DMU appears efficient under self-appraisal but is evaluated less favorably under peer assessment. This measure provides a diagnostic comparison between CCR-DEA and CED and serves as a supplementary consistency check for the cross-efficiency framework. We also compute pairwise similarity across DMUs using Euclidean distance based on cross-efficiency scores to examine general clustering patterns in performance space. These diagnostics are used for descriptive assessment rather than as core inputs to the subsequent regression analysis.
3.3. Panel Regression Models and Hypotheses
To examine the exchange-rate pass-through (ERPT) channel, we estimate panel regressions using two dependent variables: the DEA efficiency score (DEA) and the Game Cross-efficiency score (CED). The baseline ERPT specifications are:
Note on exchange-rate variable direction: all three exchange-rate variables (CNY, USD, X) are expressed in units of domestic currency per SDR. Accordingly, a decrease in the variable represents appreciation of the respective currency against the SDR, while an increase represents depreciation. For example, a decrease in X (local currency per SDR) indicates local currency appreciation. This convention is maintained consistently across all hypotheses and regression tables below.
Hypothesis 1. The CNY/SDR exchange-rate variable is systematically associated with macroeconomic performance efficiency.
Hypothesis 2. The USD/SDR exchange-rate variable is systematically associated with macroeconomic performance efficiency.
Hypothesis 3. The local-currency/SDR exchange-rate variable is systematically associated with macroeconomic performance efficiency.
In terms of GVC, the panel regression models and hypotheses are listed below, where DEA and CED denote the efficiency scores derived from CCR-DEA and Game Cross-efficiency DEA, respectively.
VAEC captures China’s value added in the gross exports of the sample economy, while VAIC captures China’s value added in the gross imports of the sample economy. VAIU captures U.S. value added in gross imports and serves as a benchmark for the alternative dominant-currency GVC channel. VAE captures domestic value added in gross exports and controls for the economy’s own GVC position. The variables used in the panel regressions are summarized in
Table 1.
The related hypotheses are as below:
Hypothesis 4. The association between China’s value added in the gross exports of the sample economy (VAEC) and macroeconomic performance efficiency is conditional on the economy’s position in global value chains.
Hypothesis 5. China’s value added in the gross imports of the sample economy (VAIC) is systematically associated with macroeconomic performance efficiency, although the direction may depend on whether it reflects demand linkages, scale effects, import dependence, or exposure to external shocks.
Hypothesis 6. U.S. value added in gross imports (VAIU) captures the alternative dominant-currency GVC channel and may be associated with macroeconomic performance efficiency depending on whether it reflects access to high-quality inputs, upgrading opportunities, or dependence on external production structures.
Hypothesis 7. Domestic value added in gross exports (VAE) is expected to be associated with macroeconomic performance efficiency because it captures domestic value-creation capacity, although its coefficient may differ across CCR-DEA and CED because the two measures apply different benchmarking standards.
A clarification is needed regarding the interpretation of CNY/SDR and value-added linkages as holder-side RMB exposure proxies rather than indicators of broader external integration. First, the ERPT specification includes USD/SDR and local-currency/SDR alongside CNY/SDR, so that the CNY coefficient is interpreted relative to alternative exchange-rate valuation channels (
Gopinath et al., 2020). Second, China-related value-added linkages (VAEC and VAIC) capture the China-specific component of production-network integration, which is the relevant margin for holder-side RMB usage in trade settlement and related financing arrangements (
IMF, 2023;
Hao et al., 2022). Third, VAIU and VAE are included as benchmarks for dominant-currency GVC participation and domestic value-added capacity. These specifications do not establish causality, but they help distinguish RMB-related exposure from broader trade integration and structural conditions.
3.4. Multi-Objective Inputs and Outputs for Efficiency Estimation
Macroeconomic performance is inherently multidimensional. We adopt a multi-objective setting that jointly considers four outcome indicators—GDP growth, inflation performance, unemployment performance, and current-account balance—and four inputs: labor, capital, human capital, and ICT development. The four outputs correspond to conventional macroeconomic policy objectives: real growth, price stability, employment performance, and external balance. The four inputs capture the main resource and capacity conditions through which economies generate these outcomes: labor endowment, physical capital, human capital, and communication infrastructure. The framework does not imply that these are the only possible inputs and outputs; rather, they provide a parsimonious baseline that can be evaluated through sensitivity checks using alternative ICT proxies and alternative DEA specifications.
Appendix A Table A2 summarizes the theoretical rationale for each input and output variable and reports possible alternatives.
A potential concern with multi-objective efficiency aggregation is that policymakers may weight macroeconomic objectives unequally. The DEA framework addresses this concern by avoiding fixed ex ante weights. Rather than imposing a predetermined weighting scheme on growth, inflation performance, unemployment performance, and external balance, DEA assigns each DMU the weights that maximize its own efficiency score subject to feasibility constraints (
Charnes et al., 1978;
Cooper et al., 2006). The Game Cross-efficiency refinement further moderates this self-appraisal feature by introducing peer evaluation through a Nash-equilibrium weighting scheme (
Liang et al., 2008). The contrast between CCR-DEA and CED in
Section 6 is therefore informative about the sensitivity of the results to alternative efficiency benchmarks.
We interpret the DEA score as a relative efficiency measure within this specific input-output framework, not as a comprehensive ranking of national economic success. Additional sensitivity analyses using alternative ICT inputs, alternative inflation-target normalizations, and alternative DEA specifications are discussed in
Section 7 and reported in the
Appendix A.
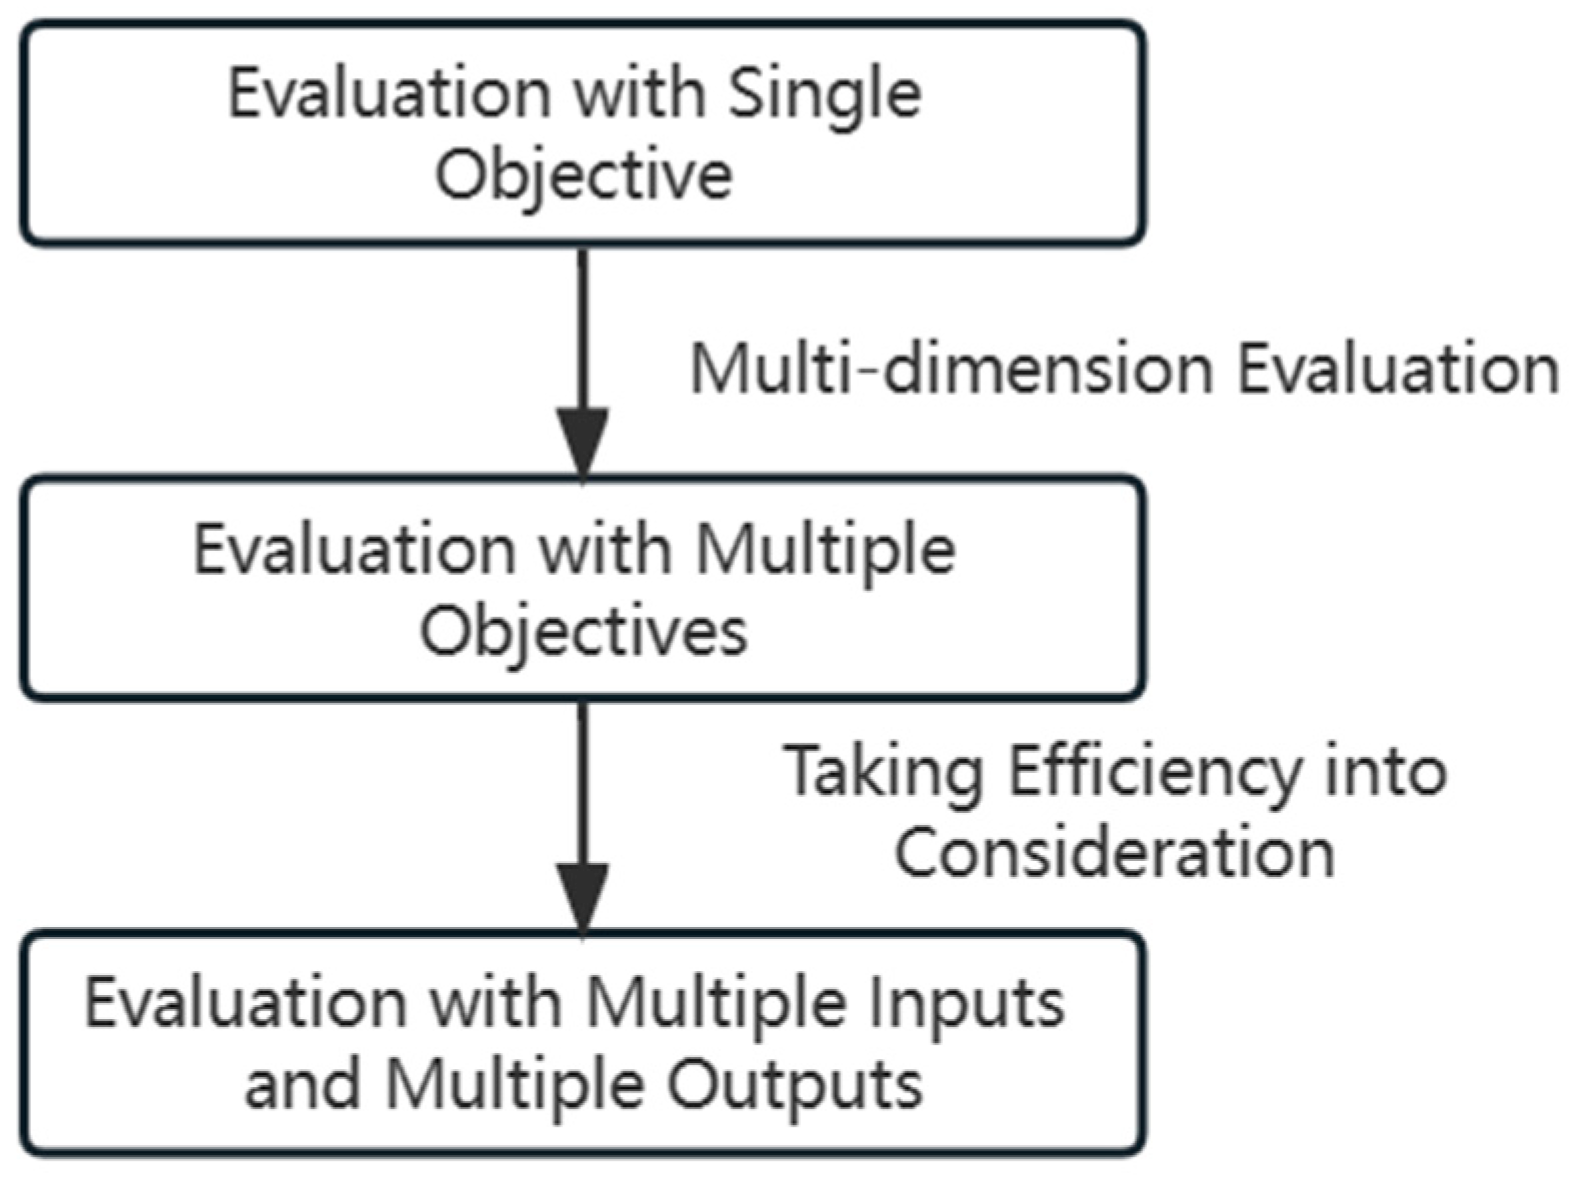
Figure 2 illustrates the difference between single-objective and multi-objective evaluation, while
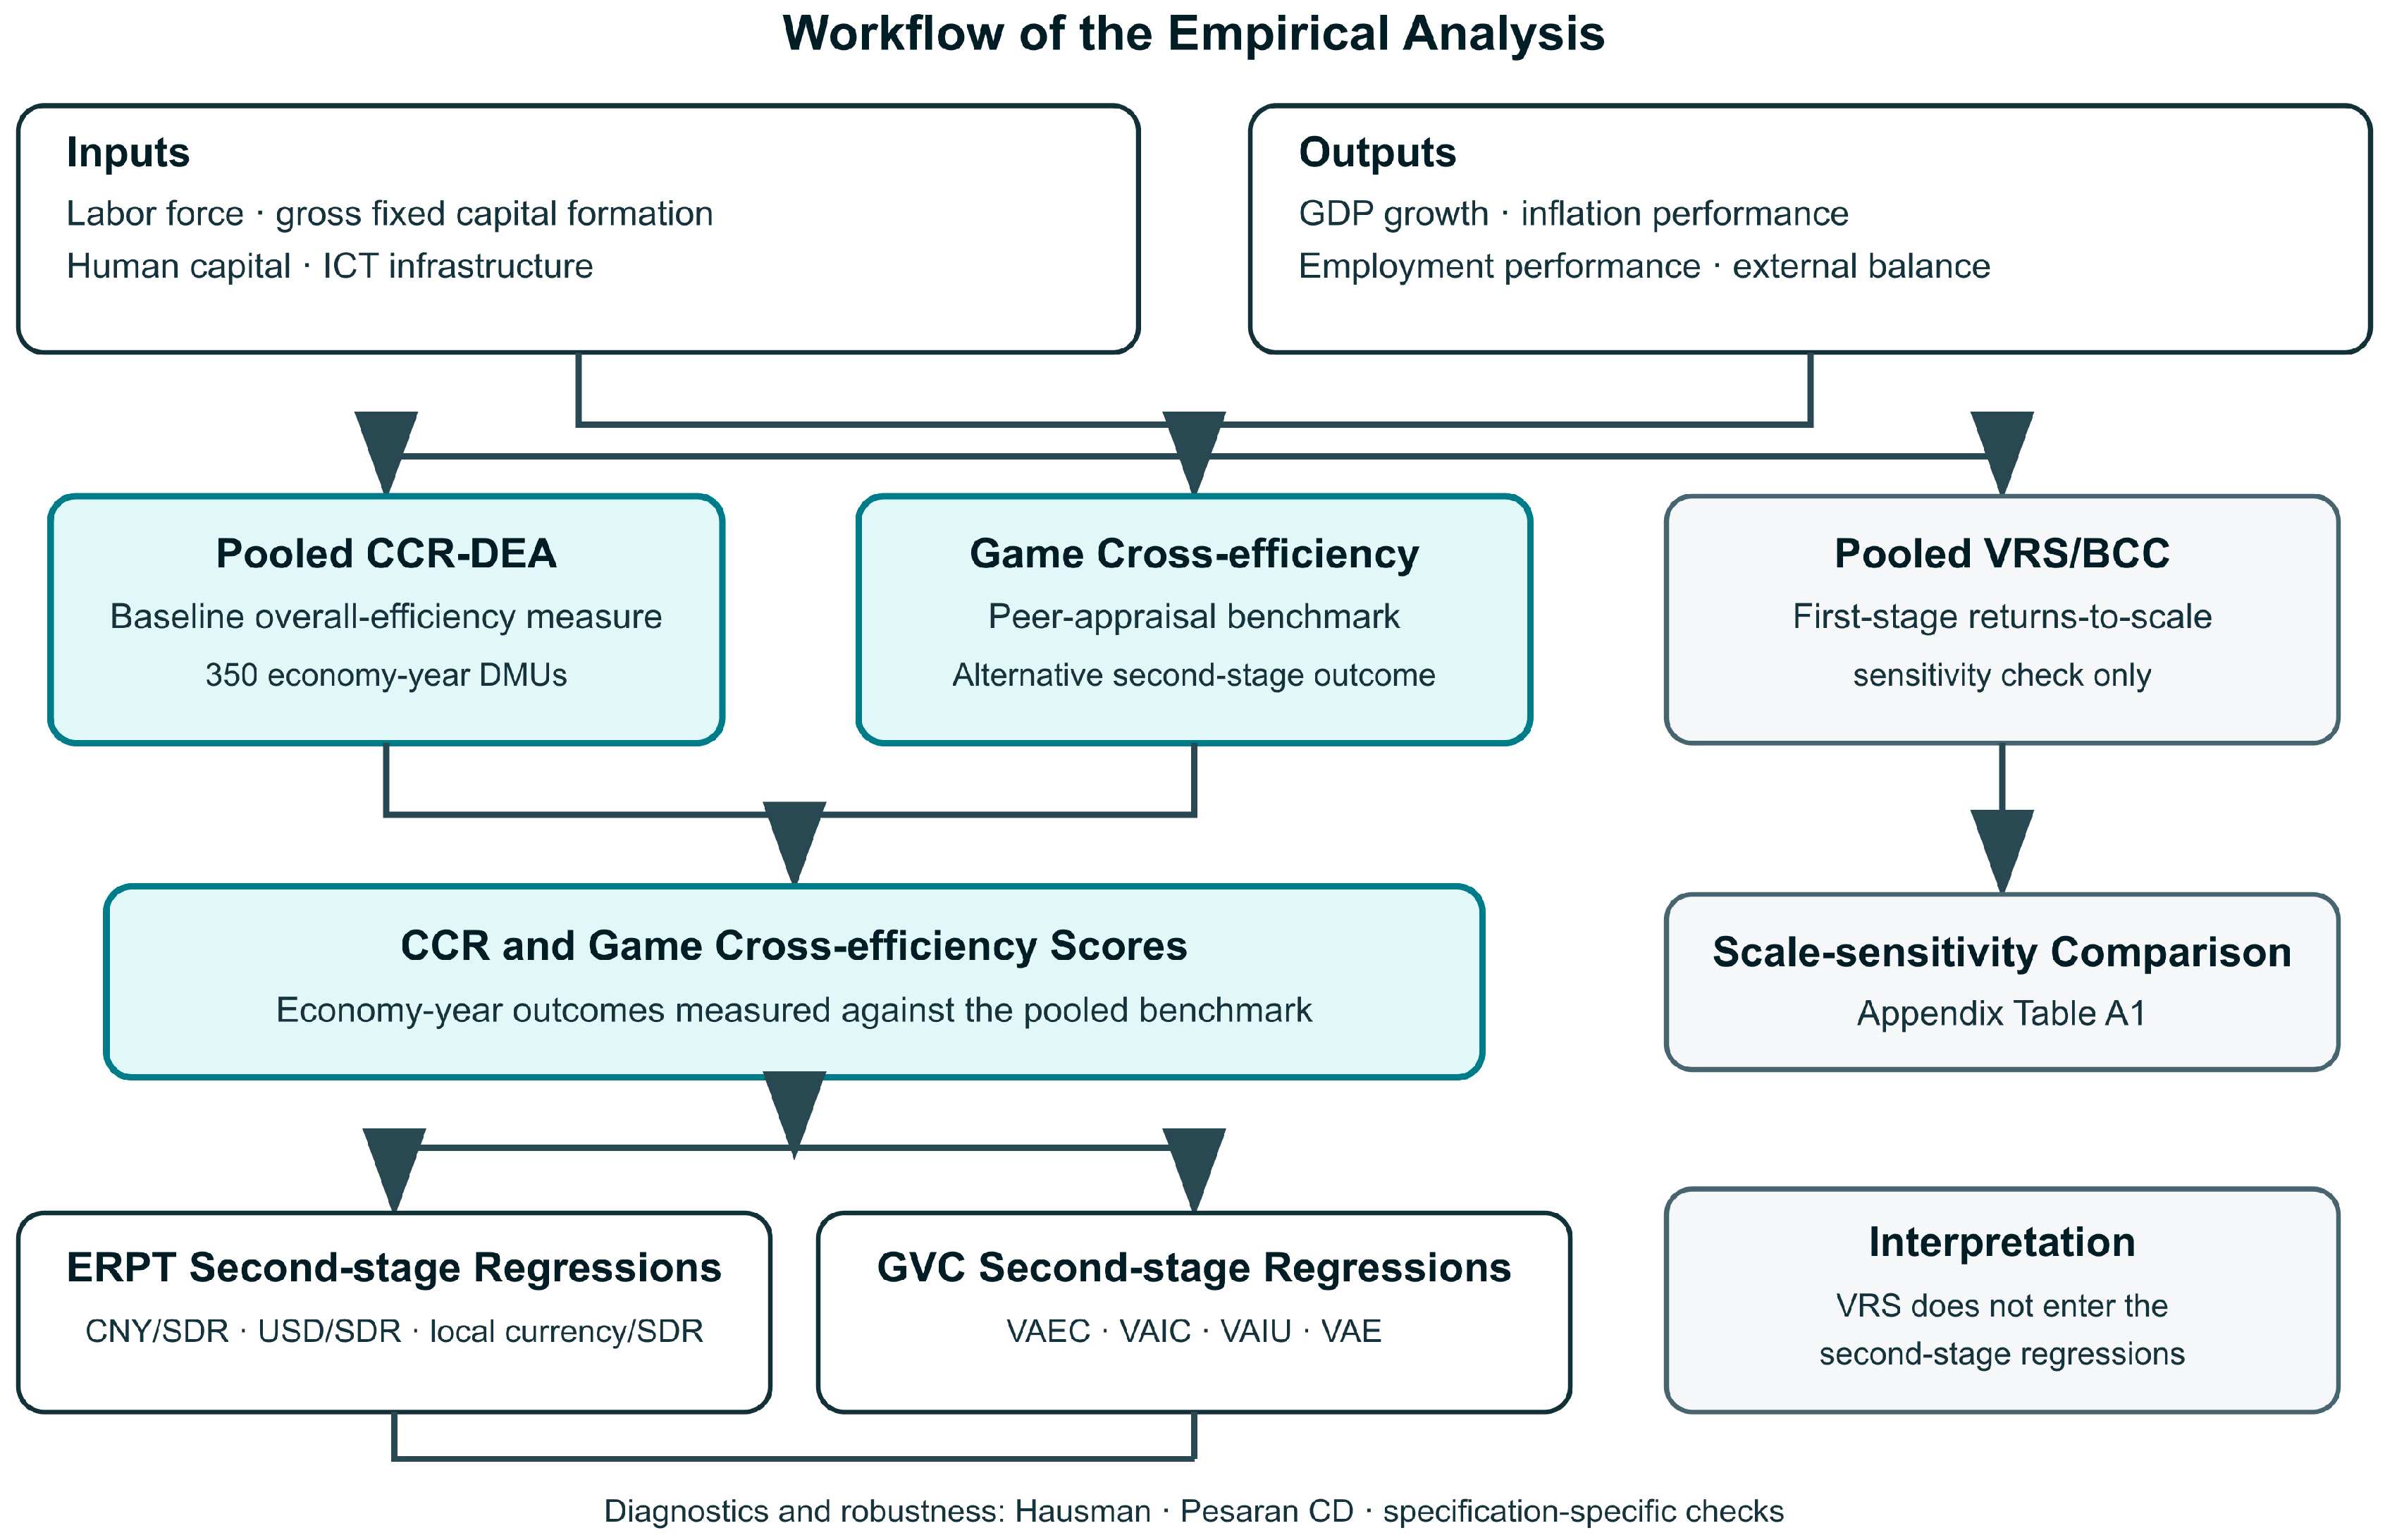
Figure 3 summarizes the empirical procedure from efficiency estimation to ERPT- and GVC-based panel regressions.
4. Data
To avoid structural breaks introduced by the COVID-19 pandemic and ensure consistent data coverage (
Brandao-Marques et al., 2020;
OECD, 2022), this study uses annual data for 25 economies over 2005–2018. The economy set is determined by the intersection of three explicit inclusion criteria: (i) economies that are systematically relevant to RMB internationalization, defined as members of the SDR basket plus the principal RMB onshore and offshore clearing/payment hubs and major China-trading-partner economies covered in
IMF (
2023) and
Hao et al. (
2022); (ii) economies for which the OECD Trade in Value Added (TiVA) database provides complete value-added linkage series for 2005–2018, which is required to construct VAE, VAEC, VAIC, and VAIU; and (iii) economies for which the World Bank, Penn World Table (PWT) v10.0 (
Feenstra et al., 2015), and CEIC databases jointly provide a balanced panel for the four DEA inputs and four DEA outputs, the three exchange-rate variables, and the controls (FER, ED).
The resulting sample comprises Australia, Brazil, Canada, China, France, Germany, Hong Kong (China), India, Indonesia, Italy, Japan, Malaysia, Mexico, Pakistan, the Philippines, Russia, Saudi Arabia, Singapore, South Africa, South Korea, Thailand, Turkey, the United Kingdom, the United States, and Vietnam, covering approximately 80% of global GDP and the bulk of global RMB-related cross-border activity. Pakistan is retained in the DEA estimation and ERPT regressions but excluded from the baseline GVC-channel regressions in order to maintain a consistent revised GVC regression sample across the value-added specifications. This exclusion is a sample-definition choice rather than a consequence of missing OECD-TiVA value-added data for Pakistan. After excluding Pakistan, the expected GVC panel contains 336 country-year observations. The common fixed-effects sample used in the baseline GVC regressions contains 333 observations after listwise deletion across all regressors. This final estimation count, rather than the preliminary 335-observation data-completeness count, is used consistently in the text, table notes, and response letter. Data are obtained from the World Bank, the Penn World Table (PWT) v10.0 (
Feenstra et al., 2015), the OECD-TiVA database, and CEIC. Because comparable post-2018 OECD-TiVA value-added linkage data are unavailable for the full sample, the baseline analysis is restricted to 2005–2018. As a supplementary diagnostic extension,
Supplementary Table S7 reports a CCR-based post-2018 summary and ERPT diagnostic extension; this extension is not used as a baseline robustness test.
Following the multi-objective framework used in efficiency-based evaluations (
Cherchye, 2001), DEA outputs comprise four macroeconomic indicators: GDP growth rate, CPI inflation, unemployment rate, and the current account balance-to-GDP ratio, corresponding to economic growth, price stability, labor-market conditions, and external balance.
DEA inputs are labor, capital, human capital, and ICT development, measured by total labor force, gross fixed capital formation, human capital index, and fixed telephone subscriptions per 100 people. Fixed telephone subscriptions are used in the baseline specification because they provide a long, consistently measured, cross-country indicator of communication infrastructure over the full 2005–2018 balanced panel. However, we recognize that fixed-line infrastructure became less representative of digital connectivity over time as economies shifted toward mobile technologies. Therefore, we treat fixed telephone subscriptions as a baseline communication-infrastructure proxy rather than a definitive measure of ICT development. To address this limitation, we re-estimate the DEA scores using mobile cellular subscriptions per 100 people as an alternative ICT proxy and report the corresponding robustness checks in
Appendix A Table A3. We normalize both inputs and outputs to range between 0 and 1. For variables where “higher is better” (growth, current account balance), we apply min–max normalization; for unemployment, we use an inverse transformation; for inflation, we operationalize performance relative to a 2% target.
After normalization, the efficiency-estimation dataset contains a panel of 348 economy-year observations (two of the 350 possible economy-years are excluded owing to missing input data) (25 economies × 14 years), with no missing values for the four inputs and four outputs. These 348 observations are pooled to construct a single common intertemporal frontier. Accordingly, each efficiency score represents the relative position of one economy in one year against the same pooled benchmark, rather than against a separate year-specific frontier.
Table 2 reports summary statistics for the variables used in the efficiency and panel-regression analyses.
For the ERPT specification, CNY denotes the CNY/SDR exchange-rate variable, USD denotes the USD/SDR exchange-rate variable, and X represents each economy’s local-currency/SDR exchange-rate variable. The exchange-rate variables are measured as annual averages to maintain consistency across economies and years. For the GVC specification, VAE measures domestic value added in gross exports, VAEC denotes China’s value added in gross exports, VAIC denotes China’s value added in gross imports, and VAIU captures U.S. value added in gross imports. FER refers to foreign exchange reserves, and ED refers to external debt as a percentage of GDP. The DEA estimation and ERPT regressions use the balanced 25-economy panel over 2005–2018, while the GVC regressions use the revised GVC sample described above.
5. Estimation of Macroeconomic Performance Efficiency
Data Envelopment Analysis
We estimate macroeconomic performance efficiency using the input-oriented CCR-DEA model under constant returns to scale (CRS). We construct a pooled frontier where the decision-making units (DMUs) are all 348 country-year observations (25 economies × 14 years) simultaneously. As defined in
Section 4, the DEA inputs are the normalized measures of labor, capital, human capital, and ICT development, while the outputs are normalized GDP growth, inflation performance, unemployment performance, and current-account balance. The full country-year CCR-DEA efficiency scores are reported in
Supplementary Table S1.
Because CCR-DEA relies on self-appraisal and may allow frontier economies to benefit from favorable weight selection, we also compute Game Cross-efficiency scores. The CED measure introduces peer evaluation and is used as an alternative efficiency indicator in the second-stage panel regressions. The verified country-year CED series is reported in
Supplementary Table S2 and is the same series used consistently in the baseline second-stage regressions.
To assess sensitivity to the returns-to-scale assumption, we also estimate a pooled VRS/BCC frontier.
Appendix A Table A1 compares the country-level mean CCR and VRS scores. The VRS scores weakly dominate the CCR scores, as expected, and the difference between the two measures provides information about the contribution of scale inefficiency.
We use the VRS results as a first-stage sensitivity check rather than as a separate second-stage outcome. The baseline second-stage analysis focuses on overall efficiency measured by CCR and on the peer-appraisal benchmark measured by Game Cross-efficiency. Heterogeneity across economies is further addressed, although not eliminated, through economy-specific effects and observable structural controls in the panel regressions.
These results should be interpreted as relative frontier measures rather than as absolute rankings of macroeconomic success. The DEA scores are conditional on the selected inputs, outputs, normalization procedure, and returns-to-scale assumption. Therefore, the finding that some developing economies obtain high relative efficiency scores does not imply that they outperform advanced economies in absolute macroeconomic terms. It indicates only that, within this specific multi-objective DEA framework, these economies transform the selected inputs into the selected macroeconomic outcomes more efficiently relative to the empirical frontier. VRS is used only as a first-stage returns-to-scale sensitivity check, whereas Game Cross-efficiency provides the alternative peer-appraisal outcome used in the second-stage analysis.
Appendix A Table A5 further reports rank correlations across alternative DEA specifications.
Because the first-stage scores are estimated against a common intertemporal frontier, pooling does not remove their economy-year structure. Each estimated efficiency score remains indexed by economy and year and can therefore be used as an economy-year outcome in the second-stage panel analysis. The second-stage regressions do not estimate annual frontier shifts or year-specific technical change. Instead, they examine conditional associations between RMB-related exposure and relative macroeconomic performance efficiency measured against a common benchmark.
The efficiency scores are generated outcomes, and the second-stage estimates are therefore interpreted cautiously as reduced-form conditional associations rather than as strict causal effects.
6. Panel Regression Results
Before reporting the panel regressions, we formally assess estimator choice using the
Hausman (
1978) specification test. The null hypothesis is that the country-specific effects are uncorrelated with the regressors, in which case random-effects GLS (RE) is consistent and efficient. Rejection of the null suggests that within-country fixed effects (FE) should be preferred.
Table 3 reports the Hausman test results for the four main specifications.
The test fails to reject the null for the two ERPT equations (CCR–ERPT: χ
2 = 2.89,
p = 0.82; CED–ERPT: χ
2 = 4.32,
p = 0.63), supporting RE-GLS as the baseline estimator for the ERPT specifications. By contrast, the test rejects the null at the 1% level for the two GVC equations (CCR–GVC: χ
2 = 25.74,
p < 0.001; CED–GVC: χ
2 = 26.78,
p < 0.001), indicating that country-specific time-invariant heterogeneity is correlated with the value-added linkage variables. Accordingly, the baseline ERPT regressions reported in
Table 4 are estimated using RE-GLS. Given that CNY/SDR and USD/SDR are identical across economies within a given year (inducing cross-sectional dependence), we report PCSE (
Beck & Katz, 1995) for the ERPT specifications to account for cross-sectional dependence and heteroskedasticity. The GVC regressions reported in
Table 5 are estimated using within-FE models with country-clustered robust standard errors, as the value-added linkage variables exhibit substantial cross-country variation.
6.1. ERPT Channel: Exchange-Rate Exposure and Macroeconomic Performance Efficiency
We examine whether RMB-related exchange-rate exposure is associated with macroeconomic performance efficiency. Efficiency scores (DEA and CED) are regressed on the RMB/SDR rate (CNY), the USD/SDR rate (USD), the domestic currency/SDR rate (X), and controls (foreign exchange reserves, FER; external debt, ED). Following the Hausman test results reported in the estimator-choice discussion above, the ERPT specifications are estimated using random-effects GLS with PCSE (
Beck & Katz, 1995); the GVC specifications in
Section 6.2 are estimated using within fixed effects (FE) with country-clustered robust standard errors.
6.1.1. DEA Results for the ERPT Channel
The DEA-based ERPT results indicate a positive association between the CNY/SDR exchange-rate variable and macroeconomic performance efficiency. Under the baseline PCSE specification, the coefficient is statistically significant (0.0159, p < 0.01), although the estimated effect is economically modest. Additional robustness analyses suggest that statistical significance is sensitive to the treatment of cross-sectional dependence and several alternative specifications.
6.1.2. Cross-Efficiency (CED) Results for the ERPT Channel
The CED-based results in
Table 4 offer a complementary peer-evaluation perspective on the ERPT channel. The estimated CNY coefficient is also positive and statistically significant (coefficient = 0.0140,
p = 0.0141). This consistency across both efficiency benchmarks strengthens the evidence for a positive ERPT association, although the economic magnitude remains modest.
Overall,
Table 4 indicates that the ERPT evidence is consistent across efficiency measures: both CCR-DEA and CED yield positive and statistically significant coefficients for CNY, although the economic magnitude is modest. This consistency suggests that the ERPT association is not merely an artifact of the efficiency benchmark used. However, given the reduced-form nature of our empirical design, we continue to interpret this as a conditional association rather than a stable causal relationship.
6.2. GVC Channel: Value-Added Linkages and Macroeconomic Performance Efficiency
We next test the production-network mechanism using GVC-related value-added measures. Efficiency (DEA/CED) is regressed on domestic value added in gross exports (VAE), China’s value added in gross exports (VAEC) and gross imports (VAIC), and U.S. value added in gross imports (VAIU), with FER and ED as controls. The GVC regressions are estimated on the revised GVC sample, which excludes Pakistan for sample-definition consistency rather than because of missing OECD-TiVA value-added data. The effective common fixed-effects sample contains 333 observations after listwise deletion across all regressors, consistent with
Table 5.
6.2.1. Results with DEA Efficiency
The DEA-based GVC results in
Table 5 show limited support for the GVC channel under the revised fixed-effects specification. The central China-related value-added proxy, VAEC, is negative but statistically insignificant (coefficient = −0.0356,
p = 0.5790), while VAIC is also statistically insignificant (coefficient = 0.0114,
p = 0.8353). Domestic value added in gross exports (VAE) and U.S. value added in gross imports (VAIU) are both statistically insignificant (
p = 0.6912 and
p = 0.2738, respectively).
These results suggest that, under the DEA efficiency measure, China-related value-added linkages do not provide strong confirmatory evidence for the GVC channel. The GVC evidence is therefore best interpreted as suggestive rather than robust.
6.2.2. Results with Cross-Efficiency (CED)
The CED-based GVC results in
Table 5 likewise provide limited support for the GVC channel. Under the fixed-effects specification and the revised 333-observation sample excluding Pakistan, VAEC is negative and statistically insignificant (coefficient = −0.0148,
p = 0.7619). VAIC is also statistically insignificant (coefficient = 0.0083,
p = 0.8460), and neither VAE nor VAIU shows a statistically significant association with CED efficiency.
Together with the DEA-based results reported above, these findings indicate that the GVC channel does not yield robust evidence under either efficiency benchmark. We therefore interpret the GVC results as suggestive rather than confirmatory. China-related value-added linkages may describe the structural environment of RMB-related exposure, but the present evidence does not establish a stable association between China-related GVC linkages and macroeconomic performance efficiency.
7. Robustness Checks
This section evaluates whether the main findings are sensitive to cross-economy dependence, endogeneity and dynamic adjustment, sample-definition choices, normalization assumptions, augmented controls, lagged exposure, two-way fixed effects, and exchange-rate data sources. The robustness exercises are interpreted as diagnostic checks rather than as causal identification strategies. They are used to clarify the scope and limitations of the ERPT and GVC associations reported in the baseline specifications.
7.1. Cross-Sectional Dependence and Baseline Inference
Because CNY/SDR and USD/SDR are common across economies within a given year, residual cross-sectional dependence is an important inferential concern.
Pesaran’s (
2004) CD test rejects cross-sectional independence for the baseline CCR–ERPT residuals (CD = 4.06,
p < 0.001). We therefore report panel-corrected standard errors for the baseline ERPT regressions following
Beck and Katz (
1995). The diagnostic is reported in
Supplementary Table S3.
The diagnostic is used to motivate the variance estimator and does not alter the point estimates. Given the short time dimension and the generated nature of the DEA outcome, the results continue to be interpreted as conditional reduced-form associations.
7.2. Endogeneity and Dynamic Adjustment: System-GMM Evidence
A potential concern is that macroeconomic performance efficiency may itself influence RMB-related exposure and GVC engagement, making contemporaneous regressions vulnerable to reverse causality. We therefore retain CCR-based dynamic panel system-GMM specifications as diagnostic checks, treating CNY in the ERPT equation and VAEC in the GVC equation as endogenous and instrumenting them with their own lags. The models use collapsed instruments based on lags 2–3, with Windmeijer-corrected standard errors. The results are reported in
Appendix A Table A4.
The CCR-based system-GMM results reinforce a cautious interpretation of the baseline findings. In the ERPT equation, the CNY coefficient becomes small and statistically insignificant. In the GVC equation, the VAEC coefficient is positive, but the Hansen J-test rejects the over-identifying restrictions. These estimates are therefore treated as diagnostic evidence on endogeneity and dynamic adjustment rather than as preferred causal estimates.
7.3. Subsample, Sample-Definition, and Persistence Robustness
Table 6 summarizes additional robustness checks based on subsample splits, sample-definition changes, winsorization, and lagged-dependent-variable specifications. First, splitting the sample into 2005–2011 and 2012–2018 shows that the ERPT association is more visible in the later period: the CNY coefficient is positive but statistically insignificant in 2005–2011 (β = 0.0215,
p = 0.1731), but becomes larger and statistically significant in 2012–2018 (β = 0.0181,
p = 0.0054). The later-period result is therefore more precisely estimated, although the coefficient itself is not larger than that of the earlier period.
The GVC results are not driven by the revised sample definition. Including Pakistan in the GVC regression sample or excluding China does not alter the main pattern: the VAEC coefficient remains statistically insignificant. Winsorizing the DEA score also leaves the ERPT result essentially unchanged. However, once a lagged dependent variable is included to account for persistence in efficiency, the CNY coefficient loses statistical significance. Overall, these checks indicate that the ERPT evidence is modest and conditional, while the GVC evidence remains suggestive rather than confirmatory.
7.4. Normalization Sensitivity: Inflation-Target Choice
A further concern is that the DEA output normalization for inflation depends on the choice of an implicit inflation reference point. The baseline specification uses a 2% reference target, consistent with the inflation objectives of major monetary authorities. To assess sensitivity to this assumption, we re-estimate the DEA scores under alternative inflation targets of 0%, 1%, 3%, and 4%, and re-run the baseline ERPT regression for each variant.
Table 7 reports the CNY coefficient across these five normalizations.
The CNY coefficient is statistically significant only under the 2% and 3% targets. Under stricter or looser reference points, the coefficient becomes statistically insignificant. This pattern suggests that the ERPT association is conditional on a low-and-stable inflation reference point rather than robust to all inflation normalizations. We therefore retain the 2% target as the baseline but interpret the result as subject to this normalization boundary condition.
7.5. Augmented Controls: Omitted-Variable Robustness
A potential concern is that omitted variables correlated with both RMB-related exposure and macroeconomic performance efficiency may confound the baseline estimates. To assess this possibility, we sequentially augment the baseline ERPT equation (CCR–ERPT) and GVC equation (CCR–GVC) with three control blocks: trade openness, financial development and gross capital formation, and government effectiveness. We also estimate a fully augmented specification including all controls jointly.
Table 8 reports the key coefficients on CNY and VAEC.
For the ERPT channel, the CNY coefficient remains positive and statistically significant across all augmented-control specifications. Its magnitude varies from 0.0132 to 0.0183, indicating some sensitivity to the included structural controls, but the positive association is not eliminated. For the GVC channel, the VAEC coefficient remains statistically insignificant across all augmented-control specifications. Overall, the augmented-control checks reinforce our interpretation that the ERPT evidence is conditional and economically modest, while the GVC evidence remains suggestive rather than confirmatory.
7.6. Lagged Exposure and Two-Way Fixed Effects
To examine delayed adjustment and potential reverse causality, we re-estimate the baseline specifications using lagged exposure variables. For the ERPT channel, we replace contemporaneous CNY with one-year and two-year lags. For the GVC channel, we replace contemporaneous VAEC with lagged values and further estimate two-way fixed-effects (TWFE) specifications that add year fixed effects to absorb common time trends.
Table 9 reports the key coefficients, while the full results are provided in
Supplementary Table S5.
For the ERPT channel, the one-year lagged CNY coefficient remains positive and statistically significant in the CCR specification, but the two-year lagged coefficient is no longer significant. For the GVC channel, the one-year and two-year lagged VAEC coefficients are negative and statistically insignificant under both the random-effects and two-way fixed-effects specifications. These CCR-based checks suggest limited short-run persistence in the ERPT association and provide no evidence of a delayed GVC association.
7.7. Exchange Rate Source Robustness
A measurement concern is whether the ERPT results depend on the use of year-end exchange rates. Our baseline exchange-rate variables (CNY, USD, and X) are obtained from the World Bank indicator PA.NUS.FCRF, which reports period-average annual exchange rates rather than year-end rates. Therefore, the year-end-rate concern does not apply to the baseline specification. As an additional check, we re-estimate the CCR–ERPT specification using annual average exchange rates constructed from IMF monthly data. Because IMF monthly data are unavailable for Hong Kong, Turkey, and Vietnam over the full sample period, this robustness check uses a restricted sample of 302 observations. For comparability, we also re-estimate the baseline World Bank specification on the same restricted sample.
Table 10 reports a CNY coefficient of 0.0159 in the full-sample World Bank specification, 0.0172 in the restricted-sample World Bank specification, and 0.0171 in the IMF annual average specification. The close agreement between the two restricted-sample estimates indicates that the CCR-based ERPT result is not materially driven by the exchange-rate data source or averaging convention. Full results are reported in
Supplementary Table S6.
8. Conclusions and Implications
This study contributes to the RMB-internationalization literature by shifting the focus from currency scale expansion to macroeconomic performance efficiency. Instead of evaluating RMB internationalization only through reserve volumes, trade shares, or settlement scale, we adopt a multi-objective efficiency perspective that assesses how effectively economies transform key inputs into joint macroeconomic outcomes.
The findings generate three main insights. First, macroeconomic performance efficiency does not mechanically correspond to economic size or income level. Within the DEA framework, several developing economies obtain high relative efficiency scores, while some advanced economies occupy lower positions in the multi-input–multi-output efficiency space. This pattern should be interpreted as a relative frontier result conditional on our specific input–output specification, not as an absolute ranking of macroeconomic success.
Second, the estimated associations differ across the ERPT and GVC proxies. The ERPT channel is positive and economically modest under the baseline specification. Its sign is consistent across the pooled CCR and genuine Game Cross-efficiency benchmarks. The accompanying VRS/BCC analysis indicates how the first-stage efficiency pattern changes when the constant-returns-to-scale assumption is relaxed, but VRS is used as a returns-to-scale sensitivity check rather than as an additional second-stage dependent variable. Statistical inference remains sensitive to specification choices. The evidence is therefore interpreted as a conditional reduced-form association rather than a causal relationship. By contrast, the GVC channel does not yield robust evidence under the revised fixed-effects GVC specifications, augmented controls, or two-way fixed effects. We therefore interpret the GVC evidence as suggestive of production-network relevance rather than as a confirmatory structural channel.
Third, the robustness checks clarify the boundary conditions of the findings. The ERPT association is more visible in the later subperiod and under a low-and-stable inflation reference point, but it remains reduced-form and sensitive to specification choices. The GVC evidence remains sensitive to estimator choice and common time trends. Overall, the results should be interpreted as mechanism-consistent associations rather than causal effects of RMB internationalization.
The policy implications are therefore necessarily qualified. RMB-related exposure should not be treated as an efficiency-enhancing instrument per se. Its macroeconomic relevance appears to depend on the broader structural conditions under which RMB-related settlement, pricing, or financing arrangements operate, including production-network position, financial development, institutional capacity, and macroeconomic stability. For policymakers, the relevant question is not simply whether to increase RMB exposure, but whether the surrounding trade, financial, and institutional conditions allow currency diversification to reduce frictions or improve macroeconomic adjustment.
For multilateral institutions, the findings suggest that conventional indicators such as reserve share, trade volume, or settlement volume may not fully capture the macroeconomic relevance of currency internationalization. A broader evaluation framework should incorporate multi-objective macroeconomic performance, production-network positions, and boundary conditions such as inflation regimes and institutional capacity. At the same time, such an evaluation should distinguish carefully between correlation, mechanism consistency, and causal effects.
These implications are conditional on the reduced-form nature of our empirical strategy and the 2005–2018 data window. The findings should not be interpreted as causal policy multipliers. Rather, they identify conditional associations between RMB-related exposure and macroeconomic performance efficiency under specific structural and macroeconomic conditions. Future research using more direct measures of RMB settlement, invoicing, and holding behavior would be needed to establish stronger causal claims.