Article

Corporate Social Irresponsibility and Market Reactions: An Analysis Based on Investor Sentiment and Investor Attention

School of Shipping Economics and Management, Dalian Maritime University, Dalian 116026, China
*
Author to whom correspondence should be addressed.
Int. J. Financial Stud. 2026, 14(7), 189; https://doi.org/10.3390/ijfs14070189
Submission received: 19 May 2026 / Revised: 8 July 2026 / Accepted: 16 July 2026 / Published: 18 July 2026
(This article belongs to the Collection Corporate Social Responsibility in Finance)

Abstract

Against the backdrop of rising corporate social irresponsibility (CSI) incidents in China’s capital market, this study examines how CSI affects short-window market reactions and through which investor-side mechanisms this effect operates. Using A-share listed companies in Shanghai and Shenzhen from 2017 to 2021, we construct a CSI index adapted to the Chinese institutional setting and employ an event-study framework combined with mediation and moderation models. The results show that CSI is associated with significantly more negative cumulative abnormal returns. Mechanism tests indicate that CSI is negatively associated with investor sentiment, and lower investor sentiment is associated with more negative market reactions, implying a negative indirect path through investor sentiment. Investor attention further conditions this relationship: when investor attention is higher, the negative market reaction to CSI is stronger, although the baseline interaction result should be interpreted cautiously because its significance is marginal. These conclusions are supported by Heckman two-step estimation, alternative sample construction, and alternative event-window tests. Additional analysis shows that prior CSR reputation can mitigate investor punishment after CSI events, suggesting an insurance effect.

1. Introduction

Corporate social irresponsibility (CSI) refers to corporate actions that violate legal or ethical expectations and impose negative externalities on stakeholders, thereby undermining the sustainability of the wider system (Jackson et al., 2014). CSI events can affect non-financial outcomes, including executive turnover (Chiu & Sharfman, 2018), corporate reputation (Nardella et al., 2023; Zasuwa & Wesołowski, 2023), and social performance (Fu, 2022), as well as financial outcomes such as equity financing costs (Becchetti et al., 2023) and stakeholder-related transaction costs (Feng et al., 2022). However, their effect on stock-market performance remains debated.
Studies have shown mixed results. Research on single or multiple concurrent CSI events has found that markets tend to react negatively (Wan & Liu, 2012; Teng & Yang, 2021), with lower investor returns and reduced stock prices following CSI event disclosures (Ma & Xue, 2023; Groening & Kanuri, 2013). Liu and Dong (2018) suggest that CSI disclosures transmit negative signals to the market, adversely affecting stock prices. Conversely, other studies have found no significant stock-market response, including evidence from the Foxconn employee-suicide incidents (Xiao et al., 2010) and environmental penalties (Wu et al., 2022).
The different impacts of CSI on the stock market come more from the reactions of stakeholders. Even when facing identical instances of CSI, stakeholders may react very differently. Some stakeholders may choose to remain loyal to the firm, while others may spread negative information about the firm, and still others may sever ties with the firm (Ferguson & Johnston, 2011). When stakeholders respond differently to CSI, the extent of the stock market’s reaction to CSI also varies (Liu et al., 2022). Additionally, the stock market reaction to CSI is influenced by media framing; negative market reactions are weaker when the media discloses CSI behaviors of multiple firms simultaneously compared to a single firm’s CSI behavior (Liu et al., 2022). Furthermore, prior CSR performance also impacts the stock market reaction to CSI. For companies that have previously had positive CSR performance, the stock market reaction after the CSI incident will also decrease (Y. J. Zhang et al., 2023).
In summary, whether and when CSI significantly affects stock market reactions remains an important question, especially in emerging markets where information asymmetry, retail-investor participation, and regulatory transitions can intensify behavioral responses to negative corporate signals. This study addresses three linked research questions. First, does the severity of CSI lead to more negative cumulative abnormal returns around CSI disclosures? Second, does investor sentiment transmit the effect of CSI on market reactions by converting negative social signals into pessimistic trading behavior? Third, does investor attention strengthen the negative effect of CSI by increasing the salience, diffusion, and interpretation of CSI information? In addition, we examine whether prior CSR reputation buffers the negative reaction to CSI as an insurance-like mechanism.
Investor sentiment influences both individual behavior (Kim & Ryu, 2021; Mahmoudi et al., 2022; Wang et al., 2023) and asset prices (Chi & Zhuang, 2011; Mendel & Shleifer, 2012; Yang & Wu, 2019; X. Zhang & Zhang, 2023). First, investor sentiment is an important determinant of trading behavior: individual investors may follow positive-feedback strategies by buying when markets rise and selling when markets fall (Kim & Ryu, 2021). Mahmoudi et al. (2022) show that firm-level sentiment affects investors’ reactions to corporate announcements. More positive sentiment is also associated with greater market liquidity (Wang et al., 2023), whereas negative sentiment can generate pessimistic trading and adverse price effects (Kaplanski & Levy, 2010).
Second, investor sentiment has a systematic impact on stock prices in the Chinese market (Chi & Zhuang, 2011; Yang & Wu, 2019). Elevated sentiment can induce irrational trading and cause asset prices to deviate from intrinsic value (Mendel & Shleifer, 2012). X. Zhang and Zhang (2023) further show that sentiment interactions alter the way information is incorporated into equilibrium prices. Evidence from China’s online stock forums indicates that sentiment can spread among interacting investors (Shi et al., 2019), while textual sentiment also helps predict stock-market volatility (W. G. Zhang et al., 2021). These findings indicate that investor sentiment is particularly relevant to short-window market reactions.
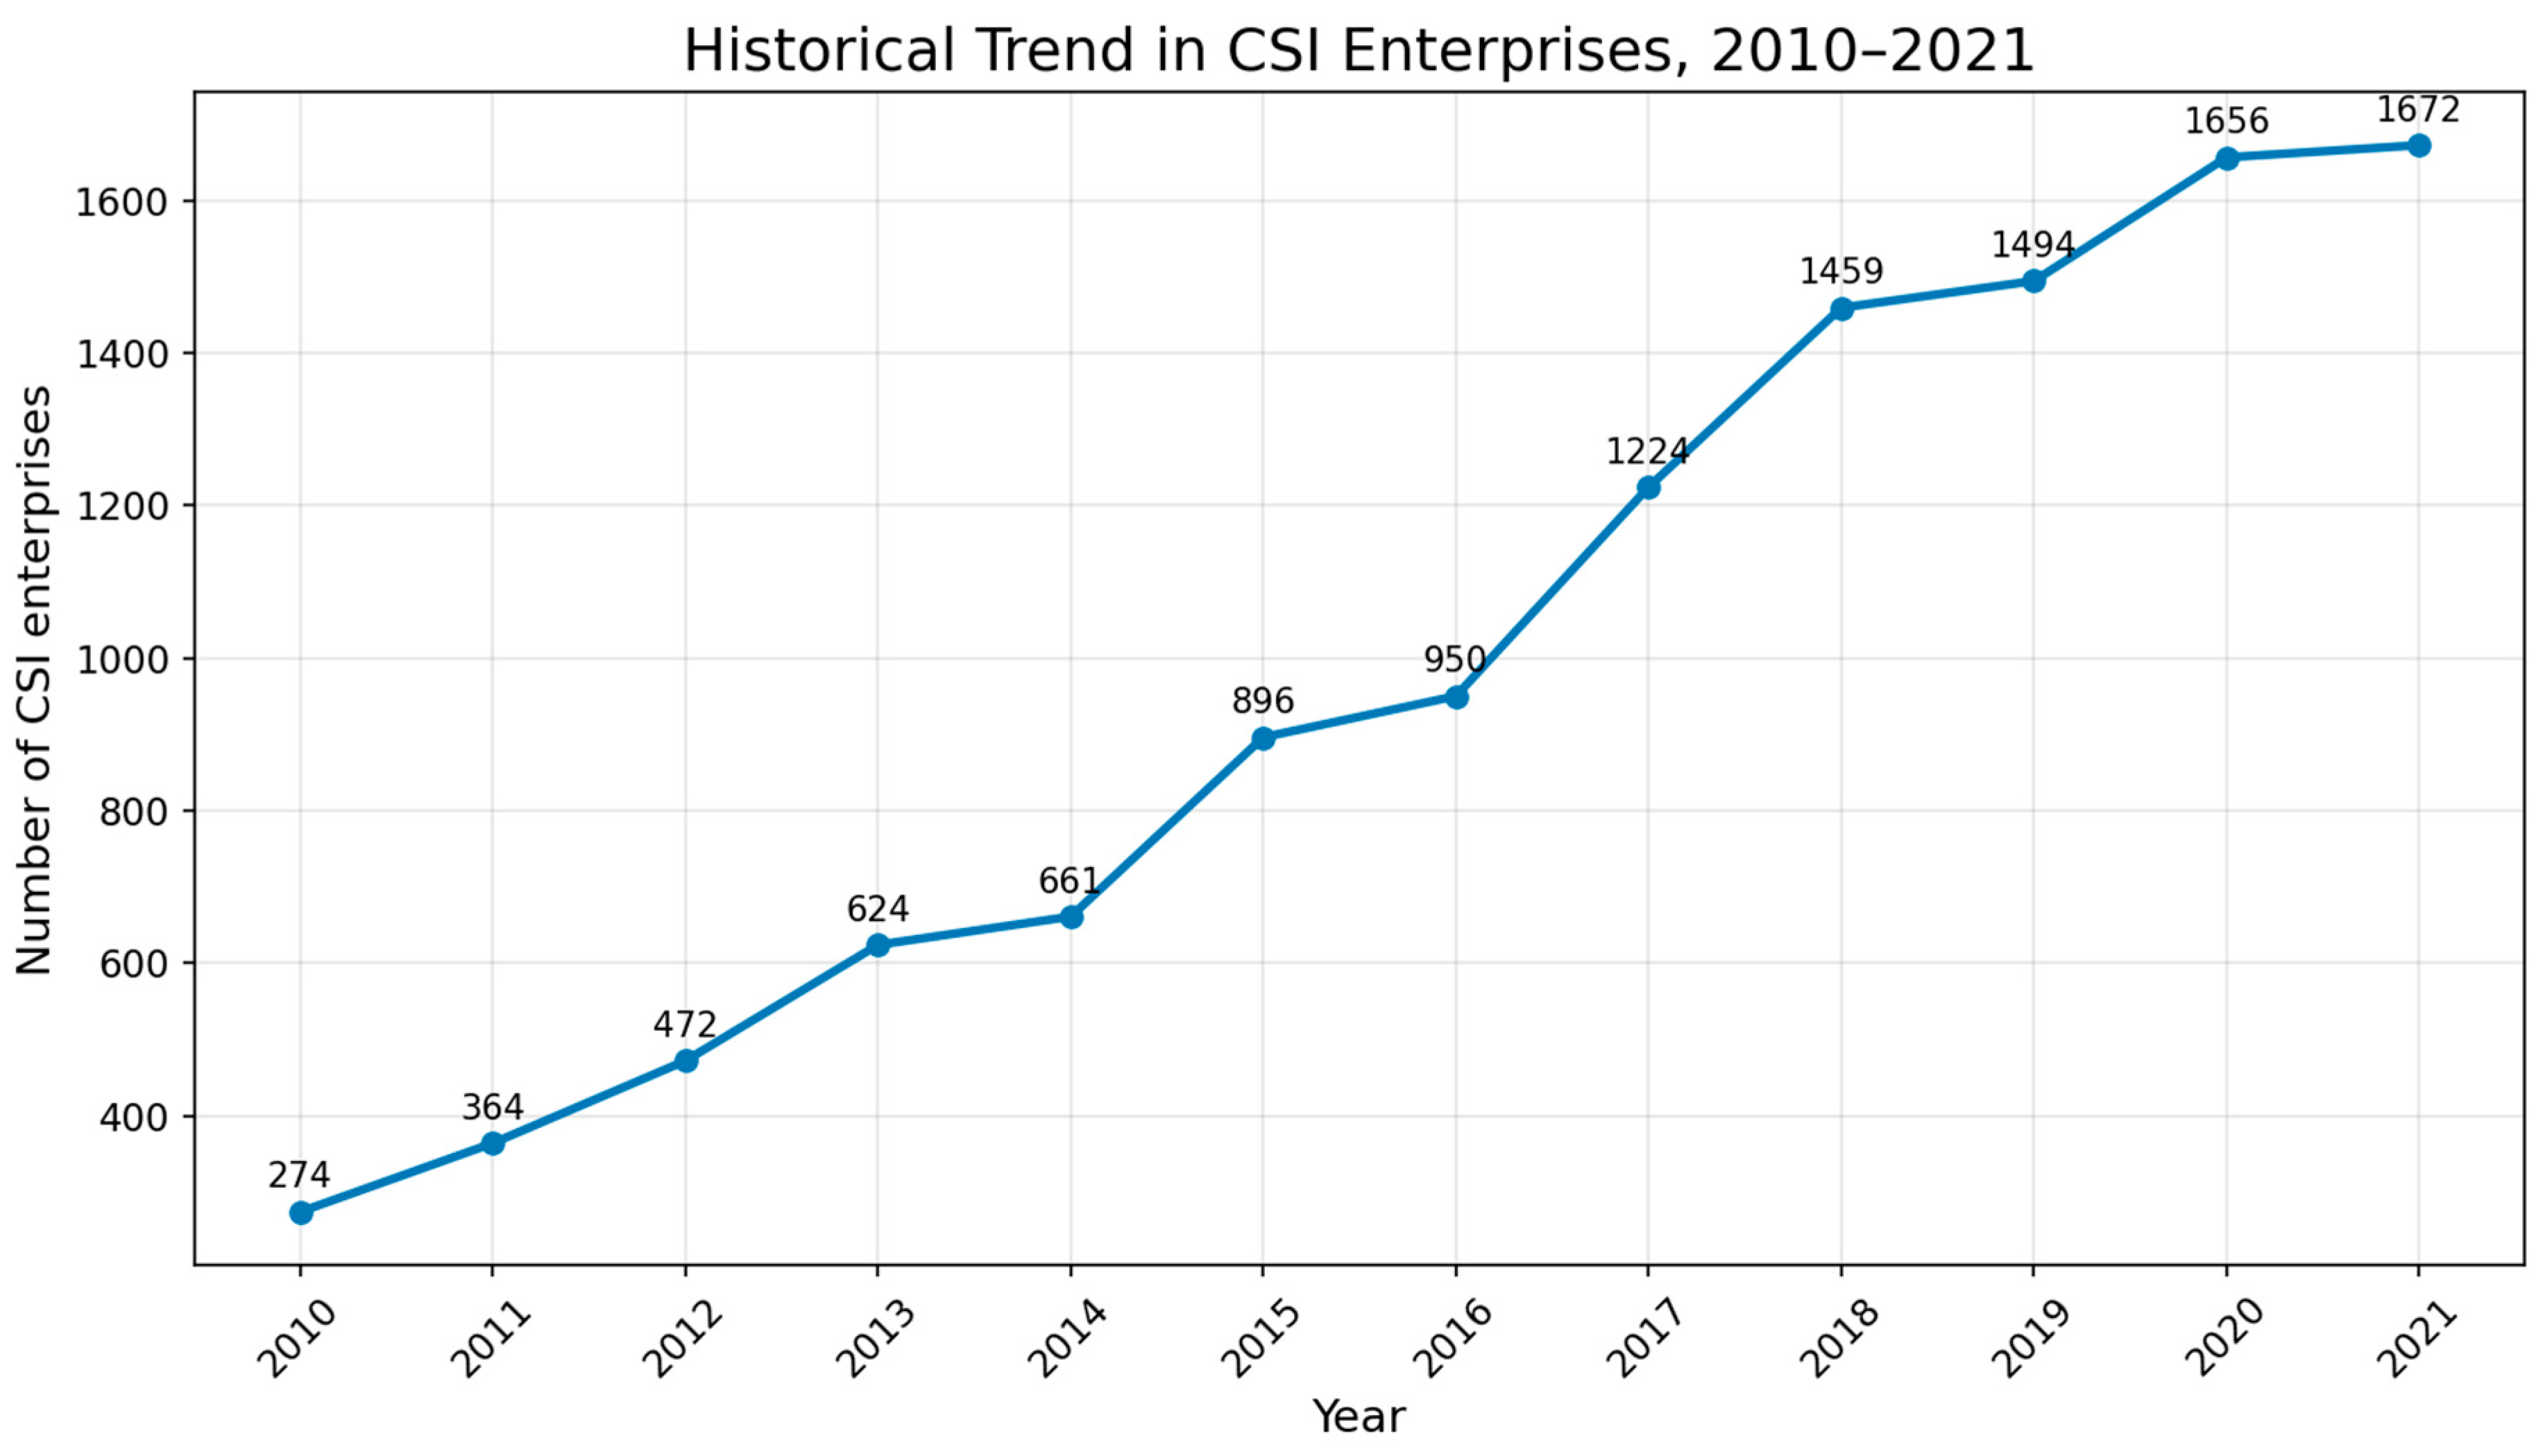
Investor sentiment and investor attention are related but theoretically distinct. Sentiment captures investors’ evaluative affect and trading disposition after processing corporate information, whereas attention captures whether and how strongly investors allocate scarce cognitive resources to a firm or event before information is incorporated into prices. Treating sentiment as a mediator and attention as a moderator therefore reflects two different stages of the investor-response process: attention determines the salience and diffusion of the negative signal, while sentiment represents investors’ appraisal of that signal and their resulting trading propensity. Figure 1 provides descriptive background on the long-term increase in firms associated with CSI incidents.
This study contributes to the CSI and the capital-market literature in four ways. First, it addresses an unresolved gap in prior CSI research: existing findings on market reactions remain mixed and often treat CSI disclosure as a simple event occurrence rather than examining CSI severity. By using a stakeholder-based CSI index, this study shows that more severe CSI is associated with more negative short-window CAR in China’s A-share market. Second, it addresses the investor-mechanism gap by distinguishing investor sentiment as an affective mediation channel from investor attention as a salience-based moderation condition, thereby clarifying when and how investor punishment emerges. Third, it adapts a CSI measurement framework to the Chinese institutional setting by integrating litigation/arbitration, environmental penalty, and violation records across multiple stakeholder groups. Fourth, it extends the CSI–market reaction framework by testing whether prior CSR reputation provides an insurance-like buffer against subsequent investor punishment.
The remainder of this paper is organized as follows: Section 2 presents the theoretical analysis and research hypotheses; Section 3 describes the research design; Section 4 reports the empirical results; Section 5 presents the additional analysis; and Section 6 concludes the study.

2. Theoretical Analysis and Research Hypotheses

2.1. Corporate Social Irresponsibility and Market Reactions

CSI can damage corporate reputation (Reuber & Fischer, 2010) and cause negative market reactions. However, CSI should not be understood merely as the negative counterpart of CSR. CSR and CSI differ in informational content and investor interpretation. Positive CSR signals often build legitimacy gradually, whereas CSI events are salient negative signals that may immediately reveal misconduct, governance failure, regulatory risk, or future cash-flow uncertainty. Because investors are loss-averse and tend to weigh negative information more heavily than positive information, CSI may trigger a stronger and more immediate market response than an equivalent positive CSR signal.
According to organizational stigma theory (Devers et al., 2009), investors may label firms involved in CSI as stigmatized organizations and distance themselves from these firms through selling behavior or withdrawal of investment interest. From a signaling perspective, CSI disclosures convey negative information about managerial ethics, compliance quality, and future penalty risk. From an expectation violation perspective, CSI breaks investors’ prior beliefs about the firm and reduces their willingness to continue holding or purchasing the firm’s shares. These theoretical arguments jointly suggest that the market reaction should become more negative as CSI severity increases.
On the one hand, CSI affects the sentiment of existing investors who hold the company’s stock. CSI violates investors’ expectations of the company and causes investors to sell off their shares. This punitive behavior will lead to a decline in the company’s share price. The more CSIs, the more serious the deviation of investor expectations, which results in harsher punitive behavior of investors and a stronger negative market reaction. Additionally, based on the expectation violation theory framework (Wu et al., 2022), investor reactions in the stock market are related to changes in shareholder expectations. CSI alters shareholders’ expectations of the company’s social responsibility performance. The lowered expectations lead investors to reduce or abandon their investments in the company, which also causes stock price fluctuations.
On the other hand, CSI affects potential investors. The market adheres to values commonly upheld by investors, but CSI contradicts these values, causing investors to no longer endorse the “stigmatized” company. Previously interested investors may also abandon their investment plan, increasing the herd effect of negative market behavior. The more serious CSI is, the more likely the company is to be labeled as “stigmatized,” and the stronger the herd effect among potential investors regarding CSI. Based on the above, we propose the following hypothesis:
H1. 
The severity of corporate social irresponsibility is negatively associated with market reactions; that is, more severe CSI is associated with lower cumulative abnormal returns around CSI disclosures.

2.2. The Mediating Effect of Investor Sentiment

Investor sentiment reflects investors’ affective evaluation of information and their willingness to trade under optimism or pessimism. CSI events are especially likely to activate sentiment because they contain norm-violating and value-threatening information. Negative events such as aviation disasters have been shown to depress investor sentiment and generate fear-driven trading (Kaplanski & Levy, 2010), while firm-level sentiment can shape announcement returns (Mahmoudi et al., 2022). Therefore, investor sentiment provides a theoretically plausible transmission channel from CSI disclosures to stock market reactions.
The mediating logic is grounded in cognitive appraisal theory (Lazarus, 1991). In the primary appraisal stage, investors evaluate whether CSI threatens their financial interests, moral expectations, and beliefs about firm quality. Because CSI implies potential penalties, reputation loss, litigation risk, or governance deficiencies, investors are likely to appraise CSI as harmful and inconsistent with their welfare. In the secondary appraisal stage, investors evaluate how to respond. For existing shareholders, selling shares is a feasible way to avoid further losses and punish the firm; for potential investors, abandoning planned purchases is a way to avoid exposure to a stigmatized firm.
This mechanism also establishes the direction of the indirect path. More severe CSIs should reduce investor sentiment, and lower investor sentiment should lead to more negative cumulative abnormal returns. Thus, the indirect effect of CSI through investor sentiment is expected to be negative. Importantly, we do not predetermine whether the mediation is full or partial; the extent of mediation is an empirical result to be discovered through the mediation test.
To address temporal-ordering concerns, the baseline sentiment measure captures investors’ immediate appraisal on the event day, while the revised empirical design also recommends robustness tests using pre-event or lagged sentiment measures, such as sentiment calculated over the [−3,−1] window before the event day or sentiment on day t − 1. These additional tests help reduce simultaneity concerns by examining whether investor sentiment formed before the price reaction can explain subsequent market responses.
Based on this analysis, we propose the following hypothesis:
H2. 
Corporate social irresponsibility has a negative indirect effect on market reactions through investor sentiment: CSI is expected to reduce investor sentiment, and lower investor sentiment is expected to be associated with lower cumulative abnormal returns.

2.3. The Moderating Effect of Investor Attention

Investor attention is a moderator because it changes the strength with which CSI information is incorporated into prices rather than constituting the affective response itself. Under limited-attention theory, investors cannot process all available information simultaneously and are more likely to trade on information that becomes salient through search, media discussion, or public concern (Odean, 1999; Aboody et al., 2010; Andrei & Hasler, 2015; Li & Zhu, 2011). When a CSI event attracts little attention, the negative signal may be underprocessed, delayed, or ignored by many investors. When attention is high, more investors observe, discuss, and interpret the CSI signal, accelerating information diffusion and price adjustment.
High investor attention can amplify negative reactions through three channels. First, it increases the number of investors exposed to CSI information and therefore broadens potential selling pressure. Second, it reduces information asymmetry by making the negative event easier to verify and compare. Third, it accelerates sentiment contagion in online investor communities, so pessimistic interpretations can spread more quickly. Thus, investor attention is expected to strengthen the negative relationship between CSI severity and market reactions.
Based on this analysis, we propose the following hypothesis:
H3. 
Investor attention negatively moderates the relationship between CSI severity and market reactions; the negative association between CSI and cumulative abnormal returns is stronger when investor attention is higher.

2.4. CSR Reputation as an Insurance Mechanism

Prior CSR reputation can shape how investors attribute CSI events. Research indicates that the relationship between prior CSR and subsequent stakeholder responses depends partly on the overlap between responsible and irresponsible domains and on investors’ interpretation of the violation (Kang & Matsuoka, 2022; D. N. Zhang & Liu, 2022). Firms with stronger CSR reputations may be perceived as having accumulated moral capital and stakeholder trust. When such firms experience CSI, investors may be more likely to interpret the event as temporary, accidental, or less representative of the firm’s underlying character. By contrast, firms with weak CSR reputations may receive less benefit of the doubt, and CSI may be interpreted as evidence of persistent irresponsibility. Therefore, prior CSR reputation may mitigate the negative market reaction to CSI.
H4. 
Prior CSR reputation weakens the negative market reaction to CSI; firms with stronger prior CSR reputation experience less negative cumulative abnormal returns after CSI disclosures.

3. Materials and Methods

3.1. Sample Selection and Data Sources

3.1.1. Sample Selection

Listed companies are more easily monitored by the media, the public, and the government, resulting in greater transparency and more extensive disclosure. Therefore, this study selects A-share listed companies on the Shanghai and Shenzhen stock exchanges from 2017 to 2021 as research samples. We exclude financial firms because their accounting rules, regulatory constraints, leverage structure, and market-risk profiles differ substantially from those of non-financial firms. We also exclude firms marked as Special Treatment (ST) during the event year. In China’s stock exchanges, ST is a risk-warning designation applied to firms with abnormal financial conditions or other serious operational problems; ST firms face trading restrictions and may generate market reactions that are not comparable with those of normal listed firms. Observations with missing stock-return data, investor sentiment data, investor attention data, or control variables are further removed. The screening procedure is summarized in Table 1.

3.1.2. Data Sources

The data used in this study include litigation and arbitration data, environmental penalty data, investor sentiment post data, and Baidu search data, all sourced from the China Research Data Service Platform. Additionally, violation information, stock returns, and other financial data are sourced from the China Stock Market and Accounting Research Database.

3.2. Variable Definition and Measurement

3.2.1. Independent Variable

This study constructs a CSI index by adapting the stakeholder-based corporate social irresponsibility framework used in prior research (Zhong et al., 2021) and drawing on the MSCI KLD 400 index system. The main stakeholders include seven groups: shareholders and creditors, customers, employees, competitors, communities and public relations, government, and the environment. Accordingly, the CSI index contains seven primary indicators, each divided into secondary indicators that capture specific irresponsible behaviors. A score of “1” is assigned when a CSI item is disclosed and “0” otherwise. Scores are accumulated across different items, while each secondary indicator is counted at most once in a firm-year. The specific items are shown in Table 2. A higher CSI index indicates a greater number or severity of CSI behaviors in that year.
Event identification and validation: CSI events are identified from three sources: litigation and arbitration records, environmental penalty records, and corporate violation records. These sources are matched to listed companies by stock code, company abbreviation, and full legal name. Events are coded into the seven stakeholder-related CSI dimensions reported in Table 2 according to the disclosed violation content. Duplicate records referring to the same firm, same event date, and same misconduct description are consolidated to avoid repeated counting. If multiple categories are involved in one event, the event is coded according to the primary stakeholder harmed and, where appropriate, the relevant secondary category. Events with an ambiguous company identity, unclear event date, or insufficient misconduct description are excluded. The annual CSI score accumulates the disclosed CSI items for each firm-year, while each secondary indicator is counted at most once per year to prevent over-weighting repeated disclosure of the same misconduct.
Table 3 and Table 4, respectively, show the sample distribution of CSI incidents by year and industry. As shown in Table 3, the highest number of CSI events occurred in 2019, while the lowest number occurred in 2017. Overall, from 2017 to 2021, CSI incidents have shown a trend of growth, indicating an increasingly widespread social impact.
The samples in this paper cover 18 industry types. As shown in Table 4, except for the excluded financial industry, all other industries are involved, which indicates that CSI incidents have become a norm in various industries. Among them, the industry with the highest incidence of CSI is manufacturing, accounting for 61.69%.

3.2.2. Dependent Variable

The dependent variable in this paper is market reaction, measured by cumulative abnormal returns (CAR). Some firms experience multiple CSI events within the same year. The baseline specification uses the announcement date of the first CSI event in a given firm-year as the event date because the first disclosure is most likely to represent the market’s initial information shock. Subsequent events may be partially anticipated once investors have already updated beliefs about the firm’s irresponsibility, which can create diminishing marginal price reactions. To avoid relying solely on this assumption, the robustness section replaces the first-event specification with a multiple-event specification, thereby testing whether the conclusions are stable when repeated CSI events are retained.
The CSI event date for each company is set as time point 0. A window of seven trading days before and after the event date is defined as the event window (event window = (−7, 7)). If the event occurs on a non-trading day, it is adjusted to the nearest trading day. In this paper, the estimation window period from 110 trading days before the CSI event date to 11 trading days before the event date is adopted (estimation window = (−110, −11)). The expected returns of the stock during the event window are calculated using widely applied market models.
First, based on daily stock returns and market returns in the estimation window, Equation (1) is used to estimate αi and βi for each event stock. In this equation, Ri,t is the actual stock return, and αi + βi Rm,t is the expected return determined by the intercept αi, market-risk coefficient βi, and market return Rm,t.
Ri,t = αi + βi Rm,t + εi,t
After αi and βi are estimated, Equation (2) is used to calculate abnormal returns (AR).
ARi,t = Ri,t − (αi + βi Rm,t)
Equation (3) then calculates cumulative abnormal returns (CAR) for stock i over the period (t1, t2), where t1 and t2 represent the left and right endpoints of the event window.
CAR i ( t 1 , t 2 ) = t = t 1 t 2 A R i , t

3.2.3. Mediating Variable

The mediating variable in this study is investor sentiment (INV_sen). Following Guo et al. (2023) and Antweiler and Frank (2004), we construct a firm-date investor sentiment index from East Money stock-forum posts. East Money is one of the most widely used financial information portals in China, and its stock forums provide high-frequency firm-specific investor discussion. The China Research Data Service Platform classifies posts into positive (P), negative (N), and neutral (Z) sentiment categories. We use the relative balance of positive and negative posts because this measure captures the net tone of investor discussion while controlling for the total discussion volume on the event day. A higher INV_sen indicates more positive investor sentiment, whereas a lower value indicates more pessimistic investor sentiment. Compared with market-wide sentiment proxies, this firm-date measure is better aligned with the event-study design because it captures sentiment toward the specific firm involved in CSI.
INVsen,i,t = (Pi,t − Ni,t)/(Pi,t + Ni,t + Zi,t)
where Pi,t, Ni,t, and Zi,t represent the numbers of positive, negative, and neutral posts, respectively, for company i on day t in the stock forum. INVsen,i,t denotes investor sentiment for company i on day t.

3.2.4. Moderating Variable

The moderating variable is investor attention (INV_att). This study uses the Baidu search index on the day of the CSI event to measure investor attention because Baidu is a dominant search engine in China, and search behavior captures active information acquisition by investors. The Baidu search index is calculated by summing searches using the firm’s stock code (Code), company abbreviation (Shortname), and full company name (Fullname). To reduce skewness and improve comparability, the search index is transformed by taking the natural logarithm after adding one and then centered before the interaction term is constructed. A higher INV_att indicates greater investor attention to the firm around the CSI event.
INVatt,i,t = ln(1 + CodeSearchi,t + ShortnameSearchi,t + FullnameSearchi,t)
where CodeSearchi,t, ShortnameSearchi,t, and FullnameSearchi,t, respectively, denote the Baidu search counts for the stock code, company abbreviation, and full company name of company i on day t of the CSI event. INVatt,i,t represents investor attention for company i on day t.

3.2.5. Control Variables

Drawing on relevant studies on corporate social irresponsibility and market reactions, this paper includes the following firm-level control variables: firm size (Size), firm age (Age), auditor affiliation (Big4), and ownership concentration (Cr1). At the external-market level, the model controls for stock turnover (Tover) and the market confidence index (Isi). The firm-level control variables are lagged by one year so that they reflect pre-event firm characteristics. Industry and year dummy variables are included to control for industry fixed effects and year fixed effects. Table 5 provides detailed definitions of the variables.
The market confidence index (Isi) is written explicitly as follows: Isi_t = 0.634 × NewAccountQ3_t + 0.536 × Turnover_{t − 1} + 0.391 × ConsumerConfidence_{t − 1} + 0.272 × FundDiscount_{t − 1} + 0.079 × IPOCount_t + 0.552 × IPOFirstDayReturn_t, where NewAccountQ3_t is the third quartile of new accounts opened in month t, Turnover_{t − 1} is last month’s market turnover rate, ConsumerConfidence_{t − 1} is last month’s consumer confidence, FundDiscount_{t − 1} is last month’s average closed-end fund discount rate, IPOCount_t is the number of IPOs in the current month, and IPOFirstDayReturn_t is the average first-day return of IPO stocks in the current month (Wei et al., 2014).

3.3. Model Construction

3.3.1. Main-Effects Model

To examine the relationship between CSI and market reactions, the following model (6) is established:
CARi,t = β0 + β1 CSIi,t + β2 Controli,t−1 + Industry + Year + εi,t
where
Controli,t−1 = {Sizei,t−1, Toveri,t, Big4i,t−1, Cr1i,t−1, Agei,t−1, Isit}

3.3.2. Mediation Effects Model

To verify the mediating role of investor sentiment in the impact of CSI on market reactions, the mediation effects models (8) and (9) are constructed:
INVsen,i,t = β0 + β1 CSIi,t + β2 Controli,t−1 + Industry + Year + εi,t
CARi,t = β0 + β1 CSIi,t + β2 INVsen,i,t + β3 Controli,t−1 + Industry + Year + εi,t

3.3.3. Moderation Effects Model

To verify the moderating role of investor attention in the impact of corporate social irresponsibility on market reactions, this study adds the interaction term between CSI and investor attention (CSI × INV_att) to Equation (6) and constructs the moderation effects models (10) and (11):
CARi,t = β0 + β1 CSIi,t + β2 INVatt,i,t + β3 CSIi,t × INVatt,i,t + β4 Controli,t−1 + Industry + Year + εi,t
The interaction term CSIi,t × INVatt,i,t is constructed after centering INVatt,i,t.

4. Results

4.1. Market Reactions Examination

The cross-sectional T statistic is used to test the significance of the abnormal return (AR). The test results of AR are shown in Table 6. The mean values of AR on the day of and the day after the announcement of CSI events are significantly negative at the 1% level, indicating that CSI events can trigger negative market reactions within a very short period of time. The mean values of AR on the 5th, 6th, and 7th days after the announcement of CSI events are also significantly negative, which may be attributed to subsequent media coverage attracting investor attention, leading to negative market reactions towards the relevant CSI events.
The test results of cumulative abnormal returns (CAR) are presented in Table 7. The mean values of CAR for the 10 event windows ((−1, 1), (−3, 3), (−3, 0), (0, 3), (−5, 5), (−5, 0), (0, 5), (0, 7), (−7, 0), and (−7, 7)) are all significantly negative at the 1% level, further demonstrating the negative market reactions to CSI.

4.2. Descriptive Statistics

The descriptive statistics of each variable are presented in Table 8. CSI ranges from 1 to 16, with a mean of 1.767 and a median of 1.000, indicating that most firm-years involve relatively few CSI items but that a small number of firms experience more severe or repeated irresponsible behaviors. CAR has a negative mean (−0.012) and median (−0.018), suggesting that the market reaction to CSI is predominantly negative. The investor sentiment variable ranges from −1.000 to 1.000, with a mean of 0.092 and a median of 0.083. Although the average tone of stock-forum discussion is slightly positive, the wide range indicates substantial heterogeneity in investor affect across CSI events. Investor attention has a mean close to zero (0.007), a median of 0.095, and a relatively large standard deviation (1.335), implying that some CSI events attract substantially more search activity than others. These distributions support the need to analyze sentiment and attention explicitly rather than treating market reactions as homogeneous. To reduce the influence of outliers, all continuous variables are winsorized at the 1st and 99th percentiles before regression estimation; dummy variables are not winsorized.

4.3. Correlation Analysis

The Pearson correlation coefficients are presented in the lower left of Table 9, while the Spearman correlation coefficients are displayed in the upper right. Pairwise correlations are all below 0.500. To avoid ambiguity about the source of the multicollinearity diagnostics, Table 10 reports VIFs for the non-interaction regressors used in the baseline main-effect and mediation specifications, corresponding to columns (1)–(3) of Table 11 and excluding industry and year fixed-effect dummies. These VIFs should not be interpreted as diagnostics for the centered moderation specification in column (4), because that model additionally includes the product term CSI × INV_att. The moderation-model VIFs should therefore be assessed separately using the full regressor set that includes the centered interaction term. The largest reported non-interaction VIF is 1.339 for firm size, and all reported non-interaction VIFs are well below the conventional threshold of 10.
The Pearson and Spearman correlation coefficients between CSI and market reactions are −0.046 and −0.035, respectively, both significantly negatively correlated at the 10% level. This preliminary confirms hypothesis H1, suggesting that the more severe the corporate social irresponsibility, the more negative the market reactions. Additionally, the Spearman and Pearson correlation coefficients between CSI and investor sentiment are −0.066 and −0.073, respectively, both significantly negatively correlated at the 10% level. The Spearman and Pearson correlation coefficients between investor sentiment and market reactions are 0.146 and 0.199, respectively, both significantly positively correlated at the 10% level, which is consistent with hypothesis H2.

4.4. Regression Analysis

4.4.1. Test of the Main-Effect Model

The regression analysis results of the market reactions to CSI during the pre- and post-event window of (−7, 7) days are presented in Table 11, column (1). The coefficient of CSI is significantly negative at the 1% level (β = −0.016, p < 0.01), which indicates that a one-unit increase in CSI severity is associated with an additional 1.6 percentage-point decline in CAR over the event window. This magnitude is economically meaningful: for a firm with a market capitalization of RMB 10 billion, a 1.6 percentage-point loss corresponds to approximately RMB 160 million in market value. Therefore, CSI is not only statistically significant but also economically relevant, supporting H1.

4.4.2. Mediation Model Testing

From column (2) of Table 11, the coefficient of CSI on investor sentiment (INV_sen) is significantly negative at the 1% level, indicating that more severe CSI is associated with lower investor sentiment. From column (3), after investor sentiment is added to the market-reaction model, INV_sen is significantly positively associated with CAR at the 1% level (β = 0.073, p < 0.01), while CSI remains significantly negatively associated with CAR. The estimated signs are consistent with the predicted negative indirect path: CSI reduces investor sentiment, and lower investor sentiment is associated with more negative CAR. The persistence of the direct CSI coefficient indicates that sentiment explains part, but not all, of the CSI–market reaction relationship; however, the hypothesis itself concerns the direction of the indirect effect rather than predetermining a partial mediation outcome.
To further test the mediation effect, this study conducted bootstrap tests on the sample with 1000 sampling iterations. The results, as shown in Table 12, indicate an indirect effect of −0.0028, a direct effect of −0.0135, a total effect of −0.0163, and a proportion of the mediation effect of 17.18%, further confirming hypothesis H2.

4.4.3. Moderation Effect Model Testing

Based on the main-effects model, the interaction term between investor attention (INV_att) and CSI (CSI × INV_att) is added. The regression results are shown in column (4) of Table 11. The coefficient of CSI × INV_att is negative and significant at the 10% level (β = −0.009, p < 0.1), suggesting that higher investor attention strengthens the negative relationship between CSI and market reactions. Because this baseline interaction is only marginally significant, the moderation evidence should be interpreted as suggestive rather than strong in the baseline model. The robustness tests reported below provide additional evidence that the moderation pattern is not driven solely by the baseline specification.

4.5. Robustness Check

4.5.1. Heckman Two-Step Method

To address potential endogeneity arising from sample-selection bias, this study employs a Heckman two-step model. Prior research suggests that Confucian culture promotes corporate social responsibility practices (Zou & Li, 2022). We therefore use the inverse of the number of Confucius temples, schools, and academies in the province where the firm is registered as an exclusion variable. This variable is labeled the Confucian culture atmosphere (Conf); a higher value indicates weaker local Confucian cultural influence. The exclusion restriction assumes that this cultural measure affects the likelihood of relatively high CSI but does not directly affect firms’ short-window cumulative abnormal returns.
Following Zhai et al. (2022), the first-stage dependent variable is High_CSI, which equals one when a firm’s CSI exceeds the annual industry median and zero otherwise. The first-stage controls include ownership concentration among the ten largest shareholders (H10), leverage (Lev), ownership type (State), and industry and year fixed effects. The inverse Mills ratio (IMR) obtained from the first-stage model is then included in the second-stage regressions. As shown in Table 13, Conf is significantly positive in the first-stage regression (β = 0.389, p < 0.05), supporting the relevance of the exclusion variable. The IMR coefficient is not statistically significant, suggesting that severe sample-selection bias is not evident. In the second-stage regressions reported in Table 14, the CSI coefficients remain significantly negative, investor sentiment remains significantly positive, and the CSI × INV_att interaction remains significantly negative. These results support H1–H3 and confirm the robustness of the baseline findings.

4.5.2. Replacement of Samples

Replacing the samples, where only the first CSI event date of a firm per year is considered, with samples that include multiple CSI event dates per year, the regression results are shown in Table 15, columns (1), (2), (3) and (4). The coefficients for CSI remain significantly negative (β = −0.022, p < 0.01; β = −0.050, p < 0.01; β = −0.018, p < 0.01; β = −0.021, p < 0.01). The coefficients of investor sentiment (INV_sen) and the interaction term (CSI × INV_att) are significantly positive (β = 0.082, p < 0.01) and significantly negative (β = −0.015, p < 0.01), respectively. These results support the original hypotheses H1, H2, and H3, indicating that the original conclusions are robust.

4.5.3. Replacement of Dependent Variable

Given the sensitivity of event-study methodology to the time window, results may vary due to different time windows. We change the market-reaction (CAR) window from (−7, 7) to (−1, 1), obtaining the variable CAR2. Regressions are conducted again, as shown in Table 16, columns (1), (2), (3), and (4). The coefficients for CSI remain significantly negative (β = −0.006, p < 0.05; β = −0.038, p < 0.01; β = −0.004, p < 0.1; β = −0.006, p < 0.05). The coefficients for investor sentiment (INV_sen) and the interaction term (CSI × INV_att) are significantly positive (β = 0.047, p < 0.01) and significantly negative (β = −0.006, p < 0.05). These results support the original hypotheses H1, H2, and H3, indicating that the conclusions remain robust.

5. Additional Analysis: CSR Reputation Insurance Effect

Consistent with H4, prior CSR reputation may influence how investors interpret CSI events (Afrin et al., 2022). A favorable CSR reputation can create moral capital and stakeholder trust, making investors more likely to attribute CSI to temporary or accidental causes rather than persistent irresponsibility. Therefore, CSR reputation is not treated as an unrelated appendix but as an extension of the main investor-punishment framework: sentiment and attention explain how investors punish CSI, while CSR reputation explains when such punishment may be mitigated.
To test this argument, the study compares cumulative abnormal returns (CAR) across CSR-reputation groups and conducts multivariate regression analysis. Firms are divided into high- and low-CSR groups according to whether their prior-year CSR score is at or above the industry-year median. The indicator dummyCSR equals one for the high-CSR group and zero otherwise. Table 17 compares mean CAR across ten event windows. In every window, the high-CSR group has a significantly higher (less negative) mean CAR than the low-CSR group. For the (−7, 7), (−5, 5), and (0, 7) windows, the absolute mean differences are 0.014, 0.013, and 0.010, respectively, all significant at the 1% level. These results indicate that firms with stronger prior CSR reputations experience smaller stock-price declines following CSI events, consistent with an insurance effect.
Second, to further validate the insurance effect of CSR reputation, we regressed CSR reputation (dummyCSR) on CAR. The results, shown in Table 18, indicate that the coefficient for dummyCSR is significantly positive at the 1% statistical level (β = 0.013, p < 0.01). This provides strong evidence supporting the insurance effect of CSR reputation.

6. Conclusions

This paper examines the impact of CSI on market reactions and the roles of investor sentiment, investor attention, and CSR reputation. The results show that average cumulative abnormal returns around CSI announcements are significantly negative, indicating that investors punish irresponsible corporate behavior. Regression results further show that more severe CSI is associated with more negative CAR. Mechanism tests indicate a negative indirect path through investor sentiment: CSI reduces investor sentiment, and lower sentiment is associated with lower CAR. Investor attention strengthens the negative relationship between CSI and market reactions, although the baseline interaction result is marginal and should be interpreted cautiously. Additional analysis shows that prior CSR reputation can mitigate negative investor reactions, supporting an insurance-effect interpretation.
These findings are consistent with prior studies showing negative market reactions to corporate misconduct and negative social events (Groening & Kanuri, 2013; Teng & Yang, 2021; Liu et al., 2022). They also help explain why some prior studies find weak or insignificant reactions: market responses depend not only on the occurrence of CSI but also on whether investors notice the event, how they appraise it emotionally, and whether the firm has accumulated reputational capital before the event. In emerging markets with substantial retail-investor participation, investor sentiment and attention are therefore central to understanding the capital-market consequences of CSI.
This study has several limitations. First, although the event-study design captures short-window reactions, future research can further distinguish between immediate and delayed responses. Second, the baseline sentiment measure is constructed on the event day; future studies should use lagged sentiment and intraday data to strengthen causal ordering. Third, the sample period includes market disruptions such as trade-war tensions and COVID-19. Although year fixed effects partially address this concern, future research can conduct more detailed market-state analyses using longer post-pandemic samples. Finally, this study focuses on investor-side external governance; future research could incorporate internal governance mechanisms, such as board oversight, managerial incentives, and compliance systems.


Author Contributions

Conceptualization, X.T.; methodology, X.T.; software, R.W.; data curation, R.W.; investigation, X.T.; validation, R.W. and R.L.; formal analysis, R.W.; supervision, X.T.; funding acquisition, X.T.; visualization, R.W.; project administration, X.T.; resources, X.T.; writing—original draft, R.W.; writing—review and editing, X.T. and R.L. All authors have read and agreed to the published version of the manuscript.

Funding

This research was funded by the General Project of the National Social Science Fund (Research on the Policy System of Blue Financial Public Goods Supply under the Strategy of Marine Economic Power); grant number: 23BJY096.

Institutional Review Board Statement

Not applicable.

Informed Consent Statement

Not applicable.

Data Availability Statement

The data presented in this study are available on request from the corresponding author.

Conflicts of Interest

The authors declare no conflicts of interest. The funders had no role in the design of the study; in the collection, analyses, or interpretation of data; in the writing of the manuscript; or in the decision to publish the results.

Abbreviations

The following abbreviations are used in this manuscript:
CSICorporate Social Irresponsibility
CSRCorporate Social Responsibility
CARCumulative Abnormal Return
INV_senInvestor Sentiment
INV_attInvestor Attention
ARAbnormal Return
STSpecial Treatment

References

  1. Aboody, D., Lehavy, R., & Trueman, B. (2010). Limited attention and the earnings announcement returns of past stock market winners. Review of Accounting Studies, 15(2), 317–344. [Google Scholar]
  2. Afrin, R., Peng, N., & Bowen, F. (2022). The wealth effect of corporate water actions: How past corporate responsibility and irresponsibility influence stock market reactions. Journal of Business Ethics, 180(1), 105–124. [Google Scholar]
  3. Andrei, D., & Hasler, M. (2015). Investor attention and stock market volatility. The Review of Financial Studies, 28(1), 33–72. [Google Scholar]
  4. Antweiler, W., & Frank, M. Z. (2004). Is all that talk just noise? The information content of internet stock message boards. The Journal of Finance, 59(3), 1259–1294. [Google Scholar] [CrossRef]
  5. Becchetti, L., Cucinelli, D., Ielasi, F., & Rossolini, M. (2023). Corporate social irresponsibility: The relationship between ESG misconduct and the cost of equity. International Review of Financial Analysis, 89, 102833. [Google Scholar] [CrossRef]
  6. Chi, L. X., & Zhuang, X. T. (2011). The impact of investor sentiment on stock returns in China: A study based on panel data. Management Review, 23(6), 41–48. (In Chinese) [Google Scholar]
  7. Chiu, S., & Sharfman, M. (2018). Corporate social irresponsibility and executive succession: An empirical examination. Journal of Business Ethics, 149(3), 707–723. [Google Scholar]
  8. Devers, C. E., Dewett, T., Mishina, Y., & Belsito, C. A. (2009). A general theory of organizational stigma. Organization Science, 20(1), 154–171. [Google Scholar] [CrossRef]
  9. Feng, T., Yang, F., Tan, B., & Wu, J. (2022). Corporate social irresponsibility punishments from stakeholders—Evidence from China. Sustainability, 14(8), 4678. [Google Scholar] [CrossRef]
  10. Ferguson, J. L., & Johnston, W. J. (2011). Customer response to dissatisfaction: A synthesis of literature and conceptual framework. Industrial Marketing Management, 40(1), 118–127. [Google Scholar] [CrossRef]
  11. Fu, L. (2022). Why bad news can be good news: The signaling feedback effect of negative media coverage of corporate irresponsibility. Organization & Environment, 36(1), 98–125. [Google Scholar] [CrossRef]
  12. Groening, C., & Kanuri, V. K. (2013). Investor reaction to positive and negative corporate social events. Journal of Business Research, 66(10), 1852–1860. [Google Scholar] [CrossRef]
  13. Guo, F., Lyu, X. L., Lin, Z. Y., & Gong, Z. Q. (2023). Collateral damage: Social media connections of listed companies and stock price spillover effects—An event study based on Chinese regulatory penalties. Journal of Management Sciences in China, 26(4), 111–131. (In Chinese) [Google Scholar]
  14. Jackson, G., Brammer, S., Karpoff, J. M., Lange, D., Zavyalova, A., Harrington, B., Partnoy, F., King, B. G., & Deephouse, D. L. (2014). Grey areas: Irresponsible corporations and reputational dynamics. Socio-Economic Review, 12(1), 153–218. [Google Scholar] [CrossRef]
  15. Kang, T., & Matsuoka, H. (2022). The impact of CSR-CSI domain overlap on attitude toward the sponsor. Sport Marketing Quarterly, 31(1), 33–47. [Google Scholar] [CrossRef]
  16. Kaplanski, G., & Levy, H. (2010). Sentiment and stock prices: The case of aviation disasters. Journal of Financial Economics, 95(2), 174–201. [Google Scholar] [CrossRef]
  17. Kim, K., & Ryu, D. (2021). Does sentiment determine investor trading behaviour? Applied Economics Letters, 28(10), 811–816. [Google Scholar]
  18. Lazarus, R. S. (1991). Emotion and adaptation. Oxford University Press. [Google Scholar]
  19. Li, X. H., & Zhu, H. J. (2011). Investors’ limited attention and information interpretation. Journal of Financial Research, (8), 128–142. (In Chinese) [Google Scholar]
  20. Liu, C., Wang, S. L., & Li, D. (2022). Hidden in a group? Market reactions to multi-violator corporate social irresponsibility disclosures. Strategic Management Journal, 43(1), 160–179. [Google Scholar]
  21. Liu, F. F., & Dong, B. Y. (2018). Market reaction to the disclosure of corporate social responsibility irresponsibility information. Communication of Finance and Accounting, (18), 60–65. (In Chinese) [Google Scholar]
  22. Ma, Y., & Xue, L. (2023). Corporate social irresponsibility: A contingent social media crisis management perspective. Management Decision, 61(12), 3717–3738. [Google Scholar] [CrossRef]
  23. Mahmoudi, N., Docherty, P., & Melia, A. (2022). Firm-level investor sentiment and corporate announcement returns. Journal of Banking & Finance, 144, 106586. [Google Scholar] [CrossRef]
  24. Mendel, B., & Shleifer, A. (2012). Chasing noise. Journal of Financial Economics, 104(2), 303–320. [Google Scholar] [CrossRef]
  25. Nardella, G., Brammer, S., & Surdu, I. (2023). The social regulation of corporate social irresponsibility: Reviewing the contribution of corporate reputation. International Journal of Management Reviews, 25(1), 200–229. [Google Scholar]
  26. Odean, T. (1999). Do investors trade too much? American Economic Review, 89(5), 1279–1298. [Google Scholar] [CrossRef]
  27. Reuber, A. R., & Fischer, E. (2010). Organizations behaving badly: When are discreditable actions likely to damage organizational reputation? Journal of Business Ethics, 93(1), 39–50. [Google Scholar]
  28. Shi, Y., Tang, Y. R., & Long, W. (2019). Sentiment contagion analysis of interacting investors: Evidence from China’s stock forum. Physica A-Statistical Mechanics and Its Applications, 523, 246–259. [Google Scholar] [CrossRef]
  29. Teng, C., & Yang, J. J. (2021). Media exposure on corporate social irresponsibility and firm performance. Pacific-Basin Finance Journal, 68, 101604. [Google Scholar] [CrossRef]
  30. Wan, S. Y., & Liu, Z. Y. (2012). Market reaction to the disclosure of social responsibility defects in cross-listed companies: A case study of Zijin mining’s sudden leakage environmental accident. China Population, Resources and Environment, 22(1), 62–69. (In Chinese) [Google Scholar]
  31. Wang, S. H., Yi, X. J., & Song, M. L. (2023). The interrelationship of air quality, investor sentiment, and stock market liquidity: A review of China. Environment Development and Sustainability, 25(10), 10955–10973. [Google Scholar] [CrossRef]
  32. Wei, X. J., Xia, W. L., & Sun, T. T. (2014). Measuring investor sentiment in the a-share market based on the BW model. Management Observer, (33), 71–73. (In Chinese) [Google Scholar]
  33. Wu, H., Feng, T., Jiang, W., & Kong, T. (2022). Environmental penalties, investor attention and stock market reaction: Moderating roles of air pollution and industry saliency. International Journal of Environmental Research and Public Health, 19(5), 2660. [Google Scholar] [CrossRef] [PubMed]
  34. Xiao, H. J., Zhang, J. S., & Zeng, Y. M. (2010). Disciplinary effect of capital market on corporate social responsibility incidents: A study based on the employee suicide incidents at Foxconn. China Industrial Economics, (8), 11–228. (In Chinese) [Google Scholar]
  35. Yang, C., & Wu, H. (2019). Chasing investor sentiment in stock market. The North American Journal of Economics and Finance, 50, 100975. [Google Scholar] [CrossRef]
  36. Zasuwa, G., & Wesołowski, G. (2023). How do irresponsibility attributions affect organisational reputation? Evidence from the banking industry. International Journal of Bank Marketing, 42, 1370–1387. [Google Scholar] [CrossRef]
  37. Zhai, S. B., Cheng, Y. T., Xu, H. R., Tong, L. J., & Cao, L. (2022). Media attention and corporate ESG information disclosure quality. Accounting Research, (8), 59–71. (In Chinese) [Google Scholar]
  38. Zhang, D. N., & Liu, C. L. (2022). The impact of corporate social responsibility level on investors’ market reaction under violation incidents. Chinese Journal of Management, 19(9), 1288–1296. (In Chinese) [Google Scholar]
  39. Zhang, W. G., Gong, X., Wang, C., & Ye, X. (2021). Predicting stock market volatility based on textual sentiment: A nonlinear analysis. Journal of Forecasting, 40(8), 1479–1500. [Google Scholar] [CrossRef]
  40. Zhang, X., & Zhang, W. (2023). Information asymmetry, sentiment interactions, and asset price. The North American Journal of Economics and Finance, 67, 101920. [Google Scholar] [CrossRef]
  41. Zhang, Y. J., Zhao, Y. X., Gao, Y., & Xiong, X. (2023). Does the introduction of concept stocks improve the pricing efficiency of China’s stock market? Taking COVID-19 concept stocks as an example. Systems Engineering, 41(2), 109–124. (In Chinese) [Google Scholar]
  42. Zhong, P., Wu, T., & Li, X. (2021). An empirical study on the relationship among corporate social responsibility report, CSR irresponsibility and financial performance of listed companies. Forecasting, 40(1), 17–23. (In Chinese) [Google Scholar] [CrossRef]
  43. Zou, P., & Li, G. C. (2022). Can Confucian culture promote corporate social responsibility? Economic Review, (2), 154–170. (In Chinese) [Google Scholar]
Figure 1. Historical trend in the number of CSI enterprises, 2010–2021. Note: This figure provides background evidence on the long-term increase in CSI enterprises. The empirical tests in this study use the 2017–2021 A-share sample described in Section 3.
Ijfs 14 00189 g001
Table 1. Sample-selection procedure and exclusion criteria.
Observations Retained/ExcludedSample-Selection CriterionStep
4213 event observationsNon-financial, non-ST A-share CSI events (2017–2021)1
987 observations excludedIncomplete sentiment, attention, controls, or event-window data2
3226 observationsBaseline regression sample3
Note: The initial CSI event pool is based on litigation/arbitration, environmental-penalty, and corporate-violation records from the databases described in Section 3.1.2.
Table 2. Specific CSI items and the structure of the CSI index.
Primary IndicatorsSecondary IndicatorsItems
CSI indexShareholders and creditorsFraudFictitious profits; false assets; fraudulent listing
Information disclosureMisrepresentation; delayed disclosure; major omission; incorrect disclosure
Regulatory violationsIllegal investment; misuse of funds; asset appropriation; insider trading; stock manipulation; unauthorized guarantees; general accounting misdeeds
CustomersProduct issuesQuality problems
Partner disputesPayment default, discrimination, fraud, or unfair treatment
EmployeesLabor disputesWage arrears; unpaid severance
CompetitorsInfringementsViolation of reputation, trademark, copyright, patent, trade secret
Antitrust litigationFailure to disclose monopoly; monopoly agreements
GovernmentTax issuesTax evasion; fraudulent tax rebates, fake invoices
Communities and public relationsDonationsDelayed donation disclosure; incomplete impact disclosure; unauthorized pre-tax deductions
EnvironmentPollutionNon-compliant pollutant emissions
Land useIllegal grassland use; damage to farmland
Hazardous wasteIllegal waste sales; untimely disposal; Lacking safety labels; safety measure neglect; chemical accidents
Production and regulationNon-compliant production; fake environmental labels; incomplete environmental information; unauthorized production start; improper monitoring setup
Table 3. Yearly distribution of CSI events in sample firms.
YearFrequencies%Cumulative %
2017178514.2914.29
2018266221.3035.59
2019270521.6557.24
2020263921.1278.36
2021270421.64100.00
Total12,495100.00
Table 4. Industry distribution of CSI events in sample firms.
IndustryIndustry CodeFrequency%Cumulative %
Agriculture, Forestry, Animal Husbandry, and FisheryA1731.381.38
MiningB3262.613.99
ManufacturingC770861.6965.68
Electricity, Heat, Gas, and Water Production and SupplyD2652.1267.80
ConstructionE4413.5371.33
Wholesale and RetailF6425.1476.47
Transportation, Storage, and Postal ServicesG3182.5579.02
Accommodation and CateringH300.2479.26
Information Transmission, Software, and IT ServicesI11659.3288.58
Real EstateK3362.6991.27
Leasing and Business ServicesL3002.4093.67
Scientific Research and Technical ServicesM1441.1594.82
Water Conservancy, Environment, and Public Facility ManagementN1901.5296.34
Resident Services, Repairs, and Other ServicesO30.0296.37
EducationP250.2096.57
Health and Social WorkQ630.5097.07
Culture, Sports, and EntertainmentR2712.1799.24
ComprehensiveS950.76100.00
Total 12,495100.00
Table 5. Variable definitions.
Variable TypeVariableVariable SymbolDefinitions
Dependent variableMarket ReactionCARCumulative abnormal return, calculated as described above.
Independent variableCorporate Social IrresponsibilityCSICumulative Corporate Social Irresponsibility behavior, specific items listed in Table 2.
Mediating variableInvestor SentimentINV_senThe difference between the number of positive and negative posts in stock forums on the event day, divided by the total number of posts that day.
Moderating variableInvestor AttentionINV_attThe sum of Baidu search counts for company-related keywords on the event day, logged after adding one.
Control variablesFirm SizeSizeNatural log of total assets at year-end.
Stock TurnoverToverSum of daily turnover rates (circulating shares) in the event month.
AuditorBig4Assigned 1 if the auditor is from a Big Four accounting firm; otherwise 0.
Ownership ConcentrationCr1Percentage of shares held by the largest shareholder.
Firm AgeAgeYears since establishment.
Market Confidence IndexIsiMarket confidence index calculated according to the formula reported above.
Industry Fixed EffectsIndustryDummy variables set according to the CSRC’s 2012 classification of primary industries for listed companies (one omitted to avoid multicollinearity). A dummy variable is assigned a value of 1 if the sample belongs to the corresponding industry in the year of statistics, otherwise 0.
Year Fixed EffectsYearDummy variables set according to the year of the sample statistics (one omitted to avoid multicollinearity). A dummy variable is assigned a value of 1 if the sample belongs to the corresponding year, otherwise 0.
Table 6. Test results of abnormal returns (AR).
Event DaysObservationsMeanT Statisticsp Values
−74213−0.001−1.3800.171
−64213−0.001−1.4750.143
−54213−0.001−2.9410.004 ***
−44213−0.001−2.3730.020 **
−34213−0.002−3.7620.000 ***
−24213−0.001−1.2680.208
−14213−0.001−1.4810.142
04213−0.003−7.1810.000 ***
14213−0.002−4.6570.000 ***
242130.000−0.9160.362
342130.000−0.6980.487
442130.0000.4430.659
54213−0.001−2.1000.038 **
64213−0.001−3.0130.003 ***
74213−0.001−2.0000.048 **
Note: *** p < 0.01; ** p < 0.05.
Table 7. Test results of the cumulative abnormal returns (CAR).
Event WindowsObservationsMeanT Statisticsp Values
(−1, 1)4213−0.005−7.5060.000 ***
(−3, 3)4213−0.008−7.3110.000 ***
(−3, 0)4213−0.006−6.6810.000 ***
(0, 3)4213−0.005−8.1770.000 ***
(−5, 5)4213−0.011−6.5600.000 ***
(−5, 0)4213−0.008−7.7220.000 ***
(0, 5)4213−0.006−7.5440.000 ***
(0, 7)4213−0.008−5.9970.000 ***
(−7, 0)4213−0.009−6.8760.001 ***
(−7, 7)4213−0.014−7.4750.000 ***
Note: *** p < 0.01.
Table 8. Descriptive statistics.
VariableObs.MeanMedianStd. DevMin.Max
CAR3226−0.012−0.0180.104−0.6211.110
CSI32261.7671.0001.3721.00016.000
INV_sen32260.0920.0830.227−1.0001.000
INV_att32260.0070.0951.335−6.6734.306
Size322622.56022.4201.27418.30027.900
Tover322646.16028.56054.1201.475617.800
Big432260.0540.0000.2260.0001.000
Cr1322623.53021.13016.7600.02682.500
Age322613.71013.0007.9201.00030.000
Isi322664.70063.70012.07047.19096.730
Table 9. Correlation coefficient matrix.
VariableCARCSIINV_senINV_attSizeToverBig4Cr1AgeIsi
CAR1−0.035 *0.199 *0.0150.040 *0.050 *0.0140.034 *−0.0050.044 *
CSI−0.046 *1−0.073 *0.056 *0.0010.065 *−0.029−0.0060.083 *0.032 *
INV_sen0.146 *−0.066 *1−0.076 *0.031 *−0.140 *0.052 *0.029 *−0.0030.020
INV_att−0.0090.039 *−0.02810.421 *0.224 *0.153 *0.125 *0.214 *0.103 *
Size0.035 *−0.0260.038 *0.348 *1−0.215 *0.247 *0.218 *0.302 *0.071 *
Tover0.133 *0.043 *−0.099 *−0.001−0.186 *1−0.106 *−0.336 *−0.155 *0.218 *
Big40.013−0.037 *0.052 *0.120 *0.314 *−0.073 *10.081 *0.054 *0.040 *
Cr10.033 *−0.0190.039 *0.142 *0.215 *−0.275 *0.085 *10.344 *0.090 *
Age0.0040.082 *−0.0010.276 *0.261 *−0.178 *0.054 *0.284 *10.090 *
Isi0.071 *0.0210.0200.029 *0.075 *0.131 *0.040 *0.082 *0.083 *1
Note: * p < 0.1.
Table 10. Variance inflation factor diagnostics for non-interaction regressors in the baseline and mediation specifications.
VIFVariable
1.018CSI
1.018INV_sen
1.206INV_att
1.339Size
1.170Tover
1.115Big4
1.185Cr1
1.215Age
1.048Isi
1.146Mean VIF
Note: VIFs are reported for the non-interaction regressors used in Table 11, columns (1)–(3), excluding industry and year fixed effects. The centered moderation model in Table 11, column (4) additionally includes CSI × INV_att; therefore, VIFs for that specification should be calculated separately using the full moderation-model regressor set.
Table 11. Regression results of CSI and market reactions (CAR), the mediating role of investor sentiment (INV_sen), and the moderating role of investor attention (INV_att).
Variables(1)(2)(3)(4)
CARINV_senCARCAR
CSI−0.016 ***−0.038 ***−0.013 ***−0.015 ***
(−3.125)(−3.329)(−2.616)(−2.941)
INV_sen 0.073 ***
(9.260)
CSI × INV_att −0.009 *
(−1.840)
INV_att −0.004 **
(−2.441)
Size0.004 **−0.0010.004 **0.005 ***
(2.355)(−0.362)(2.445)(2.859)
Tover0.000 ***−0.000 ***0.000 ***0.000 ***
(8.676)(−4.909)(9.558)(8.970)
Big40.0010.038 **−0.0020.001
(0.135)(2.066)(−0.202)(0.142)
Cr10.000 ***0.0000.000 ***0.000 ***
(3.000)(0.802)(2.908)(3.133)
Age0.000−0.001 *0.0000.000
(0.681)(−1.772)(0.979)(1.114)
Isi0.0000.002 ***0.0000.000
(1.244)(3.870)(0.625)(1.275)
Constant−0.169 ***0.041−0.172 ***−0.193 ***
(−4.132)(0.458)(−4.262)(−4.517)
Observations3226322632263226
R-squared0.0440.0360.0690.046
IndustryControlControlControlControl
YearControlControlControlControl
Note: The values in parentheses are t-statistics. *** p < 0.01; ** p < 0.05; * p < 0.1.
Table 12. Bootstrap test results.
EffectMean95% Confidence Interval
Indirect Effect−0.0028[−0.0046, −0.0011]
Direct Effect−0.0135[−0.0255, −0.0020]
Table 13. Exclusive restriction variable regression results.
Variables(1)
High_CSI
Conf0.389 **
(2.173)
H10−0.114
(−0.453)
Lev0.626 ***
(4.742)
State−0.174 ***
(−3.090)
Constant−1.265 ***
(−4.877)
Observations2861
IndustryControl
YearControl
Note: Values in parentheses are z-statistics. *** p < 0.01; ** p < 0.05.
Table 14. Regression results based on the inverse Mills ratio.
Variables(1)(2)(3)
CARCARCAR
CSI−0.029 ***−0.025 ***−0.026 ***
(−3.035)(−2.650)(−2.764)
INV_sen 0.073 ***
(8.614)
CSI × INV_att −0.013 **
(−2.491)
INV_att −0.005 ***
(−2.657)
Size0.005 ***0.005 ***0.006 ***
(2.753)(2.899)(3.232)
Tover0.000 ***0.000 ***0.000 ***
(7.882)(8.737)(8.238)
Big40.002−0.0010.002
(0.206)(−0.108)(0.213)
Cr10.000 ***0.000 ***0.000 ***
(2.949)(2.973)(3.103)
Age0.0000.0000.000
(0.120)(0.306)(0.551)
Isi0.0000.0000.000
(1.217)(0.653)(1.244)
IMR0.0050.0040.004
(1.202)(1.057)(1.035)
Constant−0.210 ***−0.216 ***−0.236 ***
(−4.601)(−4.796)(−4.970)
Observations286128612861
R-squared0.0440.0690.048
IndustryControlControlControl
YearControlControlControl
Note: Values in parentheses are t-statistics. *** p < 0.01; ** p < 0.05.
Table 15. Regression results with replacement samples.
Variables(1)(2)(3)(4)
CARINV_senCARCAR
CSI−0.022 ***−0.050 ***−0.018 ***−0.021 ***
(−7.721)(−8.953)(−6.313)(−7.320)
INV_sen 0.082 ***
(13.370)
CSI × INV_att −0.015 ***
(−5.153)
INV_att −0.003 ***
(−2.735)
Size0.001−0.0020.0010.003 **
(0.931)(−0.698)(1.058)(2.082)
Tover0.000 ***−0.000 ***0.000 ***0.000 ***
(10.572)(−5.686)(11.620)(11.476)
Big4−0.0000.045 ***−0.004−0.000
(−0.003)(3.201)(−0.529)(−0.024)
Cr10.000 **0.0000.000**0.000 ***
(2.442)(1.165)(2.283)(2.579)
Age0.000 **−0.001 **0.001 ***0.001 ***
(2.478)(−2.268)(2.883)(3.236)
Isi0.0000.001 ***0.0000.000
(1.505)(4.207)(0.833)(1.368)
Constant−0.078 **0.065−0.084 ***−0.111 ***
(−2.568)(1.076)(−2.779)(−3.490)
Observations6639663966396639
R-squared0.0420.0430.0670.047
IndustryControlControlControlControl
YearControlControlControlControl
Note: Values in parentheses are t-statistics. *** p < 0.01; ** p < 0.05.
Table 16. Regression results with the replacement of the dependent variable.
Variables(1)(2)(3)(4)
CAR2INV_senCAR2CAR2
CSI−0.006 **−0.038 ***−0.004 *−0.006 **
(−2.539)(−3.329)(−1.849)(−2.352)
INV_sen 0.047 ***
(12.740)
CSI × INV_att −0.006 **
(−2.523)
INV_att −0.001 *
(−1.929)
Size0.001 *−0.0010.001 *0.002 *
(1.651)(−0.362)(1.774)(1.949)
Tover0.000−0.000 ***0.000 **0.000 *
(1.419)(−4.909)(2.550)(1.740)
Big4−0.0010.038 **−0.003−0.001
(−0.174)(2.066)(−0.643)(−0.188)
Cr10.0000.0000.0000.000
(0.734)(0.802)(0.572)(0.810)
Age0.000−0.001 *0.000 *0.000
(1.251)(−1.772)(1.680)(1.493)
Isi−0.0000.002 ***−0.000−0.000
(−0.190)(3.870)(−1.064)(−0.215)
Constant−0.034 *0.041−0.036 *−0.041 **
(−1.752)(0.458)(−1.899)(−2.010)
Observations3226322632263226
R-squared0.0110.0360.0590.013
IndustryControlControlControlControl
YearControlControlControlControl
Note: Values in parentheses are t-statistics. *** p < 0.01; ** p < 0.05; * p < 0.1.
Table 17. Comparison of mean differences.
Low CSR Group High CSR Group Differences in MeanT Statistics
ObservationsMean 1ObservationsMean 2
CAR(−1,1)2079−0.0082074−0.003−0.005−3.352 ***
CAR(−3,3)2079−0.0132074−0.004−0.009−3.895 ***
CAR(−3,0)2079−0.0082074−0.004−0.004−2.533 **
CAR(0,3)2079−0.0082074−0.003−0.005−2.878 ***
CAR(−5,5)2079−0.0182074−0.005−0.013−4.293 ***
CAR(−5,0)2079−0.0102074−0.005−0.005−2.367 **
CAR(0,5)2079−0.0102074−0.002−0.008−3.639 ***
CAR(0,7)2079−0.0132074−0.003−0.010−3.664 ***
CAR(−7,0)2079−0.0122074−0.006−0.005−2.084 **
CAR(−7,7)2079−0.0222074−0.007−0.014−4.064 ***
Note: *** p < 0.01; ** p < 0.05.
Table 18. Regression results for the insurance effect.
Variables(1)
CAR
dummyCSR0.013 ***
(3.488)
Size0.003 *
(1.812)
Tover0.000 ***
(7.872)
Big40.001
(0.176)
Cr10.000 ***
(2.976)
Age0.000
(0.810)
Isi0.000
(1.176)
Groa−0.000
(−0.456)
Constant−0.151 ***
(−3.683)
Observations3192
R-squared0.042
IndustryControl
YearControl
Note: Values in parentheses are t-statistics. *** p < 0.01; * p < 0.1.
Disclaimer/Publisher’s Note: The statements, opinions and data contained in all publications are solely those of the individual author(s) and contributor(s) and not of MDPI and/or the editor(s). MDPI and/or the editor(s) disclaim responsibility for any injury to people or property resulting from any ideas, methods, instructions or products referred to in the content.