Article

Financial and Collaborative Drivers of Green Innovation Investment Quality in Heavily Polluting Firms: A Quadruple Helix Configuration Analysis


1
School of Public Administration, Beihang University, Beijing 100191, China
2
School of Management, Tianjin University of Commerce, Tianjin 300134, China
3
Davis College of Business and Technology, Jacksonville University, Jacksonville, FL 32201, USA
4
School of Accounting, Tianjin University of Commerce, Tianjin 300134, China
*
Author to whom correspondence should be addressed.
Int. J. Financial Stud. 2026, 14(4), 94; https://doi.org/10.3390/ijfs14040094
Submission received: 6 February 2026 / Revised: 15 March 2026 / Accepted: 23 March 2026 / Published: 3 April 2026
(This article belongs to the Special Issue Corporate Financial Performance and Sustainability Practices)

Abstract

Green innovation is central to industrial ecological transition, yet heavily polluting firms often exhibit low-quality green innovation investment. Grounded in the government–enterprise–research–intermediary Quadruple Helix innovation ecosystem framework, this study integrates Necessary Condition Analysis (NCA) and fuzzy set qualitative comparative analysis (fsQCA) to examine 66 publicly listed heavily polluting manufacturing firms in China. The results show that fiscal subsidies and environmental taxes are necessary but not sufficient conditions for achieving high-quality green innovation investment. Moreover, high-quality outcomes arise through three equifinal pathways: the Government–Intermediary Dual-Drive Model, the Government–Enterprise–Intermediary Co-Directional Model, and the Government–Enterprise Symbiotic Model. Six configurations lead to non-high-quality green innovation investment, which cluster into Resource-Scarcity and Regulatory-Constrained models. A favorable macro environment further strengthens high-quality outcomes. These findings clarify how policy instruments and multi-actor collaboration jointly shape green innovation investment quality and provide actionable implications for heavily polluting firms and policymakers seeking sustainable development.

1. Introduction

Amid intensifying climate action and tightening green trade rules, green transformation has become a global priority. The Global Stocktake agreement reached at COP28 in 2023 signals a new phase of climate governance, calling for faster fossil fuel phase-out, energy transition, and green technological innovation to limit warming to 1.5 °C. Meanwhile, the EU’s Carbon Border Adjustment Mechanism (CBAM) is reshaping trade rules and accelerating the greening of global supply chains. According to the International Energy Agency (2024), clean-energy investment exceeded fossil fuel investment for the fourth consecutive year, reaching USD 2.0 trillion in 2024, with China contributing about 33.75%. In this context, improving green innovation investment quality in heavily polluting manufacturing has become pivotal for global value-chain restructuring (Islam, 2025; Madani et al., 2026; Peng & Zeng, 2025; Wu et al., 2025). Yet many heavily polluting firms still show weak green patent outputs and low R&D intensity, especially in emerging economies where technology, finance, and institutional constraints coexist. Identifying differentiated pathways to enhance green innovation investment quality is therefore urgent.
Prior studies have examined determinants of green innovation investment quality from government (Patanakul & Pinto, 2014), firm (Jones et al., 2020), and societal (Hutter et al., 2018) perspectives, but often in isolation. Innovation ecosystems are multi-layered and shaped by interdependent actors (Rio et al., 2010). Helix-based ecosystem theories—from the Triple Helix (Etzkowitz & Leydesdorff, 2000) to the Quadruple Helix—emphasize cross-actor collaboration and offer a systemic lens to explain green innovation investment quality. Building on this systemic perspective, this study argues that GIIQ must be re-conceptualized beyond simple metrics. Specifically, Green Innovation Investment Quality (GIIQ) is defined here as the synergistic efficiency between a firm’s R&D resource input and its high-value environmental technology output. For heavily polluting manufacturing firms, GIIQ is not merely a financial metric but a survival necessity. Under the pressure of global carbon neutrality goals and tightening green trade barriers like the CBAM, these firms face a “compliance-innovation dilemma”: they must transition from symbolic, low-quality green spending to substantive, high-quality investments to avoid being “locked out” of global value chains. However, existing literature often treats green innovation as a homogeneous capital input, overlooking the heterogeneous configurations of multi-actor synergies required to achieve high-quality outcomes.
To bridge these gaps, this study moves beyond the “net effect” of single drivers and adopts a systemic Quadruple Helix perspective. This study proposes the following refined research questions to explore the causal complexity of GIIQ: Which specific elements within the Government-Enterprise-Research-Intermediary (G–E–R–I) spirals constitute bottleneck conditions that must be satisfied for high-quality green innovation investment? How do different configurations of policy instruments (subsidies, taxes), corporate constraints, and collaborative ties combine to form equifinal pathways leading to high-quality GIIQ? Are the driving mechanisms for low-quality GIIQ simply the absence of high-quality drivers, or do they represent distinct “Resource-Scarcity” and “Regulatory-Constrained” models?
Compared with prior work, this study contributes by: (1) extending the “government–industry–research” Triple Helix to a government–enterprise–research–intermediary Quadruple Helix innovation ecosystem framework to examine green innovation investment quality in heavily polluting firms from a system perspective (Chen et al., 2018; Etzkowitz & Leydesdorff, 2000; Rio et al., 2010); (2) integrating NCA and fsQCA to capture causal complexity beyond the symmetric assumptions of conventional regression (Dul, 2016; Fiss, 2011; Ragin, 2000); (3) identifying three pathways to high-quality outcomes and two pathways to non-high-quality outcomes, clarifying heterogeneous mechanisms (Furnari et al., 2021; M. Wang et al., 2021; Zhang et al., 2023); and (4) showing that fiscal subsidies and environmental taxes are (approximately) necessary conditions for high-quality outcomes, informing debates on policy instruments (Ambec & Barla, 2002; Cappelen et al., 2012; Shleifer & Vishny, 1994; Y. B. Wang et al., 2017).
The rest of this paper is structured as follows: Section 2 reviews the literature on green innovation from four theoretical perspectives and constructs a configurational model for analysis. Section 3 outlines the research design and data processing. Section 4 presents an fsQCA configurational analysis of high- and low-quality green innovation investment in heavily polluting enterprises. Section 5 offers conclusions, recommendations, and future prospects.

2. Literature Review and Theoretical Analysis

2.1. Literature Review

The quality of corporate green innovation investment is a multifaceted concept that can be analyzed through two key dimensions: the level of green innovation and the intensity of R&D investment. Existing studies primarily explore the four sub-spirals of the green innovation ecosystem: government, enterprises, R&D institutions, and intermediary organizations. The following sections elaborate on how each of these dimensions contributes to explaining the green innovation investment quality.

2.1.1. Government Sub-Spiral

The government plays a crucial role as a macro-regulator in enhancing green innovation investment. Due to the high costs associated with green innovation activities, enterprises often underinvest in R&D, resulting in poor innovation outcomes and low investment quality (G. Q. Li et al., 2022). Therefore, fiscal subsidies and environmental regulations are two key mechanisms through which governments can boost the green innovation investment quality (Feng et al., 2021).
Many scholars posit that fiscal subsidies positively impact corporate green innovation investment (Cappelen et al., 2012; Z. Wang et al., 2022; Xia et al., 2022). For instance, Wei et al. (2023) argue that government expenditures significantly foster green technological innovation, indirectly reducing pollution and tax burdens, which in turn enhances investment quality. Conversely, some researchers suggest that fiscal subsidies might have a negative effect. Y. B. Wang et al. (2017) claim that excessive government interference can hinder firms’ resource allocation for green innovation, ultimately lowering the quality of investment.
Environmental taxation is another regulatory tool that significantly affects corporate green innovation. The academic community remains divided on its impact. Clarkson et al. (2004) argue that environmental regulations increase the costs of pollution control, which can reduce R&D investment and stifle innovation. However, other studies suggest that higher environmental taxes can act as external pressure, encouraging firms to pursue green innovation and thereby improve investment quality (Ambec & Barla, 2002).

2.1.2. Enterprise Sub-Spiral

Enterprises are the primary drivers of green innovation R&D. According to the Resource-Based View (RBV) theory, resources are crucial for firms to enhance the green innovation investment quality. Stable and adequate financing is necessary for green innovation (F. Wang et al., 2026; Zakharkina et al., 2018), as a company’s financial health directly impacts its innovation strategy and, subsequently, the quality of its investment in green technologies (Hottenrott & Peters, 2012; J. Li & Ibrahim, 2024). Unlike traditional innovation, green innovation involves greater uncertainty, higher costs, and elevated risks (Garcia-Castro & Francoeur, 2016), making it challenging for firms to secure external financing. As a result, financing constraints have become a significant bottleneck in the implementation of green innovation strategies (Yu et al., 2021; Zhai et al., 2022).

2.1.3. Research Institutions Sub-Spiral

R&D institutions function as crucial knowledge producers that enhance the quality of green innovation investments. According to Resource Dependence Theory, entities possess unique resources, creating networks of interdependent relationships (Barney et al., 2021; Duran et al., 2024). In today’s knowledge economy, collaboration between businesses and research institutions facilitates resource flow and technology transfer (Hou et al., 2019), which are essential for improving the green innovation investment quality. By partnering with R&D institutions, companies can actively engage in green innovation activities, forming resource-based partnerships that benefit both parties (Ranta et al., 2021). These collaborations play a pivotal role in fostering the healthy development of high-tech industries within the broader green innovation ecosystem (Fernandes et al., 2021).

2.1.4. Intermediary Organizations Sub-Spiral

Intermediary organizations play a crucial oversight role in enhancing the green innovation investment quality. For instance, accounting firms help reduce information asymmetry through auditing (Choi & Wong, 2007). When a company hires one of the “Big Four” accounting firms, it is more likely to improve its green innovation investment quality (Jin et al., 2018). ESG rating agencies also provide transparency by publishing reports that reflect a company’s social responsibility performance. While some scholars argue that ESG ratings help address information asymmetry (Kim & Park, 2023), others question their reliability and effectiveness. In fact, third-party ESG ratings may increase the quantity of green innovation but negatively impact its quality (Liu et al., 2023).
Most studies examine the roles of government, enterprises, research institutions, and intermediaries separately, overlooking their interdependence. Green innovation investment quality is inherently systemic and requires alignment across these actors. In the context of China’s manufacturing green transition, it is therefore essential to clarify how antecedent conditions combine to shape investment quality and through what mechanisms.

2.1.5. Methodological and Contextual Comparisons

To further clarify the novelty of this study, it is essential to contrast the current research’s approach with existing research paradigms. Methodologically, the vast majority of prior studies on green innovation have relied on variance-based linear models—such as Ordinary Least Squares (OLS) or Generalized Method of Moments (GMM)—to identify the “net effect” of individual drivers. While these methods are robust for testing symmetric relationships, they often overlook the “causal complexity” (i.e., equifinality and asymmetry) inherent in corporate sustainability decisions. Unlike traditional regression, which assumes that the presence of a factor leads to a certain outcome and its absence to the opposite, the study’s integrated NCA–fsQCA approach acknowledges that high-quality green innovation investment (GIIQ) can be achieved through multiple, non-exclusive configurations. Specifically, NCA allows the research to identify non-compensatory bottleneck conditions—such as minimum policy thresholds—that regression models typically fail to detect. Contextually, while previous research has extensively covered green innovation in general manufacturing or small-and-medium enterprises (SMEs) within developed economies, this study focuses specifically on heavily polluting firms in an emerging market (China). These firms operate under a unique “compliance-innovation dilemma”: they face extreme regulatory pressure (e.g., environmental taxes) and high dependency on state support (e.g., fiscal subsidies), yet they also suffer from severe information asymmetry and financing constraints. By comparing these configurations across the Quadruple Helix, this study provides a more nuanced understanding of how high-impact polluters navigate institutional constraints, a perspective that is often missing from broader, cross-industry samples.

2.2. Quadruple Helix Theory Analytical Framework

Building on prior work (Chen et al., 2018), the study decomposes the key constructs into four dimensions (Linnenluecke et al., 2017) and operationalizes them as configurational conditions (McKenny et al., 2018). A Quadruple Helix–based framework for green innovation investment quality in heavily polluting firms is then developed by integrating innovation ecosystem theory with a Government–Enterprise–Research–Intermediary (G–E–R–I) model.

2.2.1. G–E–R–I Driving Model and Collaborative Perspectives

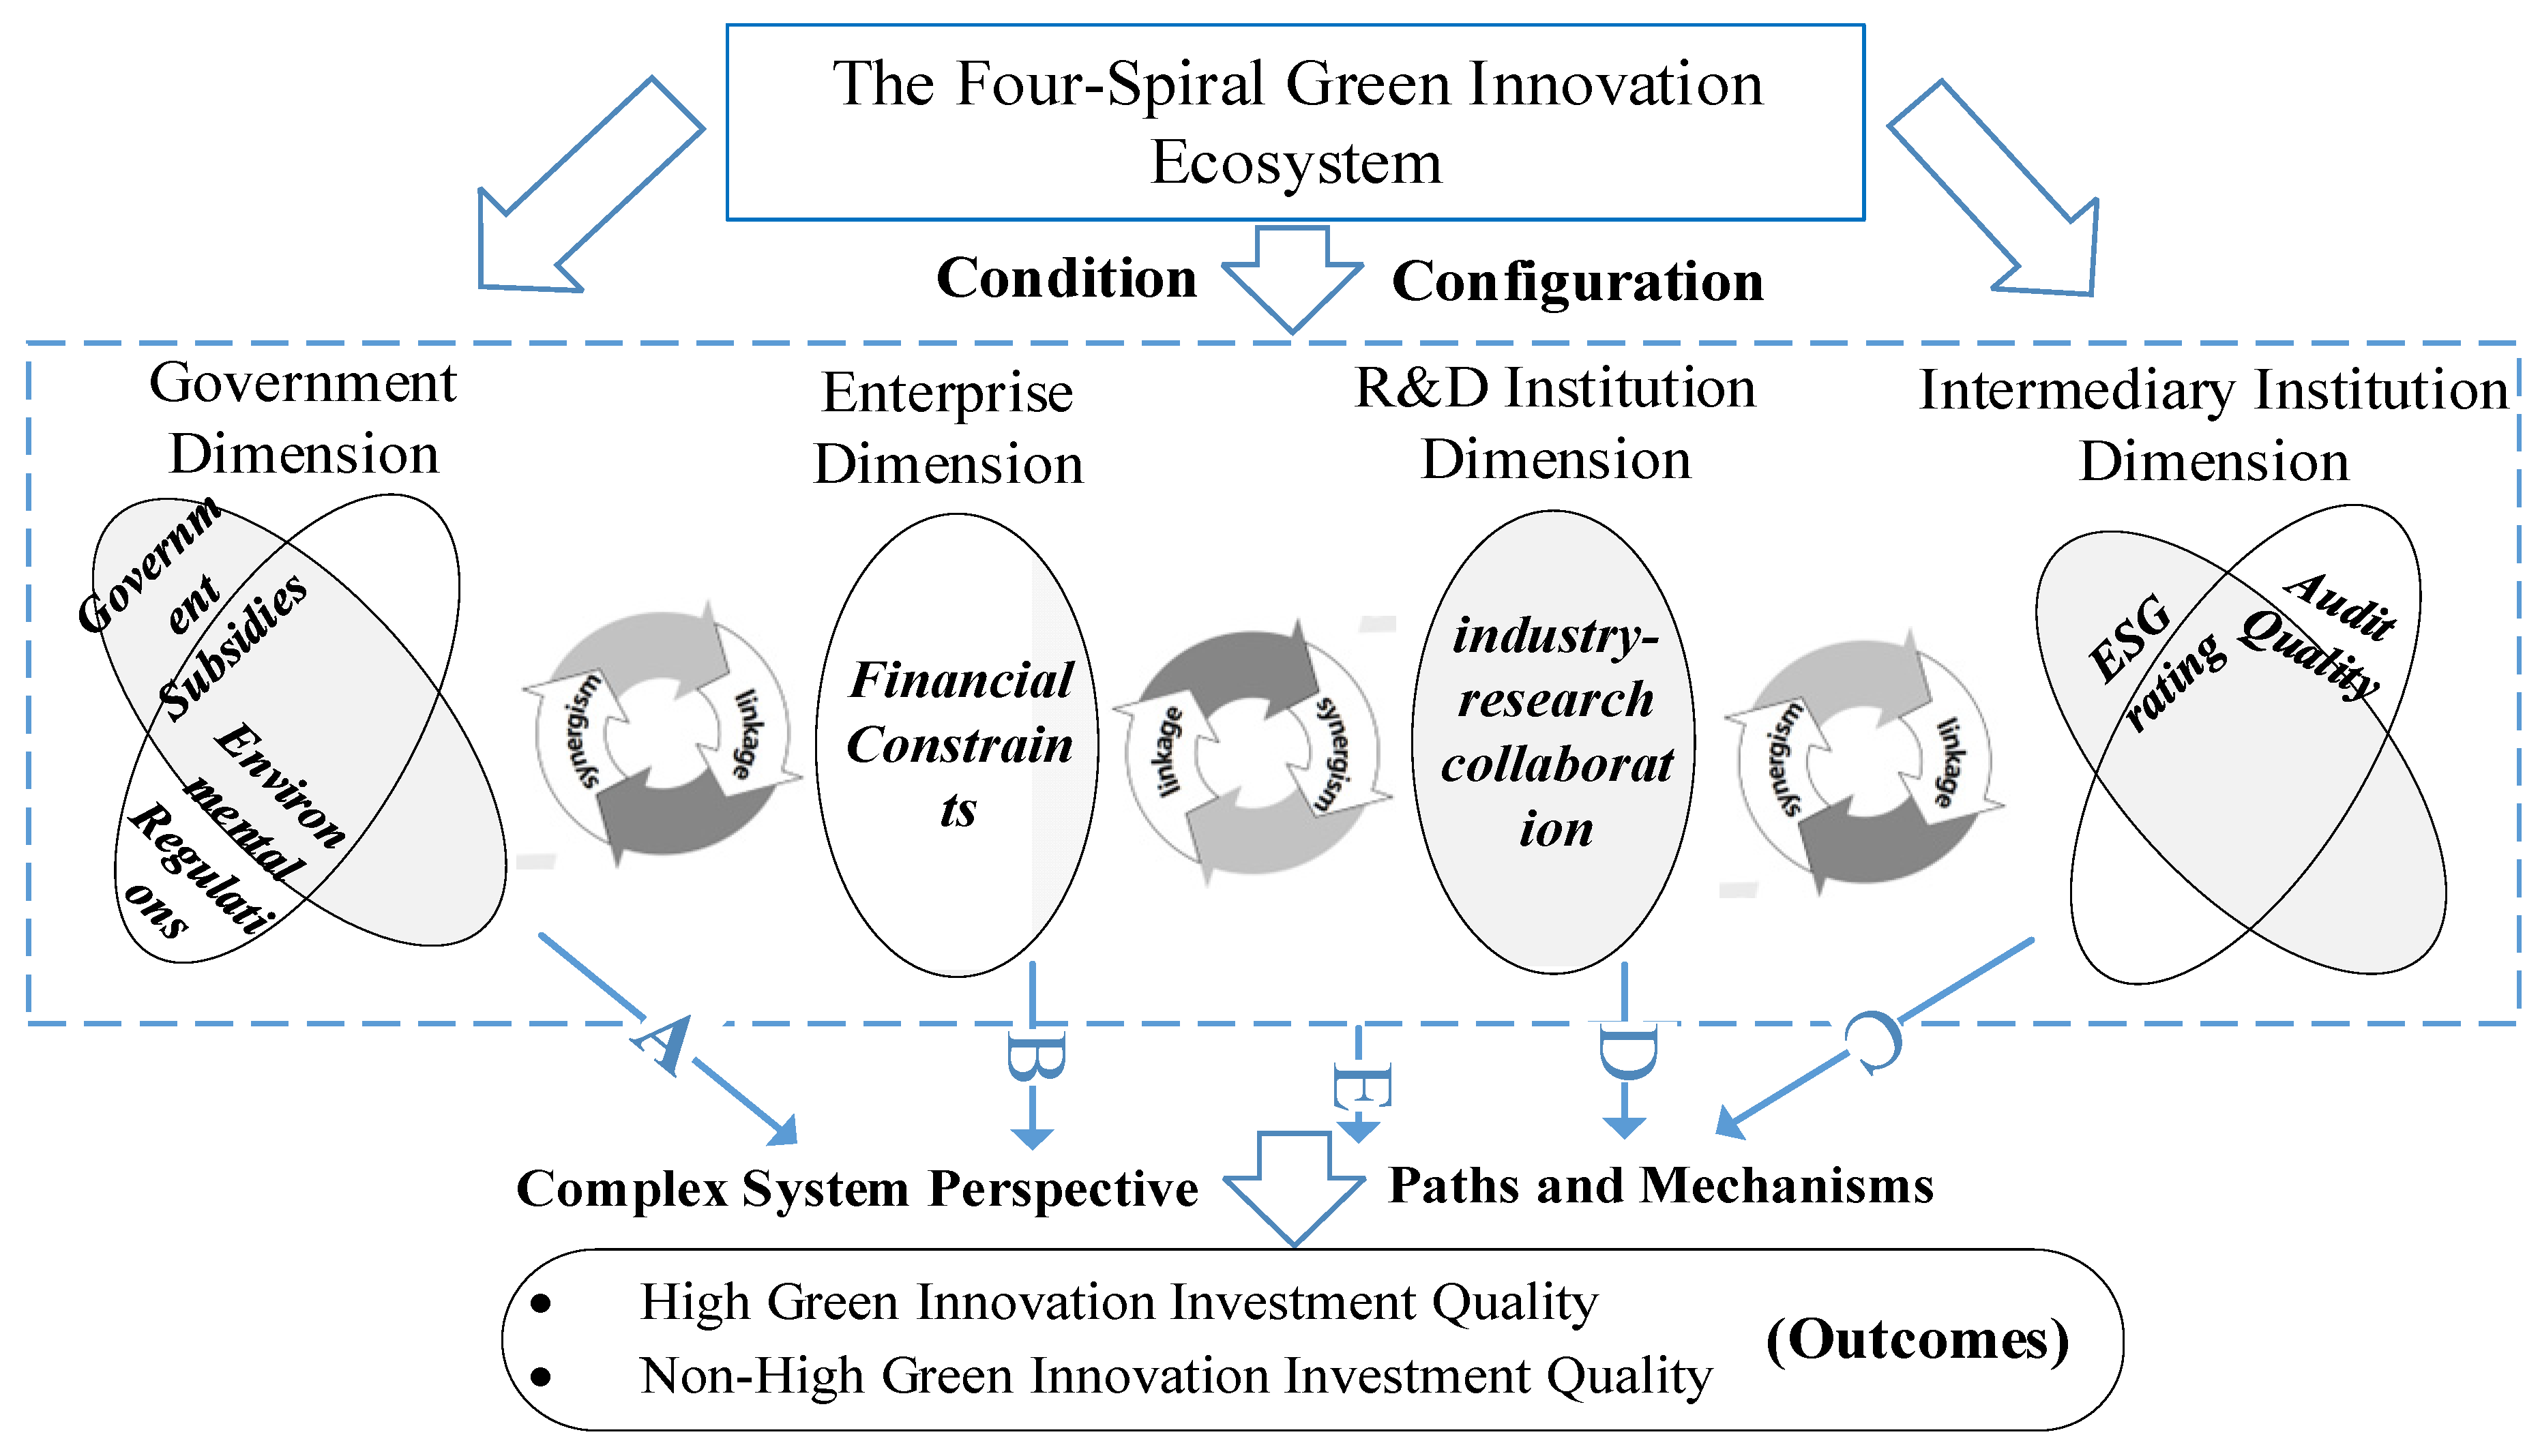
Accordingly, the model specifies two government conditions—fiscal subsidies and environmental taxes; one enterprise condition—financing constraints; one research condition—industry–research cooperation; and two intermediary conditions—audit quality and ESG ratings. Figure 1 summarizes the resulting G–E–R–I driving model.
Under the Quadruple Helix innovation ecosystem lens, the study focuses on how conditions combine—rather than the net effect of any single factor—to shape green innovation investment quality. The main collaboration perspectives are as follows:
First, Government + Business Collaboration Perspective. Green innovation is characterized by dual externalities that may result in market failure. As a macro-regulator, the government plays a critical role in addressing these failures and fostering a favorable environment for green innovation. Governmental grants, for example, are designed to incentivize firms to invest in green technologies (Jin et al., 2018; Lokshin & Mohnen, 2012). These grants help mitigate issues such as underinvestment in R&D and the excessive costs associated with externalities (Bellucci et al., 2019; Howell, 2017). By providing firms with additional R&D funding, these grants alleviate internal financing constraints, ultimately enhancing the quality of their green innovation investments.
Second, Business + Government + research institutions Collaboration Perspective. According to the Resource-Based View (RBV) theory, both internal and external resources are vital for green innovation activities. Technological innovation in firms is often marked by long development cycles and high uncertainty, necessitating significant exogenous resource support (Zhang et al., 2023). To address internal deficiencies, companies must strategically integrate a variety of resources. In the knowledge economy era, improving the green innovation investment quality requires optimizing the use of diverse resources—financial, intellectual, and human capital. Firms must not only leverage fiscal subsidies to increase their R&D expenditure on green innovation but also actively collaborate with research institutions. These partnerships capitalize on complementary strengths in talent and knowledge, enabling more efficient resource utilization and the smooth flow of innovation capital. Therefore, the key to enhancing green innovation investment quality in heavily polluting industries lies in effective resource acquisition and utilization.
Third, research institutions + Business Collaboration Perspective. Based on Resource Dependency Theory, each economic entity possesses unique resources, and there are inherent differences among them. Interactions between entities, such as collaborations between research institutes and firms, facilitate resource-based partnerships. These partnerships align with the concept of positive resource cycling, where research institutes contribute human capital while partnering with firms to generate knowledge and technological innovations. For example, firms lacking sufficient resources may be at a disadvantage in developing green innovations. However, through collaborations with research institutes, they can engage in resource-sharing and capitalize on complementary strengths, ultimately improving the quality of their green innovation investments.
Fourth, Intermediary Organizations + Business Collaboration Perspective. According to theories of Information Asymmetry and Reputation, intermediary organizations play a vital role as monitors in improving the quality of green innovation investments. The information disclosed by these organizations puts pressure on companies to increase their environmental awareness, thereby enhancing both the quality of green innovation investments and the company’s image. Additionally, firms often face high financing constraints due to the confidential nature, risks, and long development cycles associated with green innovation activities. ESG rating agencies help alleviate these constraints by providing transparency regarding companies’ environmental, social, and governance practices, which reduces information asymmetry and improves access to financing, ultimately leading to enhanced green innovation investment quality.
From a configurational perspective, the effects of government, enterprises, research institutions, and intermediary organizations are interdependent. Different combinations of these conditions may be mutually reinforcing or partially substitutive, giving rise to multiple adaptive pathways. Accordingly, the analysis examines how the four sets of conditions jointly shape green innovation investment quality in heavily polluting industries.

2.2.2. Theoretical Propositions for Configurational Consistency

To maintain the contextual consistency of the Quadruple Helix framework, the study develops the following theoretical propositions based on the interdependent logic of the G–E–R–I spirals:
Proposition 1 (Necessity of Policy Anchors): Within the heavily polluting industry context, macro-level policy instruments—specifically fiscal subsidies and environmental taxes—are expected to function as necessary but non-sufficient anchors. The research posits that while these government-led conditions provide the fundamental drive for greening, they must be configured with internal firm-level or intermediary-level factors to catalyze high-quality green innovation investment (GIIQ).
Proposition 2 (Configurational Equifinality): The study assumes that multiple, non-exclusive equifinal pathways exist to achieve high-quality GIIQ. For instance, a “Policy-Driven” configuration (strong government support) and a “Knowledge-Collaborative” configuration (strong research institution ties) may independently lead to high GIIQ, depending on the firm’s specific financial and regulatory constraints.
Proposition 3 (Causal Asymmetry): The research further hypothesizes that the causal recipes for low-quality GIIQ are not simply the inverse of high-quality drivers. Instead, low GIIQ is likely rooted in distinct “Resource-Scarcity” or “Regulatory-Constrained” configurations where the lack of synergy among the four spirals creates systemic bottlenecks.

3. Research Design and Data Analysis

3.1. Methodology Selection

Configurational analysis is well-suited to unpacking causal complexity in organizational outcomes. Rather than estimating isolated net effects, it examines how interdependent conditions jointly produce an outcome (Jovanovic & Morschett, 2022; Tan & Zhu, 2022). Consistent with this logic, the study combines Necessary Condition Analysis (NCA) and fuzzy set Qualitative Comparative Analysis (fsQCA) to identify both indispensable prerequisites and equifinal configurational pathways leading to high-quality green innovation investment in heavily polluting manufacturing firms.
NCA is designed to detect necessary (but not sufficient) conditions and to quantify their constraining power via effect sizes and bottleneck levels (Dul, 2016). fsQCA, in contrast, adopts a set-theoretic and asymmetric perspective and uses Boolean algebra to identify multiple sufficient configurations, avoiding the additive and symmetric assumptions that often underlie regression-based approaches (Kumar et al., 2022). By treating conditions as parts of causal recipes, fsQCA reduces dependence on extensive control-variable specifications and helps mitigate concerns commonly associated with omitted-variable bias in conventional variance-based designs (Fainshmidt et al., 2020).
Empirically, the analysis covers conditions across four quadruple-helix dimensions—government, businesses, research institutions, and intermediary organizations—and evaluates how these conditions combine to produce high-quality green innovation investment. A staged NCA–fsQCA integration framework is implemented. First, NCA identifies and quantifies the non-compensatory prerequisites for the outcome. Next, these prerequisites are carried into the fsQCA stage as baseline constraints, where alternative sufficient configurations and their equivalence relations are identified. This sequential design links necessity and sufficiency in a coherent way: NCA establishes boundary conditions for achieving the outcome, while fsQCA reveals distinct combinations of additional conditions that satisfy those boundaries and generate high-quality green innovation investment.

3.2. Sample and Data Sources

For fuzzy set qualitative comparative analysis (fsQCA), it is essential to select samples that are both comparable and diverse. This study therefore focuses on heavily polluting manufacturing firms in China, with particular emphasis on those producing chemical raw materials and chemical products. These firms represent the most pollution-intensive segment of the manufacturing sector, as defined by China’s Environmental Protection Law and the Ministry of Ecology and Environment of China (2010) “Listed Companies Environmental Disclosure Guide”.
All firm-level accounting, financial, and governance data—including fiscal subsidies, environmental taxes, the SA index for financing constraints, audit quality, and ESG ratings—were obtained from the China Stock Market and Accounting Research (CSMAR) database. Green innovation patent data were sourced from the China Research Data Service Platform (CNRDS). Following the 2012 industry sub-classification standards issued by the China Securities Regulatory Commission (CSRC), the data were filtered and cleaned through the following steps:
(1) To mitigate potential data randomness inherent in a single-year cross-sectional snapshot, continuous variables (fiscal subsidies, environmental taxes, financing constraints, and ESG ratings) were calculated as the 5-year average (2019–2023), while dichotomous variables (industry–research cooperation and audit quality) used the latest available 2023 data. This hybrid approach smooths year-specific fluctuations for continuous conditions without compromising the configurational logic required by fsQCA. (2) Missing values were supplemented using the firms’ annual reports. (3) Firms with incomplete data were excluded. After these steps, a final sample of 66 heavily polluting manufacturing firms was obtained, providing a focused yet representative basis for analyzing pathways to improve green innovation investment quality (Douglas et al., 2020).

3.3. Measurement and Calibration

3.3.1. Outcome Variable Measure

Green innovation investment quality (GI) is a latent construct that requires operationalization. GI is measured along two dimensions: input (R&D investment) and output (the number of green patent applications). The entropy method is applied to derive objective weights and to aggregate the two dimensions into a composite GI index, where higher values indicate higher green innovation investment quality. The procedure is as follows:
To standardize the raw data, this study first distinguishes between positive and negative indicators. For a given assessment criterion of an enterprise denoted as X i j , its standardized value is represented as X i j . The formulas for positive and negative indicators are delineated as follows:
X i j = X i j min X i j max X i j min X i j X i j = max X i j X i j max X i j min X i j
Performing data standardization and transformation:
X i j = X i j + 10 3
Entropy Method for Determining Indicator Weights:
Calculate the weight of the evaluation indicator for the i-th evaluated object under the j-th criterion.
P i j = X i j i = 1 n X i j ( i = 1 , 2 n ;   j = 1 , 2 m )
Calculate the entropy value (ej) for the j-th evaluation indicator
e j = 1 ln ( n ) × i = 1 n ( P i j × ln ( P i j ) )
Calculate the coefficient of variation for the j-th item.
g j = 1 e j
Normalize the coefficients and calculate the weight of the j-th evaluation indicator.
W j = g j i = 1 m g j j = 1 , 2 m
Calculate the comprehensive score for green innovation investment quality.
G I = j = 1 m W j X i j
The entropy-weighted method was selected to construct the composite index because it provides fully objective, data-driven weights based on the actual variation in the sample, thereby avoiding subjective bias common in expert-assigned weights (Wan et al., 2023). Although input (R&D intensity) and output (green patent applications) are conceptually distinct dimensions, empirical evidence in this study shows a strong positive correlation between them (Pearson r = 0.68, p < 0.01), indicating that high-input/low-output or low-input/high-output mismatches are uncommon in heavily polluting firms. Thus, the composite index reliably captures overall green innovation investment quality.

3.3.2. Antecedent Conditions

Fiscal Subsidies: Following the approach of Z. Wang et al. (2022), Fiscal Subsidies are represented by the logarithm of the amounts disclosed in the annual financial statements of heavily polluting manufacturing companies.
Environmental Tax: In line with the method used by Cui (2024), the natural logarithm of the amounts disclosed as environmental taxes in corporate financial statements is used to indicate the level of environmental regulation faced by companies.
Financing Constraints: Referencing Z. Wang (2022) approach, the SA index is employed to measure the degree of financing constraints faced by the firms.
Industry–research cooperation: This is assessed by searching through the corporate websites and past news releases to determine whether the company actively collaborates with research institutions.
Audit quality is measured using a dummy variable that takes the value of 1 if the financial statements are audited by one of the top ten domestic audit firms ranked in China, and 0 otherwise.
ESG Rating: The comprehensive ESG rating from the WIND database is used to represent the ESG performance level of companies.
Table 1 below details the specific definitions and computational bases for each of these antecedent conditions.

3.3.3. Statistical Description and Calibration

Before proceeding with the analysis of necessary and sufficient conditions, it is essential to calibrate both the outcome and antecedent conditions. Given the lack of explicit uniform standards in both theoretical and practical domains for measuring high and non-high levels of green innovation investment quality and their impact systems, this study adopts relative position calibration for both outcomes and antecedent conditions (Greckhamer & Gur, 2021). Drawing from existing theories and empirical knowledge, and considering the data distribution and structure of both outcomes and conditions, this study employs direct calibration and direct assignment methods. Green investment quality and environmental tax are calibrated using the 75th percentile, median, and 25th percentile as their full membership, crossover, and non-membership points, respectively. Fiscal subsidies, ESG ratings, and financing constraints are calibrated based on their data distribution characteristics and the relative levels of financial subsidy percentiles, using the 90th percentile, median, and 10th percentile as their full membership, crossover, and non-membership points, respectively. Audit quality and corporate-research collaboration are dichotomous variables with clear sets. Table 2 below details the descriptive statistics and calibration anchor points for each of the antecedent conditions and outcomes.

4. Data Analysis and Configurational Results

4.1. Univariate Necessary Condition Analysis

Before conducting the sufficiency analysis, necessity is assessed for each antecedent condition and its negation. Necessary Condition Analysis (NCA) is widely used in “bottleneck” research to identify conditions that must be present for an outcome to occur. NCA distinguishes discrete and continuous conditions, and typically reports effect sizes and bottleneck levels, which indicate how strongly a condition constrains an outcome and what minimum level is required at a given outcome level.
A set-theoretic necessity test is first conducted by computing consistency and coverage for each condition with respect to the outcome. Consistency above 0.90 indicates a necessary condition, whereas values between 0.80 and 0.90 suggest an approximately necessary condition (Ragin, 2000). Table 3 reports the necessity test results for green innovation investment quality among heavily polluting manufacturing firms. None of the six conditions (or their negations) exceeds the 0.90 threshold.
However, fiscal subsidies show relatively high consistency and coverage (0.807 and 0.750), suggesting an approximately necessary role for achieving high green innovation investment quality. Environmental taxes also show relatively high consistency and coverage (0.744 and 0.717), indicating a meaningful constraining effect. Other single factors do not meet the threshold for necessity for high or non-high outcomes.
Building on the set-theoretic necessity test, NCA is further applied to quantify how strongly each condition constrains green innovation investment quality and to estimate the minimum level of each condition required at different outcome levels. To reduce sensitivity to calibration anchors, NCA is conducted using raw (uncalibrated) values for both the conditions and the outcome.
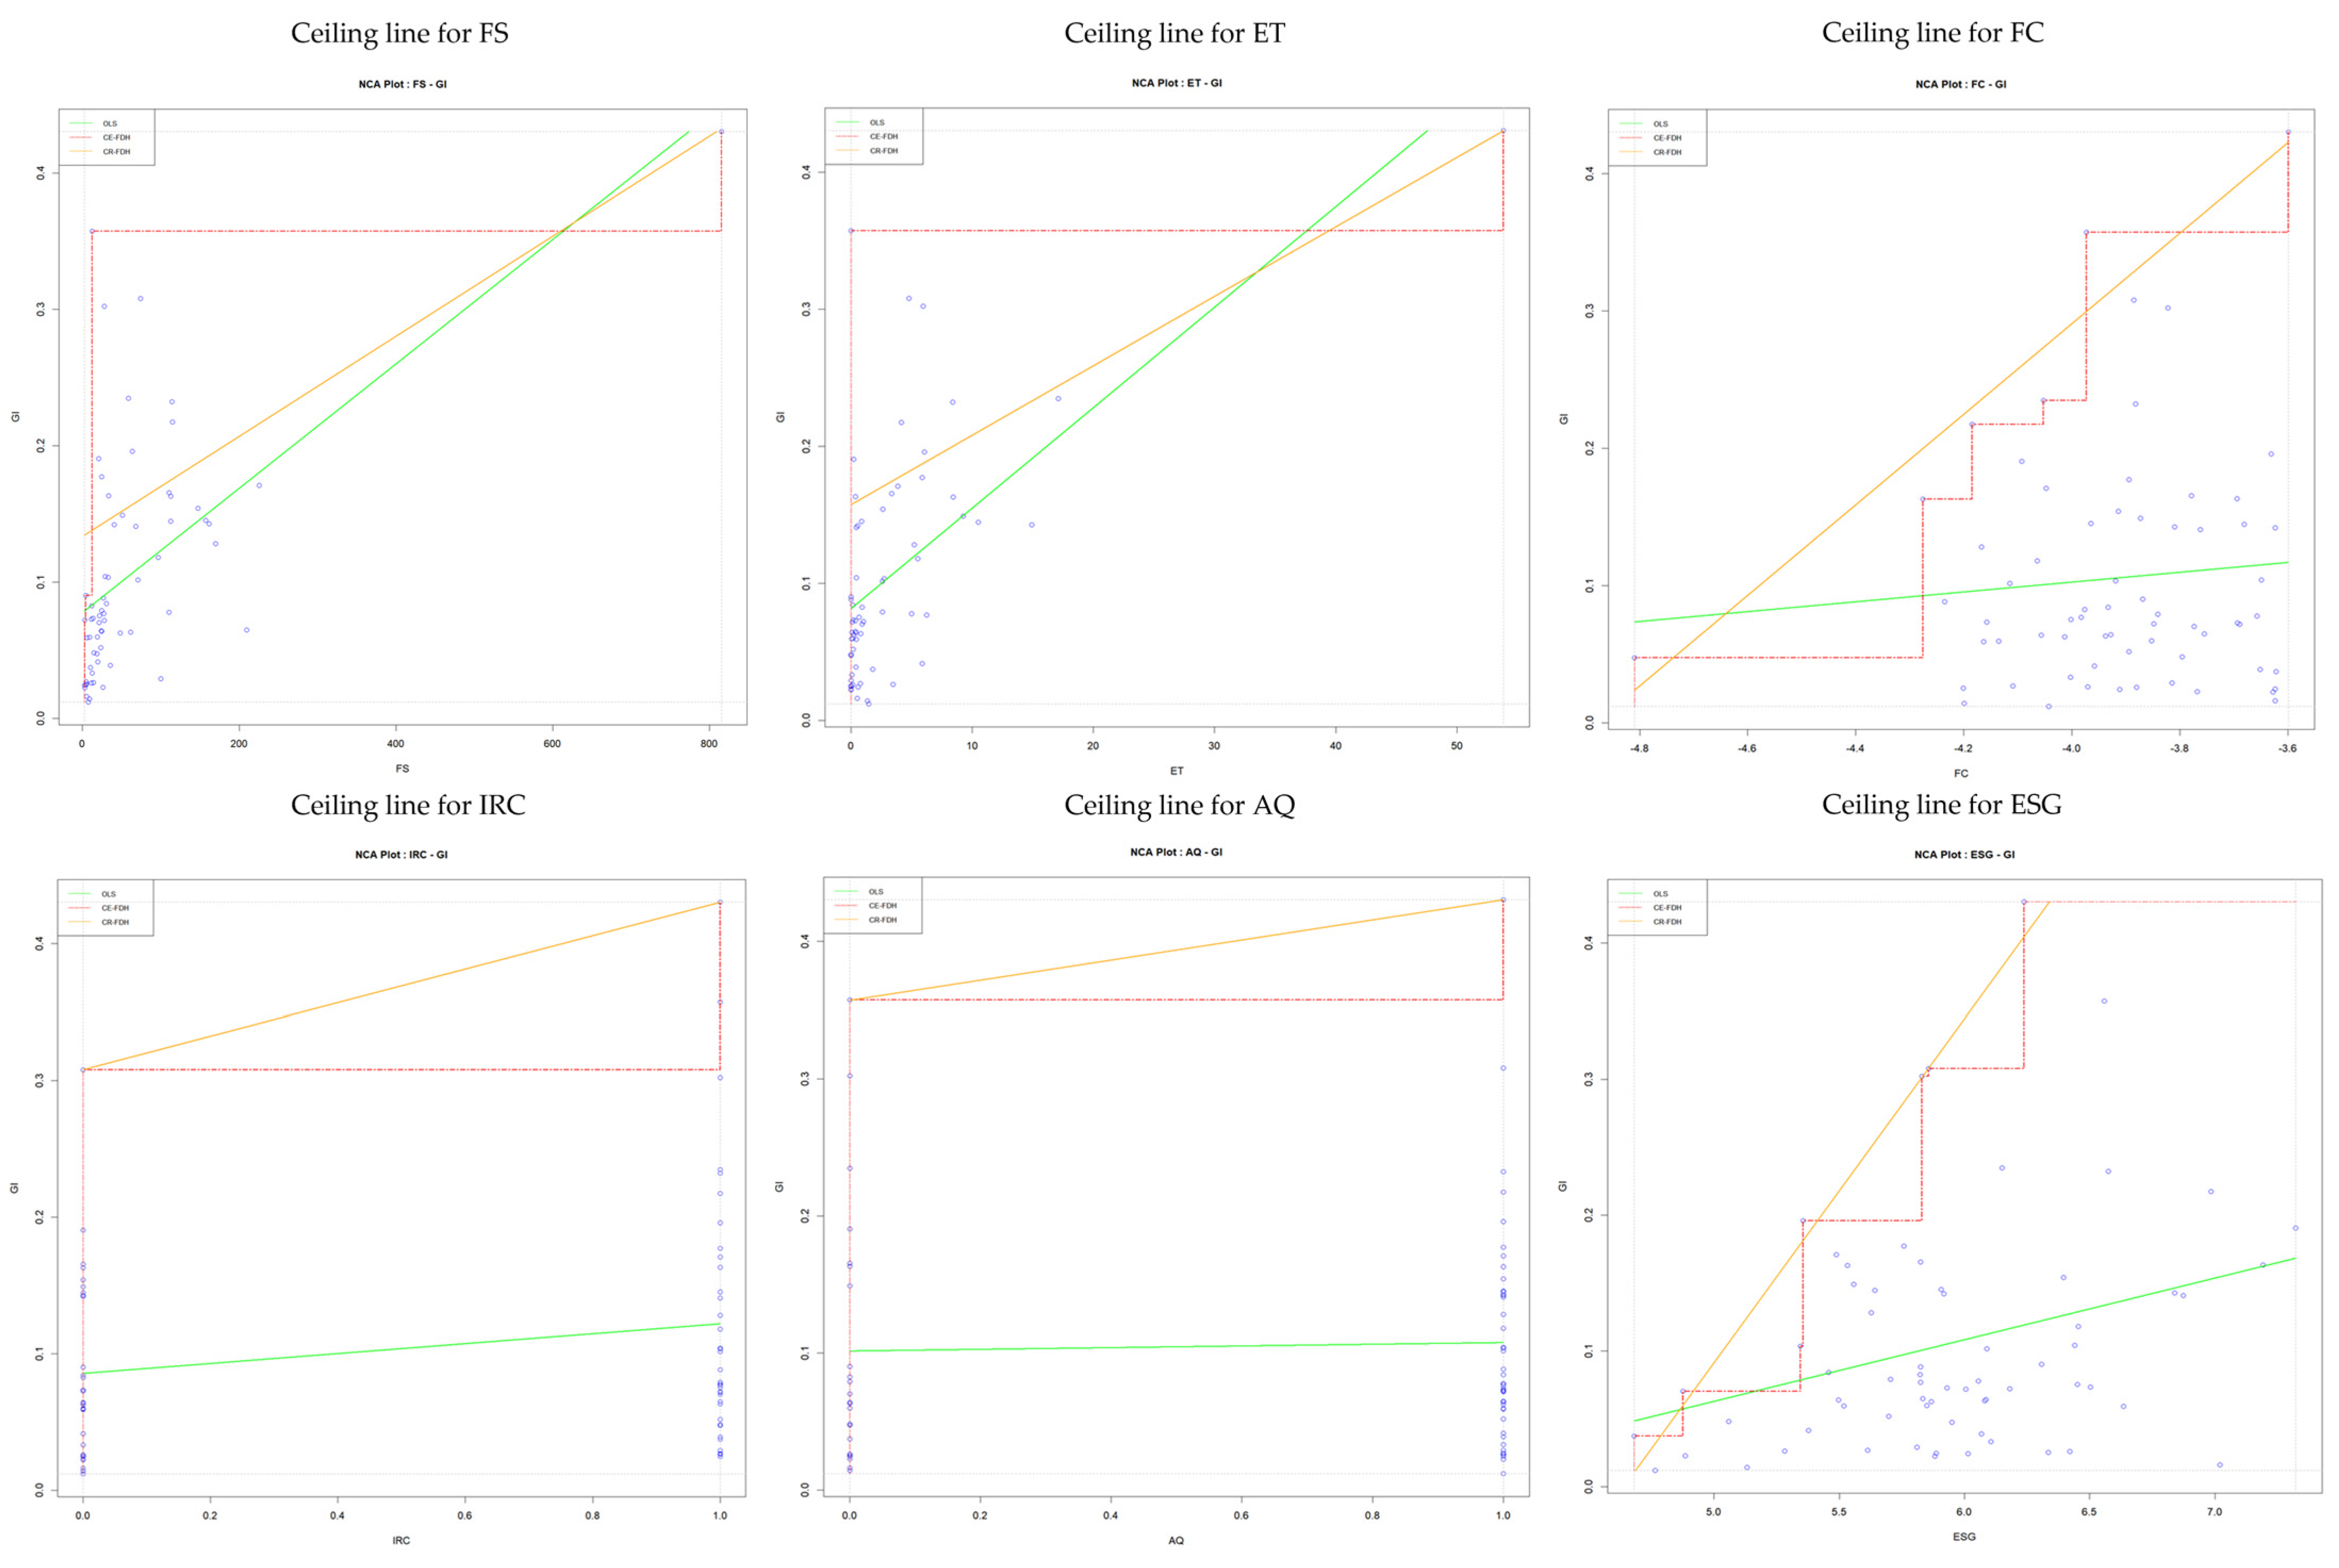
NCA utilizes empty spaces and effect sizes in scatter bottleneck plots to measure necessary conditions. An NCA plots a ceiling line at the top of the XY scatter plot, and the space above this ceiling line (i.e., the upper left corner) indicates that high levels of Y are not possible when X is low (Dul et al., 2020). NCA employs two techniques, CE-FDH and CR-FDH, to draw the ceiling line. The scatter bottleneck plots reflect whether and to what extent each antecedent condition affects green innovation investment quality. If there is an empty space in the upper left corner of the scatter bottleneck plot, it suggests that the condition might be necessary, and the larger the empty space, the greater its impact on green innovation investment quality. In Figure 2, the scatter bottleneck plots for fiscal subsidies (FS), environmental tax (ET), financing constraints (FC), and ESG scores (ESG) show empty spaces in the upper left corner, indicating significant constraints and impediments to green innovation investment quality. Therefore, a preliminary judgment is that these four antecedent conditions may be necessary conditions affecting green innovation investment quality. While scatter bottleneck plots provide a visually intuitive way to screen for necessary conditions, whether they are statistically significant requires further investigation into the effect sizes of each antecedent condition. NCA employs the degree of effect size to represent the constraining ability of a necessary condition on the outcome. For discrete and continuous variables, the effect size is determined through two methods: CE-FDH (Ceiling Envelopment with Free Disposal Hull) and CR-FDH (Ceiling Regression—Free Disposal Hull). In this analysis, the necessity of a condition is represented by its effect size, with general benchmarks for the magnitude of the effect size as follows: 0 ≤ d < 0.1 represents a “small effect”, 0.1 ≤ d < 0.3 is a “medium effect”, 0.3 ≤ d < 0.5 is a “large effect”, and d ≥ 0.5 is an “extremely strong effect”. The continuous variables in the antecedent conditions follow the CR method, while the discrete variables adhere to the CE method.
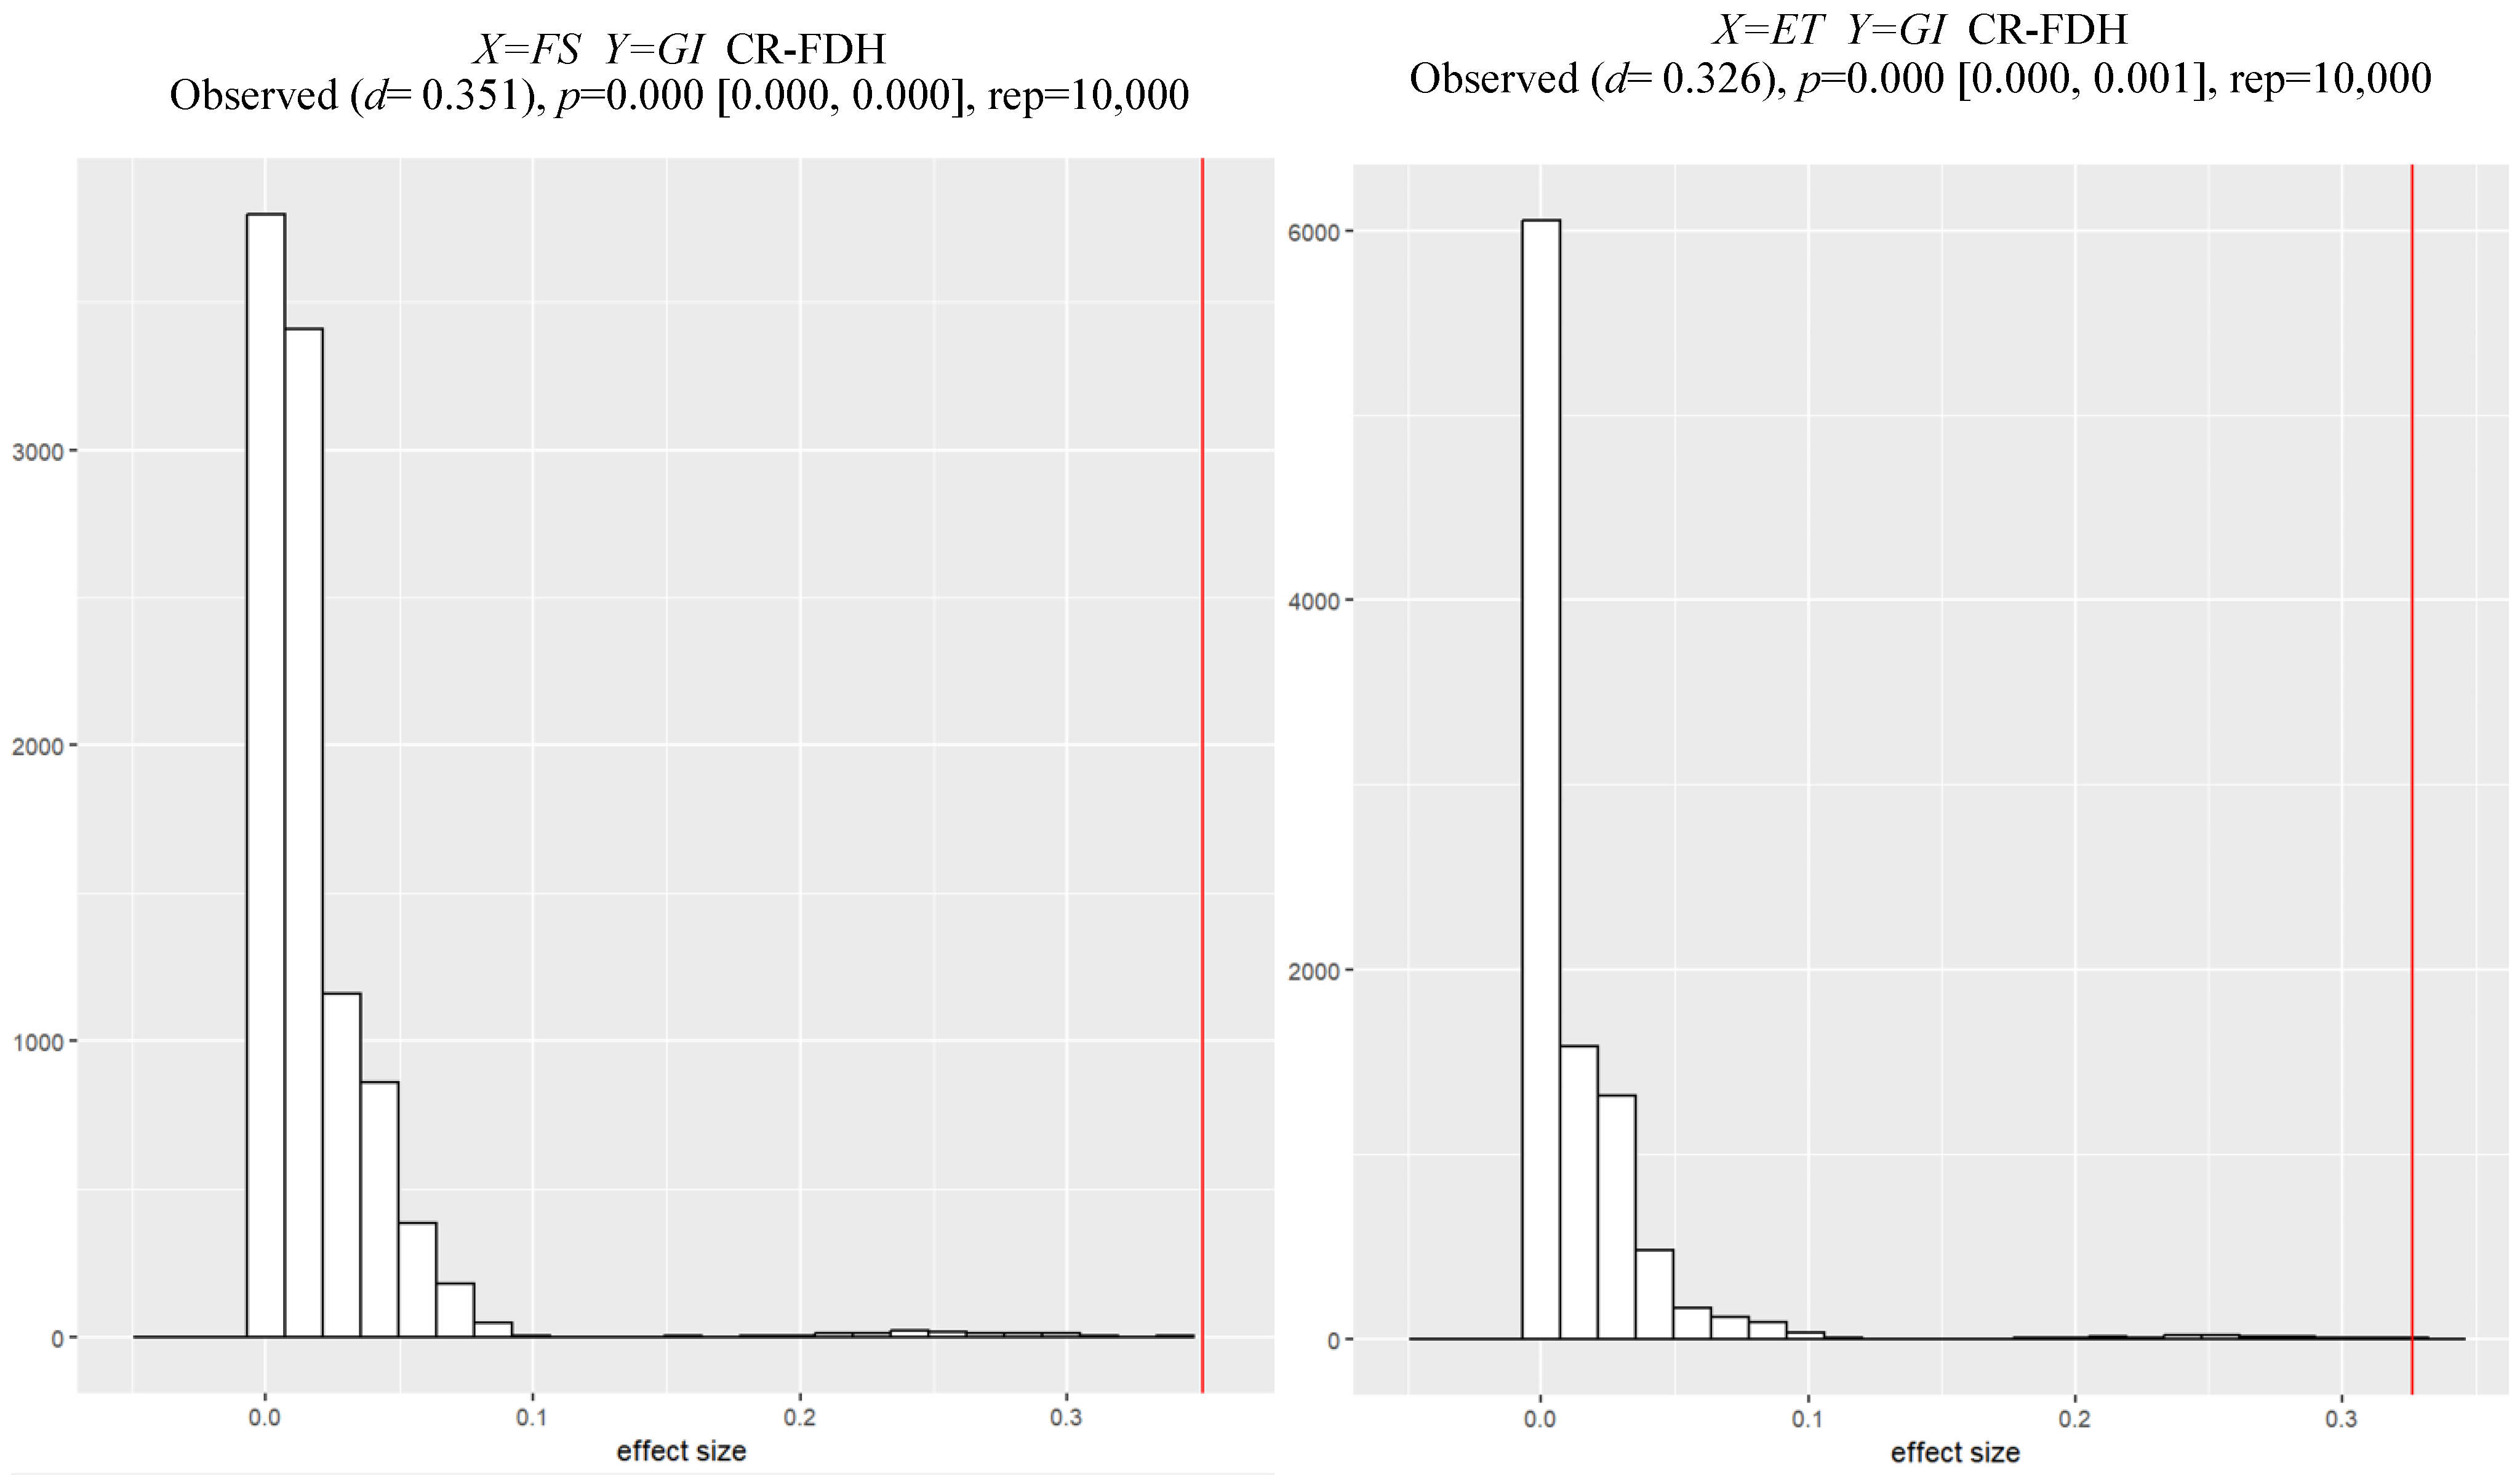
The NCA results (Table 4) show that, based on the threshold standards for effect size, fiscal subsidies (d = 0.351, p < 0.000) and environmental taxes (d = 0.326, p < 0.000) have a relatively large, mid-high level impact on green innovation investment quality. These impacts have also passed significance tests conducted through permutation test methods (see Figure 3). In the NCA permutation test analysis, this study set the number of permutation replications to 10,000. According to the three criteria for judging necessary conditions in NCA: theoretical support, d > 0.1, and p < 0.05 (Dul, 2016)—it can be concluded that fiscal subsidies and environmental taxes are necessary (but not sufficient) conditions for green innovation investment quality in heavily polluting enterprises. Other antecedent conditions do not constitute necessary conditions for green innovation investment quality. This analysis is largely consistent with the aforementioned fsQCA single-factor necessary condition analysis.
NCA not only allows for qualitative analysis of what conditions are necessary but also enables quantitative calculations of the correspondence between the levels of necessary conditions and the outcome. Table 5 further reports the bottleneck level (%) analysis results from the NCA method. The bottleneck table indicates the minimum level that each antecedent condition needs to reach for different outcome levels ranging from 0% to 100%.
As shown in Table 5, the ESG score is the first key condition that becomes a “bottleneck”. To achieve 60% green innovation investment quality, a 43.1% level of government subsidy, a 38.7% level of environmental tax, a 37.7% ESG score, and a 59.9% level of financing constraints are required. The remaining antecedent conditions do not form bottlenecks.
The NCA results establish that government subsidies and environmental taxes function as indispensable prerequisites for high-quality green innovation investment in heavily polluting firms. However, necessity does not imply sufficiency: even high levels of these prerequisites alone cannot ensure the outcome. The key question therefore becomes which additional conditions—across the quadruple-helix dimensions—must co-occur with these prerequisites to generate high-quality investment. To answer this question, the following fsQCA analysis focuses on configurational sufficiency, identifying alternative pathways that achieve the outcome while simultaneously satisfying the NCA-identified prerequisites, thereby providing an integrated explanation of both boundary conditions (necessity) and causal recipes (sufficiency).

4.2. Sufficiency Analysis of Condition Configurations

This study employs the fsQCA (version 3.0) software to perform configurational analysis on high versus non-high green innovation investment quality in heavily polluting manufacturing enterprises. Simultaneously, nomenclature is applied to each configuration attribute to elucidate its overarching thematic implication and holistic meaning (Furnari et al., 2021).

4.2.1. Drivers of High-Quality Green Innovation Investment

Before the sufficiency analysis of condition configurations, following established practice (Du & Kim, 2021), the initial consistency threshold is set to 0.80 and the PRI consistency threshold is set to 0.70. The minimum number of cases is defined as one. The analysis yields complex, parsimonious, and intermediate solutions. Nested relations between intermediate and parsimonious solutions help identify core and peripheral conditions. The results of the fsQCA analysis are presented in Table 6. The overall consistency of the solution is 0.91, signifying that among all the cases that satisfy these five configurations, 90.9% of the heavily polluting enterprises exhibit high-quality green innovation investment. Furthermore, as shown in Table 6, the consistency of each configuration surpasses the acceptable threshold of 0.75, thereby affirming the validity of the empirical analysis. The total coverage of the intermediate solutions is 0.57, indicating that the explained variance of all configurations is 57.1%. It is noteworthy that as the sample size for QCA research increases, lower levels of solution coverage are inevitable due to the study’s deductive nature. For instance, Mellewigt et al. (2018) had an overall solution coverage of 0.21 with 137 cases and six conditions; Garcia-Castro and Francoeur (2016) had an overall solution coverage of 0.051 with 1060 cases and six conditions; Gupta et al. (2020) had an overall solution coverage of 0.31 with 122 cases and seven conditions.
Based on these five potential condition configurations, further distinctions are identified among the differential adaptation relationships between the four sub-helices—government, enterprises, R&D institutions, and intermediary agencies—in elevating the quality level of corporate green innovation investment. According to the uniqueness of these five pathways and the holism of the configuration solutions (Furnari et al., 2021), the five pathways are clustered into three major categories based on the dimensions of their antecedent conditions, as follows:
Firstly, the “Government-Intermediary Dual-Drive Model”. This category encompasses configurations S1a, S1b, and S1c. The core conditions span both governmental and intermediary institutional levels. This model illustrates that heavily polluting enterprises, in a context where they have limited resources, can achieve a high-quality path for green innovation investment through dual-policy synergies provided by the government. This entails receiving substantial fiscal subsidies coupled with strict environmental regulations, and is further complemented by high-quality audits supplied by auditing agencies. The attainment of high-quality green innovation investment relies not only on supportive macro-level governmental policies but also benefits from the enterprises’ robust auditing quality. In the process of enhancing their own green innovation investment quality, companies focus on information dissemination, demonstrating high auditing quality to the public. They also actively engage in green innovation R&D activities and accelerate the commercialization of innovations, leveraging governmental policies. This proactive innovation model, which strategically utilizes fiscal subsidies to bolster R&D and green innovation while reducing environmental regulatory burdens and improving corporate image in the public eye, possesses strong driving forces for green innovation. Therefore, this driving model is termed the “Government-Intermediary Dual-Drive Model”.
Specifically, Configuration S1a refers to a green innovation investment path that centers on high auditing quality, high fiscal subsidies, and high environmental regulation, with low financing constraints serving as a supplementary condition. In this configuration, the presence or absence of active collaboration with research institutions and the level of ESG ratings have minimal impact on the green innovation investment quality. The implication of this configuration is that a high level of fiscal subsidies provides fertile ground for improving corporate green innovation investment quality. Given the low level of financing constraints, firms find themselves in an environment conducive to green innovation. Coupled with high auditing quality, this reduces information asymmetry and lessens resistance in the green innovation process. Both fiscal subsidies and environmental taxes synergistically encourage businesses to elevate their green innovation investment quality. The consistency of this configuration is 0.930, with a unique coverage of 0.018; the representative firms include Hubei Yihua and Xi’an Shares. As shown in the 2019–2023 annual reports of Hubei Yihua and Xi’an Shares, these firms channeled subsidy funds directly into high-value green R&D projects while maintaining strong audit transparency, thereby converting policy support into accelerated patent commercialization and demonstrating a clear mechanism of the Government–Intermediary Dual-Drive Model.
Configuration S1b still revolves around core conditions of high auditing quality, high fiscal subsidies, and high environmental regulation. A supplementary condition here is high collaboration with research institutions. This configuration further elucidates that firms, under high fiscal subsidies, high environmental taxes, and high auditing quality, can achieve high-quality green innovation investment when actively collaborating with research institutes. In this scenario, the synergy between fiscal subsidies and environmental taxes, along with high-quality audits, mitigates information asymmetry. Concurrently, firms actively cooperate with research institutions for mutual benefit, facilitating innovation and the transition of technological achievements. The consistency of this pathway is 0.909, with a unique coverage of 0.057; the typical firms in this configuration include Wanhua Chemicals and Huayi Group. As evidenced in the 2019–2023 annual reports of Wanhua Chemicals and Huayi Group, these companies leveraged research partnerships to accelerate technology transfer and commercialization, illustrating how the addition of industry–research cooperation creates a complementary pathway that further amplifies policy-driven innovation outcomes.
Configuration S1c centers around the core conditions of high auditing quality, high fiscal subsidies, and high environmental regulations, with low ESG ratings serving as a supplementary condition. This configuration suggests that even when a company’s ESG rating is low, high-quality green innovation investment paths can still be achieved under conditions of high environmental regulations, high auditing quality, and substantial fiscal subsidies. The consistency of this path is 0.924, with a unique coverage of 0.039; typical firms include Yangmei Chemical and Zhongtai Chemical.
Comparing configurations S1a, S1b, and S1c, all three have the same core conditions, differing only in supplementary conditions. The low financing constraints in S1a, the high collaboration with research institutes in S1b, and the low ESG rating in S1c create a substitutive relationship. A comparison of S1a, S1b, and S1c reveals that policy support and regulations are crucial external factors affecting the green innovation investment quality in heavily polluting firms, indicating a substantial influence of external macroeconomic factors.
In Configuration S2, the core conditions for achieving high-quality green innovation investment are high audit quality, high environmental regulation, low ESG (Environmental, Social, and Governance) levels, and high financing constraints. The supplementary condition is strong cooperation with research institutions. This configuration suggests that, when companies face financing constraints, a combination of high environmental regulation, high audit quality, and proactive collaboration with research institutions can mitigate these constraints and promote green innovation. In this scenario, the level of fiscal subsidies does not significantly affect the pathway to high-quality green innovation investment.
The implication is that due to the higher risks associated with green innovation, along with the uncertainty of returns and information asymmetry, companies undertaking green innovation activities face high financing constraints. However, when faced with these financial pressures, companies need to break away from traditional innovation models and fully utilize available resources to move towards a more efficient green innovation pathway. Moreover, the pressure from environmental regulation compels firms to actively engage in green innovation. Collaboration with research institutions reduces information asymmetry risks to some extent, alleviating financing constraints. High audit quality ensures transparency and constrains short-term behavior from the management, thus promoting high-quality green innovation. The consistency of this path is 0.936, with a unique coverage of 0.014; typical companies following this path are Zhongtai Chemical and Yili Clean Energy.
Third, the “Government-Business Collaborative Model”. This type includes Configuration S3, with core conditions covering macro policies and resource sharing between businesses and R&D institutions. This model reflects that heavily polluting companies, even when not actively seeking collaboration with research institutions, can achieve high-quality green innovation investment when they receive substantial fiscal subsidies and are subject to strict environmental regulations. Hence, this driving model is named the “Government-Business Collaborative Model”.
In Configuration S3, the core conditions for producing high-quality green innovation investment are high fiscal subsidies, high environmental regulation, and lack of cooperation with research institutions. Supplementary conditions are low audit quality and high financing constraints. Configuration S3 suggests that even when businesses lack cooperation with research institutions and face high financing constraints and low audit quality, high fiscal subsidies and strict environmental regulations can still improve the green innovation investment quality. The implication of Configuration S3 is that even when businesses lack cooperation with research institutions and face high financing constraints and low audit quality, high fiscal subsidies and strict environmental regulations can still improve green innovation investment quality. The consistency of this path is 0.949, with unique coverage of 0.07; typical companies following this path are Huabang Health and Yuntianhua.

4.2.2. Mechanisms Driving the Quality of Non-High Green Innovation Investment

To explore the causally asymmetric nature of the green innovation investment quality, specifically, that the factors leading to high-quality green innovation investment among heavily polluting manufacturing firms may not necessarily be the reasons behind low-quality green innovation investment, this paper examines the non-aggregate elements of factor configurations responsible for high-quality green innovation investment in heavily polluting enterprises. The investigation yields six distinct pathways (details available upon request due to space limitations), broadly categorized into two types, as follows:
Type I: “Resource-Scarce Configuration”. This category includes Configurations NS1a, NS1b, NS3, and NS4. Specifically:
Configuration NS1a is characterized by low enterprise-research collaboration and low fiscal subsidies, with low environmental taxation as a peripheral condition. Audit quality, ESG scores, and financial constraints are optional conditions. This suggests that these firms face insufficient benefits from national subsidy policies and lack financial resources. Although subjected to lower environmental regulations, they do not actively seek collaboration with research institutes, resulting in a suboptimal level of green innovation investment quality.
Compared to NS1a, Configuration NS1b varies primarily in its marginal conditions, including low ESG scores and low financial constraints, with environmental taxation being optional.
Configuration NS4, much like NS1a, faces insufficient fiscal subsidies and low environmental taxes. However, these firms also lack in audit quality, making it difficult to attract external funding, thus leading to inferior green innovation investment quality.
Configuration NS3 is marked by low fiscal subsidies, low ESG scores, and low audit quality. Peripheral conditions include enterprise-research collaboration and a relatively high level of environmental taxation. Compared to NS1a, these heavily polluting firms face even more adverse macro-environmental conditions and transmit unfavorable information, failing to meet public expectations for compliance, thus resulting in low green innovation investment quality.
Comparing these pathways reveals that if heavily polluting manufacturing firms operate in a resource-scarce environment and are not proactive in seeking solutions, they will convey negative information to external stakeholders, resulting in a low green innovation investment quality.
Type II: “Regulatory Constraint Configuration”. This category comprises Configurations NS2a and NS2b. Specifically:
Configuration NS2a is marked by low levels of environmental regulations and low ESG scores, with enterprise-research collaboration and financial constraints as peripheral conditions. The role of fiscal subsidies and audit quality in green innovation investment quality is inconsequential. These heavily polluting manufacturing firms face low environmental regulations but also have low ESG scores, which transmit unfavorable signals detrimental to external fundraising efforts. Coupled with financial constraints, there is insufficient funding available for green innovation, resulting in low-quality green innovation investment.
Compared to NS2a, Configuration NS2b differs in its peripheral conditions of low-level enterprise-research collaboration, low-degree financial constraints, and high audit quality. These firms, despite their resource constraints, do not seek collaboration with research institutes, making it difficult to achieve high-quality green innovation investment through their own capabilities alone.

4.2.3. Robustness Checks

The study conducts robustness checks for the configurations leading to high-quality green innovation investment from the following two aspects:
First, Increasing the Thresholds for Subset Consistency and PRI. The levels of consistency may differ due to varying calibration anchors, potentially altering the final results. To assess the robustness of the QCA results, the procedure proposed by Greckhamer et al. (2018) is applied by shifting the crossover points of the causal conditions and raising the consistency thresholds. Specifically, the subset consistency threshold is increased from 0.80 to 0.85 and the PRI consistency threshold from 0.70 to 0.75. The resulting solutions closely match the configurations identified in the main sufficiency analysis, supporting the robustness of the findings.
Second, Changing the Calculation Method for the Outcome. The method for calculating the outcome was switched from an entropy-based method to an Entropy-Weighted TOPSIS method for measurement. After recalibrating the green innovation investment quality in enterprises using the Entropy-Weighted TOPSIS method, the analysis was reconducted. The Entropy-Weighted TOPSIS method considers the correlation between attributes and more accurately assesses the merits and demerits of the decision-making objects. Based on the entropy method to determine the weights and scores, the TOPSIS method is subsequently applied to calculate the outcome, which is then inputted into fsQCA. The configurations outputted in the final robustness check remain substantively unchanged when compared to the original configurations, thereby confirming the robustness of the results.

5. Discussion, Implications, and Future Prospects

5.1. Discussion and Main Findings

Building on innovation ecosystem theory and a configurational perspective, this study integrates Necessary Condition Analysis (NCA) and fuzzy set Qualitative Comparative Analysis (fsQCA) to explain why some heavily polluting manufacturing firms achieve high-quality green innovation investment while others do not. The evidence indicates that green innovation investment quality is not driven by any single “best practice”; instead, it emerges from complementary bundles of policy support, regulatory pressure, governance credibility, collaborative capabilities, and financial slack/constraints.
First, the necessity assessments underscore the enabling role of the macro-policy environment. Fiscal subsidies and environmental taxes show strong constraining power in the NCA results, suggesting that a minimum intensity of policy support and/or regulatory pressure is often required before firms can consistently reach high green innovation investment quality. This pattern is consistent with prior work showing that public support can mitigate the risk and long payback period of green R&D, while regulatory instruments shape firms’ innovation incentives in pollution-intensive sectors (e.g., Howell, 2017; Jin et al., 2018).
Second, the fsQCA findings reveal equifinality: multiple configurations can generate high-quality green innovation investment. One set of pathways is characterized by strong external support (e.g., subsidies) combined with credible governance and sustainability signals (high audit quality and stronger ESG performance), which together reduce information asymmetry, improve stakeholder confidence, and ease access to capital. Another set of pathways relies more heavily on innovation-network resources, where enterprise–research collaboration compensates for resource gaps by enhancing knowledge access, absorptive capacity, and project execution. These results extend the innovation ecosystem logic by showing that policy, market, and knowledge actors can substitute or complement each other depending on the firm’s internal constraints (Hutter et al., 2018).
Third, the analysis confirms causal asymmetry. These findings advance the literature by revealing configurational complexity that linear and single-actor studies have overlooked. Unlike variance-based analyses that report uniform positive effects of fiscal subsidies (Z. Wang et al., 2022; Xia et al., 2022) or ambiguous impacts of environmental taxes (Ambec & Barla, 2002; Clarkson et al., 2004), the NCA in this study establishes subsidies and taxes as indispensable bottlenecks, while fsQCA uncovers three equifinal high-quality pathways and two distinct non-high pathways. This extends Triple Helix research focused on government–enterprise–research interactions (Etzkowitz & Leydesdorff, 2000; Chen et al., 2018) by empirically validating the added value of intermediary organizations (audit quality and ESG ratings) in the Quadruple Helix. Compared with recent fsQCA studies on heavily polluting industries, which emphasize talent or technology-organization-environment (TOE) configurations (Guo et al., 2025), the integrated NCA–fsQCA approach of this study uniquely incorporates governance credibility and policy anchors as core/peripheral conditions, demonstrating how macro-level instruments and micro-level monitoring jointly overcome resource scarcity and regulatory constraints in pollution-intensive sectors (Fiss, 2011; Greckhamer & Gur, 2021).
Taken together, the findings suggest a practical message: high-quality green innovation investment in heavily polluting manufacturing firms is most likely when a minimum macro-level enabling environment is present and firms combine external policy/regulatory conditions with internal governance and collaborative capabilities. Conversely, policy pressure alone is insufficient when firms lack collaboration resources, credible ESG/audit signals, or financial resilience.

5.2. Implications for Theory and Practice

Theoretical implications. This study contributes to the green innovation and sustainable finance literature in three ways. First, by combining NCA and fsQCA, it differentiates conditions that function as “bottlenecks” (necessary) from those that form complementary ingredients in sufficient configurations. This helps address a common limitation in linear approaches that treat all predictors as symmetric and independent. Second, the results refine innovation ecosystem theory by empirically showing how policy instruments (subsidies and environmental taxes), governance credibility (audit quality), sustainability signals (ESG performance), collaborative ties (enterprise–research collaboration), and financial constraints co-evolve as mutually reinforcing elements. Third, the documented asymmetry between high- and low-quality pathways provides a more realistic depiction of green innovation investment decisions under complex institutional and market conditions.
Managerial and policy recommendations. The configurational evidence indicates that “one-size-fits-all” interventions are unlikely to work. Accordingly, the following recommendations target the most common leverage points identified in the high-quality pathways:
At the policy level, authorities can improve the effectiveness of green innovation policies by: (1) maintaining stable and transparent subsidy frameworks to reduce uncertainty for long-horizon green R&D; (2) deploying environmental taxes and related instruments in a predictable and differentiated way to avoid unintended “compliance-only” responses; and (3) strengthening ESG disclosure and assurance infrastructure (including audit quality and standardized reporting) so that capital markets can better price sustainability signals and reduce firms’ financing constraints.
At the firm level, executives in heavily polluting industries should treat green innovation investment quality as a system outcome. Firms can: (1) improve ESG governance and information credibility (e.g., higher audit quality, more consistent environmental disclosure) to reduce information asymmetry and ease financing constraints; (2) deepen enterprise–research collaboration to access frontier knowledge and raise absorptive capacity; and (3) align green innovation project portfolios with regulatory trajectories, prioritizing technologies with measurable environmental and economic returns to prevent green investment from becoming symbolic or fragmented.

5.3. Limitations and Future Research Directions

Despite its contributions, the study acknowledges several limitations that warrant caution. First, while the Quadruple Helix framework provides a systemic lens, the research recognizes the potential influence of unobserved confounding variables. Specifically, factors such as internal organizational culture, top management’s environmental cognition, and localized digital infrastructure were not included as antecedent conditions. The research acknowledges that these omitted variables might interact with the identified configurations, potentially acting as confounding factors that influence the strength of the G–E–R–I spirals’ impact on GIIQ. Second, the analysis focuses exclusively on heavily polluting manufacturing firms in China. While this specific context is critical for understanding high-impact polluters, the current study admits that the findings may be subject to contextual confounding from region-specific industrial policies or market competition levels that vary across different emerging economies. Third, although robustness checks were conducted, the results remain sensitive to calibration choices and consistency thresholds. The study notes that the operationalization of collaboration and ESG performance inevitably simplifies complex constructs, which may not capture the qualitative depth of interpersonal ties or specific governance mechanisms. Fourth, although the entropy-weighted method offers an objective composite measure of green innovation investment quality, it aggregates conceptually distinct input and output dimensions. In rare cases of high-input/low-output versus low-input/high-output scenarios, the index may assign similar scores despite differing economic implications. Future studies could therefore employ frontier efficiency methods such as stochastic frontier analysis or data envelopment analysis (DEA) to separately evaluate input–output efficiency.
Future research can extend this work in at least four directions. (1) Broaden external validity by comparing configurations across countries, regulatory regimes, or different categories of high-emission industries. (2) Use longitudinal designs to examine how configurations evolve over time and whether firms transition between high- and low-quality pathways as policy conditions and internal capabilities change. (3) Refine measurement by incorporating more granular project-level green innovation data and richer indicators of collaboration governance and ESG credibility. (4) Explore additional contextual moderators, such as digitalization, supply chain position, and market competition, to clarify when policy instruments complement versus substitute for firm-level capabilities.

Author Contributions

Conceptualization, P.W. and J.L.; methodology, M.F.; software, J.L.; validation, P.W. and M.F.; formal analysis, J.L.; investigation, P.W.; resources, S.W.; data curation, M.F.; writing—original draft preparation, P.W.; writing—review and editing, S.W.; visualization, M.F.; supervision, M.F.; project administration, S.W.; funding acquisition, S.W. All authors have read and agreed to the published version of the manuscript.

Funding

Humanities and Social Science Fund of Ministry of Education of China (25YJA790065); Tianjin Science and Technology Plan Project (25ZLRKZL00040).

Institutional Review Board Statement

Not applicable.

Informed Consent Statement

Not applicable.

Data Availability Statement

The data presented in this study are available upon request from the corresponding author.

Conflicts of Interest

The authors declare no conflicts of interest.

References

  1. Ambec, S., & Barla, P. (2002). A theoretical foundation of the porter hypothesis. Economics Letters, 75(3), 355–360. [Google Scholar] [CrossRef]
  2. Barney, J. B., Ketchen, D. J., Jr., & Wright, M. (2021). Resource-based theory and the value creation framework. Journal of Management, 47(7), 1936–1955. [Google Scholar] [CrossRef]
  3. Bellucci, A., Pennacchio, L., & Zazzaro, A. (2019). Public R&D subsidies: Collaborative versus individual place-based programs for SMEs. Small Business Economics, 52(6), 213–240. [Google Scholar] [CrossRef]
  4. Cappelen, A., Raknerud, A., & Rybalka, M. (2012). The effects of R&D tax credits on patenting and innovations. Research Policy, 41(2), 334–345. [Google Scholar] [CrossRef]
  5. Chen, L., Li, Y., & Fan, D. (2018). How do emerging multinationals configure political connections across institutional contexts? Global Strategy Journal, 8(3), 447–470. [Google Scholar] [CrossRef]
  6. Choi, J.-H., & Wong, T. J. (2007). Auditors’ governance functions and legal environments: An international investigation. Contemporary Accounting Research, 24(1), 13–46. [Google Scholar] [CrossRef]
  7. Clarkson, P. M., Li, Y., & Richardson, G. D. (2004). The market valuation of environmental capital expenditures by pulp and paper companies. The Accounting Review, 79(2), 329–353. [Google Scholar] [CrossRef]
  8. Cui, G. (2024). How do environmental taxes affect the environmental investment of high-emission enterprises: Evidence from China. Journal of Environmental Management, 370, 122629. [Google Scholar] [CrossRef]
  9. Douglas, E. J., Shepherd, D. A., & Prentice, C. (2020). Using fuzzy-set qualitative comparative analysis for a finer-grained understanding of entrepreneurship. Journal of Business Venturing, 35(1), 105970. [Google Scholar] [CrossRef]
  10. Du, Y., & Kim, P. H. (2021). One size does not fit all: Strategy configurations, complex environments, and new venture performance in emerging economies. Journal of Business Research, 124, 272–285. [Google Scholar] [CrossRef]
  11. Dul, J. (2016). Identifying single necessary conditions with NCA and fsQCA. Journal of Business Research, 69(4), 1516–1523. [Google Scholar] [CrossRef]
  12. Dul, J., Van der Laan, E., & Kuik, R. (2020). A statistical significance test for necessary condition analysis. Organizational Research Methods, 23(2), 385–395. [Google Scholar] [CrossRef]
  13. Duran, M. S., Bozkaya, Ş., Rehman, M. Z., & Hossain, M. E. (2024). Are green innovation, green energy and green manufacturing successful in promoting ecological development? Evidence from G-20 countries. Environment, Development and Sustainability, 1–25. [Google Scholar] [CrossRef]
  14. Etzkowitz, H., & Leydesdorff, L. (2000). The dynamics of innovation: From national systems and “Mode 2” to a triple helix of university–industry–government relations. Research Policy, 29(2), 109–123. [Google Scholar] [CrossRef]
  15. Fainshmidt, S., Witt, M. A., Aguilera, R. V., & Verbeke, A. (2020). The contributions of qualitative comparative analysis (QCA) to international business research. Journal of International Business Studies, 51, 455–466. [Google Scholar] [CrossRef]
  16. Feng, Y., Chen, H., Chen, Z., Wang, Y., & Wei, W. (2021). Has environmental information disclosure eased the economic inhibition of air pollution? Journal of Cleaner Production, 284, 125412. [Google Scholar] [CrossRef]
  17. Fernandes, C. I., Veiga, P. M., Ferreira, J. J., & Hughes, M. (2021). Green growth versus economic growth: Do sustainable technology transfer and innovations lead to an imperfect choice? Business Strategy and the Environment, 30(4), 2021–2037. [Google Scholar] [CrossRef]
  18. Fiss, P. C. (2011). Building better causal theories: A fuzzy set approach to typologies in organization research. Academy of Management Journal, 54(2), 393–420. [Google Scholar] [CrossRef]
  19. Furnari, S., Crilly, D., Misangyi, V. F., Greckhamer, T., Fiss, P. C., & Aguilera, R. V. (2021). Capturing causal complexity: Heuristics for configurational theorizing. Academy of Management Review, 46(4), 778–799. [Google Scholar] [CrossRef]
  20. Garcia-Castro, R., & Francoeur, C. (2016). When more is not better: Complementarities, costs and contingencies in stakeholder management. Strategic Management Journal, 37(2), 406–424. [Google Scholar] [CrossRef]
  21. Greckhamer, T., Furnari, S., Fiss, P. C., & Aguilera, R. V. (2018). Studying configurations with qualitative comparative analysis: Best practices in strategy and organization research. Strategic Organization, 16(4), 482–495. [Google Scholar] [CrossRef]
  22. Greckhamer, T., & Gur, F. A. (2021). Disentangling combinations and contingencies of generic strategies: A set-theoretic configurational approach. Long Range Planning, 54(2), 101951. [Google Scholar] [CrossRef]
  23. Guo, M., Yan, M., Yan, X., & Li, Y. (2025). Systemic configurations of functional talent for green technological innovation: A fuzzy-set QCA study. Systems, 13(7), 604. [Google Scholar] [CrossRef]
  24. Gupta, K., Crilly, D., & Greckhamer, T. (2020). Stakeholder engagement strategies, national institutions, and firm performance: A configurational perspective. Strategic Management Journal, 41(10), 1869–1900. [Google Scholar] [CrossRef]
  25. Hottenrott, H., & Peters, B. (2012). Innovative capability and financing constraints for innovation: More money, more innovation? Review of Economics and Statistics, 94(4), 1126–1142. [Google Scholar] [CrossRef]
  26. Hou, B., Hong, J., Chen, Q., Shi, X., & Zhou, Y. (2019). Do academia-industry R&D collaborations necessarily facilitate industrial innovation in China? The role of technology transfer institutions. European Journal of Innovation Management, 22(5), 717–746. [Google Scholar] [CrossRef]
  27. Howell, A. (2017). Picking ‘winners’ in China: Do subsidies matter for indigenous innovation and firm productivity? China Economic Review, 44, 154–165. [Google Scholar] [CrossRef]
  28. Hutter, M., Knoblauch, H., Rammert, W., & Windeler, A. (2018). Innovation society today: The reflexive creation of novelty. In Innovation society today: Perspectives, fields, and cases (pp. 13–31). Springer VS. [Google Scholar] [CrossRef]
  29. International Energy Agency. (2024). World energy investment 2024. Available online: https://www.iea.org/reports/world-energy-investment-2024 (accessed on 1 February 2026).
  30. Islam, M. S. (2025). Linking green innovation to environmental quality in Saudi Arabia: An application of the NARDL approach. Environment, Development & Sustainability, 27(8), 19741. [Google Scholar] [CrossRef]
  31. Jin, Z., Shang, Y., & Xu, J. (2018). The impact of government subsidies on private R&D and firm performance: Does ownership matter in China’s manufacturing industry? Sustainability, 10(7), 2205. [Google Scholar] [CrossRef]
  32. Jones, G., Fleming, S., & Laugharne, J. (2020). The challenge of enterprise/innovation: A case study of a modern university. Journal of Further and Higher Education, 44(1), 126–142. [Google Scholar] [CrossRef]
  33. Jovanovic, J., & Morschett, D. (2022). Under which conditions do manufacturing companies choose FDI for service provision in foreign markets? An investigation using fsQCA. Industrial Marketing Management, 104, 38–50. [Google Scholar] [CrossRef]
  34. Kim, J. W., & Park, C. K. (2023). Can ESG performance mitigate information asymmetry? Moderating effect of assurance services. Applied Economics, 55(26), 2993–3007. [Google Scholar] [CrossRef]
  35. Kumar, S., Sahoo, S., Lim, W. M., Kraus, S., & Bamel, U. (2022). Fuzzy-set qualitative comparative analysis (fsQCA) in business and management research: A contemporary overview. Technological Forecasting and Social Change, 178, 121599. [Google Scholar] [CrossRef]
  36. Li, G. Q., Xue, Q., & Qin, J. H. (2022). Environmental information disclosure and green technology innovation: Empirical evidence from China. Technological Forecasting and Social Change, 176(1), 121453. [Google Scholar] [CrossRef]
  37. Li, J., & Ibrahim, H. (2024). Executive green perception and green innovation improve new quality productivity in Chinese listed firms. International Journal of Financial Studies, 12(4), 102. [Google Scholar] [CrossRef]
  38. Linnenluecke, M. K., Verreynne, M. L., de Villiers Scheepers, M. J., & Venter, C. (2017). A review of collaborative planning approaches for transformative change towards a sustainable future. Journal of Cleaner Production, 142, 3212–3224. [Google Scholar] [CrossRef]
  39. Liu, X., Liu, F., & Ren, X. (2023). Firms’ digitalization in manufacturing and the structure and direction of green innovation. Journal of Environmental Management, 335, 117525. [Google Scholar] [CrossRef]
  40. Lokshin, B., & Mohnen, P. (2012). How effective are level-based R&D tax credits? Evidence from the Netherlands. Applied Economics, 44(12), 1527–1538. [Google Scholar] [CrossRef]
  41. Madani, M. A., Mannai, B., & Ben Ameur, H. (2026). Institutional quality and financial development as keys to green tech innovation: New global evidence. Financial Review, 61(1), 261–278. [Google Scholar] [CrossRef]
  42. McKenny, A. F., Short, J. C., Ketchen, D. J., Jr., Payne, G. T., & Moss, T. W. (2018). Strategic entrepreneurial orientation: Configurations, performance, and the effects of industry and time. Strategic Entrepreneurship Journal, 12(4), 504–521. [Google Scholar] [CrossRef]
  43. Mellewigt, T., Hoetker, G., & Lütkewitte, M. (2018). Avoiding high opportunism is easy, achieving low opportunism is not: A QCA study on curbing opportunism in buyer–supplier relationships. Organization Science, 29(6), 1208–1228. [Google Scholar] [CrossRef]
  44. Ministry of Ecology and Environment of China. (2010). Public consultation on the Guidelines for environmental information disclosure of listed companies. Available online: https://www.mee.gov.cn/gkml/sthjbgw/qt/201009/t20100914_194484.htm (accessed on 1 February 2026). (In Chinese)
  45. Patanakul, P., & Pinto, J. K. (2014). Examining the roles of government policy on innovation. The Journal of High Technology Management Research, 25(2), 97–107. [Google Scholar] [CrossRef]
  46. Peng, R., & Zeng, B. (2025). Digital financial inclusion and inclusive green growth: Evidence from China’s green growth initiatives. International Journal of Financial Studies, 13(1), 2. [Google Scholar] [CrossRef]
  47. Ragin, C. C. (2000). Fuzzy-set social science. University of Chicago Press. [Google Scholar] [CrossRef]
  48. Ranta, V., Aarikka-Stenroos, L., & Väisänen, J. M. (2021). Digital technologies catalyzing business model innovation for circular economy—Multiple case study. Resources, Conservation and Recycling, 164, 105155. [Google Scholar] [CrossRef]
  49. Rio, D. P., Carrillo-Hermosilla, J., & Konnola, T. (2010). Policy strategies to promote eco-innovation: An integrated framework. Journal of Industrial Ecology, 14(4), 541–557. [Google Scholar] [CrossRef]
  50. Shleifer, A., & Vishny, R. W. (1994). Politicians and firms. Quarterly Journal of Economics, 109(4), 995–1025. [Google Scholar] [CrossRef]
  51. Tan, Y., & Zhu, Z. (2022). The effect of ESG rating events on corporate green innovation in China: The mediating role of financial constraints and managers’ environmental awareness. Technology in Society, 68, 101906. [Google Scholar] [CrossRef]
  52. Wan, Q., Ye, J., Zheng, L., Tan, Z., & Tang, S. (2023). The impact of government support and market competition on China’s high-tech industry innovation efficiency as an emerging market. Technological Forecasting and Social Change, 192, 122585. [Google Scholar] [CrossRef]
  53. Wang, F., Han, H., & Zhao, J. (2026). Does the strengthened monitoring policy for key polluting enterprises induce China’s green innovation? Energy & Environment, 37(1), 170–195. [Google Scholar] [CrossRef]
  54. Wang, M., Li, Y., Li, J., & Wang, Z. (2021). Green process innovation, green product innovation and its economic performance improvement paths: A survey and structural model. Journal of Environmental Management, 297, 113282. [Google Scholar] [CrossRef]
  55. Wang, Y. B., Li, J. Z., & Furman, J. L. (2017). Firm performance and state innovation funding: Evidence from China’s innofund program. Research Policy, 46(6), 1142–1161. [Google Scholar] [CrossRef]
  56. Wang, Z. (2022). Digital finance, financing constraint and enterprise financial risk. Journal of Mathematics, 2022(1), 2882113. [Google Scholar] [CrossRef]
  57. Wang, Z., Li, X., Xue, X., & Liu, Y. (2022). More fiscal subsidies, more green innovation? The evidence from Chinese new energy vehicle enterprises. Renewable Energy, 197, 11–21. [Google Scholar] [CrossRef]
  58. Wei, L., Lin, B., Zheng, Z., Wu, W., & Zhou, Y. (2023). Does fiscal expenditure promote green technological innovation in China? Evidence from Chinese cities. Environmental Impact Assessment Review, 98, 106945. [Google Scholar] [CrossRef]
  59. Wu, Y., Sun, H., Zhang, L., & Cui, C. (2025). Green investment and quality of economic development: Evidence from China. International Review of Financial Analysis, 103, 104147. [Google Scholar] [CrossRef]
  60. Xia, L., Gao, S., Wei, J., & Ding, Q. (2022). Government subsidy and corporate green innovation-Does board governance play a role? Energy Policy, 161, 112720. [Google Scholar] [CrossRef]
  61. Yu, C. H., Wu, X., Zhang, D., Chen, S., & Zhao, J. (2021). Demand for green finance: Resolving financing constraints on green innovation in China. Energy Policy, 153, 112255. [Google Scholar] [CrossRef]
  62. Zakharkina, L., Myroshnychenko, I., Smolennikov, D., & Pokhylko, S. (2018). Efficiency of innovation activity funding as the driver of the state’s national economic security. Montenegrin Journal of Economics, 14(4), 159–173. [Google Scholar] [CrossRef]
  63. Zhai, Y., Cai, Z., Lin, H., Yuan, M., Mao, Y., & Yu, M. (2022). Does better environmental, social, and governance induce better corporate green innovation: The mediating role of financing constraints. Corporate Social Responsibility and Environmental Management, 29(5), 1513–1526. [Google Scholar] [CrossRef]
  64. Zhang, Z., Chen, H., & Wu, L. (2023). How does technological innovation drive green growth in China’s complex environments? A configurational approach. Journal of Environmental Planning and Management, 67(4), 2583–2604. [Google Scholar] [CrossRef]
Figure 1. Complex Driving Model of green innovation investment quality in Heavily Polluting Enterprises. Note: A, B, C, and D respectively represent the influences of government, enterprises, research institutions, and intermediary organizations on green innovation investment. E represents the combined effects of these four dimensions on the green innovation investment quality.
Ijfs 14 00094 g001
Figure 2. Six Preconditioning Ceiling Line Scatter Bottlenecks of Outcome GI.
Ijfs 14 00094 g002
Figure 3. Significance test of necessary conditions.
Ijfs 14 00094 g003
Table 1. Sample Condition Design for Heavily Polluting Enterprises.
ConditionsCodeDescriptionSet Category
Government Sub-Spiral
Fiscal SubsidiesFSln(government subsidy amount)Continuous fuzzy set
Environmental TaxETln(environmental tax payments)Continuous fuzzy set
Enterprise Sub-Spiral
Financing ConstraintsFCSA indexContinuous fuzzy set
Research institutions Sub-Spiral
Industry-Research CooperationIRC1 if industry–research cooperation exists; otherwise 0Clear set
Intermediary Organizations Sub-Spiral
Audit QualityAQ1 if audited by a top-10 domestic audit firm; otherwise 0Clear set
ESG RatingESGComprehensive ESG rating from the WIND databaseContinuous fuzzy set
Table 2. Descriptive Statistics and Calibration.
Descriptive StatisticsCalibration Point Value
SetMeanSDMedianMaxMinNon-MembershipCross-Over PointFull-Membership
Quality of Green Innovation Investment0.1050.0860.0760.4300.0120.0480.0760.145
Fiscal Subsidies17.1701.22317.08520.51914.67015.47717.08518.683
Environmental Tax13.3602.22413.49517.8017.66912.08513.49515.225
Financing Constraints−3.9150.213−3.903−3.599−4.810−4.166−3.903−3.640
Industry-Research Cooperation0.54560.5011100/1
Audit Quality0.6360.4851100/1
ESG Rating5.9400.5635.8857.3224.6805.3145.8856.605
Table 3. Necessity Test of Single Condition on the Green innovation investment quality.
ConditionsHigh Green Innovation Investment QualityNon-High Green Innovation Investment Quality
ConsistencyCoverageConsistencyCoverage
Fiscal Subsidies0.80700.74970.40970.4129
~ Fiscal Subsidies0.36800.36500.75160.8086
Environmental Tax0.74450.71730.37010.3868
~ Environmental Tax0.36360.34730.72950.7559
Financing Constraints0.57860.56020.55910.5872
~ Financing Constraints0.57360.54530.58120.5994
Industry-Research Cooperation0.62070.54580.47610.4542
~ Industry-Research Cooperation0.37930.40030.52390.5997
Audit Quality0.72140.54380.55800.4562
~ Audit Quality0.27860.36750.44210.6325
ESG Rating0.65790.61920.52360.5345
~ ESG Rating0.50540.49440.62700.6653
Note: ~ = logical not.
Table 4. Necessary Condition Analysis Results.
ConditionsMethodC-AccuracyCeiling ZoneSlopeEffect Size
(d)
p-Value
(p)
Fiscal SubsidiesCE-FDH100%62.150339.9930.183 ***0.007
CR-FDH84.8%119.307339.9930.351 ***0.000
Environmental TaxCE-FDH100%3.94122.5130.175 **0.013
CR-FDH87.9%7.34422.5130.326 ***0.000
Financing ConstraintsCE-FDH100%0.3000.5060.5920.104
CR-FDH95.5%0.2510.5060.4950.246
Industry-Research CooperationCE-FDH100%0.1220.4180.2920.300
CR-FDH100%0.0610.4180.1460.300
Audit QualityCE-FDH100%0.0730.4180.1750.652
CR-FDH100%0.0370.4180.0870.652
ESG RatingCE-FDH100%0.4101.1050.371 **0.025
CR-FDH92.4%0.3481.1050.3150.052
Note: permutation test, number of repeated samples = 10,000, **, *** represent p < 0.05, 0.01.
Table 5. Analysis Results of NCA Method Bottleneck Level (%).
Quality of Green
Innovation Investment
Fiscal
Subsidies
Environmental
Tax
Financing
Constraints
Industry-Research CooperationAudit QualityESG
Rating
0NNNNNNNNNN0.2
10NNNN7.5NNNN6.5
20NNNN18.0NNNN12.7
301.1NN28.5NNNN19.0
4015.18.139.0NNNN25.2
5029.123.449.4NNNN31.5
6043.138.759.9NNNN37.7
7057.154.070.4NNNN44.0
8071.169.380.931.6NN50.2
9085.184.791.465.842.856.5
10099.2100.0100.0100.0100.062.7
Note: CR-FDH method, NN represents “unnecessary”.
Table 6. Configuration of High Green Innovation Investment Quality.
ConditionsSolutions
S1aS1bS1cS2S3
Fiscal SubsidiesIjfs 14 00094 i001Ijfs 14 00094 i001Ijfs 14 00094 i001Ijfs 14 00094 i002Ijfs 14 00094 i001
Environmental TaxIjfs 14 00094 i001Ijfs 14 00094 i001Ijfs 14 00094 i001Ijfs 14 00094 i001Ijfs 14 00094 i001
Financing ConstraintsIjfs 14 00094 i004 Ijfs 14 00094 i001Ijfs 14 00094 i002
Industry-Research Cooperation Ijfs 14 00094 i002 Ijfs 14 00094 i002Ijfs 14 00094 i003
Audit QualityIjfs 14 00094 i001Ijfs 14 00094 i001Ijfs 14 00094 i001Ijfs 14 00094 i001Ijfs 14 00094 i004
ESG Rating Ijfs 14 00094 i004Ijfs 14 00094 i003
Consistency0.9300.9090.9240.9360.948
Raw coverage0.3360.3630.3070.1520.071
Unique coverage0.0180.0570.0390.0140.070
Solution consistency0.909
Solution coverage0.571
Note: Ijfs 14 00094 i001 = the presence of core condition; Ijfs 14 00094 i003 = the absence of core condition; Ijfs 14 00094 i002 = the presence of peripheral condition; Ijfs 14 00094 i004 = the absence of peripheral condition; Blank spaces indicate a “don’t care” condition.
Disclaimer/Publisher’s Note: The statements, opinions and data contained in all publications are solely those of the individual author(s) and contributor(s) and not of MDPI and/or the editor(s). MDPI and/or the editor(s) disclaim responsibility for any injury to people or property resulting from any ideas, methods, instructions or products referred to in the content.