1. Introduction
Financial data in real market conditions are typically characterized by non-normal return distributions, volatility clustering, and extreme events concentrated in the tail of loss distributions. These features place accurate portfolio risk measurement, particularly the management of rare but economically severe downside losses, at the center of modern investment decision-making (
Chakraborty et al., 2021). In highly volatile markets, numerous empirical studies have shown that variance-based risk measures, which rely on assumptions of symmetry and normality, fail to adequately capture the direction, magnitude, and tail behavior of losses (
Markowitz, 1952).
To address these limitations, increased emphasis has been placed on downside-oriented risk measures. Conditional Value-at-Risk (CVaR) has emerged as a prominent metric because it quantifies the expected loss beyond a given confidence level and focuses risk assessment on the most adverse outcomes (
Rockafellar & Uryasev, 2000). Foundational research in risk theory demonstrates that CVaR satisfies the axioms of coherent risk measures, including subadditivity and consistency with diversification (
Artzner et al., 1999). Subsequent studies have clarified the distinction between expected shortfall and CVaR, particularly under discontinuous distributions, and have confirmed the theoretical validity of CVaR for practical risk management applications (
Acerbi & Tasche, 2002).
However, applying CVaR-based portfolio optimization in real-world, multi-period investment settings involves fundamental challenges. In particular, objective functions based on CVaR are generally incompatible with Bellman’s principle, which can lead to time-inconsistency in dynamic decision-making. This limitation has been formally established in the theoretical literature on multi-period risk measures (
Artzner et al., 2007). As a result, the mean–CVaR framework has prompted a clear distinction between pre-committed and time-consistent strategies, and rolling-horizon implementations have become widely adopted in practice (
X. Cui et al., 2019;
Strub et al., 2019). Although such approaches are not strictly time-consistent, they represent pragmatic solutions that are feasible in applied investment contexts.
At the same time, the performance of CVaR-based portfolio decisions depends critically on how accurately the employed scenarios represent future return distributions. In stochastic optimization with tail-sensitive risk measures, traditional Monte Carlo and moment-based scenario generation methods tend to systematically underestimate the probability and severity of losses under extreme conditions. This limitation has been emphasized in the literature on problem-driven scenario generation (
Fairbrother et al., 2022). While robust and distributionally robust CVaR models have been proposed to account for distributional uncertainty, these approaches remain limited in their ability to fully capture abrupt regime shifts and deep tail risk observed in fundamental financial markets (
Zhu & Fukushima, 2009;
Paç & Pınar, 2014).
Despite the extensive theoretical and empirical literature on CVaR-based portfolio optimization, it remains unclear whether such strategies provide robust and consistent downside protection across different market regimes and tail-risk severities, particularly when static optimization approaches are compared with adaptive learning-based strategies in highly volatile environments.
These theoretical and practical challenges underscore the need for a systematic empirical assessment of the interactions among market regime changes, tail-risk severity, and the degree of strategic adaptation. In this context, cryptocurrency markets differ markedly from traditional asset markets due to their extreme price fluctuations, pronounced volatility clustering, and strong distributional non-stationarity. These features make them a particularly suitable stress-testing environment for evaluating the performance of tail-risk-based portfolio strategies under adverse conditions (
Bouri et al., 2020;
Belabbes et al., 2025).
Accordingly, this study conducts a unified empirical evaluation of CVaR-based portfolio strategies in cryptocurrency markets, jointly examining traditional benchmarks, robust formulations, regime-adaptive designs, and learning-based frameworks within a common analytical setting. Rather than identifying a universally dominant strategy, the primary objective is to uncover the performance trade-offs that arise across market regimes and tail-risk depths, and to demonstrate empirically that effective downside risk management requires conditional, regime- and tail-dependent decision-making. In doing so, the study clarifies the economic relevance of dynamic CVaR-based portfolio management and provides practical guidance for tail-risk control in high-risk digital asset markets.
2. Literature Review
2.1. Portfolio Optimization and the Evolution of Risk Measures
The theoretical foundation of modern portfolio optimization originates from
Markowitz’s (
1952) mean–variance framework. While this approach formally characterizes the trade-off between return and risk, it relies on the assumption that asset returns are symmetric and normally distributed. In fundamental financial markets, particularly in environments characterized by high volatility and frequent tail events, these assumptions are systematically violated. Empirical and survey studies consistently document that mean–variance models fail to adequately capture extreme losses under such conditions (
Wu, 2016;
Chakraborty et al., 2021;
Belabbes et al., 2025). This limitation has motivated a gradual shift in both theory and practice toward risk measures that explicitly account for downside asymmetry and tail behavior.
In response to these limitations, risk measures that focus explicitly on downside risk have been actively developed. Although Value-at-Risk (VaR) is widely used in practice, it ignores the magnitude of losses beyond the tail threshold. It lacks the subadditivity property, thereby failing to promote diversification within the coherent risk measure framework (
Krichene, 2012;
Artzner et al., 1999). In contrast, Conditional Value-at-Risk (CVaR) measures the average loss beyond a given confidence level and thus provides a more comprehensive representation of extreme downside risk (
Krokhmal et al., 2002;
Rockafellar & Uryasev, 2000).
Krokhmal et al. (
2002) were among the first to demonstrate that CVaR can be incorporated into portfolio optimization both as an objective function and as a constraint, highlighting its practical relevance for directly controlling tail losses. Building on this,
Rockafellar and Uryasev (
2000) systematically characterized the theoretical properties of CVaR within a convex optimization framework. They formally showed its consistency with the core axioms of coherent risk measures.
Acerbi and Tasche (
2002) further clarified the subtle distinctions between CVaR and expected shortfall, particularly under discrete return distributions, and discussed conditions under which coherence may fail. Together, these studies establish CVaR as a theoretically sound and practically meaningful alternative to variance-based risk measures, while also emphasizing the importance of precise definitions when modeling tail risk.
2.2. Static and Dynamic CVaR-Based Portfolio Models
Early research on CVaR-based portfolio optimization was developed in static settings, where the problem can be efficiently solved within linear and convex optimization frameworks (
Rockafellar & Uryasev, 2000). Subsequent studies extended this framework to account for distributional uncertainty and worst-case scenarios, leading to the development of robust CVaR models that manage portfolio risk under ambiguous return distributions (
Zhu & Fukushima, 2009;
Paç & Pınar, 2014;
Pflug & Wozabal, 2007). These contributions demonstrate that incorporating robustness can materially improve downside protection, albeit often at the cost of reduced return potential.
In practice, however, investment decisions are inherently multi-period and dynamic, necessitating the extension of CVaR to intertemporal settings (
Bäuerle & Ott, 2011). Within this context, multi-period mean–CVaR models have been proposed, but theoretical studies show that CVaR generally violates Bellman’s principle in dynamic environments, giving rise to time inconsistency under law-invariant risk measures (
Artzner et al., 2007;
Kupper & Schachermayer, 2009).
X. Cui et al. (
2019) and
Strub et al. (
2019) provide a detailed analysis of time inconsistency in discrete-time mean–CVaR optimization and distinguish between pre-committed, time-consistent, and preference-adjusted strategies from both theoretical and empirical perspectives. This line of research highlights a fundamental tension between optimality and consistency when CVaR is applied in dynamic portfolio settings.
Related simulation-based studies further examine multi-period portfolio decision-making from a practical implementation standpoint (
Blay et al., 2020). Recent empirical studies indicate that combining CVaR-based dynamic portfolio optimization with deep reinforcement learning is particularly effective in environments characterized by pronounced tail risk and regime shifts, such as cryptocurrency markets (
T. Cui et al., 2023).
Building on this line of research, deep reinforcement learning has been embedded into multi-period portfolio optimization via hyper-heuristic frameworks, allowing adaptive strategy selection under non-stationary market dynamics (
T. Cui et al., 2024). In parallel, risk-sensitive reinforcement learning approaches have been developed that explicitly incorporate downside risk constraints, including CVaR, into dynamic portfolio policies (
Wang & Liu, 2025). Despite these advances, the empirical evidence remains mixed regarding whether learning-based CVaR strategies consistently outperform simpler rule-based or robust benchmarks across different market regimes.
2.3. Robust and Stochastic Approaches in Cryptocurrency Markets
To implement CVaR-based models in fundamental markets, stochastic and robust programming techniques have been widely adopted.
Fairbrother et al. (
2022) systematically examine scenario generation for stochastic optimization with tail-focused risk measures and show that the quality of generated scenarios plays a decisive role in optimization outcomes.
Barro et al. (
2022) provide empirical evidence that stochastic mean–CVaR models incorporating derivatives and volatility-based assets can effectively manage tail risk. These stochastic and robust approaches are particularly relevant in markets characterized by high volatility and fat-tailed return distributions. These findings suggest that model performance depends not only on the chosen risk measure but also on how uncertainty and tail events are represented in the optimization process.
Cryptocurrency markets differ markedly from traditional asset classes due to extreme price fluctuations, frequent regime shifts, and pronounced distributional non-stationarity. Recent evidence indicates that modeling downside risk dynamically is crucial in such environments. Using ARMA–GARCH models with alpha-stable innovations,
Malek et al. (
2023) demonstrate that dynamic VaR and CVaR estimates substantially outperform static counterparts and exhibit pronounced regime-dependent behavior across different market phases. Complementing this line of research, deep learning–based CVaR utility formulations have also been shown to enhance downside risk control in cryptocurrency portfolio optimization by explicitly targeting tail losses under extreme conditions (
Huang et al., 2025). Whether cryptocurrencies exhibit safe-haven properties under extreme conditions has therefore been actively investigated within a tail-risk framework (
Bouri et al., 2020). Using such markets allows portfolio optimization strategies to be evaluated in a more stringent stress-testing environment, where downside risk management is critically challenged (
Oliveira Filho & Poker Junior, 2025;
Belabbes et al., 2025). Taken together, these studies support using cryptocurrency markets as a stringent stress-testing environment for evaluating tail-risk-based portfolio strategies (
Oliveira Filho & Poker Junior, 2025;
Belabbes et al., 2025).
2.4. Scenario Generation and the Representation of Tail Risk
In stochastic portfolio optimization, scenario generation is a core component that directly determines the quality of portfolio decisions. Traditional Monte Carlo simulation, bootstrapping, and moment-matching methods can reproduce the first moments of return distributions. However, they are limited in capturing key stylized facts of financial data, such as fat tails and volatility clustering (
Chakraborty et al., 2021). Recent studies increasingly employ probabilistic AI and data-driven approaches to generate scenarios. Research combining vine copula-based forecasting with portfolio optimization shows that such methods can flexibly model complex dependence structures in asset returns (
Sahamkhadam & Stephan, 2023). Other empirical work demonstrates that integrating stochastic mean–CVaR models with time-varying risk aversion can yield more stable performance under extreme market conditions (
Guo & Ryan, 2023). Nevertheless, most existing approaches remain constrained by parametric assumptions or limited tail representativeness, which may restrict their effectiveness during severe stress events.
2.5. Generative Models and Diffusion-Based Approaches
Generative AI models have attracted growing attention in finance due to their ability to capture nonlinearity and high uncertainty in financial data.
Wiese et al. (
2020) introduce the QuantGAN framework and show that it can realistically reproduce key stylized facts, including volatility clustering and fat-tailed return distributions. In parallel, several review studies summarize the financial applications of variational autoencoders and other deep generative models, highlighting their potential for data augmentation and scenario generation (
Singh & Ogunfunmi, 2022;
Senescall & Low, 2024). More recently, diffusion-based probabilistic models have emerged as a promising class of generative methods due to their training stability and distribution-free properties.
Takahashi and Mizuno (
2025) demonstrate that diffusion models can generate synthetic financial time series with realistic dynamics, while
Lesniewski and Trigila (
2025) emphasize their relevance for simulating market behavior and conducting scenario-based risk analysis. Recent surveys on probabilistic AI in finance further confirm the strong potential of diffusion-based approaches for modeling complex financial distributions and extreme events (
Eggen et al., 2025). However, direct empirical links between diffusion-based scenario generation and CVaR-focused portfolio optimization under regime shifts remain limited.
2.6. Research Gaps and Hypotheses
A synthesis of the existing literature reveals several apparent research gaps. First, although the theoretical foundations of CVaR-based portfolio optimization are well established, applying CVaR in dynamic settings raises fundamental challenges such as time inconsistency. Empirical studies that systematically evaluate this issue in practical backtesting environments, particularly with respect to conditional trade-offs between downside protection and return potential, remain relatively limited (
Artzner et al., 2007;
X. Cui et al., 2019;
Strub et al., 2019). Second, while scenario generation plays a decisive role in the quality of stochastic portfolio decisions, recent research highlights that conventional Monte Carlo, bootstrapping, and moment-matching approaches may inadequately capture tail behavior and key stylized facts of financial data (
Chakraborty et al., 2021;
Fairbrother et al., 2022). Third, although generative AI methods, especially diffusion-based models, offer a more flexible representation of financial return distributions, empirical evidence linking these approaches to tail-risk-focused portfolio decisions using CVaR or expected shortfall, and jointly accounting for market regime shifts, remains scarce (
Wiese et al., 2020;
Lesniewski & Trigila, 2025;
Takahashi & Mizuno, 2025;
Eggen et al., 2025). Recent decision-centric risk studies further indicate that evaluating financial risk models solely based on statistical accuracy may be insufficient for practical decision-making, underscoring the importance of interpretability and economically meaningful performance assessment in high-risk environments (
Sodnomdavaa & Lkhagvadorj, 2026).
To address these gaps, this study (i) uses the tail-risk-dominated cryptocurrency market as a stress-testing laboratory, (ii) compares rule-based, robust, econometric, and learning-based CVaR strategies within a unified empirical framework, and (iii) evaluates the trade-off between downside protection and return potential across market regimes using rolling-window backtesting and lightweight robustness analysis (
Bouri et al., 2020;
Fairbrother et al., 2022;
Senescall & Low, 2024).
3. Methodology
3.1. Overall Research Framework and Market Environment
This study empirically evaluates the performance of risk-based portfolio management strategies in high-volatility markets dominated by tail risk. In cryptocurrency markets, return distributions are non-normal, fat-tailed, and characterized by volatility clustering and frequent regime shifts, which clearly expose the limitations of traditional variance-based risk concepts (
Chakraborty et al., 2021).
In this setting, Conditional Value-at-Risk (CVaR) offers both theoretical and practical advantages as a downside risk measure, as it directly captures losses in the tail of the return distribution (
Artzner et al., 1999;
Rockafellar & Uryasev, 2000). Cryptocurrencies are therefore treated as a suitable environment for stress-testing tail-risk-based strategies. Rather than attempting to predict individual asset returns, the analysis focuses explicitly on portfolio-level risk management performance and on the trade-off between downside protection and return potential under varying market conditions.
The empirical evaluation is conducted within a rolling-window backtesting framework with periodic portfolio rebalancing, allowing performance to be assessed under dynamic market conditions. This design choice reflects the practical reality of portfolio management, where strategies are repeatedly updated as new information becomes available. Although this rolling-horizon design does not fully resolve the time-inconsistency of CVaR, it is widely used and operationally feasible in real-world investment practice and can be viewed as a pragmatic approximation to dynamic decision-making (
X. Cui et al., 2019;
Strub et al., 2019). Accordingly, the framework is well suited for comparing rule-based, regime-aware, and learning-based CVaR strategies under realistic market dynamics.
3.2. Portfolio Strategies
The empirical comparison includes traditional, robust, regime-adaptive, and learning-based portfolio strategies.
Benchmark strategies: The buy-and-hold strategy serves as a passive benchmark, whereas the equal-weight strategy represents a naive diversification baseline with uniform portfolio weights. These benchmarks provide a reference for assessing the incremental value of risk-based strategies by isolating the contribution of active risk management from simple allocation effects.
Traditional and robust CVaR-based strategies: For comparison, the analysis considers (i) MC–CVaR based on a Gaussian assumption, (ii) MM–CVaR that partially accounts for fat tails through moment matching, and (iii) DRO–CVaR, which incorporates distributional uncertainty under a worst-case framework. These strategies enable an assessment of the sensitivity of CVaR-based decisions to scenario-generation assumptions and distributional uncertainty. In particular, they allow the analysis to distinguish performance differences arising from tail modeling choices rather than from dynamic adaptivity.
Regime-adaptive and econometric extensions: The Regime–CVaR strategy adjusts risk calibration based on volatility regimes and constitutes a rule-based adaptive approach. In addition, the ES–Reg–CVaR strategy integrates dynamically estimated Expected Shortfall, obtained via regression, into the CVaR framework, thereby improving tail-risk representation using econometric information. These strategies serve as intermediate designs that combine rule-based structure with partial adaptivity, bridging static CVaR optimization and fully learning-based approaches.
Learning-based strategy (RL–CVaR): A reinforcement learning strategy with explicit CVaR constraints (RL–CVaR) is also included. This enables a unified comparison of rule-based, econometric, and learning-based approaches to tail-risk management. In the RL–CVaR framework, risk sensitivity is enforced through penalty or constraint mechanisms that limit CVaR at a given confidence level. Formally, the learning agent optimizes a reward function that balances expected returns against CVaR-based penalties, allowing the return–risk trade-off to be learned from data while systematically restricting excessive tail losses. This design allows the agent to adapt to changing market conditions without relaxing explicit downside risk controls.
3.3. Market Regime Definition and Backtesting Design
Market regimes are identified using a transparent, straightforward, rule-based approach based on the rolling volatility of the equal-weight portfolio. Periods in which volatility exceeds the upper quantile of its long-run baseline distribution, set at 70%, are classified as stress regimes, while the remaining periods are classified as standard regimes. This volatility-based classification is intentionally parsimonious and relies on observable market information rather than latent or model-dependent state variables.
This rule-based approach is adopted for three main reasons. First, it reduces the risk of regime overfitting associated with complex latent-state parameterizations. Second, it preserves the economic interpretability of regime definitions. Third, it facilitates practical implementation. More sophisticated regime-identification techniques, such as Markov-switching or hidden-state models, are not employed in order to avoid introducing additional estimation uncertainty and model risk that could obscure the comparative evaluation of portfolio strategies. The sensitivity of the regime threshold is further examined through robustness checks using alternative quantile levels, which confirms the empirical stability of the classification rule.
Portfolio performance is evaluated using a rolling-window backtesting framework with weekly rebalancing. This design captures multiple bull and bear cycles, sharp drawdowns, and stress episodes over an extended sample period, allowing regime-dependent performance to be assessed in a realistic investment setting. Weekly rebalancing represents a compromise between responsiveness to changing market conditions and the avoidance of excessive turnover, ensuring that the backtesting design remains economically plausible.
3.4. Performance Metrics and Robustness Analysis
Portfolio performance is evaluated using four core metrics: mean return, volatility, Conditional Value-at-Risk (CVaR), and maximum drawdown. The CVaR confidence level is calibrated at 95% under normal market conditions and at 99% under stress regimes. This asymmetric calibration reflects the objective of applying stricter downside risk scrutiny when tail events are more likely and economically consequential. This choice is consistent with standard practice in downside risk management and reflects the need for stricter assessment of tail losses during stress periods.
To assess the stability of the results, a lightweight robustness analysis is conducted by varying the CVaR confidence level across 90%, 95%, and 99% and examining how relative performance and strategy rankings change. By explicitly testing multiple tail-risk depths, this design mitigates concerns related to confidence-level arbitrariness and post hoc model selection. This multi-level evaluation reduces the risk of post hoc selection of confidence levels and limits concerns about specification search.
In addition, formal robustness is assessed using a block bootstrap approach to construct confidence intervals for performance differences between strategies (
Fairbrother et al., 2022). The block bootstrap is employed to preserve serial dependence in returns and to provide a conservative assessment of performance variability under realistic market dynamics. These robustness analyses are not intended to establish universal statistical dominance, but rather to systematically identify economically meaningful trade-offs that depend on market regimes and tail-risk severity. Accordingly, statistical significance is interpreted as a diagnostic tool rather than as definitive evidence of economic superiority.
Within the above methodological framework, the following research questions and hypotheses are examined empirically. These questions are designed to align directly with the regime-dependent and tail-sensitive nature of the portfolio strategies under consideration.
RQ1: Does the performance of tail-risk-based portfolio strategies vary systematically across market regimes? H1: The Regime–CVaR strategy reduces maximum drawdown relative to traditional CVaR strategies under stressed market conditions.
RQ2: Do regime-adaptive and learning-based strategies provide economically meaningful protection compared to traditional CVaR strategies during market stress? H2: The learning-based strategy (RL–CVaR) exhibits greater return adaptability during extreme tail-risk conditions, but not necessarily superior downside protection.
RQ3: Does the relative dominance of portfolio strategies change with the depth of tail risk, as measured by the CVaR confidence level? H3: No stable universal dominant strategy exists across different tail-risk confidence levels, and performance necessarily reflects a trade-off.
4. Results
4.1. Experimental Design and Evaluation Framework
This study empirically evaluates the performance of tail-risk-based portfolio strategies under market conditions commonly observed in cryptocurrency markets, including fat-tailed return distributions, volatility clustering, and frequent regime shifts. The analysis focuses on Bitcoin (BTC), Ethereum (ETH), Binance Coin (BNB), Ripple (XRP), and Solana (SOL), which are selected for their market representativeness, high liquidity, and systemic relevance. Rather than treating these assets as isolated investment opportunities, they are used jointly to assess portfolio-level risk management performance in a tail-risk-dominated environment.
The sample period spans from 1 January 2018 to 31 December 2025, covering multiple bull and bear cycles as well as significant stress episodes, including the COVID-19 shock, abrupt macro-financial policy changes, and crypto-specific market disruptions. Portfolio decisions are implemented within a rolling-window backtesting framework with weekly rebalancing. All performance metrics are computed using weekly returns and are not annualized. Downside risk is measured using Conditional Value-at-Risk (CVaR), calibrated at the 95% confidence level under normal market conditions and at the 99% level during stress regimes. This asymmetric calibration reflects the economic relevance of distinguishing between moderate tail events and rare but severe losses during crisis periods, rather than imposing a single uniform risk threshold across regimes.
Market regimes are identified using a volatility-based rule. Periods in which rolling volatility exceeds the upper 70% quantile of its long-run distribution are classified as stress regimes, while the remaining periods are classified as standard regimes. Sensitivity checks indicate that the main results remain qualitatively stable across thresholds ranging from 60% to 80%. This regime definition enables the empirical analysis to explicitly link strategy performance to changes in market risk conditions, rather than relying solely on unconditional average outcomes. The empirical analysis does not aim to forecast individual asset returns. Instead, it focuses on portfolio-level risk-based management performance and on the protection–return trade-off associated with alternative tail-risk management strategies.
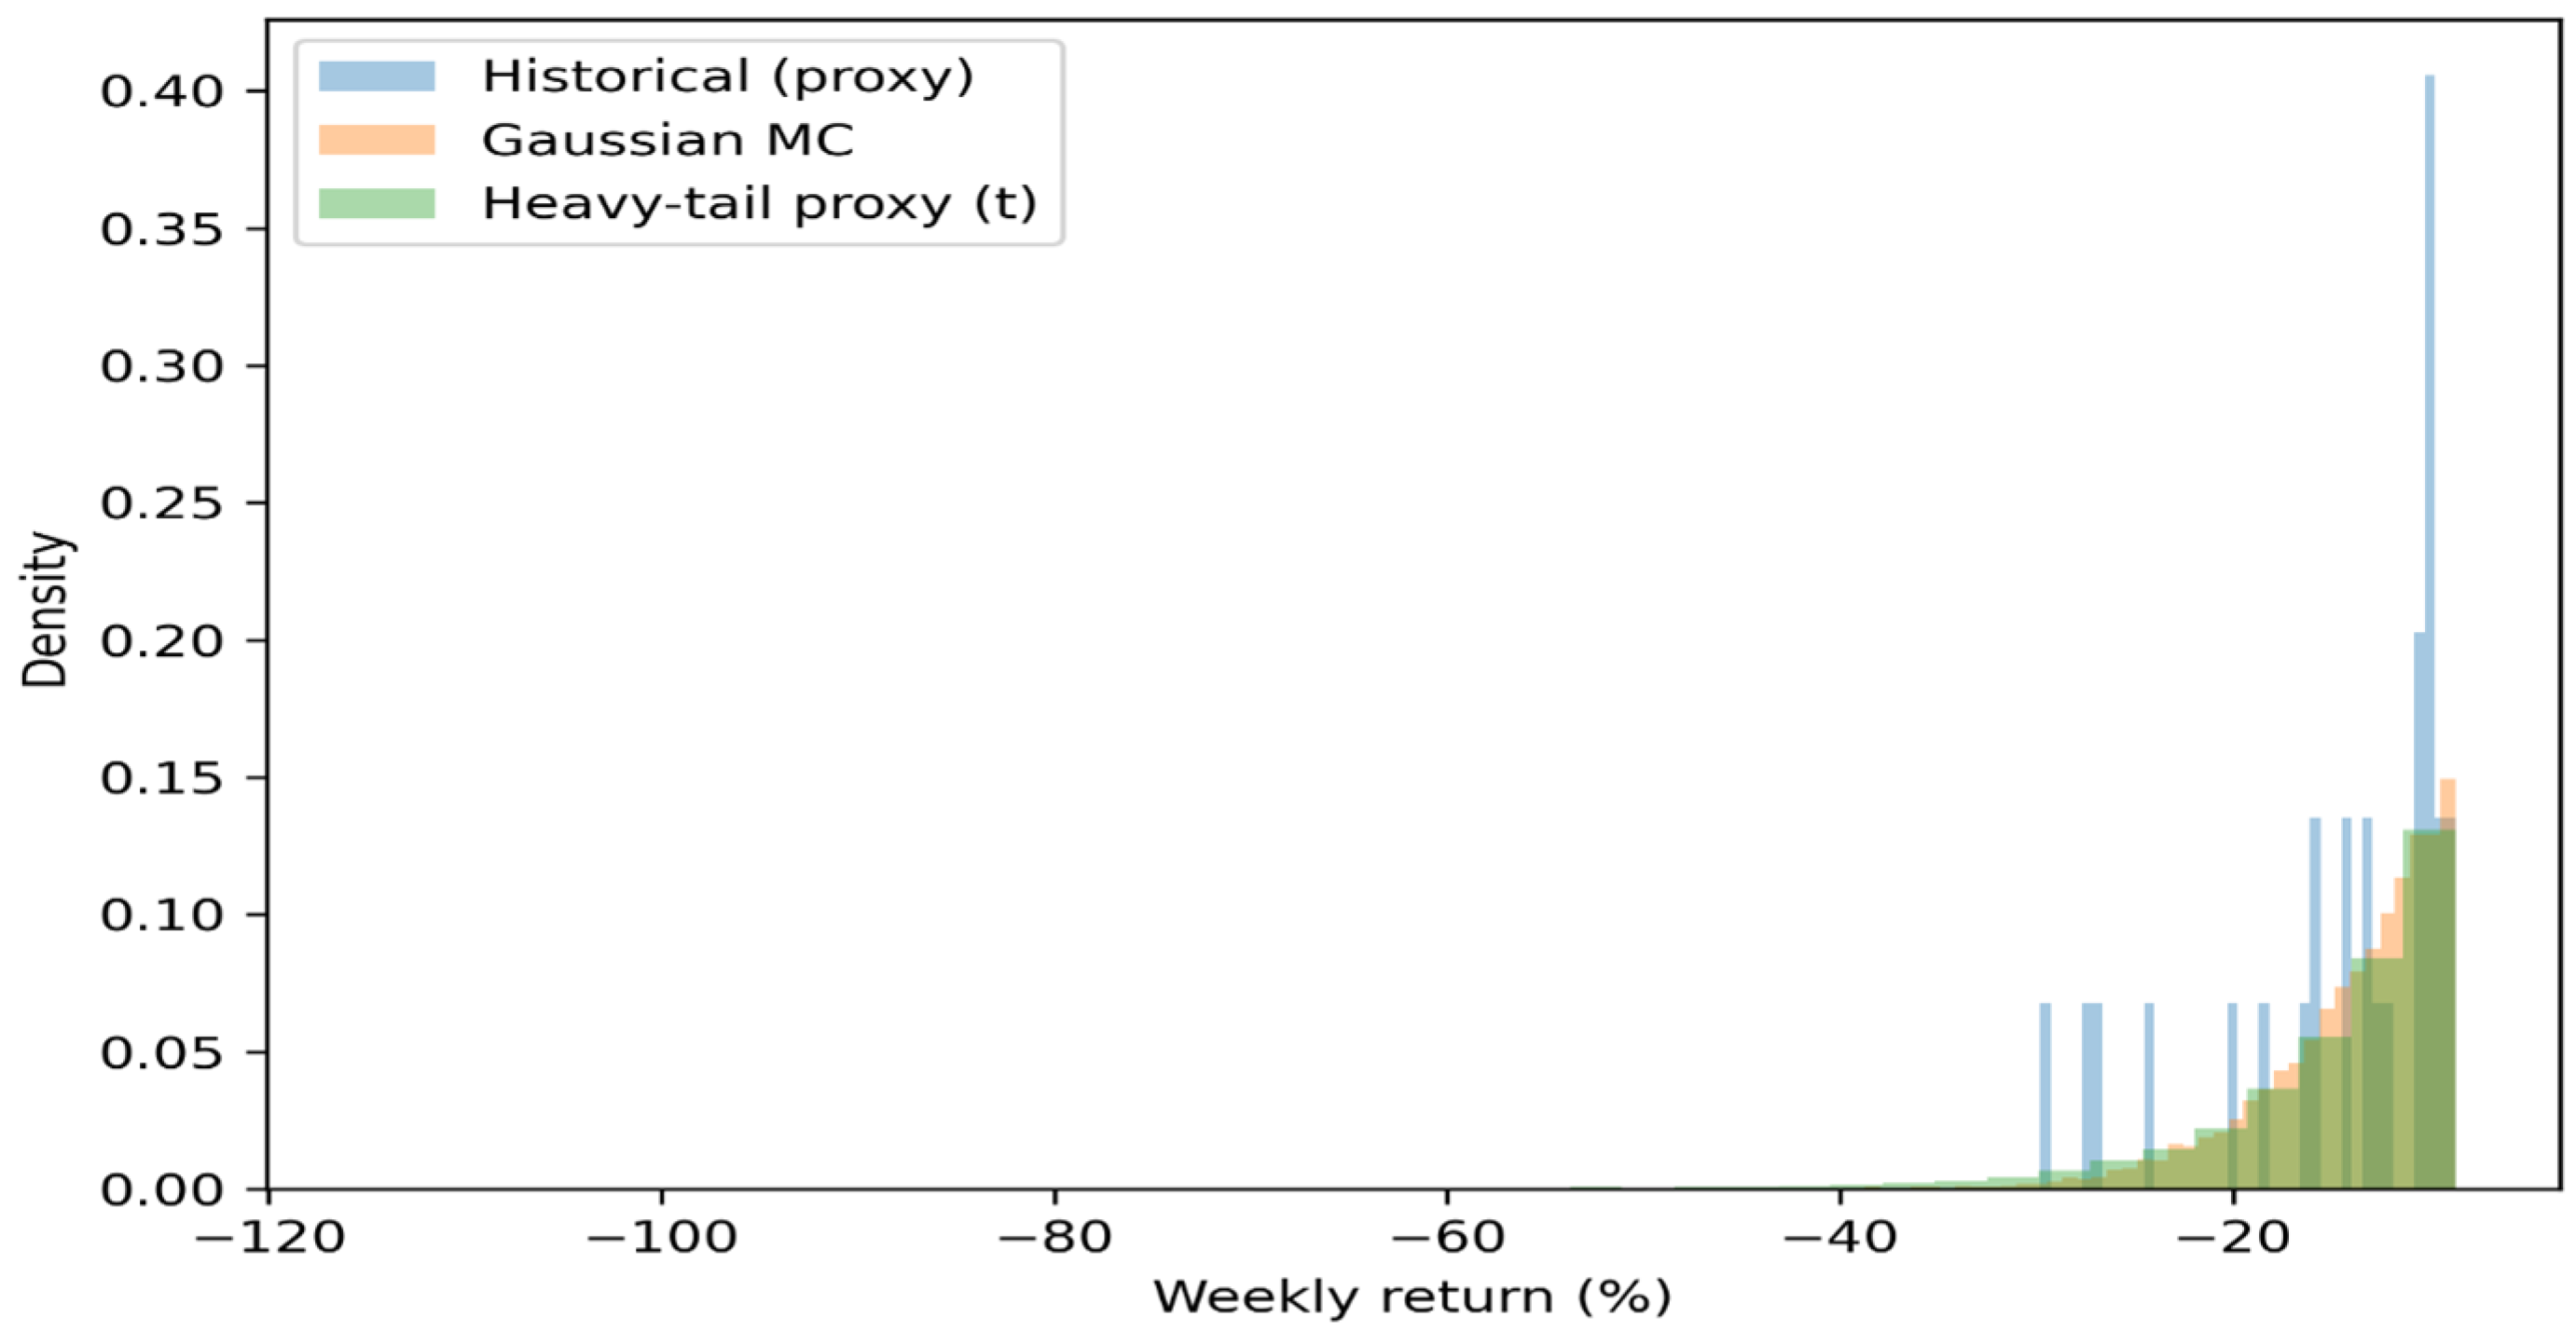
Figure 1 compares the lower tail of weekly returns of the equal-weight portfolio using three representations: the empirical distribution (historical proxy), a Gaussian Monte Carlo model, and a heavy-tail proxy based on the student-t distribution. The empirical data exhibit substantially heavier tails than the Gaussian benchmark, indicating that both the probability and severity of extreme losses are systematically underestimated under normality assumptions. Importantly, this discrepancy is economically meaningful, as it implies that variance-based or Gaussian risk models would materially understate downside exposure during stress periods. This evidence provides strong empirical support for the use of tail-sensitive risk measures such as Conditional Value-at-Risk and Expected Shortfall.
4.2. Risk-Based Portfolio Strategies and Performance Comparison
This subsection provides a systematic comparison of tail-risk-based portfolio strategies in the cryptocurrency market, characterized by fat-tailed returns, high volatility, and frequent regime shifts. Rather than evaluating strategies in isolation, the analysis emphasizes relative performance and trade-offs across strategy classes under identical market conditions. The empirical evaluation includes traditional benchmarks, robust approaches, and modern learning-based methods, reflecting strategy classes commonly used in real-world investment decision-making.
Specifically, the analysis considers the passive Buy-and-Hold strategy, the naive diversification benchmark represented by the Equal-Weight portfolio, Gaussian-based MC–CVaR, moment-matched MM–CVaR, regime-dependent Regime–CVaR, distributionally robust DRO–CVaR, the regression-enhanced ES–Reg–CVaR hybrid, and the reinforcement learning-based RL–CVaR strategy with explicit CVaR constraints. This selection enables a direct comparison between static, robust, adaptive, and data-driven approaches to downside risk management.
Portfolio performance is evaluated using four core metrics: mean return, volatility, CVaR at the 95% confidence level, and maximum drawdown. These metrics jointly capture both average performance and extreme downside exposure, which is central to evaluating tail-risk-based strategies. The comparative results are summarized in
Table 1.
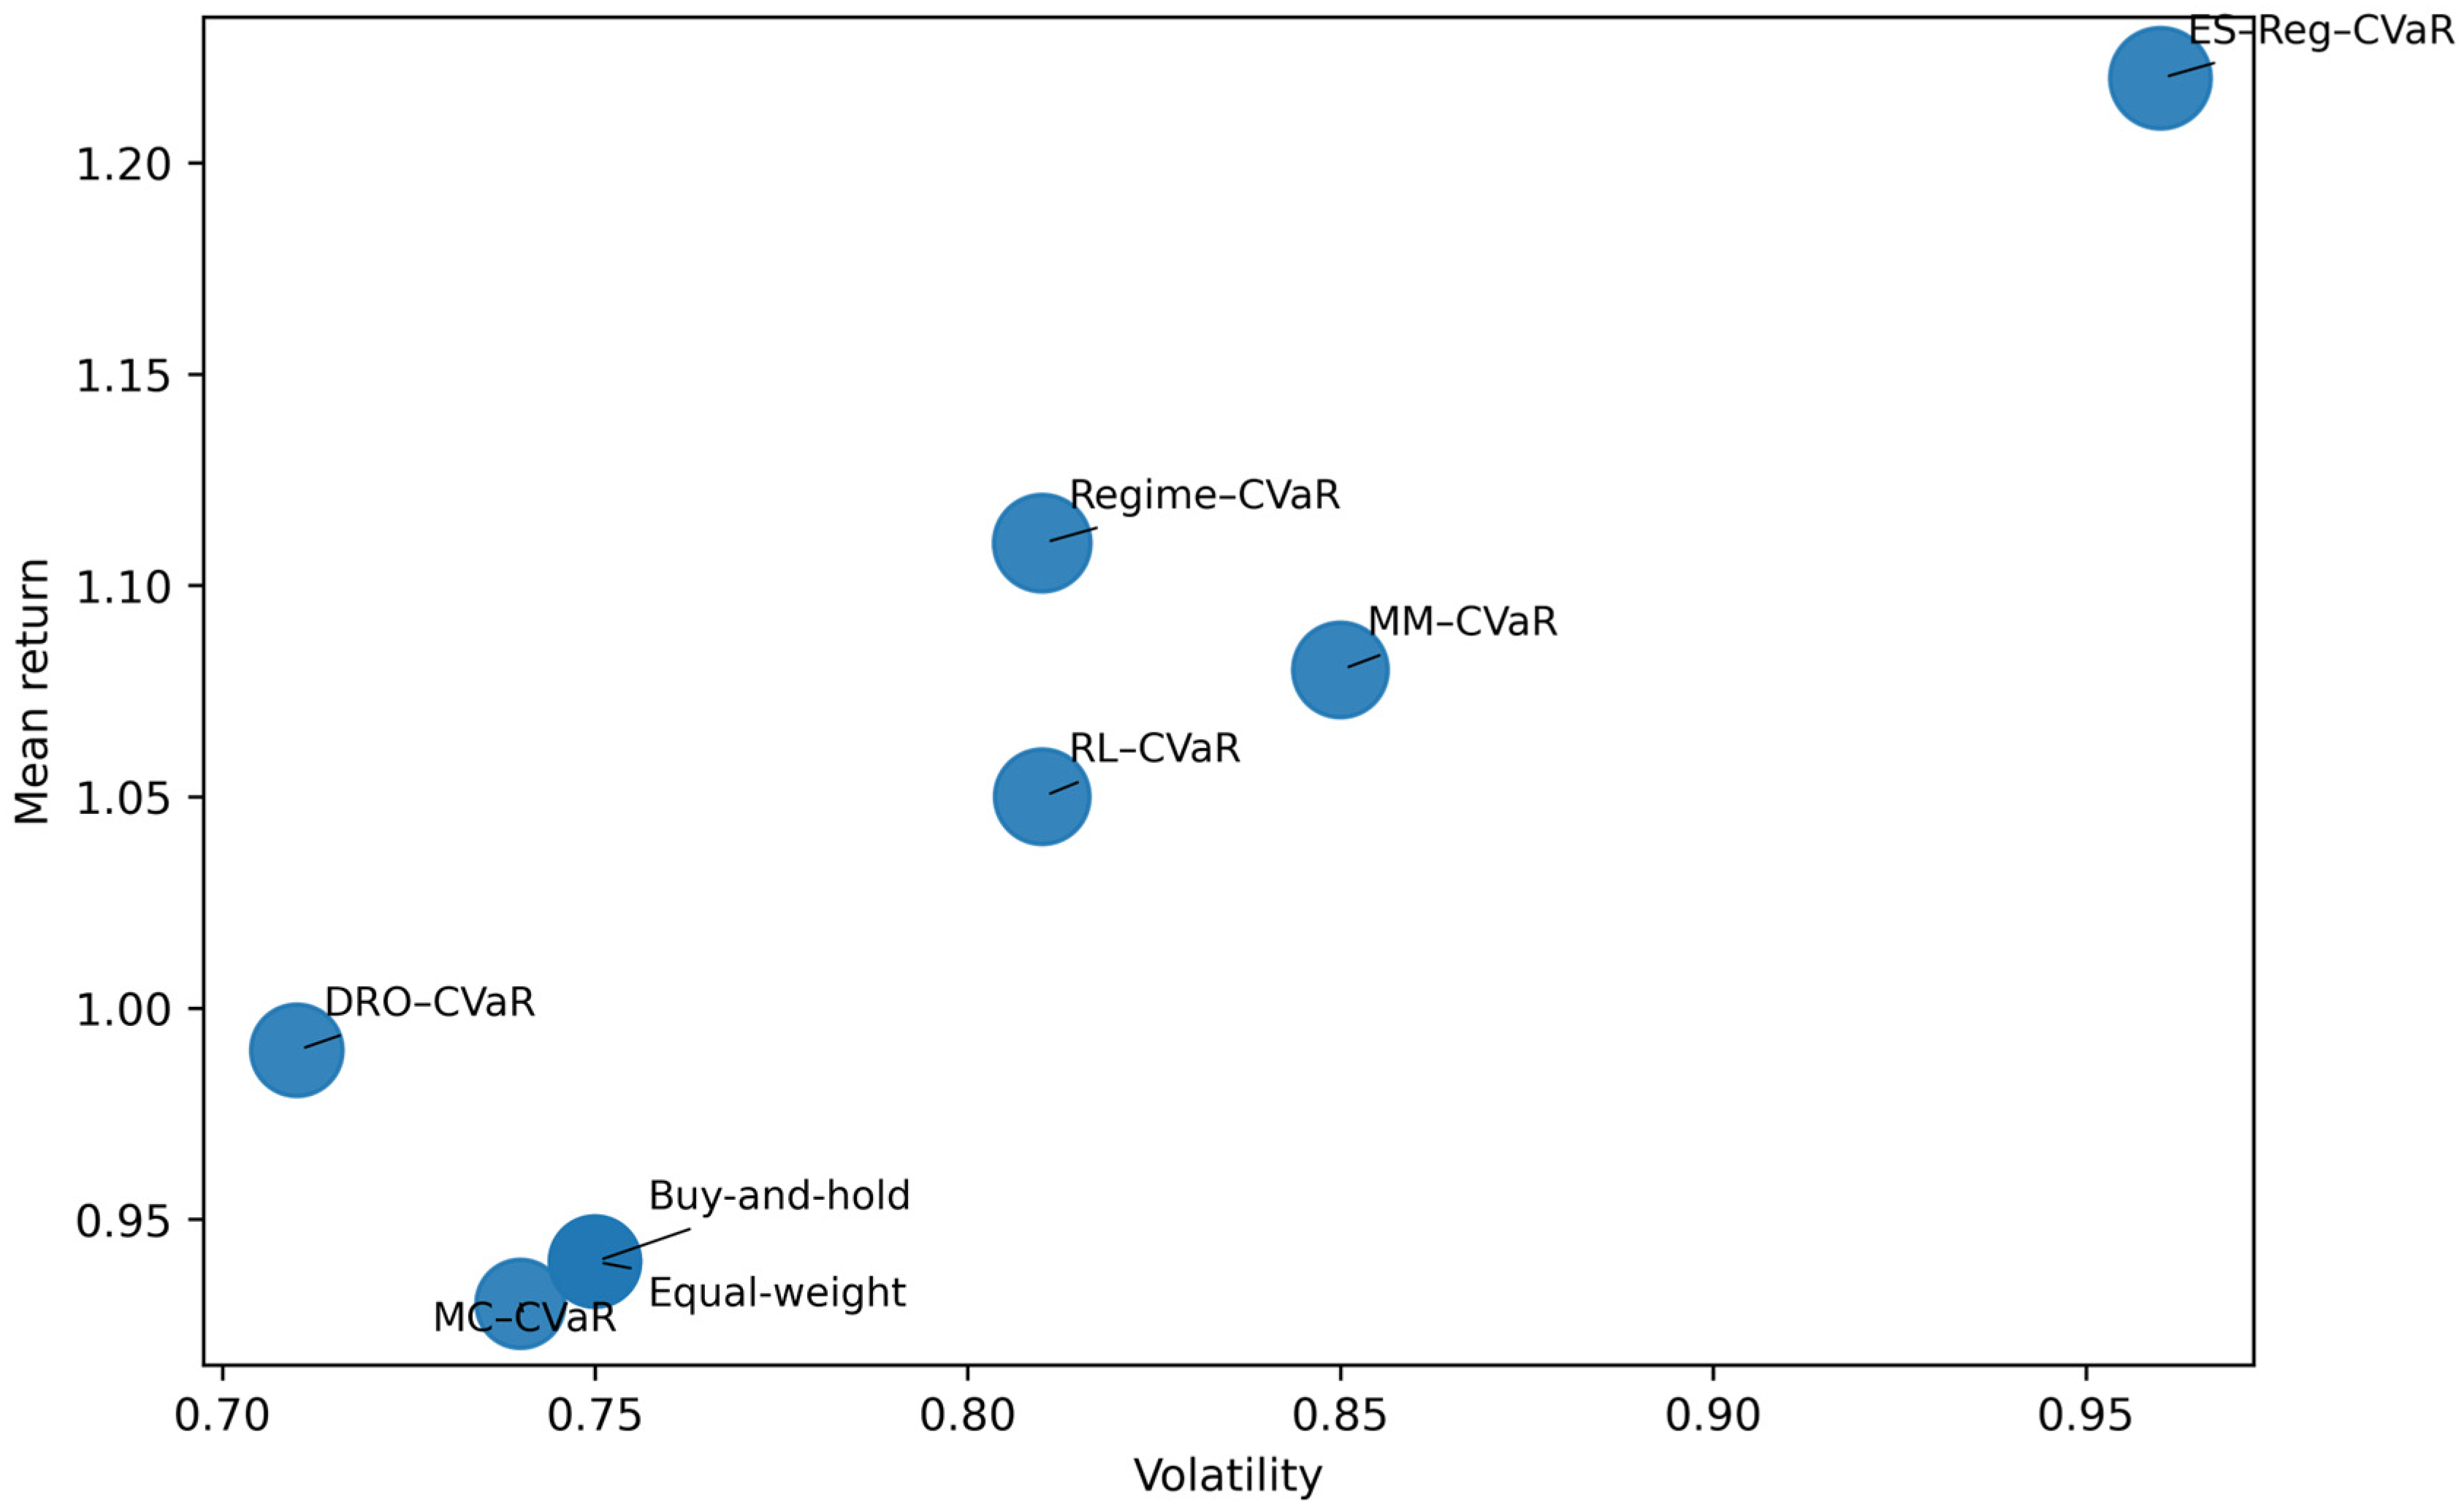
Table 1 shows that no stable dominance relationship emerges across all performance metrics, and return–risk trade-offs are pervasive across strategies. This result directly indicates that higher average returns are not achieved without corresponding increases in volatility or tail-risk exposure. For example, the ES–Reg–CVaR strategy achieves relatively higher mean returns but is accompanied by increased volatility. The MM–CVaR strategy provides more stable control of downside risk and is associated with lower maximum drawdowns. The Regime–CVaR strategy reduces the maximum drawdown relative to MC–CVaR, improving from −0.76 to −0.71, which represents a meaningful improvement in capital preservation during adverse market conditions rather than a purely statistical gain. By contrast, the RL–CVaR strategy preserves return potential but exhibits a larger maximum drawdown, suggesting that adaptive learning may amplify tail losses during abrupt regime shifts. To visualize these patterns, the return–risk trade-offs across strategies are illustrated in
Figure 2.
Figure 2 depicts the relationship between mean return and volatility, where the size of each point represents the absolute magnitude of CVaR(95%). The results indicate that higher return potential is typically accompanied by either increased volatility or deeper tail-loss exposure. This visualization highlights that apparent performance improvements along one dimension often conceal increased exposure along another, reinforcing the absence of a universally superior strategy.
To further examine whether relative performance varies across market conditions, the differences between the ES–Reg–CVaR and MM–CVaR strategies are evaluated under normal and stress regimes using a paired block bootstrap approach (
Table 2). This comparison is intentionally focused on two competitive strategies to illustrate regime-dependent performance dynamics rather than broad unconditional averages.
Bootstrap results indicate the absence of strict universal dominance across strategies. Instead, they reveal a regime-dependent trade-off in performance. In normal market conditions, the ES–Reg–CVaR strategy tends to exhibit a return advantage, whereas in stress regimes its downside protection remains broadly comparable to that of MM–CVaR. Importantly, although some return and risk differences are not statistically significant, their direction and magnitude remain economically informative for portfolio allocation decisions under different market regimes.
4.3. Regime-Dependent Performance and Dominance
This subsection examines how portfolio strategy performance varies across market conditions by analyzing results separately for normal and stress regimes. Market regimes are classified using the rolling-volatility rule defined in
Section 4.1. CVaR at the 95% confidence level is applied in normal regimes, while CVaR at the 99% level is used in stress regimes. This regime-specific calibration allows downside risk to be evaluated in a manner consistent with the severity of market conditions, rather than imposing a uniform tail definition across heterogeneous environments.
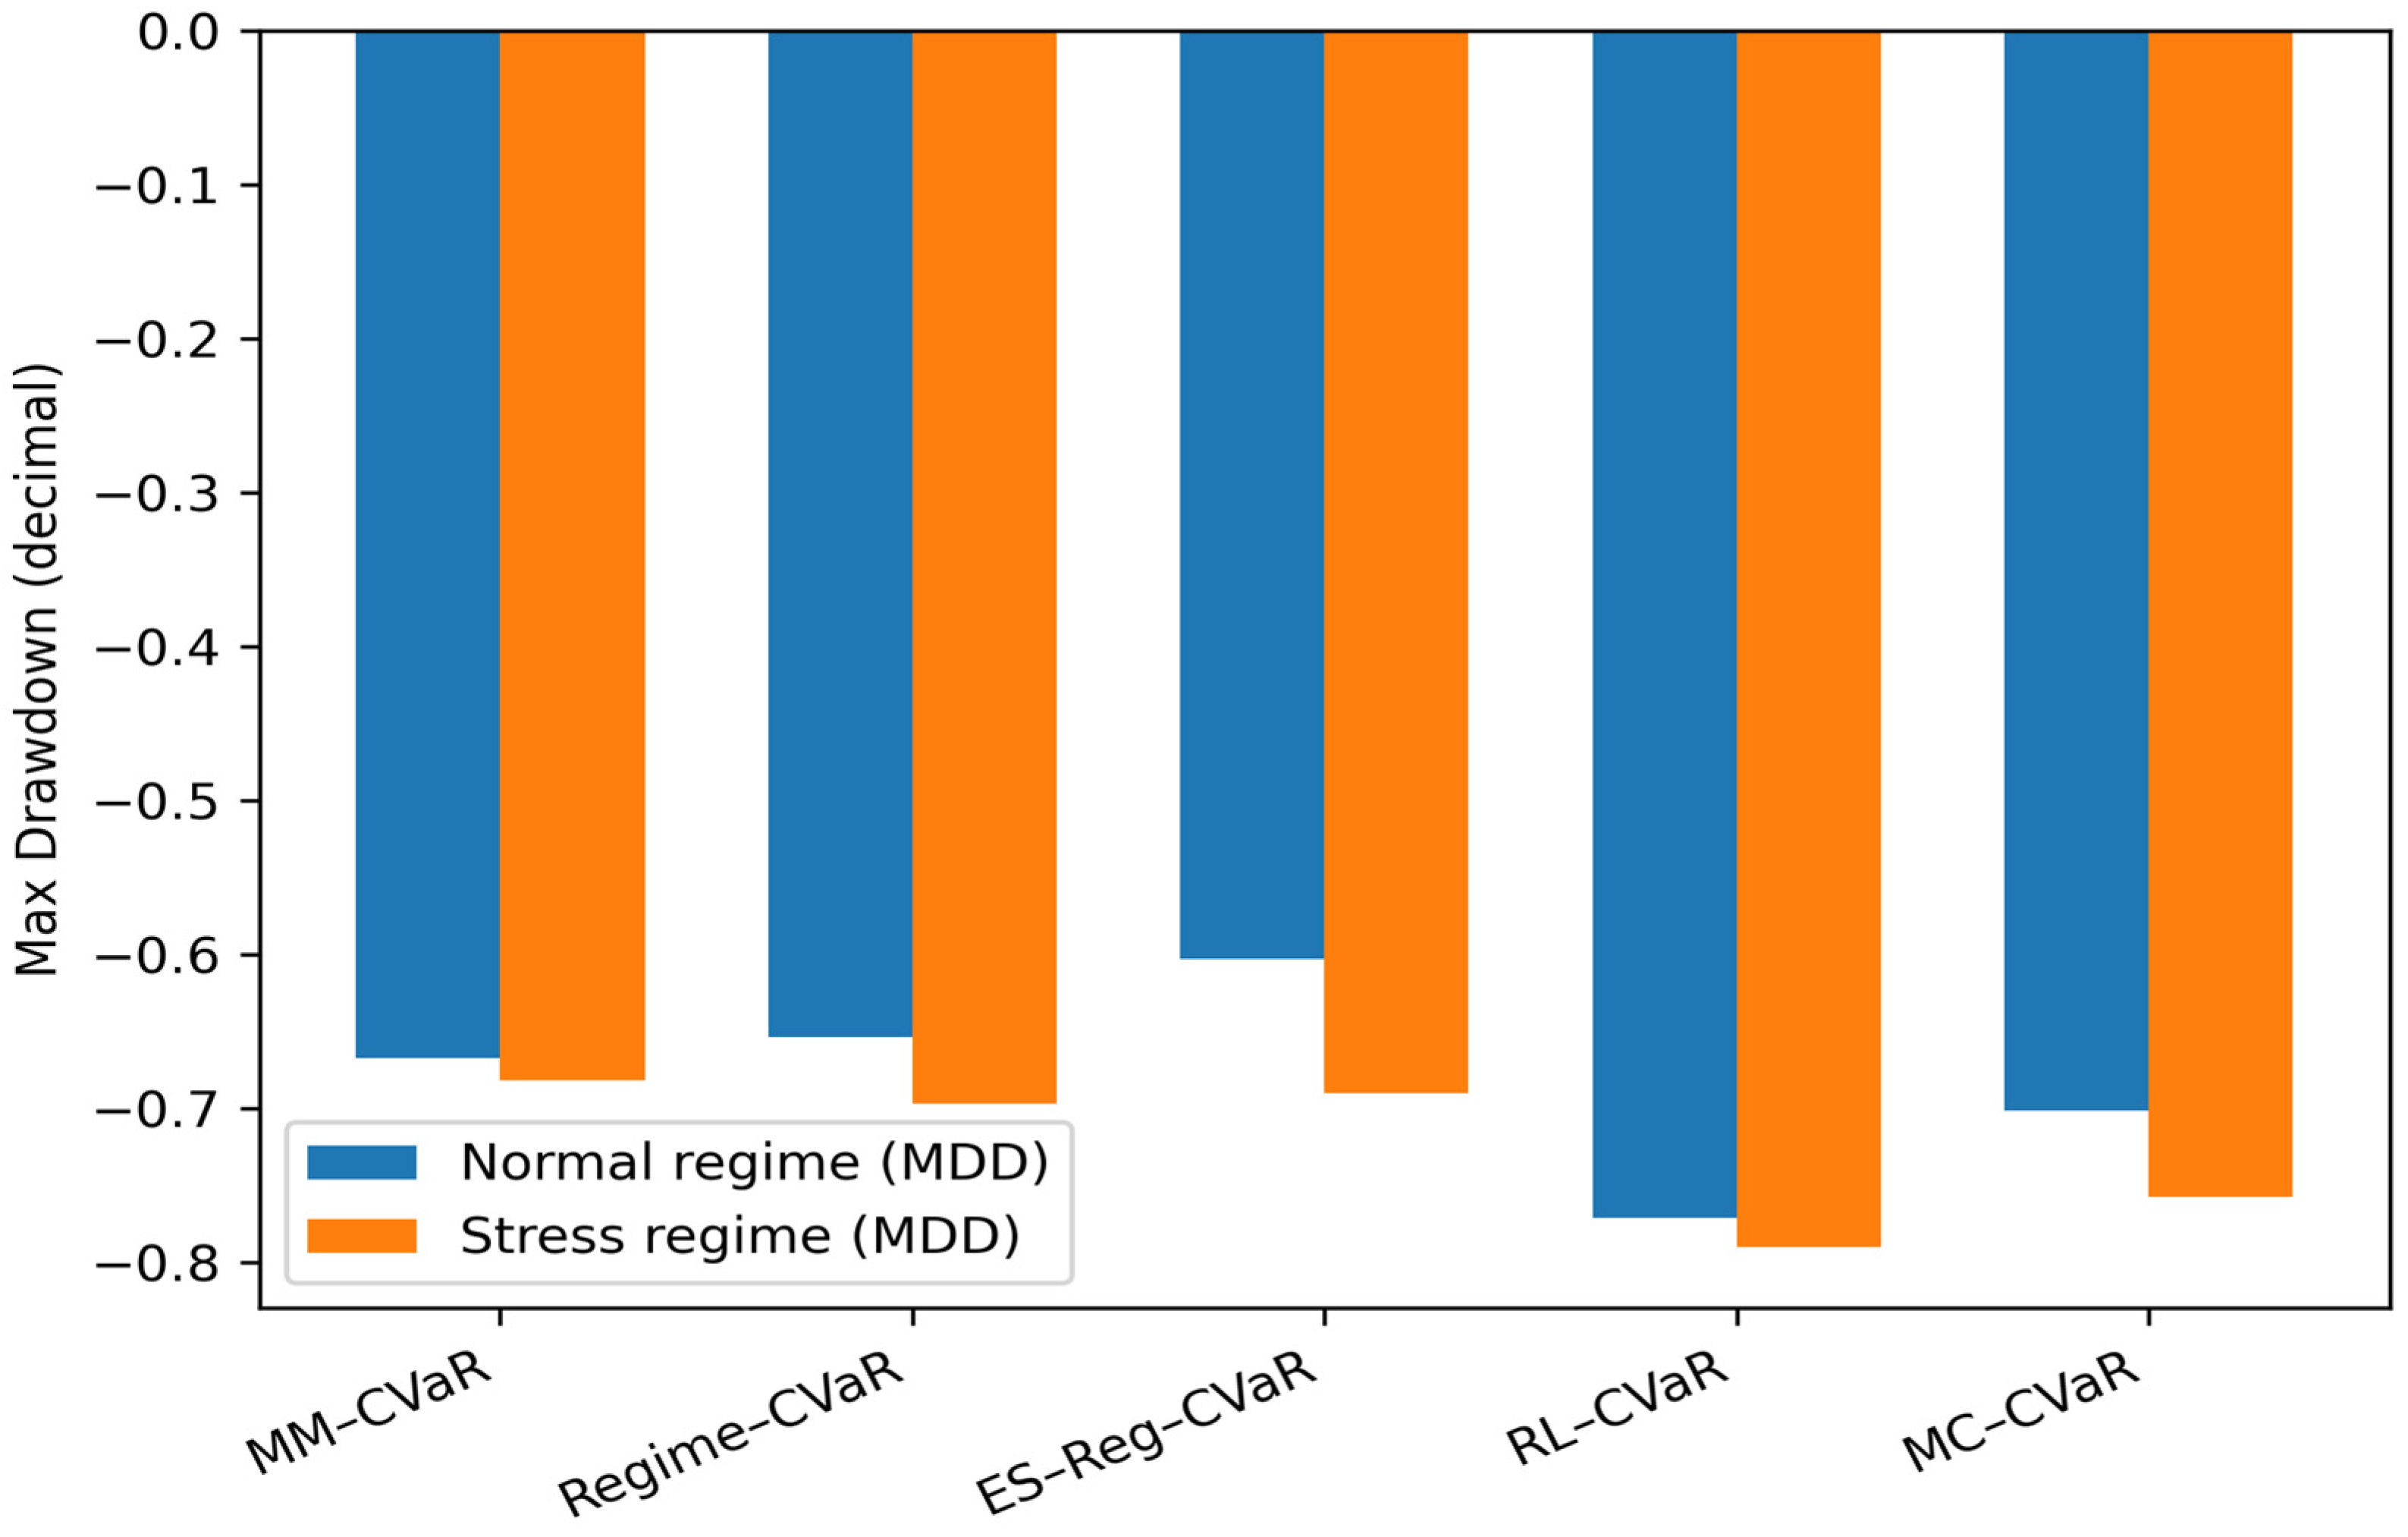
Table 3 shows that downside protection and return potential vary systematically across market regimes. The results provide clear evidence that strategy dominance is conditional on market regimes rather than stable across the full sample. In the normal regime, learning-based RL–CVaR and ES–Reg–CVaR strategies exhibit higher return potential but entail greater volatility and deeper tail losses, suggesting that superior average performance comes at the cost of increased exposure to downside risk. In contrast, under stress regimes, the Regime–CVaR strategy yields relatively lower CVaR(99%) values, indicating more effective downside protection. This improvement is economically meaningful, as it corresponds to a reduction in extreme losses during periods when capital preservation becomes the dominant investment objective. At the same time, the stress-period CVaR and maximum drawdown of the RL–CVaR strategy shift toward more adverse levels, suggesting that learning-based strategies may struggle to adapt when market dynamics change abruptly, and tail observations become sparse. These findings indicate that adaptivity does not necessarily translate into robustness under extreme stress.
Figure 3 compares the maximum drawdown of the portfolio strategies across normal and stress regimes and summarizes the regime-dependent differences in downside protection. The visual evidence reinforces the numerical results by showing that strategies exhibiting aggressive return-seeking behavior in normal regimes tend to experience disproportionately larger drawdowns during stress periods.
Overall, the regime-dependent analysis confirms that no single CVaR-based strategy uniformly dominates across market conditions. Instead, strategies that perform well in stable environments may expose investors to heightened downside risk during stress regimes, while more conservative, rule-based strategies provide comparatively stronger protection when market conditions deteriorate sharply. These results highlight the importance of aligning portfolio strategies with prevailing market regimes and investor objectives rather than relying on unconditional performance rankings.
4.4. Sensitivity Analysis (Lightweight Robustness)
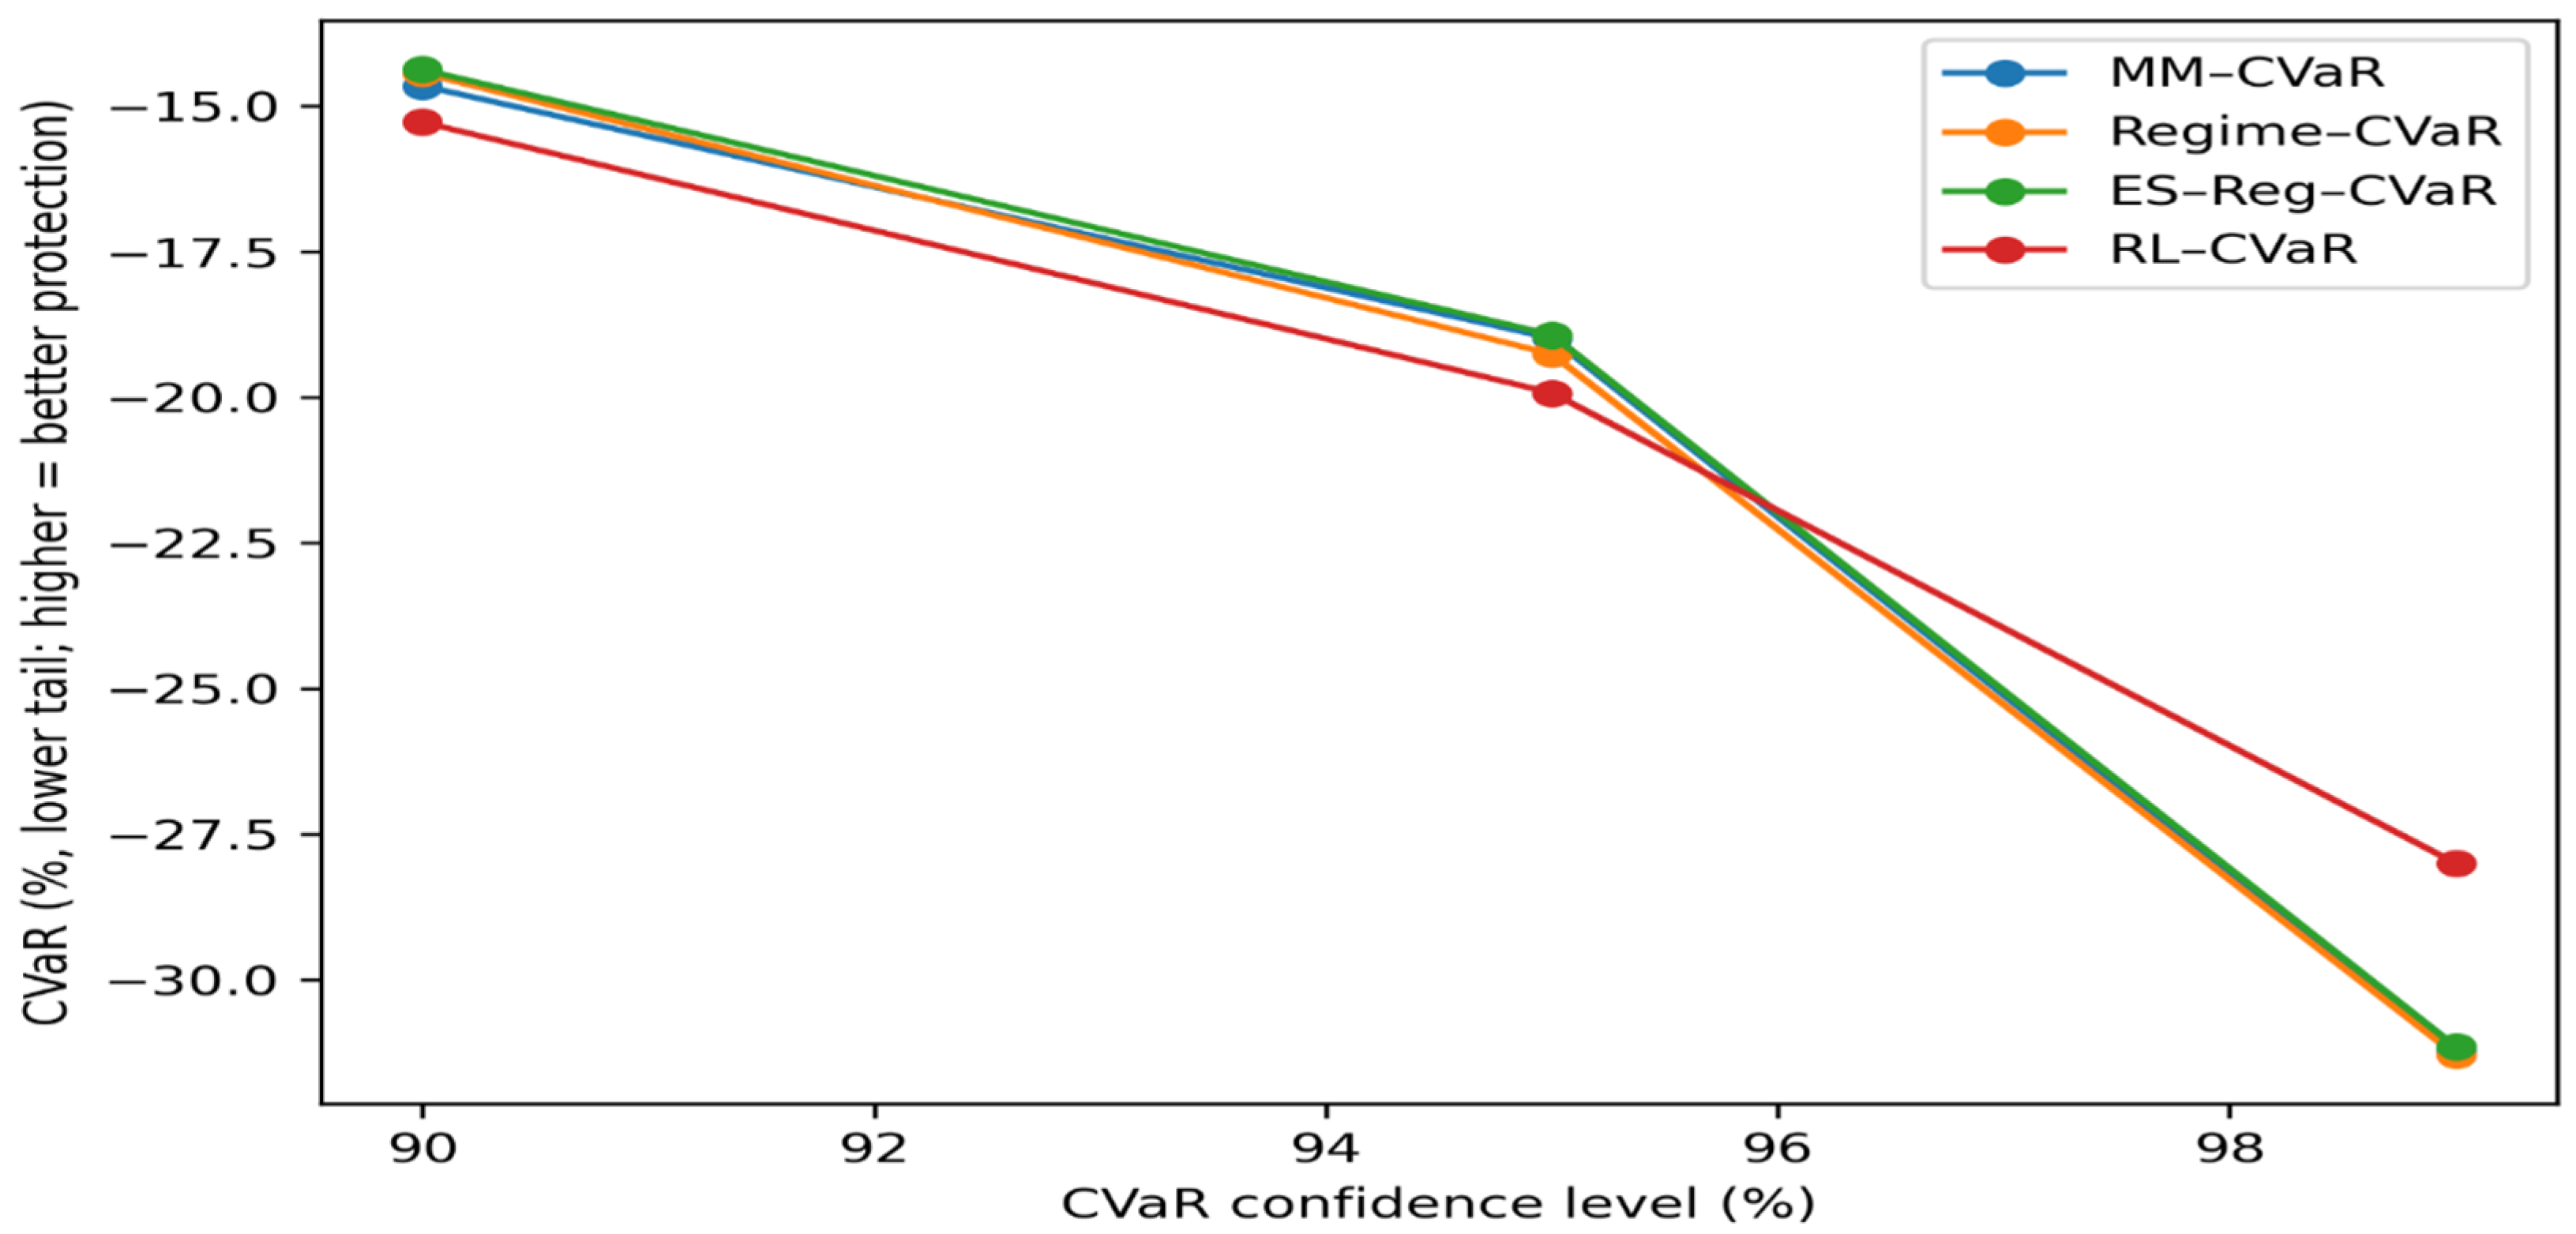
This subsection evaluates the extent to which the main findings depend on the choice of the CVaR confidence level. Specifically, the confidence level is varied across α = 90%, 95%, and 99%, and the resulting changes in tail losses and the relative ranking of portfolio strategies are examined. This analysis is designed to assess whether the observed performance patterns are robust to alternative definitions of tail depth rather than being an artifact of a single confidence-level choice.
Table 4 reports the sensitivity analysis of CVaR-based portfolio strategies across different confidence levels (α = 90%, 95%, and 99%), highlighting changes in tail losses and relative strategy rankings.
As the CVaR confidence level increases, the absolute magnitude of tail losses rises sharply across all strategies, reflecting the rapid escalation of extreme downside risk as deeper portions of the loss distribution are considered. At the same time, the relative ranking of strategies varies with α, demonstrating that strategy dominance is not invariant to tail depth. Strategies that appear relatively effective at moderate tail levels (α = 90% or 95%) may lose their advantage when the focus shifts to extreme tail risk (α = 99%). This instability in rankings provides direct empirical evidence that no universal dominant CVaR-based strategy exists across different tail-risk severities.
Figure 4 illustrates how tail losses for each strategy expand as α increases, highlighting those differences across strategies become more pronounced in the extreme tail region.
Notably, learning-based and hybrid strategies exhibit relatively steeper increases in CVaR at higher confidence levels, suggesting heightened sensitivity to rare but severe loss events. In contrast, rule-based and robust strategies exhibit more stable tail-loss profiles, though at the expense of lower return potential in calmer market conditions.
4.5. Bootstrap-Based Validation (Formal Robustness and Synthesis)
This subsection applies a formal robustness analysis based on a paired block bootstrap with 800 replications to validate the findings reported in
Section 4, without relying on specific assumptions about the distributional parameters. The objective is not to identify statistically dominant strategies, but to assess whether the observed performance patterns persist when sampling variability and temporal dependence are explicitly accounted for. Given the strong serial dependence and volatility clustering in cryptocurrency returns, a block bootstrap procedure is employed to preserve the temporal dependence structure of the data.
Table 5 reports bootstrap-based estimates of performance differences across CVaR-based strategies, along with their corresponding 95% confidence intervals, providing a formal robustness check of the regime-dependent results.
The bootstrap confidence intervals indicate that performance differences across strategies do not translate into strict statistical dominance under all conditions. In particular, most confidence intervals include zero, suggesting that apparent ranking differences in point estimates should not be interpreted as statistically significant. Nevertheless, the direction and relative magnitude of the mean differences remain consistent with the regime- and tail-depth-dependent patterns documented in
Section 4.1,
Section 4.2,
Section 4.3 and
Section 4.4. In moderate tail environments, MM–CVaR and ES–Reg–CVaR strategies tend to exhibit slightly improved downside protection relative to simpler benchmarks, whereas rule-based Regime–CVaR strategies show comparatively stronger and more stable reductions in maximum drawdown during stress regimes. These effects, while not universally statistically dominant, are economically relevant in contexts where capital preservation is prioritized.
In extreme tail regions, the performance of RL–CVaR policies becomes more volatile, as reflected by larger dispersion in bootstrap confidence intervals at the 99% confidence level. This instability suggests that learning-based strategies may be more sensitive to estimation error, sparse tail observations, and abrupt regime shifts, limiting their robustness under severe market stress.
Overall, the bootstrap-based validation reinforces the central conclusion of this study: no single CVaR-based portfolio strategy delivers uniformly superior performance across all market regimes and tail depths. Instead, the empirical evidence supports a conditional, context-dependent interpretation of downside risk management, in which portfolio choices must adapt jointly to market regimes, tail risk severity, and investor objectives. Robustness, in this setting, is therefore reflected in the persistence of economically meaningful trade-offs rather than in the existence of a universally dominant strategy.
5. Discussion
This study systematically demonstrates that the performance of CVaR-based portfolio strategies in tail-risk-dominated cryptocurrency markets varies across market regimes and risk depths. Rather than identifying a universally superior approach, the empirical evidence shows that downside risk management is inherently conditional, with strategy effectiveness depending jointly on market regimes, tail-risk severity, and the degree of strategic adaptivity. The empirical evidence confirms that the choice of downside risk management strategies is not universal but conditional, and it supports, with real market data, patterns consistent with prior theoretical and empirical findings.
5.1. Behavior of CVaR Strategies in Tail-Risk-Dominated Environments
The results in
Section 4 show that cryptocurrency return distributions deviate systematically from normality and exhibit pronounced fat tails. This reinforces the well-documented limitation of variance-based risk measures in underestimating extreme losses and provides empirical support for the use of tail-sensitive measures such as CVaR and Expected Shortfall. Recent evidence further confirms that dynamic CVaR estimates in cryptocurrency markets display regime-sensitive behavior and differ markedly across market phases, underscoring the inadequacy of static tail-risk representations in such environments (
Malek et al., 2023). However, the analysis also reveals that not all CVaR-based strategies manage tail risk with equal effectiveness. MC–CVaR and MM–CVaR strategies are highly sensitive to assumptions about the return distribution, and their protective capacity can be unstable under extreme conditions. This finding indicates that CVaR, while necessary for tail-risk control, is not sufficient on its own; its effectiveness critically depends on the information set, estimation method, and dynamic structure underlying the optimization process.
5.2. Market Regimes and Conditional Dominance of Strategies
One of the central findings is that relative strategy performance is highly regime dependent. In normal market conditions, learning-based (RL–CVaR) and hybrid (ES–Reg–CVaR) strategies tend to achieve higher returns, reflecting the advantage of data adaptivity in stable environments. At the same time, their CVaR and maximum drawdown may increase, highlighting an unavoidable risk–return trade-off. This pattern is consistent with recent studies showing that deep learning–based CVaR utility formulations can enhance return potential and tail-risk targeting in cryptocurrency portfolios, albeit at the cost of increased sensitivity to market instability (
Huang et al., 2025). In contrast, during stress regimes, regime-aware strategies such as Regime–CVaR deliver more stable downside protection. These results suggest that rule-based and regime-dependent strategies can dominate learning-based approaches when market conditions deteriorate abruptly and tail risk becomes the primary concern.
5.3. Tail Depth and the Absence of a Universal Strategy
Sensitivity analysis with respect to the CVaR confidence level shows that changes in tail depth systematically alter the relative ranking of strategies. ES–Reg–CVaR tends to provide stable protection in moderate tail environments, whereas under extreme tail risk, the loss behavior of RL–CVaR may shift markedly. This aligns with the empirical characteristics of cryptocurrency markets, in which extreme events are infrequent but severe, and implies that the notion of a single “best” strategy is inherently contingent on risk severity. Consistent with recent empirical and learning-based evidence in cryptocurrency risk management, these results reinforce the conclusion that strategy dominance is conditional rather than universal, varying jointly with market regimes and tail-risk depth (
Huang et al., 2025;
Malek et al., 2023). Accordingly, the empirical findings directly contradict the idea of unconditional dominance and instead support a regime- and tail-dependent view of portfolio risk management.
5.4. Robustness and Economic Interpretation
Formal bootstrap-based robustness analysis shows that strict statistical dominance across all conditions cannot be established. Nevertheless, the direction and magnitude of performance differences are consistent across subsamples, underscoring that the main contribution of the study lies not in identifying a statistical winner, but in revealing economically meaningful trade-offs relevant for real-world investment decisions. This distinction highlights that statistical significance does not necessarily translate into economically material improvements, particularly in highly volatile environments characterized by estimation error and deep tail uncertainty.
Specifically, Regime–CVaR appears more suitable for investors prioritizing downside protection under extreme stress, whereas ES–Reg–CVaR and RL–CVaR are better aligned with objectives focused on return enhancement in calm or moderately risky environments. This highlights the importance of aligning risk management strategies with investor objectives, risk tolerance, and prevailing market conditions.
5.5. Theoretical and Practical Implications
From a theoretical perspective, this study integrates CVaR-based portfolio optimization with learning-based and regime-adaptive approaches, providing an empirical interpretation of time inconsistency and scenario dependence in terms of conditional performance trade-offs. The results further clarify why learning-based strategies, despite their adaptive design, may underperform under extreme stress: such strategies rely on historical state–action relationships that may fail to generalize to unprecedented tail events, where observations are sparse, feedback signals are noisy, and regime shifts occur abruptly. Under these conditions, rapid structural breaks can undermine the stability of learned policies, favoring simpler, rule-based strategies that explicitly condition on regime information.
From a practical standpoint, the results indicate that in tail-risk-dominated markets, such as cryptocurrencies, risk management should not rely on a single strategy but rather on a flexible framework that combines multiple approaches, adapting to market regimes and risk depth. Overall, the study provides empirical evidence linking CVaR-based portfolio management theory to fundamental market dynamics and emphasizes the importance of regime- and tail-dependent strategy selection in high-risk digital asset markets.
6. Conclusions
This study empirically demonstrates that, in highly volatile, fat-tailed cryptocurrency markets, the effectiveness of tail-risk management varies systematically across market regimes and risk depths. Rather than supporting the existence of a universally optimal solution, the findings show that no CVaR-based portfolio strategy consistently dominates across all conditions and performance metrics. Instead, effective risk management requires a flexible, adaptive, and conditional approach aligned with prevailing market conditions.
The empirical analysis shows that the rule-based Regime–CVaR strategy tends to deliver relatively stable downside protection during severe market stress. In contrast, data-driven strategies such as ES–Reg–CVaR and RL–CVaR exhibit greater return potential during calm periods, but their performance is accompanied by a clear risk–return trade-off as tail risk deepens. This regime-dependent behavior highlights that apparent performance advantages are conditional and should be interpreted in light of changing risk environments rather than as evidence of unconditional superiority. These results underscore the need to evaluate tail-risk management using multiple, regime-dependent metrics rather than relying on a single performance measure.
Methodologically, the study provides an integrated empirical framework that combines CVaR-based portfolio optimization with rolling-window backtesting, market regime classification, sensitivity analysis, and block bootstrap validation. By jointly assessing statistical robustness and economic relevance, the framework facilitates a realistic evaluation of portfolio strategies under real-world market dynamics, where estimation error and tail uncertainty are substantial. The results, therefore, provide empirical evidence of the link between CVaR-based risk management and extreme conditions in cryptocurrency markets.
Nevertheless, the study has limitations. Market regimes are identified using a relatively simple volatility-based rule, which may be a simplification compared with more sophisticated latent-state models. In addition, the empirical evaluation is limited to a selected set of cryptocurrencies and a specific sample period; therefore, caution is warranted when generalizing the results to other asset classes.
Future research may extend this framework by adopting probabilistic or learning-based regime identification, combining CVaR with alternative downside risk measures, and more deeply integrating reinforcement learning and scenario-based risk management in dynamic decision-making environments. Such extensions would help clarify the conditions under which adaptive strategies can complement rule-based approaches and would further strengthen the link between portfolio management theory and practice in tail-risk-dominated markets.
Funding
This research received no external funding.
Institutional Review Board Statement
Not applicable.
Informed Consent Statement
Not applicable.
Data Availability Statement
Publicly available cryptocurrency price data were used in this study. Daily price data for BTC, ETH, BNB, XRP, and SOL were obtained from Yahoo Finance using the yfinance Python (3.10 version) package. To ensure reproducibility, the downloaded data were stored as local snapshot CSV files and subsequently transformed into weekly return series for the empirical analysis. The code used for data collection, preprocessing, and portfolio analysis is available from the author upon reasonable request.
Acknowledgments
Generative AI tools (OpenAI ChatGPT (GPT-4 series)) were used solely for language editing and clarity improvement. All scientific content, data analysis, interpretations, and conclusions were developed by the author.
Conflicts of Interest
The author declares no conflicts of interest.
References
- Acerbi, C., & Tasche, D. (2002). On the coherence of expected shortfall. Journal of Banking & Finance, 26(7), 1487–1503. [Google Scholar] [CrossRef]
- Artzner, P., Delbaen, F., Eber, J. M., & Heath, D. (1999). Coherent measures of risk. Mathematical Finance, 9(3), 203–228. [Google Scholar] [CrossRef]
- Artzner, P., Delbaen, F., Eber, J. M., Heath, D., & Ku, H. (2007). Coherent multiperiod risk-adjusted values and Bellman’s principle. Annals of Operations Research, 152(1), 5–22. [Google Scholar] [CrossRef]
- Barro, D., Consigli, G., & Varun, V. (2022). A stochastic programming model for dynamic portfolio management with financial derivatives. Journal of Banking & Finance, 140, 106445. [Google Scholar] [CrossRef]
- Bäuerle, N., & Ott, J. (2011). Markov decision processes with average-value-at-risk criteria. Mathematical Methods of Operations Research, 74(3), 361–379. [Google Scholar] [CrossRef]
- Belabbes, K., Elhachloufi, M., El Abidine Guennoun, Z., & El Attar, A. (2025). Uncertain portfolio optimization problems: Systematic review. Statistics, Optimization & Information Computing, 13(3), 961–976. [Google Scholar]
- Blay, K., Ghosh, A., Kusiak, S., Markowitz, H., Savoulides, N., & Zheng, Q. (2020). Multi-period portfolio selection: A practical simulation-based framework. Journal of Investment Management, 18(4), 94–129. [Google Scholar]
- Bouri, E., Shahzad, S. J. H., Roubaud, D., Kristoufek, L., & Lucey, B. (2020). Bitcoin, gold, and commodities as safe havens for stocks: New insight through wavelet analysis. The Quarterly Review of Economics and Finance, 77, 156–164. [Google Scholar] [CrossRef]
- Chakraborty, G., Chandrashekhar, G. R., & Balasubramanian, G. (2021). Measurement of extreme market risk: Insights from a comprehensive literature review. Cogent Economics & Finance, 9(1), 1920150. [Google Scholar] [CrossRef]
- Cui, T., Ding, S., Jin, H., & Zhang, Y. (2023). Portfolio constructions in cryptocurrency market: A CVaR-based deep reinforcement learning approach. Economic Modelling, 119, 106078. [Google Scholar] [CrossRef]
- Cui, T., Du, N., Yang, X., & Ding, S. (2024). Multi-period portfolio optimization using a deep reinforcement learning hyper-heuristic approach. Technological Forecasting and Social Change, 198, 122944. [Google Scholar] [CrossRef]
- Cui, X., Gao, J., Shi, Y., & Zhu, S. (2019). Time-consistent and self-coordination strategies for multi-period mean-conditional value-at-risk portfolio selection. European Journal of Operational Research, 276(2), 781–789. [Google Scholar] [CrossRef]
- Eggen, S., Espe, T. J., Grude, K., Risstad, M., & Sandberg, R. (2025). Financial time series uncertainty: A review of probabilistic AI applications. Journal of Economic Surveys. [Google Scholar] [CrossRef]
- Fairbrother, J., Turner, A., & Wallace, S. W. (2022). Problem-driven scenario generation: An analytical approach for stochastic programs with tail risk measure. Mathematical Programming, 191, 141–182. [Google Scholar] [CrossRef]
- Guo, X., & Ryan, S. M. (2023). Avoiding momentum crashes using stochastic mean-CVaR optimization with time-varying risk aversion. The Engineering Economist, 68(3), 125–152. [Google Scholar] [CrossRef]
- Huang, X., Tan, L., Su, H., & Cheah, J. E.-T. (2025). Using deep learning conditional value-at-risk–based utility function in cryptocurrency portfolio optimisation. International Journal of Finance & Economics. Advance online publication. [Google Scholar] [CrossRef]
- Krichene, N. (Ed.). (2012). Portfolio performance and value-at-risk. In Islamic capital markets: Theory and practice. Wiley. [Google Scholar] [CrossRef]
- Krokhmal, P., Uryasev, S., & Palmquist, J. (2002). Portfolio optimization with conditional value-at-risk objective and constraints. The Journal of Risk, 4(2), 43–68. [Google Scholar] [CrossRef]
- Kupper, M., & Schachermayer, W. (2009). Representation results for law invariant time consistent functions. Mathematics and Financial Economics, 2, 189–210. [Google Scholar] [CrossRef]
- Lesniewski, A., & Trigila, G. (2025). Beyond Monte Carlo: Harnessing diffusion models to simulate financial market dynamics. arXiv, arXiv:2412.00036v3. [Google Scholar] [CrossRef]
- Malek, J., Nguyen, D. K., Sensoy, A., & Tran, Q. V. (2023). Modeling dynamic VaR and CVaR of cryptocurrency returns with alpha-stable innovations. Finance Research Letters, 55(Part A), 103817. [Google Scholar] [CrossRef]
- Markowitz, H. (1952). Portfolio selection. The Journal of Finance, 7(1), 77–91. [Google Scholar] [CrossRef]
- Oliveira Filho, B. G. D., & Poker Junior, J. H. (2025). Asset allocation models: Evolution and diversity—A systematic literature review. Journal of Capital Markets Studies, 9(2), 132–150. [Google Scholar] [CrossRef]
- Paç, A. B., & Pınar, M. Ç. (2014). Robust portfolio choice with CVaR and VaR under distribution and mean return ambiguity. TOP, 22, 875–891. [Google Scholar] [CrossRef]
- Pflug, G., & Wozabal, D. (2007). Ambiguity in portfolio selection. Quantitative Finance, 7(4), 435–442. [Google Scholar] [CrossRef]
- Rockafellar, R. T., & Uryasev, S. (2000). Optimization of conditional value-at-risk. Journal of Risk, 3, 21–41. [Google Scholar] [CrossRef]
- Sahamkhadam, M., & Stephan, A. (2023). Portfolio optimization based on forecasting models using vine copulas: An empirical assessment for global financial crises. Journal of Forecasting, 42(8), 2139–2166. [Google Scholar] [CrossRef]
- Senescall, M., & Low, R. K. Y. (2024). Quantitative portfolio management: Review and outlook. Mathematics, 12(18), 2897. [Google Scholar] [CrossRef]
- Singh, A., & Ogunfunmi, T. (2022). An overview of variational autoencoders for source separation, finance, and bio-signal applications. Entropy, 24(1), 55. [Google Scholar] [CrossRef]
- Sodnomdavaa, T., & Lkhagvadorj, G. (2026). Financial statement fraud detection through an integrated machine learning and explainable AI framework. Journal of Risk and Financial Management, 19(1), 13. [Google Scholar] [CrossRef]
- Strub, M. S., Li, D., Cui, X., & Gao, J. (2019). Discrete-time mean-CVaR portfolio selection and time-consistency induced term structure of the CVaR. Journal of Economic Dynamics and Control, 108, 103751. [Google Scholar] [CrossRef]
- Takahashi, T., & Mizuno, T. (2025). Generation of synthetic financial time series by diffusion models. Quantitative Finance, 25(10), 1507–1516. [Google Scholar] [CrossRef]
- Wang, X., & Liu, L. (2025). Risk-sensitive deep reinforcement learning for portfolio optimization. Journal of Risk and Financial Management, 18(7), 347. [Google Scholar] [CrossRef]
- Wiese, M., Knobloch, R., Korn, R., & Kretschmer, P. (2020). Quant GANs: Deep generation of financial time series. Quantitative Finance, 20(9), 1419–1440. [Google Scholar] [CrossRef]
- Wu, D. (2016). Risk management and operations research: A review and introduction to the special volume. Annals of Operations Research, 237, 1–5. [Google Scholar] [CrossRef]
- Zhu, S., & Fukushima, M. (2009). Worst-case conditional value-at-risk with application to robust portfolio management. Operations Research, 57(5), 1155–1168. [Google Scholar] [CrossRef]
| Disclaimer/Publisher’s Note: The statements, opinions and data contained in all publications are solely those of the individual author(s) and contributor(s) and not of MDPI and/or the editor(s). MDPI and/or the editor(s) disclaim responsibility for any injury to people or property resulting from any ideas, methods, instructions or products referred to in the content. |