Article

Digital Finance, New Quality Productive Forces, and Government Environmental Governance: Empirical Evidence from Chinese Provincial Panel Data

School of Business, Beijing Language and Culture University, Beijing 100083, China
*
Author to whom correspondence should be addressed.
Int. J. Financial Stud. 2025, 13(3), 129; https://doi.org/10.3390/ijfs13030129
Submission received: 27 May 2025 / Revised: 18 June 2025 / Accepted: 30 June 2025 / Published: 8 July 2025
(This article belongs to the Special Issue Digital and Conventional Assets (2nd Edition))

Abstract

As the mainstream financial modality in the digital economy era, digital finance drives industrial digitization and green transformation through capital and technological support, enabling governments to advance environmental governance with greater precision, efficiency, and sustainability. Utilizing 2012–2023 panel data from 31 Chinese provinces, this study innovatively constructs a multidimensional panel data model for the quantitative analysis of the overall impact, heterogeneous effects, and spatial spillover effects of digital finance on government environmental governance. It further examines the mediating effect and the threshold effects of new quality productive forces, and the moderated mediation effects of green technological innovation and industrial collaborative agglomeration. In this study, (1) digital finance significantly drives government environmental governance, and this finding exhibits robustness; (2) digital finance exerts heterogeneous impact on government environmental governance, with more pronounced effects in eastern and sub-developed regions; (3) digital finance generates positive spatial spillover effects on government environmental governance; (4) new quality productive forces positively mediate the relationship between digital finance and government environmental governance; (5) green technological innovation exhibits dual moderation characteristics, moderating both “digital finance → new quality productive forces” and “new quality productive forces → government environmental governance,” while industrial collaborative agglomeration shows single moderation, specifically moderating “new quality productive forces → government environmental governance”; (6) the impact of digital finance on government environmental governance presents a nonlinear feature of “increasing marginal returns.” On these accounts, this study proposes targeted recommendations from six dimensions.

1. Introduction

Against the backdrop of increasingly prominent global environmental challenges, the digital economy has garnered widespread attention from countries worldwide due to its robust innovative vitality and transformative potential. Many nations have placed emphasis on the application of the digital economy in green development and achieved notable results. For instance, some international ports have significantly advanced their green and digital transformation by integrating digital technologies, setting exemplary cases for the industry (Su et al., 2024). To further elucidate how the digital economy empowers green development in multiple layers, numerous scholars have conducted in-depth research. They have found that in regions such as Europe and North America, where infrastructure and application models are mature, the digital economy more greatly weakens the vulnerability of energy systems (Dong et al., 2024). In countries with high incomes, stringent policy frameworks, and a strong manufacturing base, the digital economy demonstrates a notable capacity to drive innovation in renewable energy (Yi et al., 2024). For many developing countries undergoing a low-carbon energy transition, the digital economy has proven effective in alleviating financing constraints by broadening international green financing channels (Nepal et al., 2024). This wealth of empirical evidence provides a crucial basis for governments worldwide to promote green development through the development of the digital economy. As a core enabling tool within the digital economy system, digital finance can directly empower green development by leveraging its unique advantages of efficiency, transparency, and traceability, thereby offering significant support for enhancing the effectiveness of government environmental governance and achieving green transformation goals. The Chinese government has keenly recognized the immense potential of digital finance and attached great importance to its application in environmental governance. The Central Financial Work Conference, a pivotal decision-making meeting in China’s financial sector, proposed to make significant strides in five key areas: fintech finance, green finance, inclusive finance, pension finance, and digital finance (The Central People’s Government of the People’s Republic of China, 2023). The Third Plenary Session of the 20th CPC Central Committee further proposed to “focus on building a Beautiful China, accelerate the comprehensive green transformation of economic and social development, improve the ecological environmental governance system, promote eco-priority, conservation-intensive, green, and low-carbon development, and foster harmonious coexistence between humans and nature” (The Central People’s Government of the People’s Republic of China, 2024b). The Opinions of the State Council on Accelerating the Comprehensive Green Transformation of Economic and Social Development underscore the importance of “promoting green and low-carbon economic and social development” (The Central People’s Government of the People’s Republic of China, 2024a). The introduction of this series of pivotal policies not only reflects China’s heightened emphasis on green and low-carbon development but also signals the nation’s accelerated entry into a new phase of synergistic digital and green transformation.
Against this backdrop, the government increasingly highlights environmental governance, making it a top priority in administrative agendas and a prominent focus in local government work reports. As an innovative fusion of traditional finance and digital technologies, digital finance effectively channels social capital toward green and low-carbon sectors, accelerates the R&D and application of environmental protection technologies, and optimizes resource allocation efficiency through advanced technologies, including big data analytics. This process injects robust momentum into new quality productive forces development as well as offers indispensable technological platforms and economic incentives for government environmental governance efforts. It will assist in promoting high-quality economic and social development, achieving carbon peak and carbon neutrality goals, and realizing the modernization objective of human–nature harmonious coexistence.
In the new era seeing the robust development of digital finance being profoundly integrated with ecological civilization construction, examining the impact of the digital economy on government environmental governance, and clarifying the relationships and effects among digital finance, new quality productive forces, and government environmental governance, can reveal the inherent laws of digital-green synergistic development. This also helps digital finance to drive economic and social development, accelerate comprehensive green transformation, strengthen the ecological and environmental governance system, and expedite the cultivation of new quality productive forces from theoretical and practical perspectives. These efforts benefit the advancement of Chinese-style modernization theoretically and practically.
Scholars at home and abroad have carried out extensive investigations into the direct impact mechanisms and effects of digital finance, primarily focusing on three major domains: economic development, people’s livelihood and welfare, and the ecological environment. With regard to economic development, digital finance mainly positively impacts the overall quality of economic growth through factors of capital investment, etc., the degree of government intervention, and the urbanization rate (Qian et al., 2020). Meanwhile, digital finance also significantly promotes the enhancement of regional economic resilience (Yu et al., 2023). Regarding people’s livelihood and welfare, digital finance provides significant advantages in supporting the integrated development of rural industries. It is an indispensable part of the path of rural revitalization (He, 2020), beneficial for realizing common prosperity (W. Zhang et al., 2024). In terms of the ecological environment, digital finance significantly reduces the overall regional carbon emissions. It can assist in achieving the “dual carbon” goals by guiding digital finance to support both digital industrialization and industrial digitization (Y. Wang et al., 2022). Existing research on the direct impacts of digital finance in various fields is relatively abundant. However, the relevant literature is primarily restricted to single dimensions of digital finance’s impact, lacking a systematic analysis of its comprehensive effects. In particular, the mechanisms through which digital finance drives government environmental governance have not been fully revealed or explored.
Some domestic and foreign studies have also delved into the regional heterogeneous effects and spatial effects of digital finance. First, concerning the regional heterogeneity effects of digital finance, some scholars have discovered a “Matthew Effect” in its operation (X. Wang & Zhao, 2020). Moreover, given the regional disparities in the development of China’s real economy, digital finance significantly boosts the real economy, with a more pronounced effect in eastern regions versus central and western regions (Y. Wang et al., 2020). Second, regarding the spatial effects of digital finance, existing research has initially revealed that digital finance innovation may exhibit certain spatial spillover characteristics through empirical methods such as spatial econometric models. Its impact pathways on the high-quality development of the real economy in neighboring regions may demonstrate regional heterogeneity and involve a gradual and dynamic influence (Zhou et al., 2024). Additionally, by constructing spatial threshold models and incorporating multiple considerations such as regulation, innovation, and consumption effects, some scholars have verified the spatial threshold effects of digital finance on green economic growth, finding the enhanced negative spillover effects of digital finance on surrounding green economic growth with rising digital finance level (S. Pang et al., 2024). However, existing research is mostly confined to the regional economic perspective and lacks exploration of the regional heterogeneous effects and spatial effects of digital finance in government environmental governance.
In addition, some of the domestic and international literature has highlighted the indirect effects and threshold characteristics of digital finance. First, regarding the indirect effects of digital finance, it can lay the foundation for achieving common prosperity by significantly enhancing innovation and entrepreneurship vitality (L. Li, 2024); digital finance promotes regional entrepreneurship by facilitating household entrepreneurship (Tao et al., 2021); meanwhile, the effective utilization of digital finance may accelerate the urban industrial structure transformation, promote innovation and entrepreneurial activities, and serve as an important catalyst for developing resilient cities (C. Zhang et al., 2024); in addition, robust information technology allows digital finance to drive green technological innovation, thereby adding impetus to China’s low-carbon green development (M. Zhang & Liu, 2022); some scholars have also focused on industrial structure upgrading, arguing that the development of digital finance can comprehensively optimize the business environment and improve overall economic performance (W. Li et al., 2024). Second, regarding the threshold effects of digital finance, as digital finance dynamically evolves from its initial stage to a well-developed stage, the role of capital allocation efficiency in industrial structure upgrading changes from a reverse hindrance to a positive promotion. This role not only exhibits a trend of continuous enhancement but also possesses a dual threshold effect (X. Li & Ran, 2021). If the urbanization levels, digital finance development levels, and the three dimensions of digital finance are taken as threshold variables, digital finance exhibits a nonlinear trend of increasing marginal effects on urban economic efficiency, well driving the high-quality economic growth in China (Tian & Pan, 2021). There is a scarcity of literature on the transmission mechanisms and threshold characteristics of digital finance in government environmental governance, coupled with the absence of a comprehensive elucidation of the role of new quality productive forces in this context. In particular, no studies have deeply analyzed this transmission mechanism from the perspective of green technological innovation and industrial collaborative agglomeration.
By reviewing the aforementioned literature, this study makes some observations: Firstly, research on digital finance in recent years has been relatively abundant, paying special attention to its direct and indirect impact mechanisms and effects, spatial and regional heterogeneity effects, and nonlinear effects. Studies on government environmental governance have mostly centered on policy tools and effect evaluations, the economic and social impacts of environmental governance, and existing problems and feasible strategies. Moreover, in terms of research on government environmental governance tools, most of the literature still revolves around the influence of traditional financial instruments, such as “how financial development affects environmental pollution” or “how financial development impacts the level of government governance.” Secondly, the existing literature lacks systematic research on the relationship between digital finance and government environmental governance. As a crucial macro-control tool in the field of government environmental governance, the multidimensional links between digital finance and government environmental governance have yet to be fully uncovered. Thirdly, research findings on the construction of comprehensive indicator systems, multidimensional relationships, action and transmission mechanisms, and effect measurements that comprehensively consider digital finance, new quality productive forces, and government environmental governance are scarce. Existing research is mostly confined to single dimensions or partial perspectives. New quality productive forces, as a significant driving force for economic transformation and upgrading, have not been thoroughly explored in terms of the complex mechanisms through which digital finance influences government environmental governance. Fourthly, no empirical insights or policy recommendations have been made on the impact of digital finance development on government environmental governance by enhancing new quality productive forces. Existing research mostly remains at the theoretical analysis level, lacking systematic summaries and optimization suggestions for policy practice, making it difficult to provide effective support for the modernization of the environmental governance system. Against this backdrop, delving into the impact mechanisms of digital finance on government environmental governance not only enriches and perfects existing environmental governance theories but also serves as a necessary pathway to achieve higher-level and deeper environmental governance goals.
Therefore, this study contribute to the existing literature primarily in four aspects: Firstly, it is the first to incorporate digital finance as a novel macro-control tool into the research scope of government environmental governance, revealing the internal mechanisms through which digital finance influences environmental governance through multiple pathways such as new quality productive forces, green technological innovation, and industrial collaborative agglomeration, thereby filling a research gap in this field. Secondly, by measuring the multidimensional relationships between digital finance and government environmental governance, this study systematically expands the research dimensions of the relationship between digital finance and government environmental governance. Thirdly, this study develops a comprehensive evaluation indicator system specific to new quality productive forces, comprehensively measuring the levels of new quality productive forces in various regions. Through text analysis, it also constructs an indicator system to measure government environmental governance. Based on this, it systematically explores the role of new quality productive forces in the relationship between digital finance and government environmental governance, enriching the research evidence in this field. Fourthly, this study gives policy recommendations for enhancing the effectiveness of government environmental governance through digital finance by leveraging new quality productive forces. These recommendations include six aspects: accelerating the digital infrastructure construction, improving the digital financial supervision system, accelerating the digital transformation of the government, increasing green technological innovation, developing new quality productive forces considering local conditions, and improving the industrial synergy and regional collaboration mechanisms. These recommendations provide valuable empirical insights for empowering economic and social development and comprehensive green transformation through digital finance and improving the ecological environment governance system.

2. Theoretical Mechanisms and Research Hypotheses

Under the policy orientation of the nation’s commitment to realizing carbon peak and carbon neutrality goals, digital finance (DIF) not only effectively promotes energy conservation and emission reduction but also crucially regulates government environmental governance (GEG), primarily in three aspects as follows: Firstly, digital finance precisely identifies and analyzes the funding needs and risk characteristics of green and low-carbon projects, guiding social capital to efficiently flow into green sectors, optimizing the financial resource allocation mechanism, and facilitating low-carbon and environmentally friendly project financing and implementation, thereby driving the industrial structure to achieve green transformation. Secondly, digital finance utilizes data analysis and forecasting technologies to uncover key influencing factors and potential risk points in the process of energy conservation and emission reduction, providing data support for formulating and implementing government policies on energy conservation and emission reduction, and aiding the government in real-time monitoring of policy implementation effects. Thirdly, digital finance can integrate resources from various parties by establishing an information exchange platform for green financial products and services, reducing information asymmetry and transaction costs in the green financial market, improving market efficiency, and providing strong guarantees for the long-term stable development of the green financial market. On these accounts, this study raises the following hypothesis:
Hypothesis 1.
DIF has a significant promoting effect on GEG.
Digital finance development can enhance the government’s environmental governance effectiveness in China. However, the impact of digital finance may exhibit heterogeneous characteristics, which are reflected both in the regional dimension of geographical space and in the structural dimension of economic development levels.
Firstly, a gradient difference can be observed in industrial structure, environmental carrying capacity pressure, and digital infrastructure among the eastern, central, western, and northeastern regions of China. In the more eastern regions, where the concentration of high-tech industries is high, the demand for environmental governance is more focused on complex scenarios such as intelligent carbon emission monitoring and cross-border pollution collaborative governance. Digital finance can assist the government in achieving precise interventions through digital tools such as blockchain carbon accounts and environmental data asset securitization. In contrast, the western regions, with heavy ecological protection tasks and lower digital finance penetration rates, rely more on basic applications like targeted green credit allocation and digital platforms for ecological compensation in environmental governance. The differences in technological adaptability and governance scenarios may induce a difference in the marginal effects of digital finance in enhancing environmental governance efficacy. Collectively, this study sets forth the following hypothesis:
Hypothesis 2a.
The impact of DIF on GEG exhibits regional heterogeneous effects.
Secondly, in economically developed, sub-developed, and underdeveloped regions, the empowerment paths of digital finance for government environmental governance show significant differentiation. Governments in developed regions possess well-established digital governance platforms and market-oriented mechanisms, enabling them to deeply integrate digital financial tools with environmental governance means, forming a governance model that synergizes technology and institutions. Sub-developed regions are at a critical stage of transitioning from traditional governance models to digital governance. Digital finance development facilitates the transformation of regional environmental governance needs into quantifiable and tradable capital elements, improving market mechanisms through financial innovation applications and activating market forces to enhance governance efficacy. Underdeveloped regions, constrained by digital infrastructure and professional talent reserves, primarily rely on digital finance for attracting green capital, with environmental governance still dominated by traditional administrative means. Different regional financial development levels and governance approaches result in varying implementation difficulties and effect evaluations of digital finance in government environmental governance across different regions. Based on the aforementioned analysis, this study raises the following hypothesis:
Hypothesis 2b.
The impact of DIF on GEG exhibits heterogeneous effects based on economic development levels.
The unique operational model and advanced technological means of digital finance make it capable of breaking down the geographical barriers of traditional financial services, facilitating the cross-regional flow and sharing of environmental governance resources and information. Digital finance can lower the access thresholds for environmental governance resources by constructing open and interconnected financial platforms, enabling remote or underdeveloped regions to conveniently access advanced environmental protection technologies and governance experiences. This facilitates mutual learning and reference of environmental governance strategies across different regions, fostering positive spatial interactions and synergistic effects. In addition, relying on its powerful data analysis and prediction capabilities, digital finance can provide a more comprehensive and precise spatiotemporal perspective for government environmental governance decision-making. It helps governments integrate cross-regional environmental monitoring data, monitor policy implementation effects in real time, identify spatial differences and potential risks in environmental governance, and thereby formulate more scientific and reasonable cross-regional environmental governance strategies to achieve spatial spillover effects of environmental governance outcomes. Therefore, applying digital finance in the field of government environmental governance not only deepens the precision and efficiency of environmental governance but also promotes the cross-regional exchange and integration of environmental governance resources and strategies. On these accounts, this study raises the following hypothesis:
Hypothesis 3.
The impact of DIF on GEG exhibits spatial spillover effects.
New quality productive forces (NQPFs) are an advanced form of productivity that breaks away from traditional economic growth patterns and productivity development paths, featuring high technology, high efficiency, and high quality, aligning with the new development philosophy. Centered around technological innovation as its core driving force, new quality productive forces have spawned a multitude of emerging industries and cutting-edge technologies, which exhibit high growth potential and high risk in capital requirements. The flourishing development and widespread application of digital finance can precisely drive new quality productive forces formulation and advancement, accordingly indirectly facilitating the enhancement of government environmental governance. Firstly, digital finance effectively reduces the threshold and cost of capital allocation through efficient information processing and technological applications, providing strong financial support for strategic emerging industries. Strategic emerging industries, which are frequently propelled by high-tech innovations, demonstrate exceptional prowess in technological innovation and the enhancement of production capacity. Their rapid development not only facilitates industrial and structural transformation but also nurtures a batch of efficient and environmentally friendly new quality productive forces, remarkably driving the green transformation of the regional economy. Secondly, new quality productive forces enhance the precision and efficiency of environmental governance by virtue of intelligence, automation and other advanced technologies, as well as assist in weakening the reliance of industries on natural resources and mitigate environmental damage, alleviating the imbalance between economic development and environmental protection and laying a solid foundation for achieving environmental governance goals. Taking all these into account, this study sets forth the following hypothesis:
Hypothesis 4.
NQPFs mediate the impact of DIF on GEG, forming a transmission mechanism chain of “DIF enhances NQPFs—NQPFs boost GEG.”
With green and low-carbon characteristics, new quality productive forces have surpassed and upgraded traditional productive forces, thereby being endowed with the core attributes of green productive forces. The development of new quality productive forces is inseparable from technological innovation, especially the drive for green technological innovation. Relying on convenient information technology, digital finance facilitates new quality productive forces to develop vigorously by continuously innovating financial products and services. Green technological innovation (GTEC) typically highlights the R&D and application of environmentally friendly and resource-saving technologies, which have significant environmental benefits and positive market expectations. This can attract a large number of investors, leading to more precise and efficient capital allocation, thereby providing robust support for the green development of industries and the transformation and upgrading of traditional industries. In addition, the persistent iteration and widespread application of green technologies facilitate environmental protection concepts to be integrated into all aspects of production and life. This not only enhances enterprises’ awareness of emission reduction but also provides green technological support for nurturing emerging and future industries, assisting in the in-depth implementation of government environmental governance work. Collectively, this study sets forth the following hypothesis and the theoretical mechanism illustrated in Figure 1.
Hypothesis 5a.
GTEC can moderate the mediating effect of NQPFs between DIF and GEG, exhibiting dual moderation characteristics. It moderates both the transmission mechanism of “DIF promotes NQPFs” and “NQPFs drive GEG.”
As a significant manifestation of regional economic integration, industrial collaborative agglomeration (ICA) is characterized by the concentrated spatial layout and mutual collaboration among different industries. This agglomeration phenomenon may positively affect the process by which new quality, productive forces promote government environmental governance. The factors of talent, capital, and information are more concentrated within industrial agglomeration areas, facilitating the formation of close and efficient industrial and supply chain relationships among enterprises and between enterprises and research institutions. This enables more rational allocation and utilization of resources, thereby helping to reduce resource waste and environmental pollution as well as improve the environmental governance efficiency. In addition, the scale benefits brought by industrial agglomeration facilitate frequent and efficient communication and cooperation among enterprises, which will encourage enterprises to increase production efficiency and lower costs for technological research and development. Specifically, enterprises can reserve sufficient funds and space for technological research and development innovation, production process innovation, and the improvement of end-of-pipe pollution control capabilities, accelerating green development transformation, and providing new approaches and means for government environmental governance. The following hypothesis is proposed accordingly, and the theoretical mechanism is illustrated in Figure 2.
Hypothesis 5b.
ICA can moderate the mediating effect of NQPFs between DIF and GEG, exhibiting a single moderation characteristic, specifically moderating the transmission mechanism of “NQPFs drive GEG.”
New quality productive forces are driven by the deepening application of new technologies, accompanied by the rapid emergence of new industries, new business forms, and new models. They not only signify changes at the productive and socio-economic levels but also imply profound transformations at the production relations and social system levels. Such transformations are likely to reshape the allocation pattern of financial resources and drive innovative shifts in the approaches and methods of environmental governance. Therefore, as new quality productive forces advance continuously, the enabling effect of digital finance on government environmental governance may exhibit nonlinear characteristics. In the initial stage of the development of new quality productive forces, the effect of digital technology in empowering traditional financial services is limited, and the promotional role of digital finance in government environmental governance is relatively restricted. However, as new quality productive forces continue to progress, especially when frontier technologies of big data and AI, etc., achieve breakthroughs and digital technology is deeply integrated with traditional financial formats, the boundaries of financial services are continuously expanded, invigorating the flow of funds across various sectors of the socio-economic fields. During this process, the integration of digital finance and government environmental governance becomes increasingly close. Digital finance can precisely match resources, making the allocation of funds for government environmental governance projects more transparent, project supervision more efficient, and effectiveness evaluation more accurate. Furthermore, as industrial digitization and digital industrialization develop fast, digital finance will further tap into the potential of government environmental governance, bringing more possibilities for the innovation of government governance models and the enhancement of governance effectiveness. On these accounts, this study sets forth the following hypothesis:
Hypothesis 6.
There exists a nonlinear characteristic of “increasing marginal effect” in the impact of DIF on GEG, meaning that as NQPFs improve, DIF can more significantly promote GEG.

3. Research Design

3.1. Data Sources

This study selects 2012–2023 panel data from 31 provinces in China as the research sample. The main data sources are WIND, CSMAR, the websites of the National Bureau of Statistics and the National Intellectual Property Administration, and yearbooks such as the China Statistical Yearbook, China Financial Yearbook, China Industry Statistical Yearbook, China Energy Statistical Yearbook, China Environmental Statistical Yearbook, and the statistical yearbooks of each province. This study employs the linear interpolation method for the estimation and supplementation of missing data regarding certain years or regions, thereby ensuring that the sample data are consistent and complete.

3.2. Description of Variables

3.2.1. Dependent Variable

The dependent variable is government environmental governance (GEG). There is currently no unified measurement standard for government environmental governance in the existing literature. The existing indicators can be mainly categorized into several types: First, pollution emissions that can directly reflect the actual effectiveness of governance (P. Zhang & Xu, 2024); second, indicator systems for environmental regulation constructed based on different policy tools or categorized according to different types of regulations (L. Li & Sheng, 2018; X. Peng & Li, 2016); third, indicators that can reflect the government’s resource allocation for environmental governance, such as per capita investment in pollution source control and the investment proportion in pollution source control in GDP (F. Wang et al., 2020). These indicators each have their own focus, but a single indicator often emphasizes only one aspect, adding to the difficulty in comprehensively measuring the overall situation of local government environmental governance policies.
This study draws on the text analysis methods employed by Q. Wang and Tian (2021) and S. Chen and Chen (2018). It utilizes Python 3.8 to crawl the text content of government work reports from various provincial governments and conducts word segmentation processing. After filtering out 15 environment-related keywords (as shown in Table 1), this study calculates the proportion of their word frequencies relative to the total word count of the reports for government environmental governance measurement. Government work reports serve as outlines for administering the government in accordance with the law and executing decisions and resolutions of the legislative bodies. They not only summarize the work of the past year but also plan and deploy the future work direction, possessing high authority and guidance. Therefore, this indicator can both intuitively and timely reflect the government’s attention to environmental governance work and demonstrate the government’s inclination and support in formulating relevant environmental protection policies and allocating resources.

3.2.2. Independent Variable

The explanatory variable is digital finance (DIF). This study selects the Peking University Digital Financial Inclusion Index for measuring the degree of digital financial development in each province (Guo et al., 2020). Additionally, this study uses the sub-indicators of the Digital Financial Inclusion Index for robustness tests, i.e., coverage breadth (DIF_CB), usage depth (DIF_UD), and digitization level (DIF_DL).

3.2.3. Control Variables

Considering the multiple factors affecting government environmental governance and referring to the existing literature, this study selects government intervention, urbanization level, education quality, degree of marketization, agricultural development level, level of openness, industrial structure, and the level of traditional financial development as control variables. Among them, the government intervention is measured by the proportion of public fiscal expenditure to GDP, denoted as GOV; the urbanization level is measured by the urbanization rate, denoted as URBAN; the education quality is characterized by the teacher/student ratio in basic education, denoted as EDU; the degree of marketization is represented by the marketization index of each province, denoted as MARKET; the agricultural development level is measured by per capita grain output, denoted as AGR; the level of openness is measured by the proportion of the total value of import and export trade converted into RMB at the current year’s exchange rate to the regional GDP, denoted as OPEN; the industrial structure is evaluated by the ratio of the added value of the tertiary industry to that of the secondary industry, denoted as STRU; traditional financial development level is evaluated by the deposit/loan ratio of financial institutions, denoted as FIN.

3.2.4. Mediating Variable

The mediating variable is new quality productive forces (NQPFs). Referring to the relevant literature (Lu et al., 2024; Cai & He, 2024; Han, 2024; Ren et al., 2024), this study develops a comprehensive “trinity” index system comprising technological productivity, digital productivity, and green productivity. Given the limited consideration of green productivity in previous studies and the potential lack of examination of the synergistic effects among the three dimensions in indicator systems with fewer dimensions, this study optimizes and adjusts the tertiary and quaternary indicators of the existing index system. It constructs a highly comparable, representative, and easily measurable measurement index system aimed at more objectively and thoroughly demonstrating new quality productive forces. The entropy method is employed in this study to calculate the overall index of the NOPFs index system (Table 2).

3.2.5. Moderating Variable

The moderating variables are green technological innovation (GTEC) and industrial collaborative agglomeration (ICA).
Firstly, some studies predominantly measure green technological innovation by input-output indicators or the number of patent applications for green technology in a single industry (Zhao & Li, 2024; Ren et al., 2014). However, it is difficult to completely measure green technological innovation solely considering the overall innovation input and output, and green technological innovation in a single industry cannot comprehensively reflect the overall green technological innovation. Moreover, green technology patent applications in a single industry have not yet generated practical utility and lack applicability. Based on this, combining the findings of Wu et al. (2022), this study uses the International Patent Classification Green List provided by the World Intellectual Property Organization (WIPO) as a benchmark, measuring green technological innovation by taking the logarithm of the number of green technology patents granted by the National Intellectual Property Administration.
Secondly, employing the measurement method of W. Wang and Sui (2022), this study calculates the spatial synergy degree between producer services and high-tech industries in each provincial administrative region to construct an ICA index. First, it calculates the location entropy of producer services and high-tech industries:
R i j = ( e i j E i ) / ( e j E )
where j and i denote the region and the industry, respectively. e i j is the employment number of the industry i in the region j , E i is the employment number of the industry i nationwide, e j is the employment number of all industries in the region j , and E is the total employment number nationwide. Then, the location quotients of the manufacturing industry and producer services are used for constructing their ICA index.
I C A j = 1 R m j R s j / R m j + R s j
where R m j and R s j , respectively, represent the location quotients of the manufacturing industry and producer services in region j . A larger ICA index indicates closer agglomeration levels of the manufacturing industry and producer services in the region j and higher ICA among them.

3.2.6. Threshold Variable

The threshold variable is new quality productive forces (NQPFs). Considering that government environmental governance in each province is not only influenced by digital finance but also by new quality productive forces, this study will further explore the possible nonlinear characteristics of this influence effect.

3.3. Descriptive Statistics

The mean value of the government environmental governance index (GEG) is 3.8778, with a min value of 1.4482, a maximum value of 7.4988, and a standard deviation (SD) of 1.0802 (Table 3), indicating significantly different degrees of government environmental governance among provinces. The digital finance index (DIF) has a mean value of 5.5358, with a min value of 4.1185, a max value of 6.2520, and a SD of 0.4313, which shows different digital finance development degrees among provinces. Overall, the imbalance in development among provinces is quite obvious.

3.4. Correlation Analysis

According to Table 4, there are significant correlations among the core variables. Specifically, government environmental governance, digital finance, and other variables exhibit obvious positive correlations with each other.

3.5. Model Setting

3.5.1. Setting of the Benchmark Model

For examining the direct effect of digital finance on government environmental governance, this study builds a two-way fixed-effects panel model:
G E G i t = α 0 + α 1 D I F i t + α C O N T R O L S i t + μ i + θ t + ε i t
where G E G i t is the government’s environmental governance degree, D I F i t is the degree of digital finance development, C O N T R O L S i t is the set of control variables; α 0 is the intercept term; α 1 , and α are coefficients; μ i and θ t are the individual fixed effect and time fixed effect, respectively; ε i t is the random disturbance term; i is the province and t is time.

3.5.2. Setting of the Spatial Effect Model

Digital finance utilizes digital technology to break spatial boundaries, effectively promoting the optimal allocation of resources, and may interact and influence government environmental governance measures spatially. Therefore, this study builds the following model by combining Model (3) with the spatial weight matrix:
G E G i t = α 0 + ρ W × G E G i t + β x i t + φ W × X i t + μ i + θ t + ε i t
ε i t = λ W ε i t + v i t
where X i t represents the core independent variable and control variables, W denotes the spatial weight matrix, and ρ is the spatial autocorrelation regression coefficient. This formula represents the Spatial Durbin Model (SDM) when λ = 0 , the Spatial Autoregressive Model when λ = 0 and φ = 0, and the Spatial Error Model when ρ = 0 and φ = 0 , it is regarded as the Spatial Error Model.

3.5.3. Setting of the Mediating Effect Model

For exploring the mediating role of new quality productive forces, this study refers to the relevant literature (Wen & Ye, 2014) and combines Model (3) to construct the following mediation effect model:
N Q P F s i t = β 0 + β 1 D I F i t + β C O N T R O L S i t + μ i + θ t + ε i t
G E G i t = γ 0 + γ 1 D I F i t + γ 2 N Q P F s i t + γ C O N T R O L S i t + μ i + θ t + ε i t
where N Q P F s i t is the mediating variable. This study examines the significance level of β 1 × γ 2 by using the Bootstrap method. The case that the result is and is not significant demonstrates the presence and absence of a mediation effect, respectively. Moreover, this study tests γ 1 . If the result is significant, there is an obvious direct effect, and there may be other mediating variables; if not, there is an indirect effect. In addition, this study also uses the Sobel method for further testing. The case that the result is and is not significant demonstrates the presence of a significant indirect effect and the absence of a mediation effect, respectively.

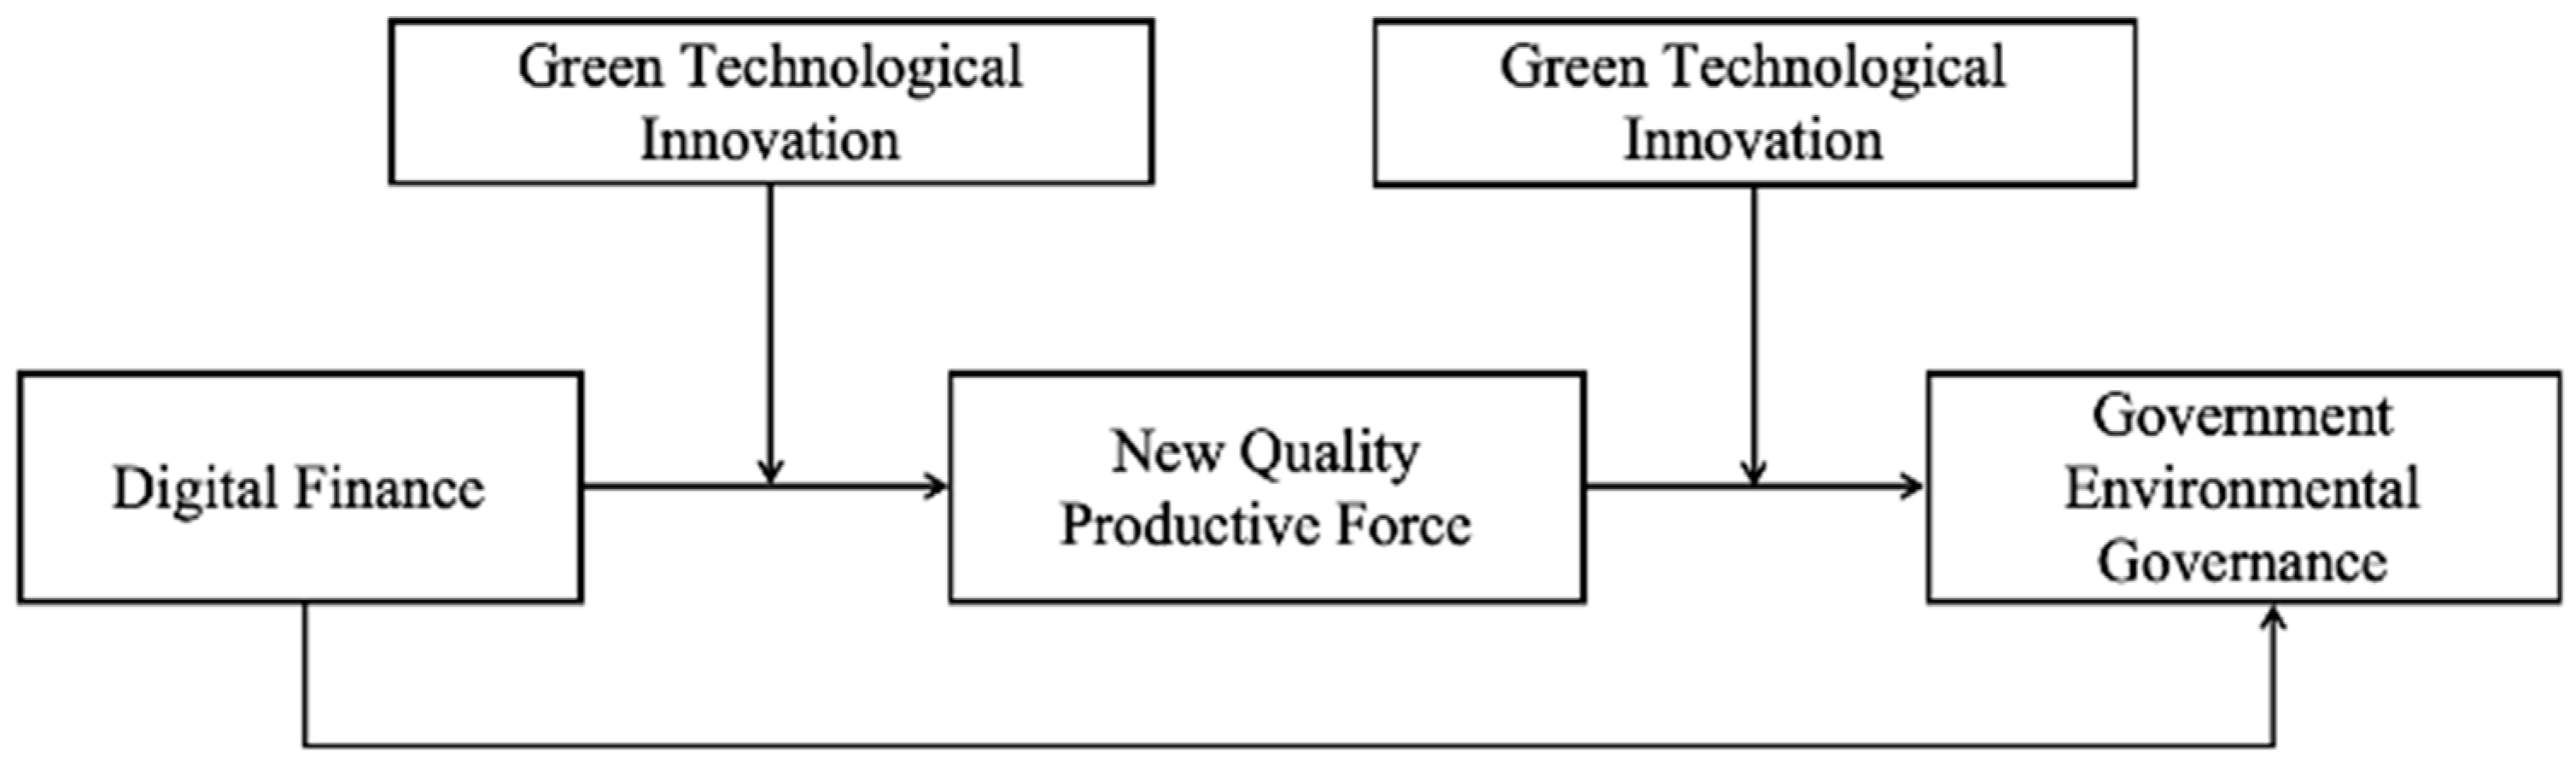
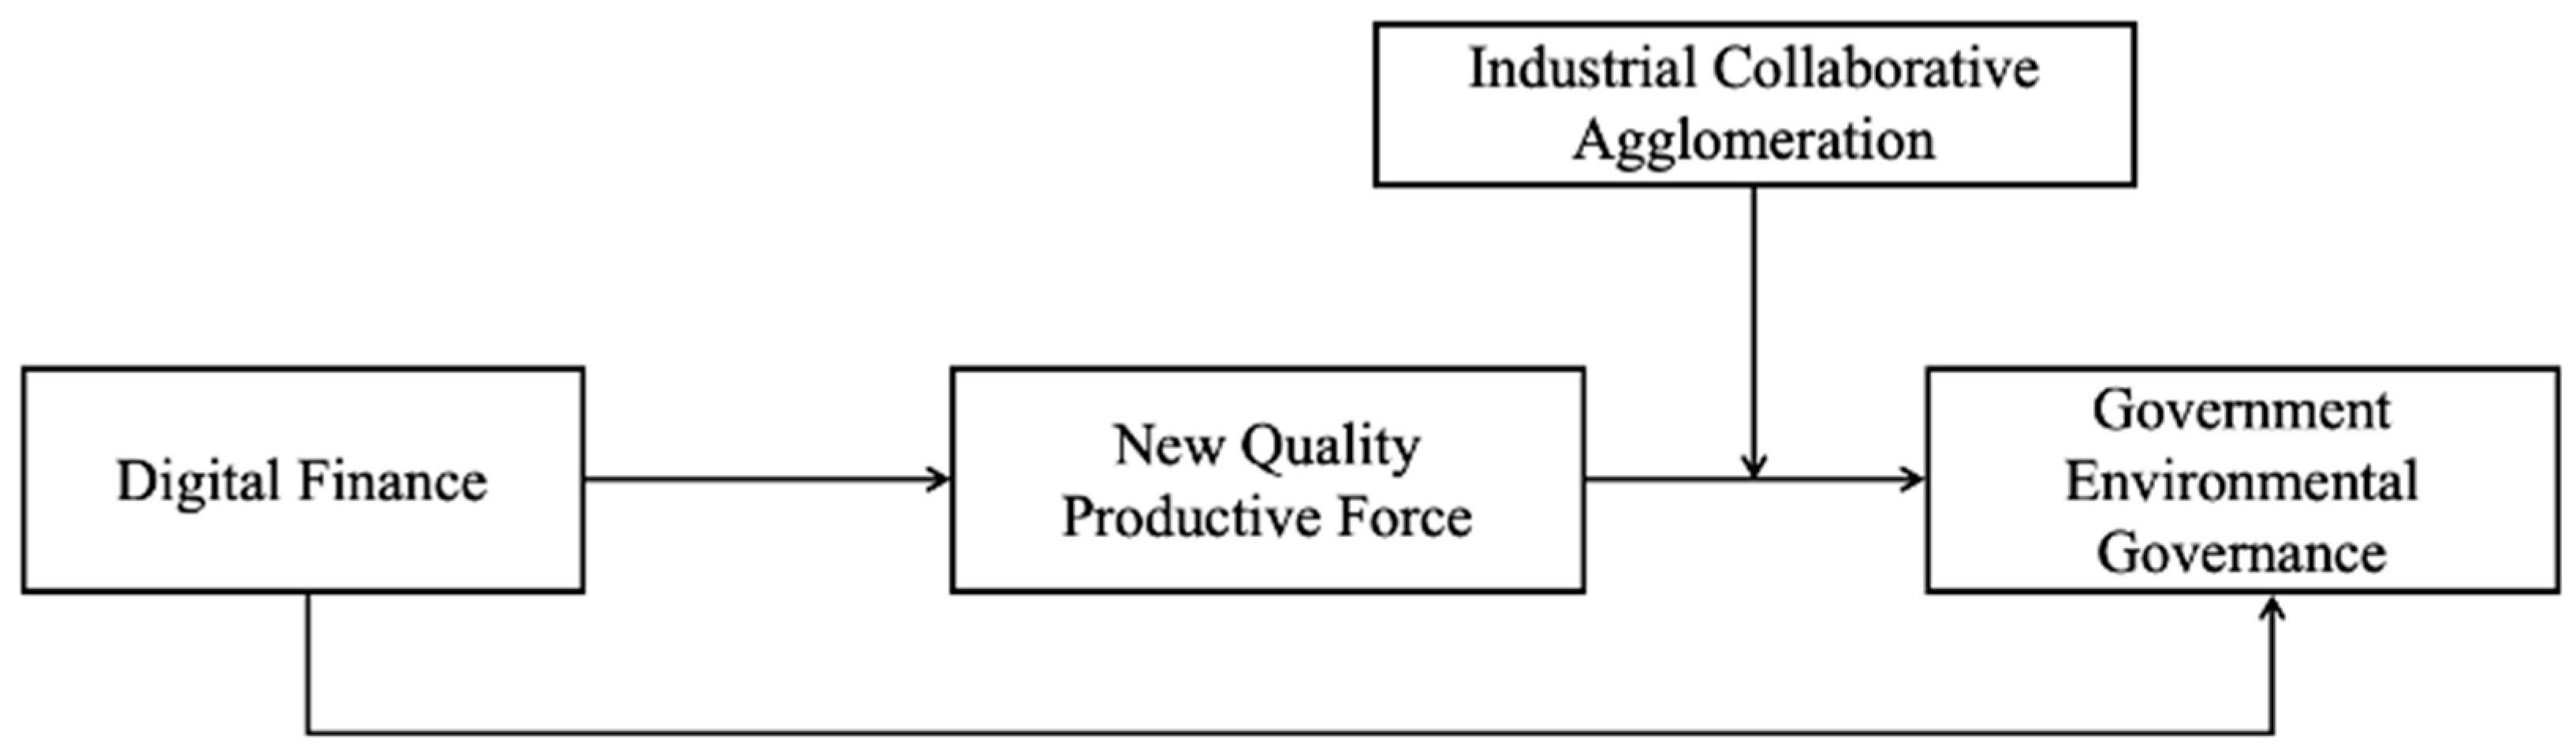
3.5.4. Setting of the Moderated Mediation Effects Model

To explore whether green technological innovation and industrial collaborative agglomeration can moderate the mediation effect among digital finance, new quality productive forces, and government environmental governance, this study constructs a moderated mediation effect model and uses the Bootstrap method (Preacher & Hayes, 2008) for testing.
First, the model below is set to test the dual-moderated mediation effect of green technological innovation:
G E G i t = α 0 + α 1 D I F i t + α 2 N Q P F s i t + α 3 G T E C i t + α 4 N Q P F s i t × G T E C i t + α 5 D I F i t × G T E C i t + α C O N T R O L S i t + μ i + θ t + ε i t
N Q P F s i t = β 0 + β 1 D I F i t + β 2 G T E C i t + β 3 D I F i t × G T E C i t + β C O N T R O L S i t + μ i + θ t + ε i t
where the moderated mediation effect = ( α 2 + α 4 G T E C i t )( β 1 + β 3 G T E C i t ). G T E C i t represents green technological innovation, D I F i t × G T E C i t represents the interaction term between DIF and GTEC, and N Q P F s i t × G T E C i t represents the interaction term between NQPFs and GTEC.
Second, to test the single-moderated mediation effect of industrial collaborative agglomeration, this study sets the model as follows:
G E G i t = α 0 + α 1 D I F i t + α 2 N Q P F s i t + α 3 I C A i t + α 4 N Q P F s i t × I C A i t + α C O N T R O L S i t + μ i + θ t + ε i t
N Q P F s i t = β 0 + β 1 D I F i t + β C O N T R O L S i t + μ i + θ t + ε i t
where the moderated mediation effect = ( β 2 + β 4 I C A i t ) α 1 . I C A i t represents industrial collaborative agglomeration, and N Q P F s i t × I C A i t represents the interaction term between NQPFs and ICA.

3.5.5. Setting of the Threshold Effect Model

For further exploring the nonlinear characteristics between digital finance and government environmental governance, as well as to measure the existence of a threshold and the threshold characteristics of the impact of digital finance on government environmental governance, this study constructs the panel threshold model (8a) referring to the relevant literature (Hansen, 1999; Q. Wang, 2015), coupled with extending it to the multi-threshold panel model shown in Model (8b):
G E G i t = α 0 + α 1 D I F i t I Z κ 1 + α 2 D I F i t I Z > κ 1 + α C O N T R O L S i t + μ i + θ t + ε i t
G E G i t = α 0 + α 1 D I F i t I Z κ 1 + α 2 D I F i t I κ 1 < Z κ 2 + + α n D I F i t I Z > κ n + α C O N T R O L S i t + μ i + θ t + ε i t
where Z is the threshold variable, κ 1 . . . κ n represents the threshold value, I ( · ) is the indicator function, α 0 is the intercept term, α 1 and α 2 are the coefficients to be estimated in the model.

4. Empirical Testing and Analysis of Results

4.1. Benchmark Regression Analysis

Table 5 presents the baseline regression results of how digital finance affects government environmental governance. Columns (1)–(4) illustrate the fitting results with control variables and fixed effects included. In Column (5), the regression coefficient of DIF is 0.6701, passing the 1% CI test. Considering fixed effects and control variables, digital finance still greatly boosts the level of government environmental governance, thus proving Hypothesis 1. Digital finance promotes resource allocation efficiency to improve through technological innovation and the upgrading of financial service models. The popularization and application of digital finance not only provide new tools and means for government environmental governance but also enhance the precision and transparency of environmental supervision, thereby effectively promoting to improve the government environmental governance level. This conclusion provides quantitative evidence for digital finance to empower government environmental governance and gives direction for better promoting the development of both.

4.2. Heterogeneity Analysis

4.2.1. Regional Heterogeneity Effect

The digital finance development degree and government environmental governance effectiveness are remarkably different in different regions of China. This study first divides the sample into four regions: eastern, central, western, and northeastern, by employing the classification method of the National Bureau of Statistics, for heterogeneity testing. Columns (1)–(4) of Table 6 indicate that in the eastern region, the promoting effect of digital finance on government environmental governance is the most significant, with a value of 0.6584. The coefficients for the central, western, and northeastern regions are 0.5424, 0.4811, and 0.4394, respectively, showing a gradual decline, thus proving Hypothesis 2a. The possible reason for the differences may lie in the fact that the eastern region, located in the coastal developed areas with superior geographical location, takes the lead in scientific and technological innovation, high-end talents, and social governance, thus being more conducive to promoting government environmental governance. In contrast, non-eastern regions, due to their less prominent geographical advantages, lack of early development opportunities, relatively lagging infrastructure construction, and relatively slow economic growth, have failed to give full play to the potential advantages of digital finance.

4.2.2. Heterogeneity Effect of Economic Development Level

Combining the findings of Hu and Gu (2017), this study selects the 2012–2023 average GDP of each province for comparison, and uses the sum-of-squares of deviations method to classify each province into developed area, sub-developed area, and underdeveloped area. Among them, the economically developed area includes 5 provinces, the economically sub-developed area includes 21 provinces, and the economically underdeveloped area includes 5 provinces, with the specific classification listed in Table 7.
The regression coefficient is the largest in economically sub-developed areas, indicating that digital finance development the most remarkably promotes government environmental governance in these areas. The possible reason is that an economically sub-developed area is predominantly dominated by the secondary industry, with a low level of industrial digitization. As digital finance develops and industrial digital transformation advances, the difficulty of government environmental regulation and governance will decrease; hence, digital finance development the most remarkably affect these regions. In economically underdeveloped areas, digital finance development has a positive but relatively weak impact on government environmental governance. This may be attributed to the fact that some control variables in an underdeveloped area either weaken or counteract the promoting effect on government environmental governance. Economically developed areas generally already possess a high level of environmental governance and well-developed digital finance, leaving relatively limited room for further improvement. Digital finance’s promoting role in government environmental governance in this area may exert a slight diminishing marginal effect. All these support Hypothesis 2b (columns (5)–(7), Table 6).

4.3. Spatial Effects Analysis

4.3.1. Spatial Weight Matrix Construction

Referring to the relevant literature (Xu et al., 2022), this study chooses three common spatial weight matrices for analyzing how digital finance affects government environmental governance.
  • The adjacency matrix (W1)
The formula below interprets the proximity between the districts:
W i j = 0 ,   i   a n d   j   h a v e   n o   c o m m o n   b o u n d a r y 1 ,   i   a n d   j   h a v e   a   c o m m o n   b o u n d a r y
2.
The geographic distance matrix (W2)
The formula below interprets the distance between the districts:
W i j = 1 d i j 2 ,   i j 0 ,   i = j
where d i j represents the distance between the two provinces measured in latitude and longitude.
3.
The economic distance matrix (W3)
The formula below interprets the regional economic disparity:
W i j = 1 | E i E j | 0   ,   i = j , i j
where E i ( j ) is the 2012–2023 average GDP per capita of province i ( j ) .

4.3.2. Spatial Econometric Regression Analysis

By analyzing the global Moran’s I index variation (Table 8), this study reveals that the dependent variable exhibits positive global spatial autocorrelation under different spatial weight matrices. This suggests the presence of spatial effects in government environmental governance.
This study adopts Moran’s I scatter plot to describe provinces’ aggregation pattern according to the adjacency matrix (Figure 3), with each scatter point denoting a province. According to the analysis results, the provinces generally present “high-high agglomeration” and “low-low agglomeration” characteristics, hinting at the local spatial positive autocorrelation among the explained variables.

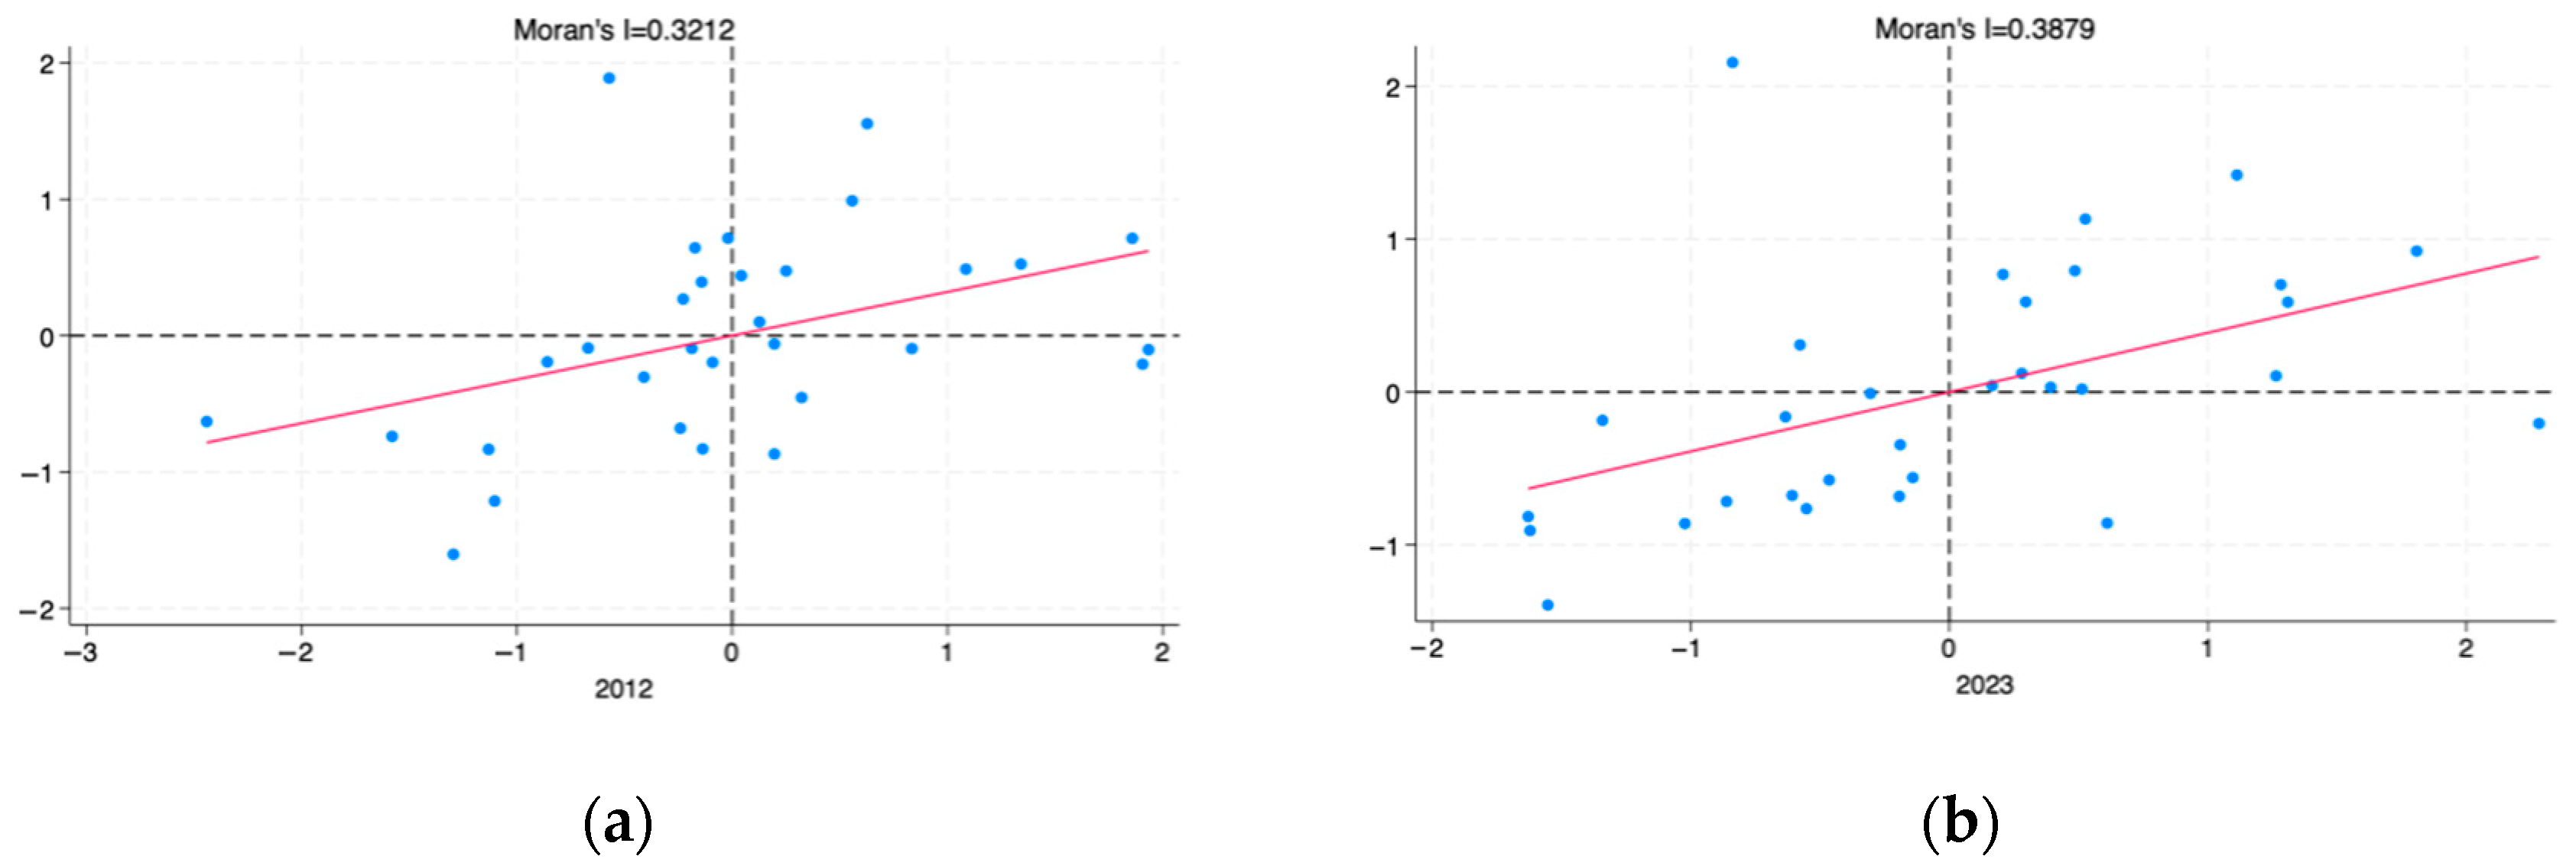
4.3.3. Tests for Spatial Effects

Model Selection
Combining the results in Table 9, this study determines the model to be used and ultimately selects the SDM. Meanwhile, according to the Hausman test result (p = 0.000), the fixed effects model is optimal. Consequently, this study finally adopts the SDM under fixed effects.
Spatial Effects Results Analysis
According to the SDM results under three spatial weight matrices in Table 10, digital finance positively affects the government’s environmental governance. This study further decomposes this impact from two aspects: direct effect and indirect effect, confirming the positive spatial spillover effect of digital finance on government environmental governance. Specifically, the indirect effect is relatively small but still significantly positive, which shows that in addition to affecting their own regions, the digital finance situation in different regions has an obvious radiation effect on the government environmental governance level in neighboring regions, thus proving Hypothesis 3.

4.4. Mediating Effects Analysis

The 95% CIs do not include 0 (Table 11), demonstrating the significance of the coefficient, thus confirming the existence of a mediation effect and other unidentified mediating variables. In addition, digital finance promotes government environmental governance by boosting new quality productive forces (Table 12), confirming the partial mediating role of new quality productive forces, with the mediation effect accounting for 29.6%. Moreover, it passes the Sobel test, verifying Hypothesis 4.

4.5. Moderated Mediation Effects Analysis

This study more deeply investigates the mediating effect of new quality productive forces under different levels of green technological innovation and industrial collaborative agglomeration through a moderated mediation model and tests it using the Bootstrap method.
Firstly, the mean value of green technological innovation, as well as values one SD above and below the mean, are used to represent low, medium, and high levels of green technological innovation, respectively. The regression results for each level are presented in Table 13. At different levels of green technological innovation, the 95% CIs do not include zero, and the coefficients show an increasing trend. This indicates that green technological innovation significantly moderates the mediating effect in the “DIF-NQPFs-GEG” pathway in both directions. In regions with low green technological innovation level, due to insufficient technological R&D capabilities and limited financial support, the application and promotion of green technologies lag behind, making it difficult for digital finance to effectively drive government environmental governance through new quality productive forces. As the green technological innovation level gradually increases, digital finance can significantly enhance the mediating effect of new quality productive forces by supporting the R&D and application of green technologies, thereby improving regional government environmental governance. Therefore, the continuously rising level of green technological innovation strengthens the mediating effect of new quality productive forces, verifying Hypothesis 5a.
Secondly, the mean value of industrial collaborative agglomeration, as well as values one SD above and below the mean, are employed to represent low, medium, and high industrial collaborative agglomeration, respectively. The results are presented in Table 14. At these levels, the 95% CIs do not include zero, and the coefficients exhibit an increasing trend. This indicates that industrial collaborative agglomeration significantly and unidirectionally moderates the mediating effect in the “DIF-NQPFs-GEG” pathway. A possible explanation is that in regions with low industrial collaborative agglomeration levels, there is insufficient collaboration among enterprises and an incomplete industrial chain, limiting the effectiveness of digital finance in promoting environmental governance through new quality productive forces. Comparatively, in regions with high levels of industrial collaborative agglomeration, digital finance can significantly enhance the mediating effect of new quality productive forces by facilitating collaborative innovation along the industrial chain. This suggests that promoting industrial collaborative development across regions is a crucial measure to further enhance the positive effect of digital finance on government environmental governance. The government should increase policy support for industrial agglomeration zones, promote resource sharing and technological cooperation among enterprises, create more favorable conditions for the R&D and application of green technologies, as well as promote new quality productive forces to be formed and developed. Therefore, Hypothesis 5b is supported.

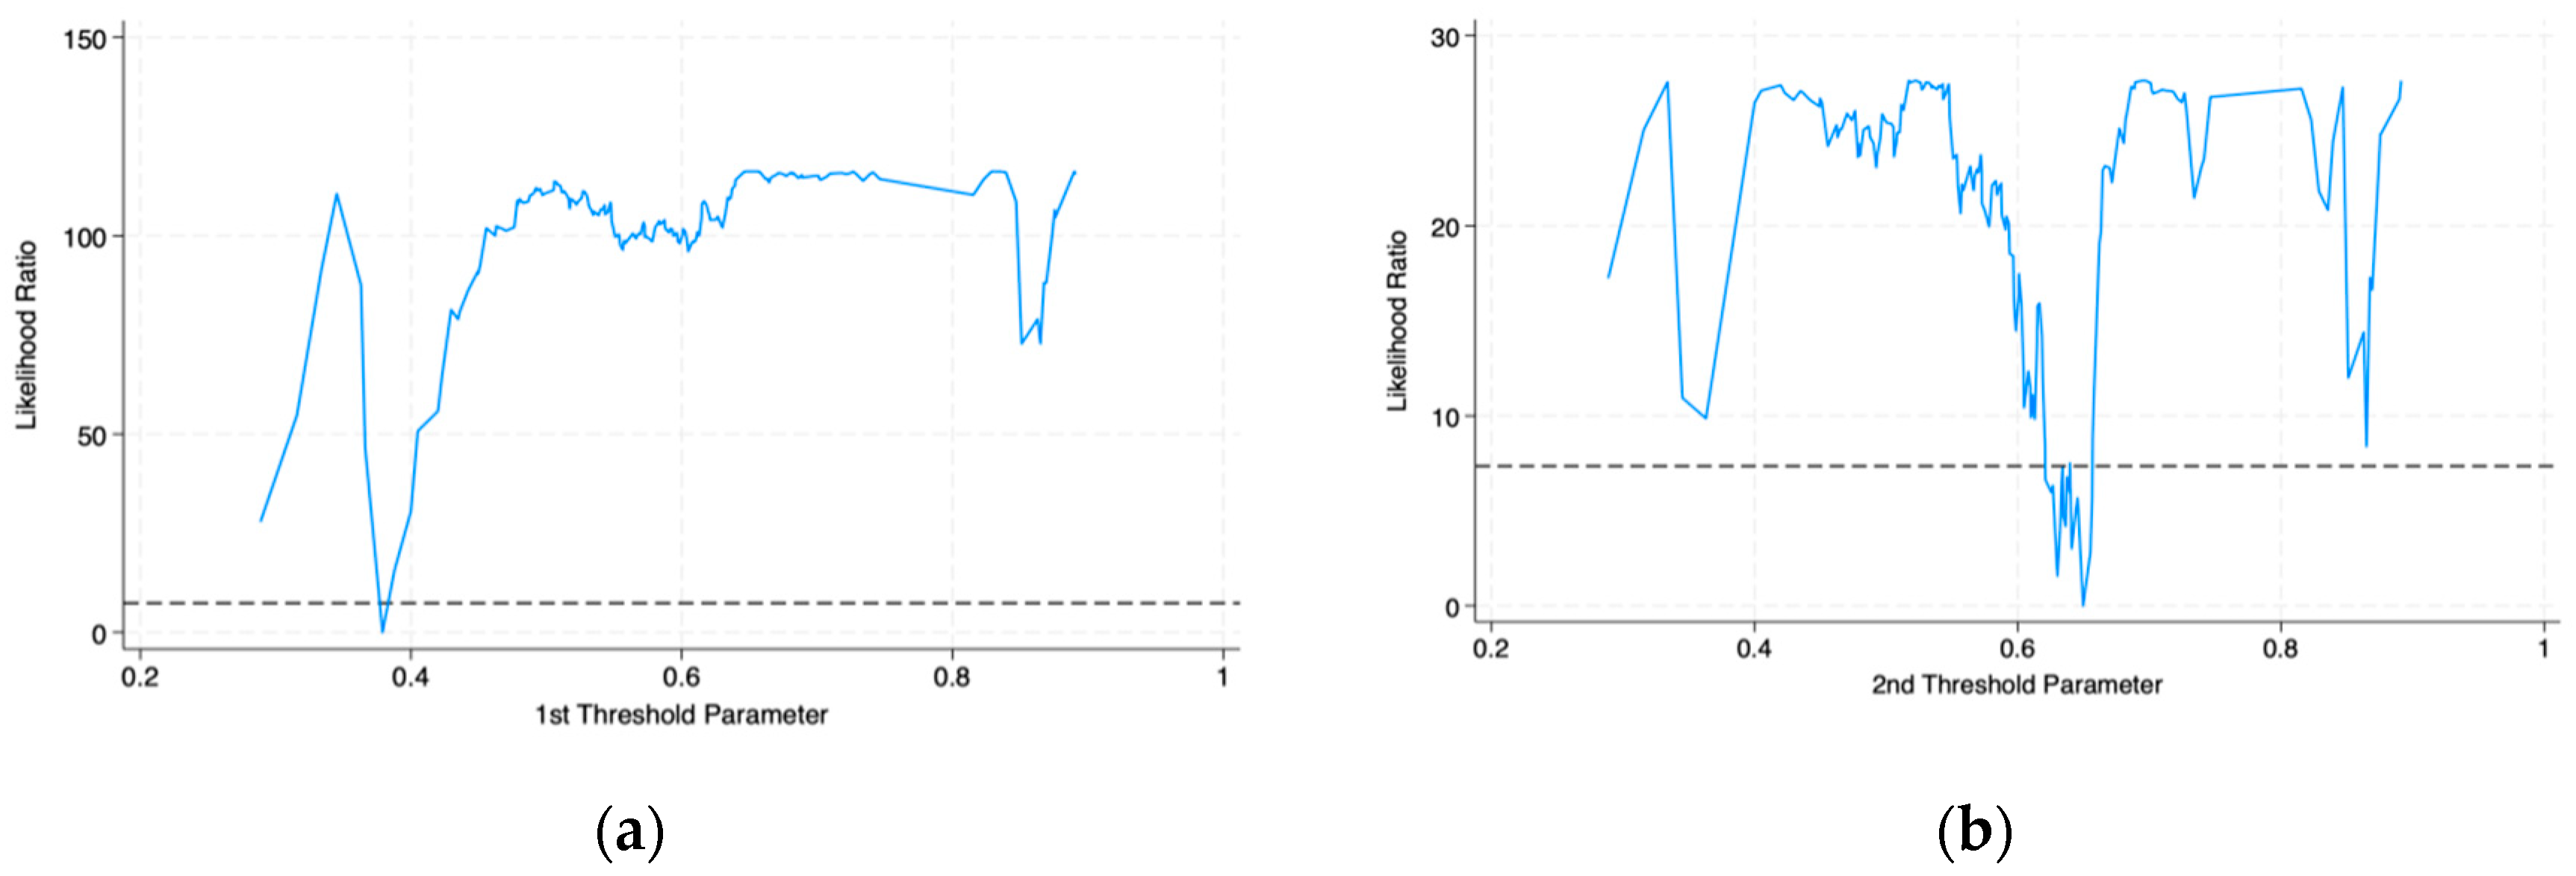
4.6. Threshold Effect Analysis

With the objective of examining whether the impact of digital finance on GEG exhibits a threshold effect, this study refers to the relevant literature (Hansen, 2000) and conducts a threshold effect test using new quality productive forces as the threshold variable. Figure 4 depicts the likelihood ratio function graph for the threshold values, indicating that the impact passes the double-threshold test. According to Table 15 and Table 16, the threshold values of digital finance’s impact on government environmental governance are 0.3789 and 0.6496, respectively, and are significant at the 1% and 10% CI levels. This suggests that the coefficient of digital finance’s impact effect increases with new quality productive forces development, indicating a nonlinear characteristic of “increasing marginal effects” in the impact of digital finance on government environmental governance. Therefore, Hypothesis 6 is supported.

4.7. Endogeneity and Robustness Tests

4.7.1. Endogeneity Test

This study uses multiple methods for endogeneity testing, with the results listed in Table 17.
First, the Heckman two-stage method is utilized. Referring to the research approaches of Huang et al. (2019) and G. Zhang and Wang (2023), this study uses the number of post offices per 10,000 people in each province in 1984, being cross-sectional data, to construct an instrumental variable (IV) for digital finance development taking the following aspects into consideration: Firstly, the use of the Internet is decided by the number and layout of local post offices, and the Internet essentially constitutes the digital economy. Secondly, post offices become less important in the current economic and social development, hence they can hardly impact the new quality productive forces development level of enterprises, guaranteeing the exogeneity of the IV. This study uses the interaction term between the national information service technology revenue of the previous year and the number of post offices as the IV for the digital economy level of that year. Given that residents’ attempts to use digital finance are not exogenous events, with some residents possibly preferring traditional offline financial institutions due to factors such as regional development, personal habits, and the availability of traditional financial services, this study adopts the Heckman two-stage method to address potential selection bias. To begin with, a binary variable (DIF_use) is constructed to represent the region’s utilization of digital finance, which is coded as 1 if the region’s digital finance level exceeds the mean and 0 otherwise. The probit model engages in estimating and calculating the Inverse Mills Ratio (IMR). Meanwhile, considering that the elderly are a group with a relatively low frequency of Internet use, this study adds the elderly dependency ratio as a control variable. In the second-stage regression, the IMR is added to the model as a control variable to correct the estimation bias caused by selection bias. The results are significantly positive, passing the endogeneity test (columns (1) and (2), Table 17).
Second, the IV method. Following the introduction of the IV, digital finance still contributes well to the improvement of government environmental governance. The Kleibergen–Paap rk LM statistic and Wald F statistic reject the under-identification hypothesis and weak identification hypothesis, respectively, indicative of the robustness of the positive impact effect (columns (3) and (4), Table 17).
Third, dynamic panel GMM. With the aim of more deeply examining the long-term impact of digital finance on government environmental governance, this study employs the system GMM approach and reports its estimation results. The validity of the IVs and estimation results is assessed through the Arellano-Bond AR and Hansen tests. The results are significantly positive, passing the endogeneity test (columns (5) and (6), Table 17).
Fourth, propensity score matching (PSM). Given that the popularity of digital finance in some regions may be prioritized due to their better economic foundations, this study uses PSM to reduce selection bias. First, a propensity score model is constructed to determine whether a region actively adopts digital finance, and regions are divided based on GDP levels, with those above the median considered as the treatment group and the rest as the control group. Second, the nearest neighbor matching method is employed to match regions in the treatment group with similar characteristics in the control group. The results after matching are significantly positive, passing the test (column (7), Table 17).

4.7.2. Robustness Test

This study uses multiple methods for robustness testing, with the results listed in detail in Table 18.
First, the substitution of the independent variable. This study substitutes the three sub-indices of digital finance for the core independent variable and conducts regressions separately. The results are all significantly positive, passing the robustness test (columns (1), (2), and (3), Table 18).
Second, the substitution of the dependent variable. Referring to the practice of Z. Chen et al. (2018), this study adopts the proportion of the total number of words of the 5 terms in the full text of the government work report as an alternative measure of government environmental governance, denoted as GEG_replace (Table 19). Compared with the 15 keywords used in GEG, these 5 terms focus more on the key areas of environmental governance and can more directly reflect the government’s policy orientation in environmental protection, pollution control, energy conservation, and emission reduction. The result is significantly positive, passing the robustness test (column (4), Table 18).
Third, the exclusion of samples from municipalities under direct management of the central government. Given the unique characteristics of the above municipalities, this study reruns the regression after data exclusion. The result is significantly positive, passing the robustness test (column (5), Table 18).
Fourth, the exclusion of time samples. Due to the economic fluctuations and declines in some regions resulting from the 2020 COVID-19 pandemic, which may have affected the coordinated regional economy development, this study excludes the data from 2020 to 2022 and reruns the regression. The result is significantly positive, passing the robustness test (column (6), Table 18).
Fifth, 1% and 5% winsorization. To eliminate the potential impact of extreme values on the regression results, the variables undergo winsorization at the 1% and 5% levels. The results are both significantly positive, passing the robustness test (columns (7) and (8), Table 18).

5. Conclusions and Recommendations

5.1. Conclusions

Utilizing 2012–2023 panel data from 31 provinces in China, this study employs various models to empirically examine the multidimensional impact mechanisms and effects of digital finance on government environmental governance. The research results are as follows: First, digital finance can well drive government environmental governance, and the results show robustness. Second, the impact of digital finance on government environmental governance exhibits heterogeneity, with the strongest promoting effects in the eastern region and economically sub-developed areas. Third, the impact of digital finance on government environmental governance has a spatial spillover effect, which can drive the development of government environmental governance in neighboring provinces. Fourth, new quality productive forces positively mediate the way digital finance affects government environmental governance. Fifth, green technological innovation positively moderates the relationships between “digital finance promoting new quality productive forces” and “new quality productive forces driving government environmental governance”; industrial collaborative agglomeration positively moderates the relationship between “new quality productive forces driving government environmental governance”. Sixth, the impact of digital finance on government environmental governance has a nonlinear characteristic of “increasing marginal effect”.

5.2. Recommendations

5.2.1. Accelerate the Digital Infrastructure Construction

Digital infrastructure fundamentally determines the digital finance development and is an important support for the government’s environmental governance capacity enhancement. First, local governments should be encouraged to increase investment in the building of key infrastructure, including the internet, cloud computing platforms, and big data centers, to technically support the development of digital finance. Second, focus on strengthening digital applications and upgrades in fields of environmental monitoring and pollution control, and build a nationwide environmental data collection and sharing platform to offer real-time and accurate data support for government environmental governance decision-making. Third, the government should focus on achieving a balanced regional layout of digital infrastructure and adopt differentiated support strategies based on the economic development levels of different regions. Priority should be given to meeting the digital infrastructure construction needs of underdeveloped regions, e.g., increasing investment in central and western regions, and developed and sub-developed regions, to narrow the digital divide while promoting these regions towards higher levels of digital application and achieving coordinated development of digital infrastructure.

5.2.2. Improve the Digital Financial Supervision System

First, the government should establish and improve a corresponding regulatory framework, build an environment-oriented digital financial supervision system, incorporate environmental performance into the assessment indicators of digital financial institutions, and guide funds to flow towards green and low-carbon areas. Second, the government should enhance the environmental risk assessment of innovative digital financial products, establish an environmental information disclosure system, improve the safety and reliability of digital financial products, and provide stable and reliable financial support for environmental governance. Third, the government should also establish a cross-regional digital financial supervision coordination mechanism, promote the standardization and normalization of digital financial technologies, regularly monitor the implementation effects of digital finance in areas of green credit and carbon finance, and enhance the overall regional regulatory efficiency.

5.2.3. Accelerate the Digital Transformation of the Government

First, the government should establish and refine a regulatory framework that is compatible with digital finance, constructing an environmentally oriented digital finance regulatory system. This should incorporate environmental performance into the assessment indicators of digital financial institutions to guide capital flows towards green and low-carbon sectors. Second, the government should strengthen environmental risk assessments of innovative digital financial products, establish an environmental information disclosure system, and enhance the safety and reliability of digital financial products, thereby providing stable and reliable financial support for environmental governance. Third, the government should also establish a cross-regional digital finance regulatory coordination mechanism to promote the standardization and normalization of digital finance technologies. Regular monitoring of the implementation effects of digital finance in green credit and carbon finance, etc., should be conducted to enhance the overall regulatory efficiency across regions.

5.2.4. Increase Green Technological Innovation

First, the government should engage in guiding and supporting financial institutions in utilizing digital technologies to innovate financial products and services, while simultaneously increasing financial support for technological innovation and green industries. Incentives such as establishing special funds, providing loan interest subsidies, and risk compensation can be employed to focus on supporting technological research and development in environmental monitoring, pollution control, and clean energy, etc., accordingly lowering corporate financing costs and stimulating corporate innovation vitality. Second, a digital risk assessment and credit evaluation system should be constructed to lower the cost of implementing green technology research and development. Third, a fair and competitive market environment should be established. Exploring the establishment of a green technology patent trading platform based on advanced digital technologies can stimulate market vitality and promote the transformation and application of green technology achievements. Fourth, the government should encourage financial institutions to cooperate and exchange with technology enterprises to jointly develop environmental protection technologies and products, accelerating the high-quality development of green industries and providing solid guarantees for environmental governance.

5.2.5. Develop New Quality Productive Forces Considering Local Conditions

First, regions should engage in selectively driving the development of new industries, new models, and new drivers of growth, considering their local resource endowment, industrial foundation, and scientific research conditions, cultivating new quality productive forces aligned with their own development stages. Second, efforts should be made to enhance a policy support system for new quality productive forces development, providing differentiated support in terms of land, talent, and funding. Particularly, the fields of green technological innovation and industrial collaborative agglomeration should be provided with greater policy support to effectively enable new quality productive forces to achieve sustainable development. Third, the government should establish an evaluation system for new quality productive forces development, dynamically monitoring the development achievements of various regions and promptly adjusting the direction of policy support to ensure the coordinated advancement of new quality productive forces development and environmental governance goals.

5.2.6. Improve the Industrial Synergy and Regional Collaboration Mechanisms

First, cross-regional industrial collaborative development should be promoted, encouraging the eastern region to jointly build green industrial chains with the central and western regions, forming an industrial pattern characterized by technology diffusion, complementary advantages, and collaborative innovation. Second, efforts should be made to strengthen regional environmental governance collaboration, establishing a cross-provincial environmental data sharing platform and a joint governance mechanism to drive the collaborative application of digital finance in regional environmental governance. Third, differentiated digital finance support policies should be formulated considering regions’ different development characteristics, such as increasing the preference for green credit to underdeveloped regions and encouraging carbon financial instrument innovation in developed regions, thereby achieving balanced environmental governance development across regions.

Author Contributions

Writing—original draft, Y.X. and S.Z.; Writing—review and editing, Y.X. and S.Z.; Funding acquisition, Y.X. All authors have read and agreed to the published version of the manuscript.

Funding

This work was supported by the Fundamental Research Funds for the Central Universities (Grant Number: 24QN40).

Institutional Review Board Statement

Not applicable.

Informed Consent Statement

Not applicable.

Data Availability Statement

The data presented in this study are available upon request from the corresponding author. The data are not publicly available due to privacy and confidentiality restrictions.

Conflicts of Interest

The authors declare no conflicts of interest.

References

  1. Cai, X., & He, Z. (2024). How new quality productivity affects total factor productivity: The mechanism and test of science and technology innovation effect. Contemporary Economic Management, 1–15. (In Chinese). [Google Scholar] [CrossRef]
  2. Chen, S., & Chen, D. (2018). Smog pollution, government governance, and high-quality economic development. Economic Research Journal, 53(2), 20–34. (In Chinese). [Google Scholar]
  3. Chen, Z., Kahn, M. E., Liu, Y., & Wang, Z. (2018). The consequences of spatially differentiated water pollution regulation in China. Journal of Environmental Economics and Management, 88, 468–485. [Google Scholar] [CrossRef]
  4. Dong, K., Liu, Y., Wang, J., & Dong, X. (2024). Is the digital economy an effective tool for decreasing energy vulnerability? A global case. Ecological Economics, 216, 108028. [Google Scholar] [CrossRef]
  5. Guo, F., Wang, J., Wang, F., Kong, T., Zhang, X., & Cheng, Z. (2020). Measuring the development of digital financial inclusion in China: Index compilation and spatial characteristics. China Economic Quarterly, 19(4), 1401–1418. (In Chinese). [Google Scholar]
  6. Han, W. (2024). The political economy interpretation of new quality productivity. Studies on Marxism, (3), 100–115. Available online: https://link.cnki.net/urlid/11.3591.A.20240611.1317.018 (accessed on 4 July 2025). (In Chinese).
  7. Hansen, B. E. (1999). Threshold effects in non-dynamic panels: Estimation, testing, and inference. Journal of Econometrics, 93(2), 345–368. [Google Scholar] [CrossRef]
  8. Hansen, B. E. (2000). Sample splitting and threshold estimation. Econometrica, 68(3), 575–603. [Google Scholar] [CrossRef]
  9. He, H. (2020). Digital finance to promote the integrated development of rural industry: Advantages, dilemmas and the way forward. Journal of Northwest A&F University (Social Science Edition), 20(3), 118–125. (In Chinese). [Google Scholar]
  10. Hu, J., & Gu, J. (2017). Research on the regional heterogeneity of the impact of population aging on housing prices—An empirical analysis based on panel data from 31 provinces in China. Journal of East China Normal University (Philosophy and Social Sciences Edition), 49(3), 155–160+176. (In Chinese). [Google Scholar]
  11. Huang, Q., Yu, Y., & Zhang, S. (2019). Internet development and the improvement of manufacturing productivity: Internal mechanisms and Chinese experience. China Industrial Economics, (8), 5–23. (In Chinese) [Google Scholar] [CrossRef]
  12. Li, L. (2024). The impact of digital finance on farmers’ rural common wealth—Mediating effect based on innovation and entrepreneurship vigor. Statistics & Decision, 40(7), 144–149. (In Chinese). [Google Scholar]
  13. Li, L., & Sheng, D. (2018). Local environmental legislation and the optimization of industry resource allocation efficiency in China’s manufacturing sector. China Industrial Economics, (7), 136–154. (In Chinese) [Google Scholar] [CrossRef]
  14. Li, W., Wang, S., & Deng, X. (2024). The impact of digital finance on business environment: Mediating role of industrial structural upgrading and moderating role of digital infrastructure. Finance Research Letters, 67, 105775. [Google Scholar] [CrossRef]
  15. Li, X., & Ran, G. (2021). Digital financial development, capital allocation efficiency and industrial structure upgrading. Journal of Southwest Minzu University (Humanities and Social Sciences Edition), 42(7), 152–162. (In Chinese). [Google Scholar]
  16. Lu, J., Guo, Z., & Wang, Y. (2024). The development level of new productivity, regional differences and the path of enhancement. Journal of Chongqing University (Social Science Edition), 30(3), 1–17. (In Chinese). [Google Scholar]
  17. Nepal, R., Liu, Y., Dong, K., & Jamasb, T. (2024). Green financing, energy transformation, and the moderating effect of digital economy in developing countries. Environmental & Resource Economics, 87, 3357–3386. [Google Scholar] [CrossRef]
  18. Pang, S., Liu, H., & Hua, G. (2024). How does digital finance drive the green economic growth? New discoveries of spatial threshold effect and attenuation possibility boundary. International Review of Economics & Finance, 89, 561–581. [Google Scholar] [CrossRef]
  19. Peng, X., & Li, B. (2016). Research on the green transformation of China’s industry under different types of environmental regulations. Journal of Finance and Economics, 42(7), 134–144. (In Chinese). [Google Scholar]
  20. Preacher, K. J., & Hayes, A. F. (2008). Asymptotic and resampling strategies for assessing and comparing indirect effects in multiple mediator models. Behavior Research Methods, 40(3), 879–891. [Google Scholar] [CrossRef]
  21. Qian, H., Tao, Y., Cao, S., & Cao, Y. (2020). Theoretical and empirical evidence on digital financial development and economic growth in China. Journal of Quantitative & Technical Economics, 37(6), 26–46. (In Chinese). [Google Scholar]
  22. Ren, Y., Niu, C., Niu, T., & Yao, X. (2014). Theoretical modeling and empirical research on green innovation efficiency. Journal of Management World, (7), 176–177. (In Chinese). [Google Scholar]
  23. Ren, Y., Wu, Y., & Wu, Z. (2024). Financial agglomeration, industry-university-research cooperation and new quality productivity. The Theory and Practice of Finance and Economics, 45(3), 27–34. (In Chinese). [Google Scholar]
  24. Su, Z., Liu, Y., Gao, Y., Park, K. S., & Su, M. (2024). Critical success factors for green port transformation using digital technology. Journal of Marine Science and Engineering, 12(12), 2128. [Google Scholar] [CrossRef]
  25. Tao, Y., Cao, Y., Zhang, J., & Zou, K. (2021). The impact of digital finance on entrepreneurship-evidence from regional and Chinese household tracking surveys (CFPS). Journal of Zhejiang University (Humanities and Social Sciences), 51(1), 129–144. (In Chinese). [Google Scholar]
  26. The Central People’s Government of the People’s Republic of China. (2023). The central financial work conference was held in Beijing. Available online: https://www.gov.cn (accessed on 31 October 2023).
  27. The Central People’s Government of the People’s Republic of China. (2024a). Opinions of the central committee of the communist party of China and the state council on accelerating the comprehensive green transformation of economic and social development. Available online: https://www.gov.cn (accessed on 11 August 2024).
  28. The Central People’s Government of the People’s Republic of China. (2024b). The decision of the central committee of the communist party of China on further comprehensively deepening reform and promoting Chinese-style modernization. Available online: https://www.gov.cn (accessed on 21 July 2024).
  29. Tian, H., & Pan, M. (2021). Research on digital financial development and urban economic performance—Spatial effect and threshold characteristic. Economic Problems, (12), 22–28. (In Chinese) [Google Scholar] [CrossRef]
  30. Wang, F., Cao, Y., & Chen, S. (2020). Rethinking the environmental Kuznets curve hypothesis. China Economic Quarterly, 19(1), 81–100. (In Chinese). [Google Scholar]
  31. Wang, Q. (2015). Fixed-Effect panel threshold model using Stata. The Stata Journal: Promoting Communications on Statistics and Stata, 15(1), 121–134. [Google Scholar] [CrossRef]
  32. Wang, Q., & Tian, Y. (2021). The evolution of government attention in environmental governance in China—A text analysis based on the government work report (1978–2021) of the state council. Journal of Fujian Normal University (Philosophy and Social Sciences Edition), 4, 74–84+170171. (In Chinese). [Google Scholar]
  33. Wang, W., & Sui, Y. (2022). Research on the spatial effects of the synergistic agglomeration of producer services and high-tech industries on regional innovation efficiency. Journal of Management, 19(5), 696–704. (In Chinese). [Google Scholar]
  34. Wang, X., & Zhao, Y. (2020). Is there a Matthew effect in digital financial development?—An empirical comparison between poor and non-poor households. Journal of Financial Research, (7), 114–133. Available online: https://kns.cnki.net/kcms2/article/abstract?v=__pNPjlwk1qU0y_GvAalnCiUuy9SBN_EiyCHHhguNaF_JrdEB46Ju9P8ijLpHxTxDp9aSaNJznSlf2iZX3YP1kRDdPR3rD3hCGFMXf4-keDeliJsgjNKDHK8_eBK82IpkY2p_WXVSFysTN6F2wxZH-qw0EgkqR_842bAC4rK6IzEiyE5wwyzREGXwYoX_0oP0gZ50vAs9mg=&uniplatform=NZKPT&language=CHS (accessed on 4 July 2025). (In Chinese).
  35. Wang, Y., Ye, X., & Xu, L. (2020). Can digital finance boost the real economy. Finance & Economics, (3), 1–13. Available online: https://kns.cnki.net/kcms2/article/abstract?v=__pNPjlwk1p2cx0sNnkIXC1imootDVqbF_AQnuNxCOHf2kaIyeTE7BdI5pSGgt3vjzqqtBS-v_-YmC99-A5-UDM1sIpQCTWLfS7oU04uXQV2tGNZHiMGiC8h5f48-Wi3jezD3H-_M6GjDz9i0iTpwVfwpY8ZyYx7ErUcTQV5vx155DabBUEfX6BxvEMPbSKPy4F3KeSd_n8=&uniplatform=NZKPT&language=CHS (accessed on 4 July 2025). (In Chinese).
  36. Wang, Y., Zhang, Y., & Li, J. (2022). Digital finance and carbon emissions: A study based on microdata and machine learning models. China Population, Resources and Environment, 32(6), 1–11. (In Chinese). [Google Scholar]
  37. Wen, Z., & Ye, B. (2014). Mediation effects analysis: Methods and model development. Advances in Psychological Science, 22(5), 731–745. (In Chinese). [Google Scholar] [CrossRef]
  38. Wu, Z., Xu, Y., & Sun, K. (2022). Research on the impact of urban agglomeration effect on green technology innovation—A spatial econometric analysis based on 232 prefecture-level and above cities in China. Economic Geography, 42(10), 25–34+71. (In Chinese). [Google Scholar]
  39. Xu, W., Zhou, J., & Liu, C. (2022). Spatial effects of digital economy development on urban carbon emissions. Geographical Research, 41(1), 111–129. (In Chinese). [Google Scholar]
  40. Yi, J., Dai, S., Li, L., & Cheng, J. (2024). How does digital economy development affect renewable energy innovation? Renewable and Sustainable Energy Reviews, 192, 114221. [Google Scholar] [CrossRef]
  41. Yu, Z., Li, Y., & Dai, L. (2023). Digital finance and regional economic resilience: Theoretical framework and empirical test. Finance Research Letters, 55, 103920. [Google Scholar] [CrossRef]
  42. Zhang, C., Zhu, Y., & Zhang, L. (2024). Effect of digital inclusive finance on common prosperity and the underlying mechanisms. International Review of Financial Analysis, 91, 102940. [Google Scholar] [CrossRef]
  43. Zhang, G., & Wang, R. (2023). How does the development of the digital economy empower high-quality employment for migrant workers? Chinese Rural Economy, (1), 58–76. (In Chinese). [Google Scholar] [CrossRef]
  44. Zhang, M., & Liu, Y. (2022). Influence of digital finance and green technology innovation on China’s carbon emission efficiency: Empirical analysis based on spatial metrology. Science of the Total Environment, 838(3), 156463. [Google Scholar] [CrossRef] [PubMed]
  45. Zhang, P., & Xu, Y. (2024). Research on the influence mechanism of green bonds on capital allocation and local government environmental governance. Statistics & Decision, 40(1), 163–167. (In Chinese). [Google Scholar]
  46. Zhang, W., Wang, J., & Jin, H. (2024). Digital finance, innovation transformation, and resilient city growth. Scientific Reports, 14, 7056. [Google Scholar] [CrossRef] [PubMed]
  47. Zhao, Q., & Li, H. (2024). Whether ESG ratings promote corporate green technology innovation—Micro evidence from Chinese listed companies. South China Journal of Economics, (2), 116–135. (In Chinese). [Google Scholar] [CrossRef]
  48. Zhou, L., Zhang, X., & Dong, K. (2024). Does digital financial innovation help promote the high-quality development of real economy?—Mechanism analysis and spatial measurement based on financial service efficiency. Journal of Xi’an University of Finance and Economics, 37(1), 60–72. (In Chinese). [Google Scholar]
Figure 1. Theoretical mechanism of moderated mediating effect based on green technological innovation.
Ijfs 13 00129 g001
Figure 2. Theoretical mechanism of moderated mediating effect based on industrial collaborative agglomeration.
Ijfs 13 00129 g002
Figure 3. Moran’s I scatterplot of government environmental governance in (a) 2012; (b) 2023.
Ijfs 13 00129 g003
Figure 4. Threshold estimates and CIs. (a) 1st threshold parameter; (b) 2nd threshold parameter. The dashed line represents the critical value at the 5% significance level.
Ijfs 13 00129 g004
Table 1. Keywords for government environmental governance.
VariableKeywords
GEGEnvironmental protection, Environmental conservation,
Pollution, Energy consumption, Emission reduction,
Pollutant discharge, Ecology, Green, Low-carbon, Air,
Chemical oxygen demand (COD), Sulfur dioxide,
Dioxide, carbon dioxide, PM10, PM2.5
Table 2. NQPFs indicator system.
1st Class
Indicator
2nd Class
Indicator
3rd Class
Indicator
4th Class
Indicator
Meaning of the 4th Class
Indicator
Indicator Properties
NQPFsScientific and technological productivityTechnological productivityTechnical
production
Robot mounting density (%)+
Technical
R&D
Full-time equivalent of R&D personnel in industrial enterprises above the designated size (h)+
Innovative productivityInnovative
industries
Business income from high-tech industries (per 1000 yuan)+
Innovative productsFunding for industrial innovation in industrial enterprises above the designated size (per 10,000 yuan)+
Innovative R&DNumber of patents granted in the region+
Creative entrepreneurshipNumber of new start-ups (per 100 people)+
Digital
productivity
Digital
industry productivity
Telecommunications business communicationsTotal telecommunication services (per hundred million yuan)+
Electronic
information manufacturing
Number of IC production (per hundred million)+
Broadband China StrategyNumber of provincial (city) broadband China pilot cities
Share in the number of provincial (municipal) prefecture-level cities (%)
+
Industrial
digital productivity
Software serviceRevenue from software operations (per 10,000 yuan)+
E-commerceE-commerce sales (per 10,000 yuan)+
Internet penetrationNumber of Internet broadband access ports+
Green productivityResource-efficient productivityEnergy intensityEnergy consumption as a share of GDP (%)
Water intensityIndustrial water consumption as a share of GDP (%)
Environmentally friendly productivityWastewater dischargeIndustrial wastewater discharges as a share of GDP (%)
Exhaust emissionIndustrial SO2 emissions as a share of GDP (%)
Waste material utilizationComprehensive utilization of industrial solid waste as a percentage (%)+
Eco-governance-based productivityEcological resourceArea forest cover (%)+
Pollution prevention and control potentialTreatment capacity of waste gas treatment facilities (number of machines)+
Pollution prevention and control of qualityCOD emissions as a percentage of GDP (%)
Note: + and − indicate a positive and negative indicator, respectively.
Table 3. Descriptive statistics.
VariableVariable NameObsMeanSDMedianMinMax
GEGGovernment environmental governance3723.87781.08023.76001.44827.4988
DIFDigital finance3725.53580.43135.64344.11856.2520
DIF_CBCoverage breadth3725.44320.51385.58463.49236.1997
DIF_UDUsage depth3725.49750.43255.61143.94846.3175
DIF_DLDigitization level3725.80150.34615.93814.67356.3046
GOVGovernment intervention3720.28240.20680.22860.10661.3792
URBANUrbanization level3720.60410.12630.59730.22870.896
EDUEducation quality3720.16080.0280.16410.07110.2222
MARKETDegree of marketization3722.55180.35452.62070.06463.0544
AGRAgricultural development level3722.39530.34412.45041.39633.0148
OPENLevel of openness3720.35080.26530.24060.03251.5407
STRUIndustrial structure3721.35050.74621.19890.54935.5621
FINLevel of traditional financial development3720.82120.16280.80890.32321.2361
NQPFsNew quality productive forces3720.13750.11240.10060.01190.7612
ICAIndustrial collaborative agglomeration3722.41461.11492.19520.92487.6345
GTECGreen technological innovation3722.39410.27472.44460.03352.7964
Table 4. Correlation analysis.
VariableGEGDIFICAGTECNQPFsGOVURBANEDU
GEG1
DIF0.270 ***1
ICA0.178 ***0.218 ***1
GTEC0.502 ***0.385 ***0.416 ***1
NQPFs0.490 ***0.581 ***0.551 ***0.614 ***1
GOV0.127 **0.332 ***0.340 ***0.779 ***0.402 ***1
URBAN0.389 ***0.228 ***0.216 ***0.133 **0.235 ***0.0421
EDU0.160 ***0.261 ***0.201 ***0.355 ***0.253 ***0.465 ***0.234 ***1
MARKET0.143 ***0.102 *0.730 ***0.380 ***0.531 ***0.293 ***0.489 ***0.178 ***
AGR0.320 ***0.181 ***0.271 ***0.305 ***0.120 **0.250 ***0.266 ***0.361 ***
OPEN0.492 ***0.547 ***0.593 ***0.603 ***0.538 ***0.514 ***0.481 ***0.139 **
STRU0.197 ***0.256 ***0.673 ***0.491 ***0.580 ***0.439 ***0.238 ***0.153 ***
FIN0.429 ***0.603 ***0.507 ***0.857 ***0.662 ***0.816 ***0.121 **0.321 ***
DIF_CB0.962 ***0.223 ***0.189 ***0.499 ***0.526 ***0.136 **0.415 ***0.142 ***
DIF_UD0.909 ***0.172 ***0.277 ***0.549 ***0.606 ***0.178 ***0.434 ***0.173 ***
DIF_DL0.897 ***0.263 ***0.228 ***0.332 ***0.383 ***0.224 ***0.293 ***0.206 ***
MARKETAGROPENSTRUFINDIF_CBDIF_UDDIF_DL
MARKET1
AGR0.355 ***1
OPEN0.730 ***0.634 ***1
STRU0.781 ***0.247 ***0.734 ***1
FIN0.538 ***0.414 ***0.727 ***0.676 ***1
DIF_CB0.167 ***0.327 ***0.516 ***0.225 ***0.107 **1
DIF_UD0.274 ***0.214 ***0.547 ***0.343 ***0.189 ***0.928 ***1
DIF_DL0.252 ***0.294 ***0.296 ***0.352 ***0.185 ***0.844 ***0.734 ***1
Note: * p < 10%, ** p < 5%, and *** p < 1%.
Table 5. Benchmark regression results.
VariableMixed
Regression
Mixed
Regression
Time
Fixed Effect
Individual
Fixed Effect
Two-Way
Fixed Effects
(1)(2)(3)(4)(5)
GEGGEGGEGGEGGEG
DIF0.2182 ***0.3355 ***0.1381 ***0.3869 **0.6701 ***
(0.0468)(0.0649)(0.0465)(0.1785)(0.1938)
GOV 0.0221 **−0.00970.0252 **−0.0099
(0.0107)(0.0148)(0.0115)(0.0118)
URBAN −0.0805 **−0.1607 **−0.0978 **−0.1245 **
(0.0381)(0.0618)(0.0389)(0.0539)
EDU 0.10870.5183 *0.03530.5315 **
(0.1474)(0.2544)(0.1622)(0.2348)
MARKET 0.07090.02960.29541.1526
(0.6989)(0.8348)(0.8387)(1.3443)
AGR −0.01260.0460−0.23710.0036
(0.1497)(0.2346)(0.2108)(0.0161)
OPEN −0.05590.1712−0.02980.3370
(0.0512)(0.3443)(0.0519)(0.4070)
STRU 1.3590 *1.7566−0.50920.0288
(0.7146)(1.4684)(1.8201)(0.1200)
FIN −0.02960.1802−0.02600.3142
(0.0527)(0.3533)(0.0546)(0.3326)
CONS2.8191 ***2.3708 ***1.99153.4050−0.5366 *
(0.2610)(0.4798)(1.3301)(2.1092)(0.2818)
N372372372372372
R20.27110.75540.75580.88180.8873
Province FENoNoNoYesYes
Year FENoNoYesNoYes
Note: * p < 10%, ** p < 5%, and *** p < 1%; standard errors are in parentheses.
Table 6. The heterogeneous effect results.
VariablesEasternCentralWesternNortheastDeveloped AreaSub-Developed AreaUnderdeveloped Area
(1)(2)(3)(4)(5)(6)(7)
GEGGEGGEGGEGGEGGEGGEG
DIF0.6584 ***0.5424 **0.4811 ***0.4394 **0.4693 **0.6332 **0.3961 **
(0.2022)(0.1618)(0.1358)(0.0867)(0.2160)(0.2154)(0.1638)
CONTROLSYesYesYesYesYesYesYes
CONS0.59020.2544 *0.0145 ***0.1114 *0.0174 *0.2371 ***0.0642
(0.3504)(0.1147)(0.0044)(0.0260)(0.0079)(0.0605)(0.0767)
N12072144366025260
R20.93250.89580.91200.90180.94140.95620.9321
Province/Year FEYesYesYesYesYesYesYes
Note: * p < 10%, ** p < 5%, and *** p < 1%; standard errors are in parentheses.
Table 7. Provincial division based on economic development level.
ClassificationNames of Provinces
Developed areaBeijing, Shanghai, Zhejiang,
Jiangsu, Guangdong
Sub-developed areaShandong, Henan, Sichuan, Hubei,
Hunan, Fujian, Hebei, Anhui, Shaanxi,
Jiangxi, Chongqing, Guangxi, Yunnan,
Inner Mongolia, Shanxi, Tianjin,
Heilongjiang, Guizhou, Jilin, Xinjiang
Underdeveloped areaGansu, Hainan, Ningxia, Qinghai, Tibet
Table 8. Moran’s I values.
VariableW1W2W3
(1)(2)(1)(2)(1)(2)
Moran’s IZ-ScoreMoran’s IZ-ScoreMoran’s IZ-Score
20120.321 ***3.0140.181 ***2.7470.067 *1.301
20130.328 ***3.0720.192 ***2.8790.082 *1.503
20140.407 ***3.7500.255 ***3.6900.167 ***2.612
20150.380 ***3.5610.240 ***3.5410.179 ***2.808
20160.422 ***3.8310.268 ***3.8110.203 ***3.043
20170.383 ***3.5120.240 ***3.4610.176 ***2.701
20180.376 ***3.4530.233 ***3.3760.149 ***2.357
20190.375 ***3.4450.237 ***3.4290.133 **2.154
20200.396 ***3.6270.240 ***3.4750.115 **1.917
20210.431 ***3.9140.253 ***3.6310.150 ***2.367
20220.434 ***3.9350.254 ***3.6450.152 ***2.388
20230.388 ***3.5360.234 ***3.3740.140 **2.227
Note: * p < 10%, ** p < 5%, and *** p < 1%.
Table 9. Model selection test.
Type of TestStatisticp-Value
LM testLM-lag13.6310.000
R-LM-lag6.3540.012
LM-error21.5320.000
R-LM-error14.2540.000
Wald and LR testsWald-spatial-lag45.700.000
LR-spatial-lag3.910.048
Wald-spatial- error46.740.000
LR-spatial-error383.850.000
Table 10. Test for spatial spillover effects.
VariableW1W2W3
(1)(2)(3)
GEGGEGGEG
DIF0.5416 ***0.4287 ***0.4882 ***
(0.0556)(0.0532)(0.0299)
0.2804 ***0.1760 ***0.1824 ***
(0.1041)(0.0133)(0.0140)
W × DIF0.2023 ***0.1002 **0.1840 ***
(0.0562)(0.0412)(0.0565)
ControlYesYesYes
Province/Year FEYesYesYes
N372372372
R20.28850.32420.5354
Direct effect0.3248 ***0.4298 ***0.3088 ***
(3.1057)(0.0533)(0.0681)
Indirect effect0.2107 ***0.1486 ***0.1736 ***
(0.0114)(0.0059)(0.0527)
Total effect0.5355 ***0.5785 ***0.4824 ***
(0.0529)(0.0807)(0.0285)
Note: ** p < 5%, *** p < 1%; standard errors are in parentheses.
Table 11. Bootstrap test results.
EffectEstimated
Coefficient
Bootstrap
Standard Error
Z-Value95% CIControlProvince/Year FE
Direct effect0.1984 **0.09252.14[0.0170, 0.3797]YesYes
Indirect effect0.4718 **0.23072.04[0.0196, 0.9240]YesYes
Note: ** p < 5%; the number of Bootstrap repetitions selected is 1000.
Table 12. The mediating effect of regression results.
Variable(1)(2)(3)
GEGNQPFGEG
DIF0.6701 ***0.6441 ***0.4718 **
(0.1938)(0.0840)(0.2108)
NQPF 0.3080 **
(0.1338)
CONTROLSYesYesYes
CONS−0.5366 *0.0003−0.5367 *
(0.2818)(0.1222)(0.2798)
N372372372
R 2 0.88730.72900.8300
Sobel Z2.205 **
Province/Year FEYesYesYes
Note: * p < 10%, ** p < 5%, and *** p < 1%; standard errors are in parentheses.
Table 13. The moderated mediation effect regression results (1).
Regression
Coefficient
SDt-ValueSignificance Level
Mediating effect model
DIF0.1940 **0.06942.790.019
GTEC0.3099 **0.12122.560.016
DIF × GTEC0.0581 **0.02392.440.021
CONS0.0148 *0.00811.830.077
Dependent variable model
DIF0.3458 **0.11523.000.013
NQPFs0.3227 *0.14552.220.051
GTEC0.0959 ***0.02633.640.005
DIF × GTEC0.2447 ***0.05794.230.002
NQPFs × GTEC0.1541 ***0.03873.980.003
CONS−0.2958 *0.1386−2.130.059
Tests for the moderated mediation effect
GTEC (NQPFs)indirect effectsignificance95% CIs
Minus one SD0.1187 **0.042[0.0042, 0.2332]
Average value0.3791 ***0.036[0.0256, 0.7326]
Add one SD0.3835 ***0.000[0.1685, 0.5986]
CONTROLSYes
N372
Province/Year FEYes
Note: * p < 10%, ** p < 5%, and *** p < 1%.
Table 14. The moderated mediation effect regression results (2).
Regression
Coefficient
SDt-ValueSignificance Level
Mediating effect model
DIF0.1546 ***0.04023.840.003
CONS0.1996 ***0.05243.810.003
Dependent variable model
DIF0.2612 ***0.05274.960.001
NQPF0.0960 ***0.02633.640.005
ICA0.0878 ***0.02703.250.009
NQPFs × ICA0.1644 ***0.03654.500.001
CONS−0.2598 *0.1386−2.130.059
Tests for the moderated mediation effect
ICA (NQPFs)indirect effectsignificance95% CIs
Minus one SD0.0561 **0.039[0.0029, 0.1094]
Average value0.2522 ***0.001[0.1033, 0.4012]
Add one SD0.3922 ***0.000[0.1731, 0.6113]
CONTROLSYes
N372
Province/Year FEYes
Note: * p < 10%, ** p < 5%, and *** p < 1%.
Table 15. Threshold effect test results.
Number of
Threshold
F-Statisticp-ValueThreshold ValueThreshold Value95% CIs
1%5%10%
Single125.760.000036.580326.930425.26670.3789 ***[0.3661, 0.3878]
Double27.980.070037.293131.604625.58800.6496 *[0.6429, 0.6551]
Triple25.480.220027.075920.728634.35310.8650[0.8549, 0.8676]
Note: * p < 10% and *** p < 1%.
Table 16. Threshold regression results.
Threshold VariablesCoefficient EstimateStandard Errort-Value95% Confidence Intervals
D I F i t · I ( Z 0.3789 ) 0.9439 ***0.21944.30[0.4958, 1.3920]
D I F i t · I ( 0.3789 < Z 0.6496 ) 1.5349 ***0.39163.92[0.7351, 2.3346]
D I F i t · I ( Z > 0.6496 ) 2.6936 ***0.31468.56[2.0511, 3.3360]
CONTROLSYes
CONS3.9916 ***0.58576.81[2.7954, 5.1878]
N372
R20.9020
Province/Year FEYes
Note: *** p < 1%.
Table 17. Endogeneity test.
VariableHeckman’s Two-Stage MethodIV MethodDynamic Panel GMMPSM
First-Stage
Regression
Second-Stage
Regression
First-Stage
Regression
Second-Stage
Regression
DIF-GMMSYS-GMM
(1)(2)(3)(4)(5)(6)(7)
DIF_useGEGDIFGEGGEG
L.GEG 0.3587 **0.3555 ***
(0.1425)(0.0753)
DIF 0.0721 *** 0.4792 ***0.1846 ***0.2151 ***0.0929 **
(0.0223) (0.1598)(0.0308)(0.0566)(0.0310)
IMR 0.0348 ***
(0.0107)
IV0.0459 *** 0.0399 **
(0.0128) (0.0143)
CONTROLSYesYesYesYesYesYesYes
CONS0.2811 ***0.7585 **−0.21930.1143 **0.0097 ***0.0410 ***0.9957 ***
(0.0371)(0.3682)(0.2215)(0.0410)(0.0037)(0.0155)(0.0307)
AR (1) 0.0120.007
AR (2) 0.4960.375
Hansen 0.7170.375
N372372372372341310246
R20.69130.53620.25730.3478--0.0274
Province/Year FEYesYesYesYesYesYesYes
Kleibergen-Paap rk LM 85.779
(0.0000)
Kleibergen-Paap rk Wald F 86.54
(16.38)
Note: ** p < 5%, and *** p < 1%; standard errors are in parentheses.
Table 18. Robustness test.
VariableSubstitution of Independent
Variable
Substitution of Dependent VariableExcluding
Municipality
Samples
Excluding Time Samples1% Winsorization5% Winsorization
(1)(2)(3)(4)(5)(6)(7)(8)
GEGGEGGEGGEG_ReplaceGEGGEGGEGGEG
DIF 0.6737 ***0.4794 **0.4069 ***0.5465 ***0.4902 ***
(0.1604)(0.1575)(0.1023)(0.1281)(0.1219)
DIF_CB0.1644 **
(0.0544)
DIF_UD 0.2389 ***
(0.0488)
DIF_DL 0.1830 **
(0.0649)
CONTROLSYesYesYesYesYesYesYesYes
CONS0.36070.40950.39510.0363−0.75150.1506 *−0.0375−0.0653 *
(0.3238)(0.2809)(0.2702)(0.0332)(0.4176)(0.0877)(0.0367)(0.0360)
N372372372372324279372372
R20.83360.83410.82580.96530.78510.85380.92070.9143
Province/Year FEYesYesYesYesYesYesYesYes
Note: * p < 10%, ** p < 5%, and *** p < 1%; standard errors are in parentheses.
Table 19. Keywords for the substitute variable of government environmental governance.
VariableKeywords
GEG_replaceenvironment, environmental protection,
energy consumption,
pollution, emission reduction
Disclaimer/Publisher’s Note: The statements, opinions and data contained in all publications are solely those of the individual author(s) and contributor(s) and not of MDPI and/or the editor(s). MDPI and/or the editor(s) disclaim responsibility for any injury to people or property resulting from any ideas, methods, instructions or products referred to in the content.

