


Dynamic Spillover Effects Among China’s Energy, Real Estate, and Stock Markets: Evidence from Extreme Events


Abstract
1. Introduction
2. Literature Review: Dynamic Interconnections and Risk Spillovers Among Energy, Real Estate, and Stock Markets
2.1. Interaction Mechanisms Between Energy and Real Estate Markets
2.2. Research Progress on Cross-Market Spillover Effects
2.2.1. Risk Transmission Between Energy and Financial Markets
2.2.2. Dynamic Interconnections Between Stock and Real Estate Markets
2.3. Asymmetry and Nonlinear Spillover Effects
2.4. Limitations of Existing Research and Directions for Breakthroughs
2.5. Evolution of Methodology and Theoretical Contributions
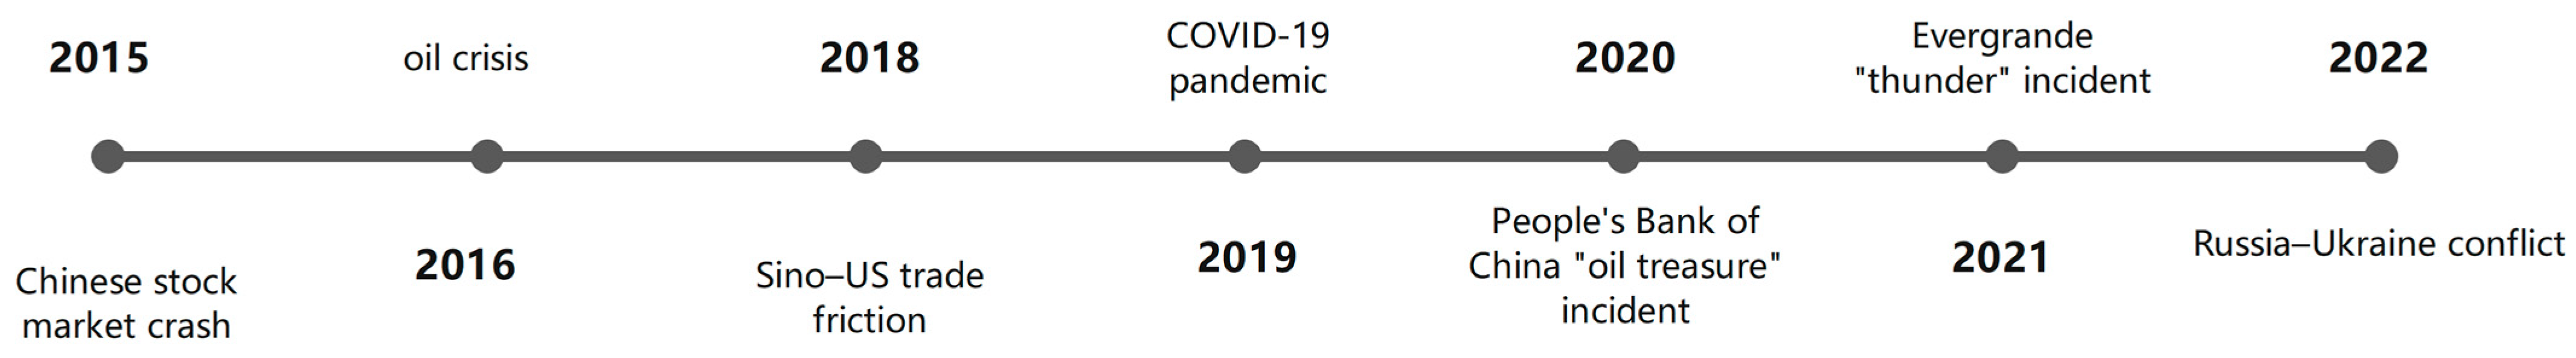
2.6. Major Extreme Events
3. Methodology and Data Overview
3.1. Methodology
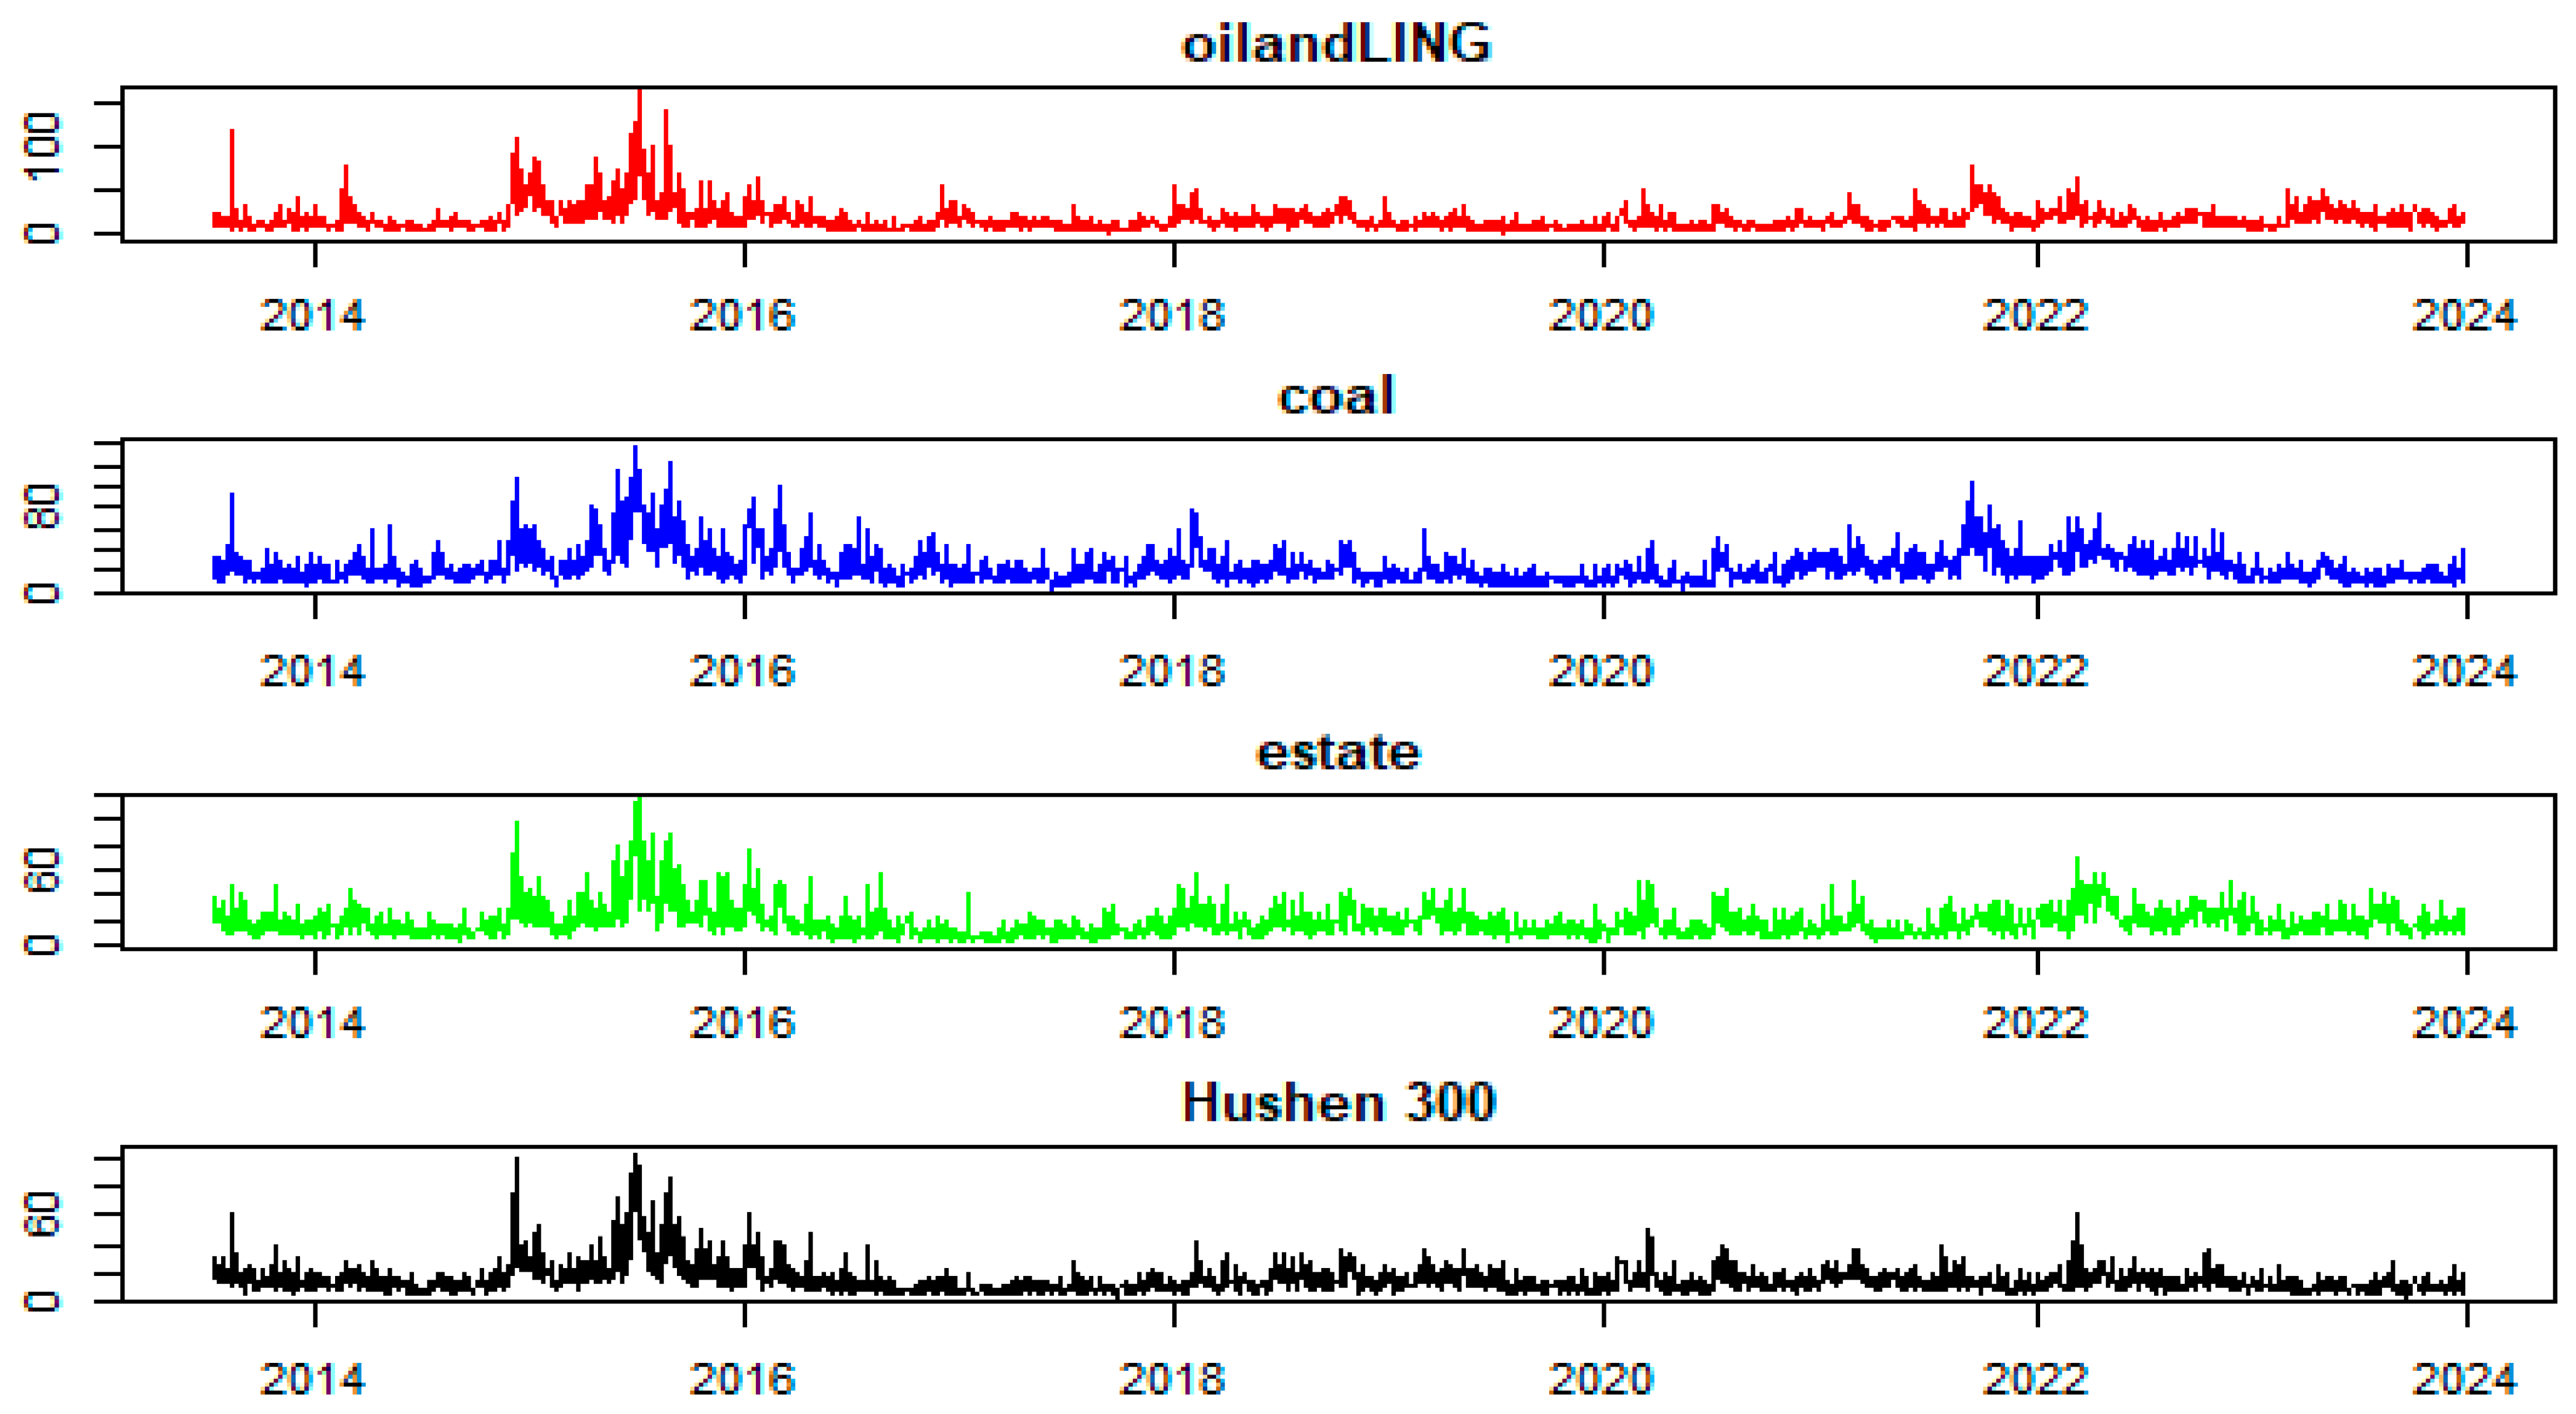
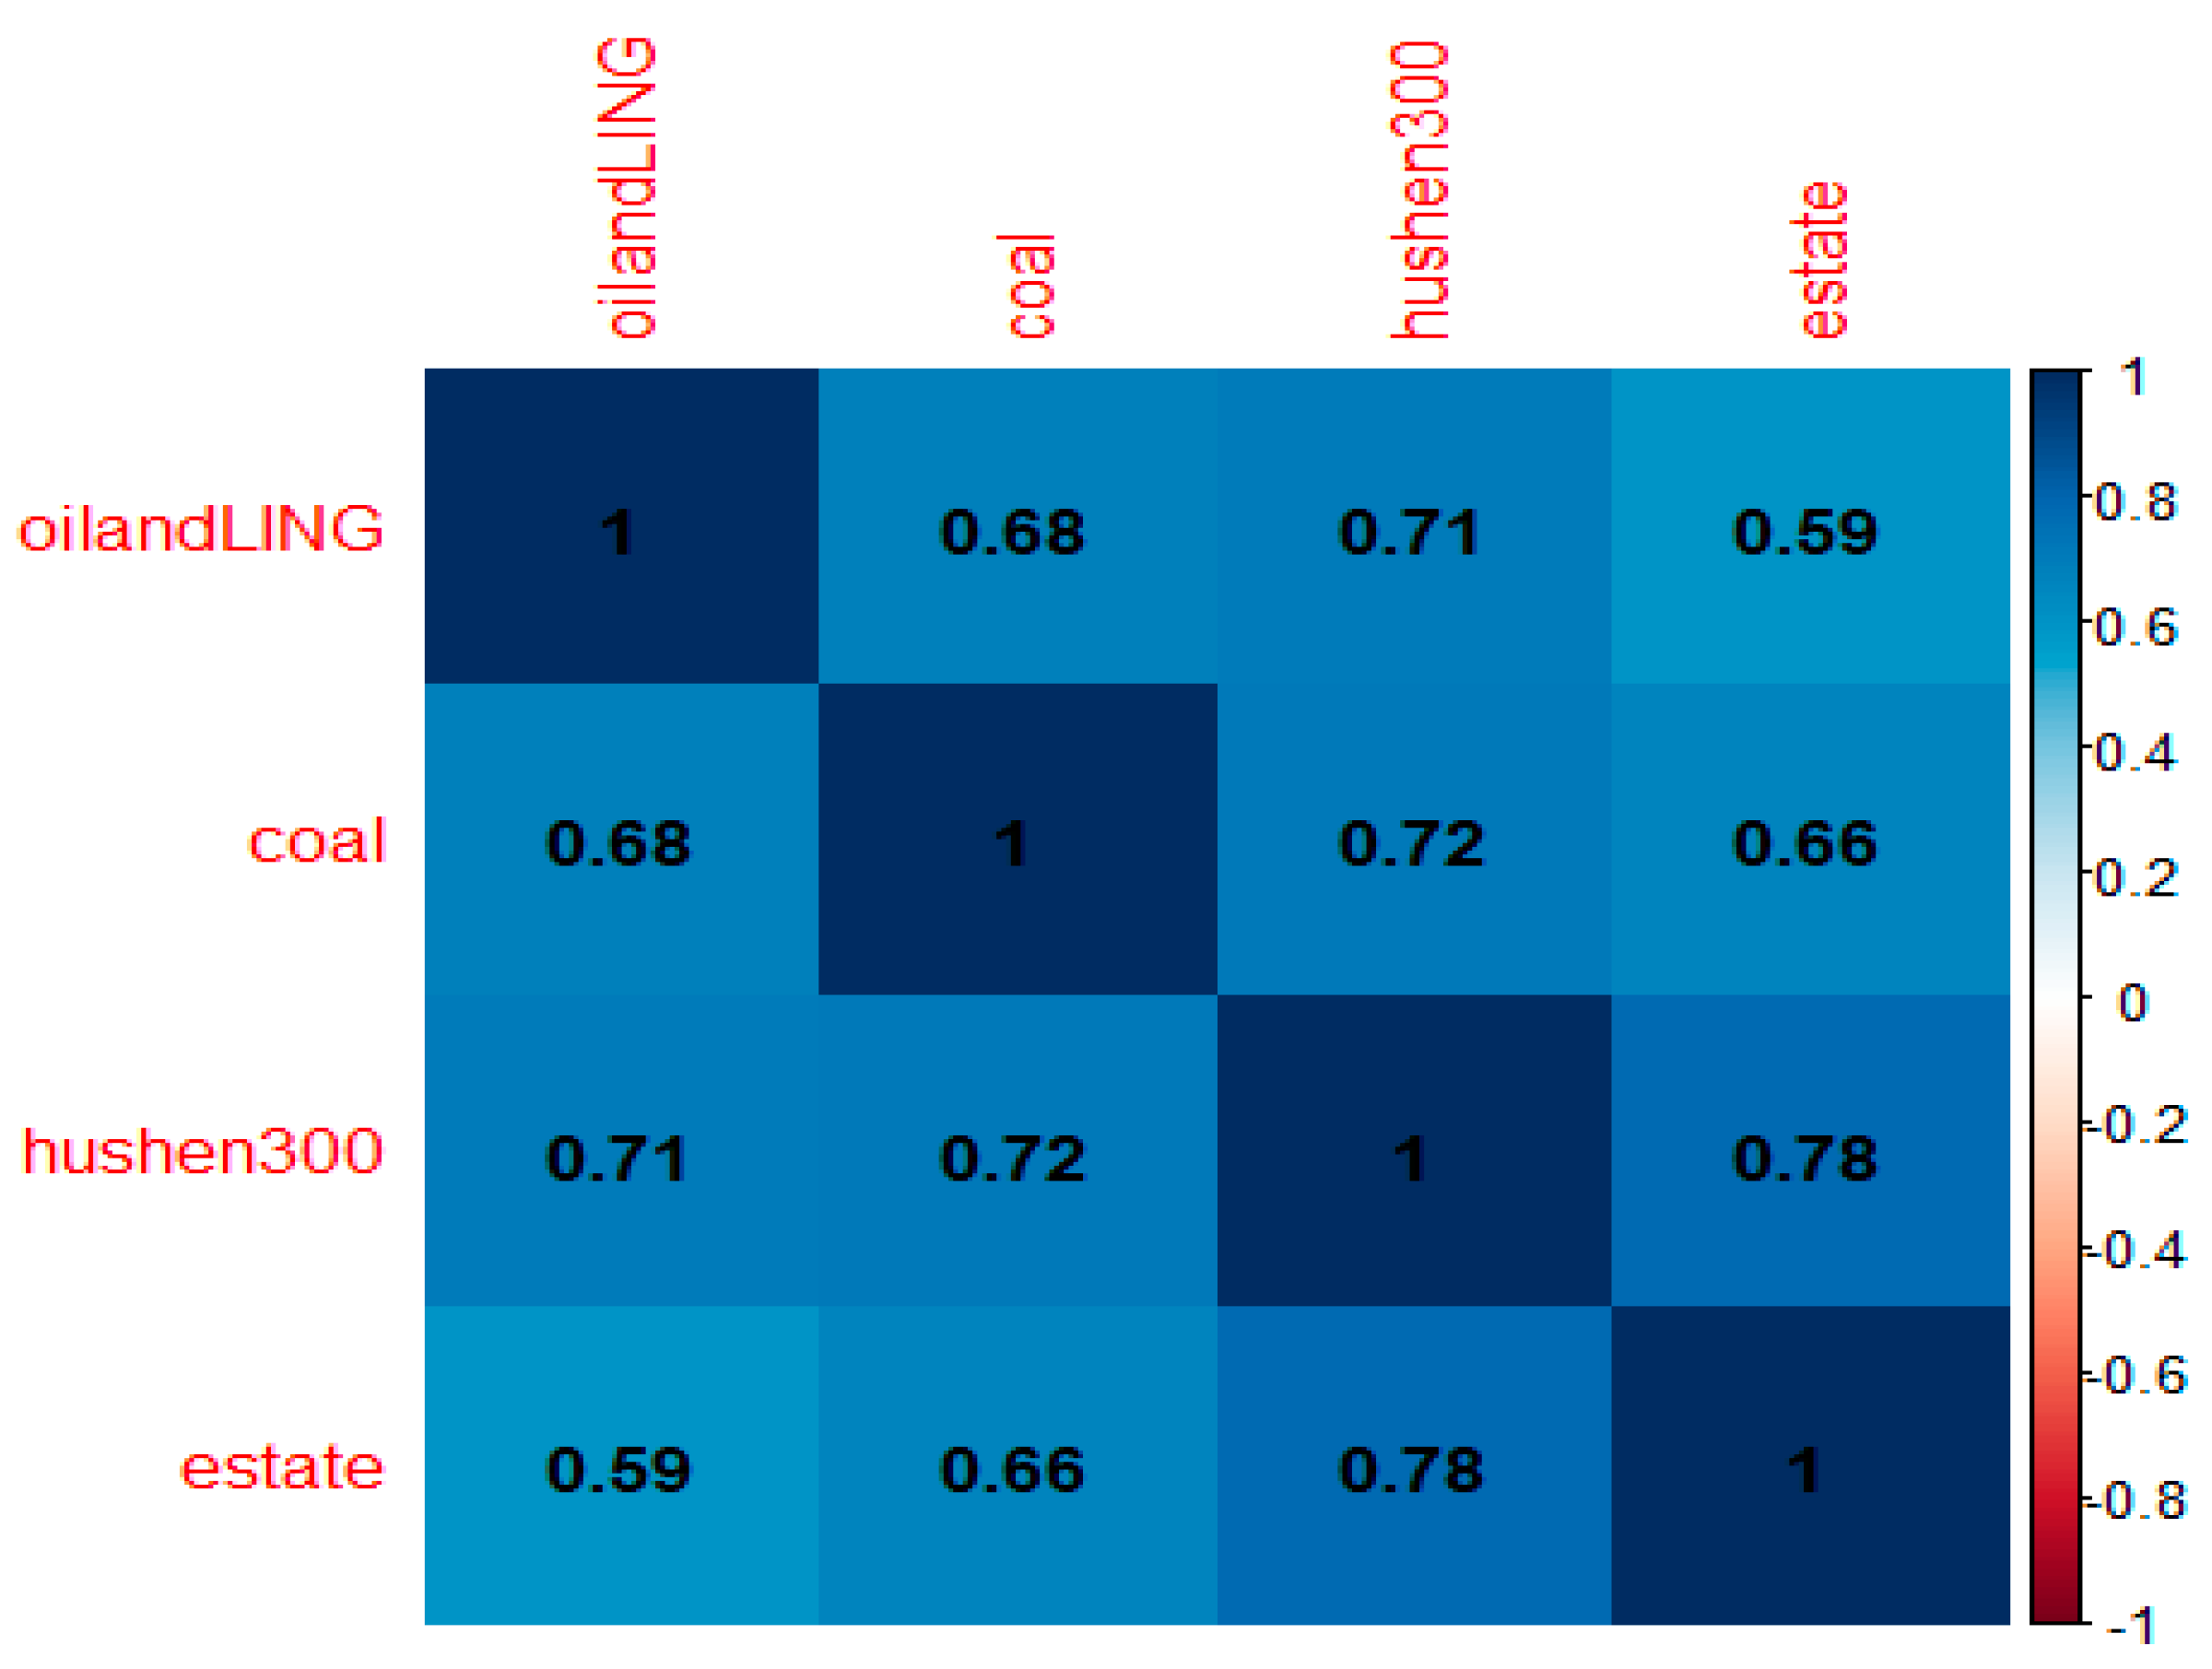
3.2. Data Overview
4. Risk Spillover Analysis
4.1. Static Analysis of Risk Spillover
4.2. Dynamic Analysis of Risk Spillover
4.2.1. Analysis of Total Risk Spillover
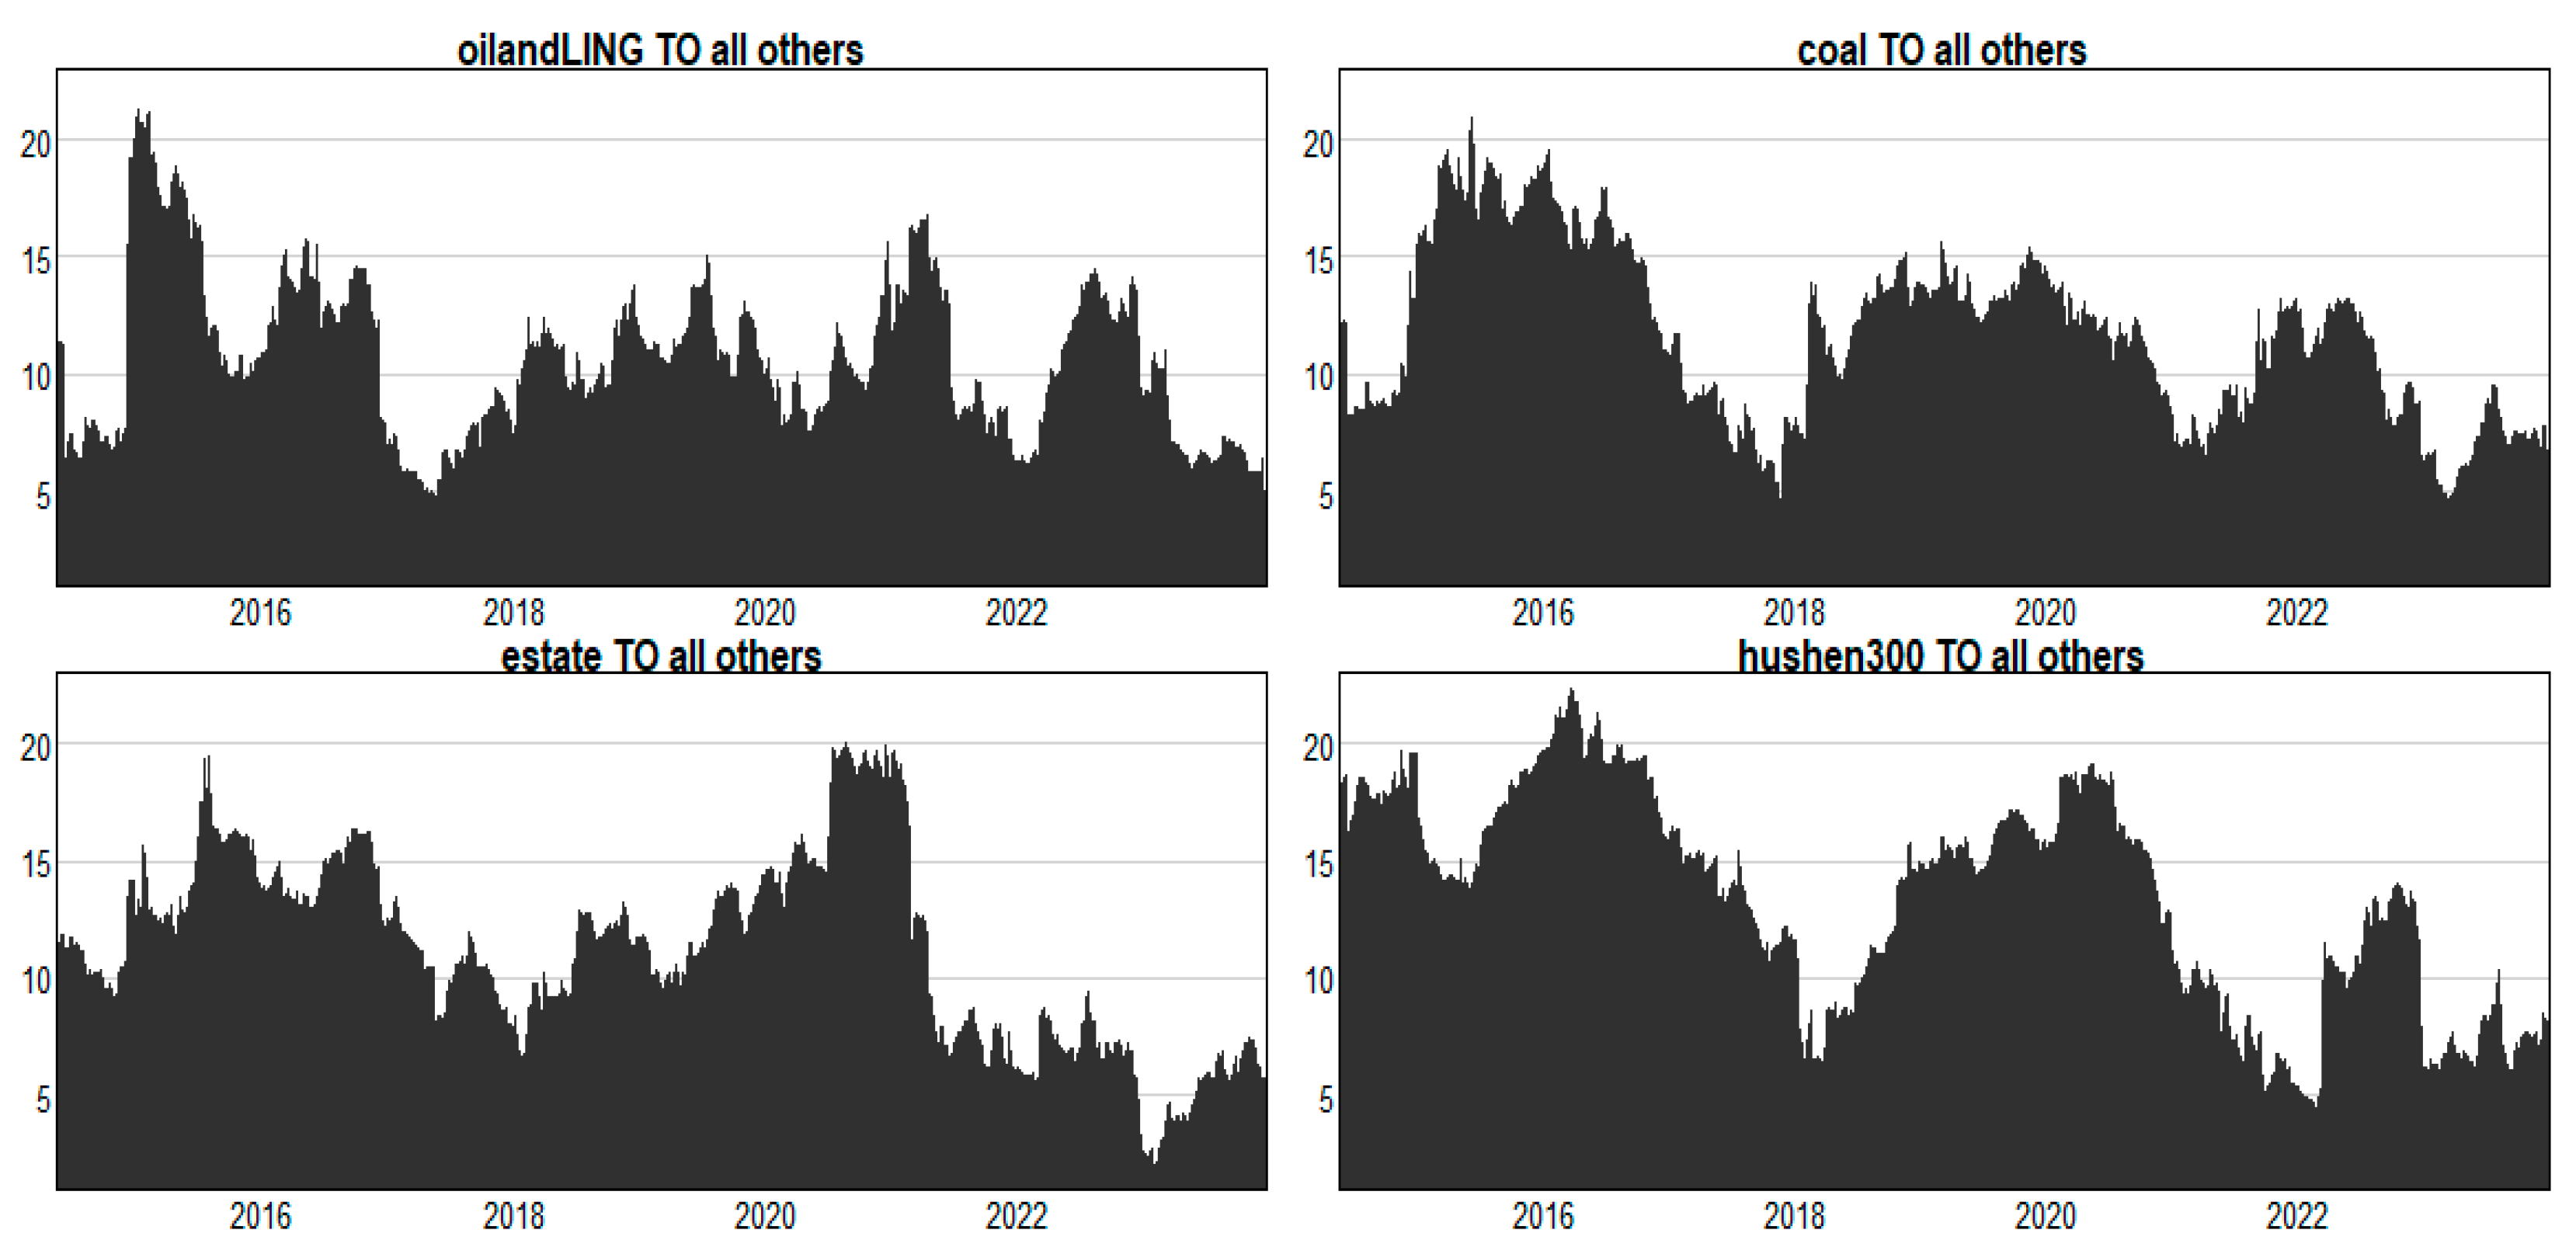
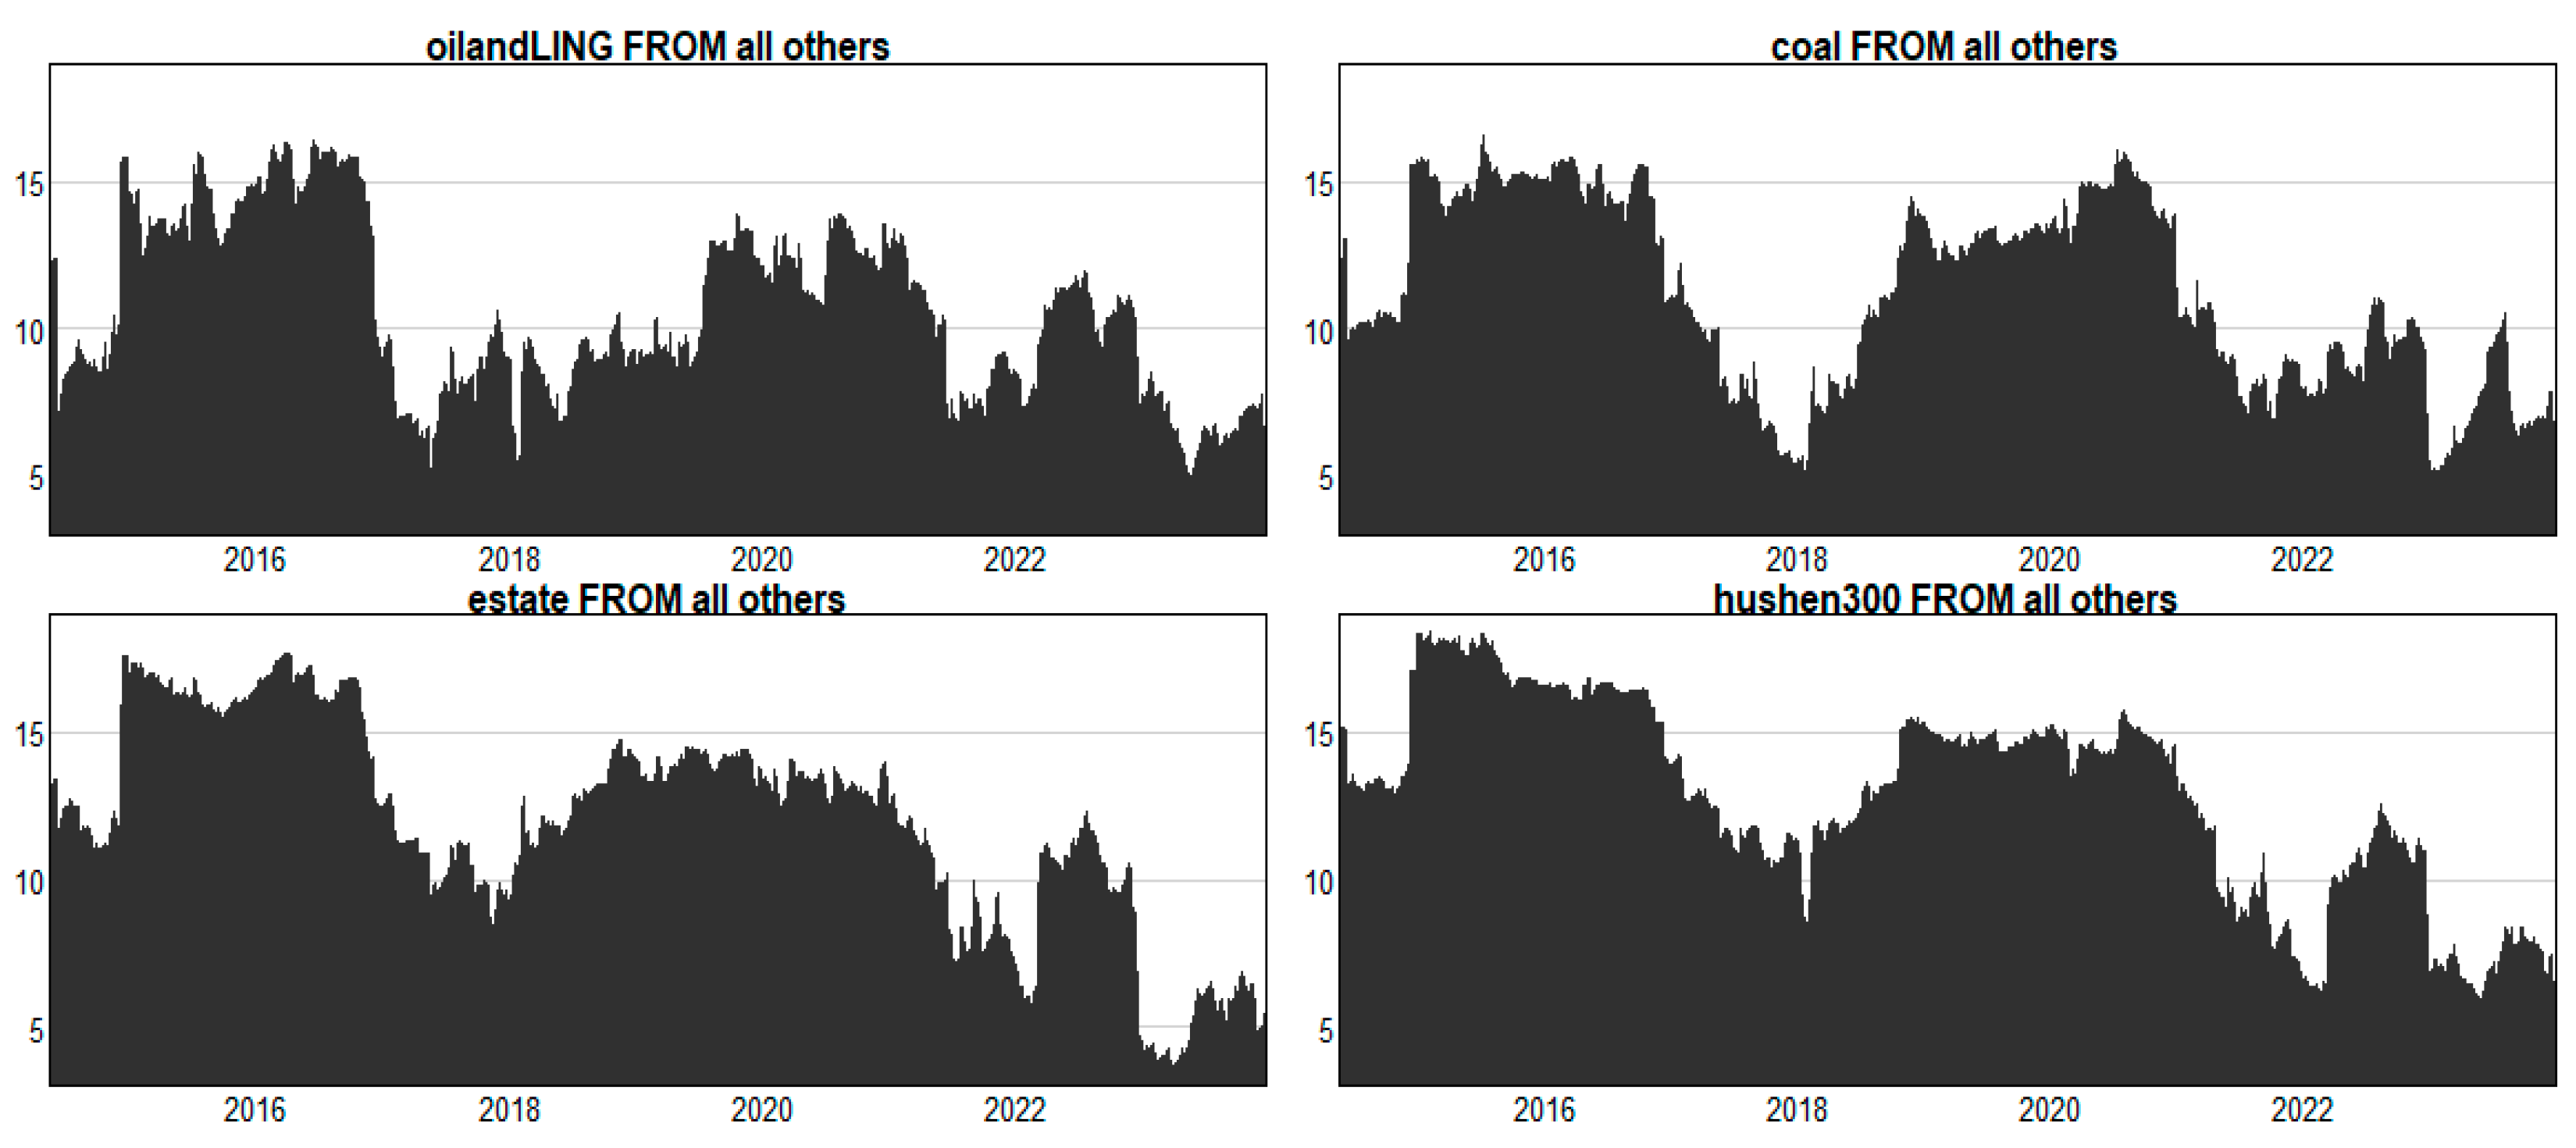
4.2.2. Analysis of Directional Risk Spillover
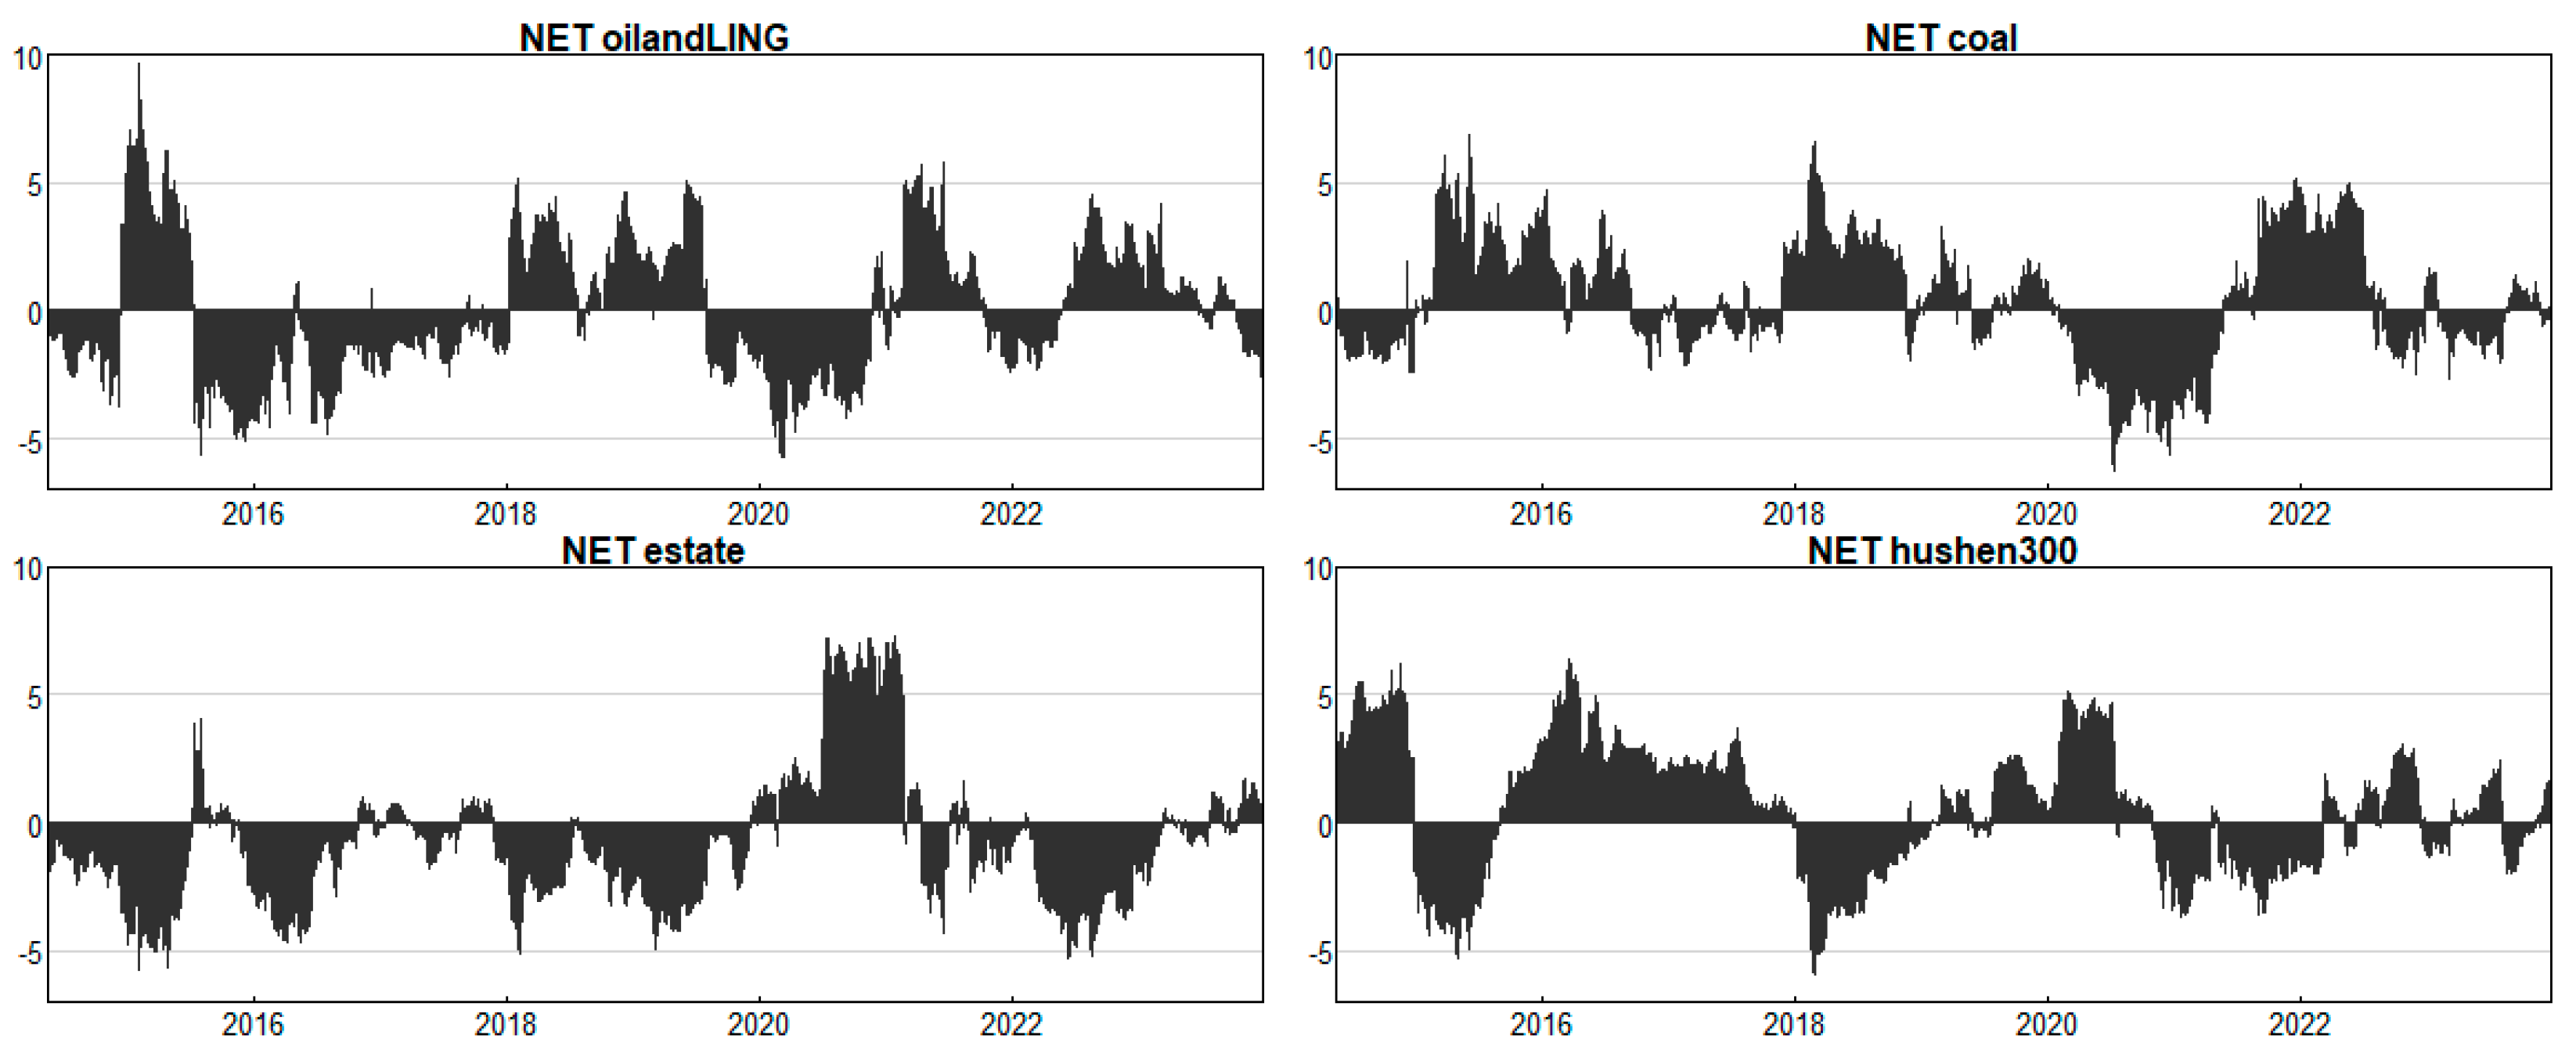
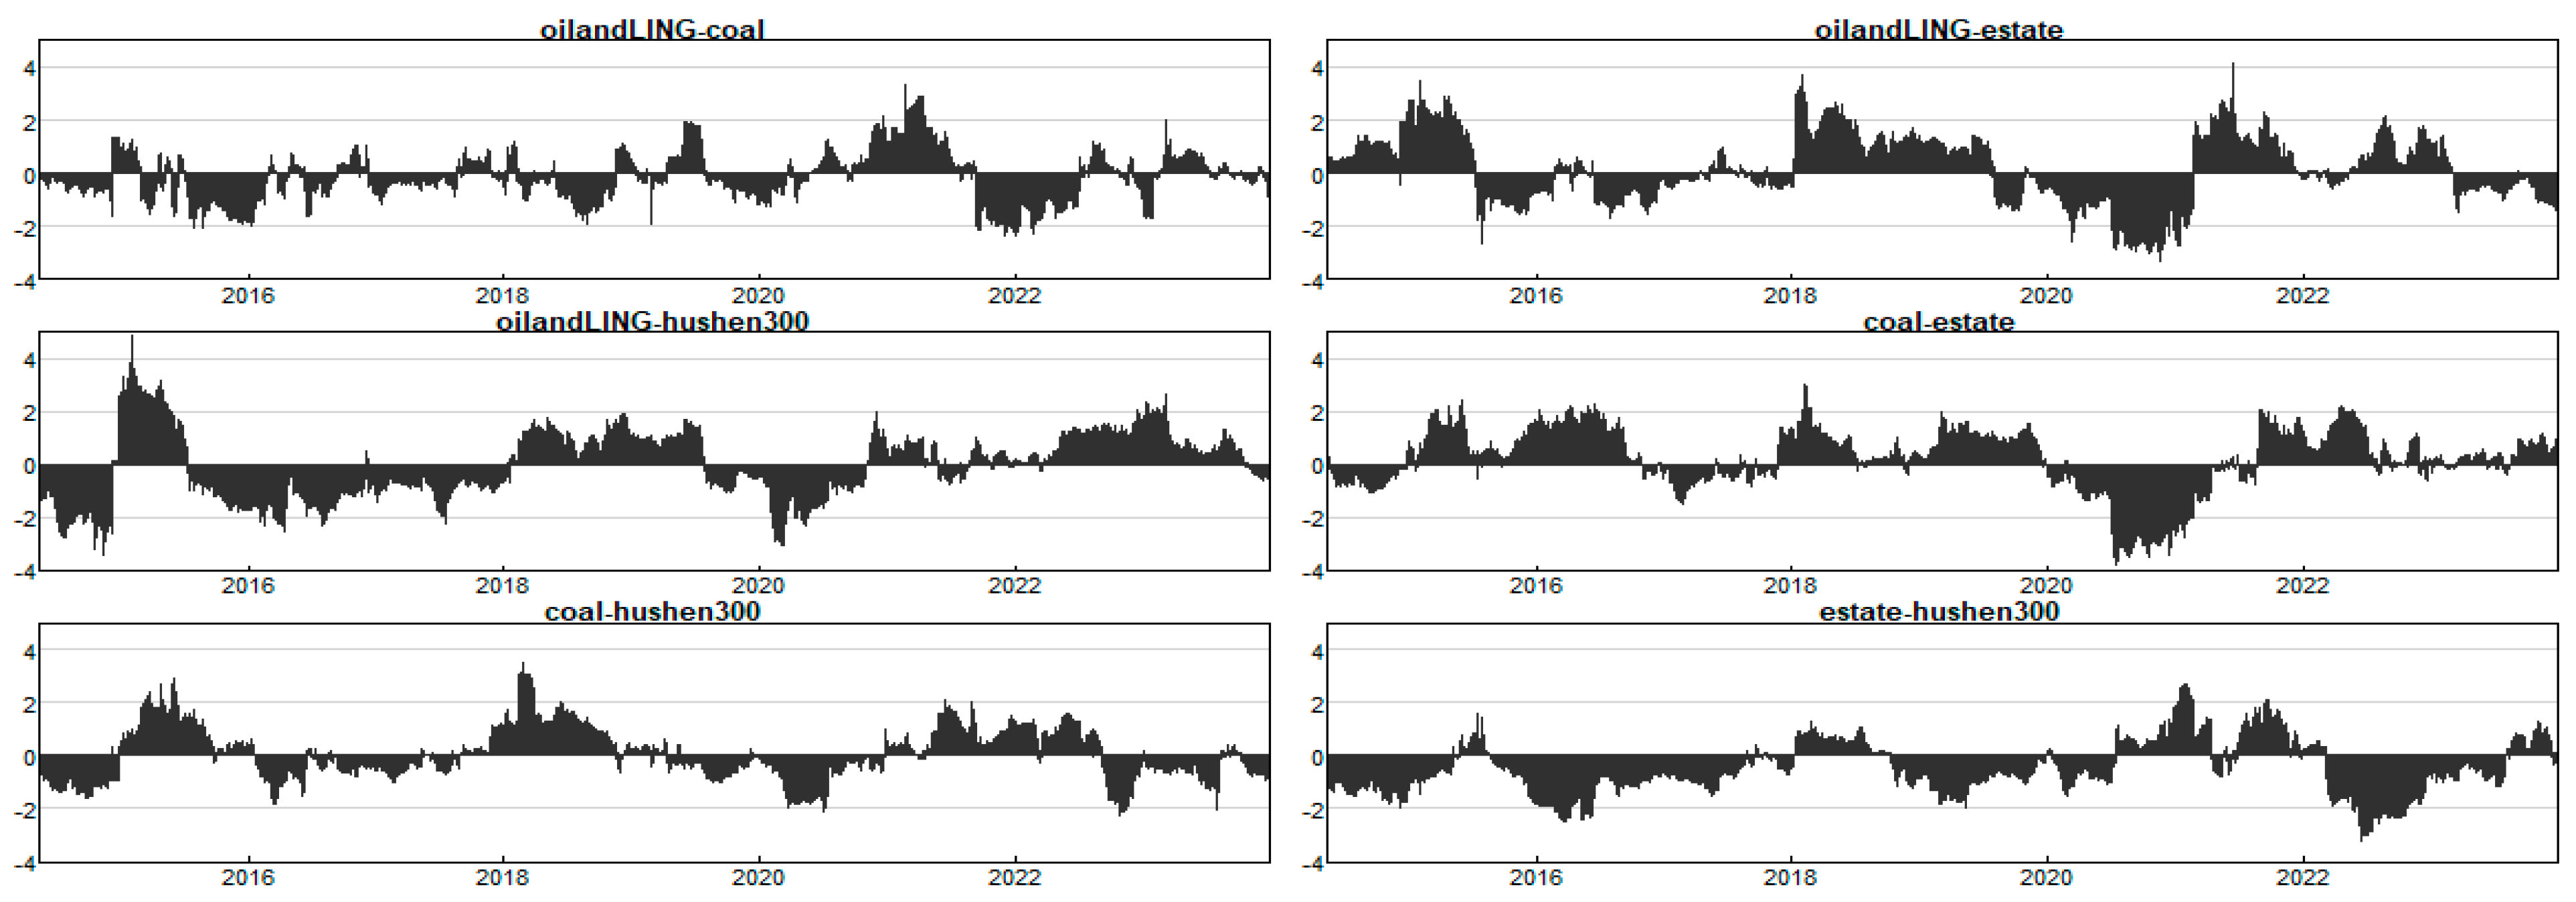
4.2.3. Analysis of Net Pairwise Directional Connectedness of Risk
5. Conclusions and Suggestions
5.1. Conclusions
5.2. Suggestions
5.3. Research Limitations and Future Directions
Author Contributions
Funding
Institutional Review Board Statement
Informed Consent Statement
Data Availability Statement
Conflicts of Interest
References
- Akbari, A., & Krystyniak, K. (2021). Government real estate interventions and the stock market. International Review of Financial Analysis, 75, 101742. [Google Scholar] [CrossRef]
- Alhodiry, A., Rjoub, H., & Samour, A. (2021). Impact of oil prices, the U.S interest rates on Turkey’s real estate market. New evidence from combined co-integration and bootstrap ARDL tests. PLoS ONE, 16(1), e0242672. [Google Scholar] [CrossRef] [PubMed]
- Antonakakis, N., Chatziantoniou, I., & Gabauer, D. (2020). Refined measures of dynamic connectedness based on time-varying parameter vector autoregressions. Journal of Risk and Financial Management, 13(4), 84. [Google Scholar] [CrossRef]
- Antonakakis, N., Cunado, J., Filis, G., Gabauer, D., & de Gracia, F. P. (2023). Dynamic connectedness among the implied volatilities of oil prices and financial assets: New evidence of the COVID-19 pandemic. International Review of Economics & Finance, 83, 114–123. [Google Scholar]
- Basu, P., & Gavin, W. T. (2010). What explains the growth in commodity derivatives? Federal Reserve Bank of St Louis Review, 93, 37–48. [Google Scholar] [CrossRef]
- Belkhir, N., & Abbes, M. B. (2024). Analysis of the impact of COVID-19 on the dynamic volatility spillover network in the Saudi stock market. International Journal of Asian Social Science, 14(1), 26–49. [Google Scholar] [CrossRef]
- Bellman, R. (1966). Dynamic programming. Science, 153, 34–37. [Google Scholar] [CrossRef]
- Chau, K. W., & Zou, G. (2018). Energy prices, real estate sales and industrial output in China. Energies, 11(7), 1847. [Google Scholar] [CrossRef]
- Chen, Y., Yu, L., & Gang, J. (2021). Half-day trading and spillovers. Frontiers of Business Research in China, 15, 1. [Google Scholar] [CrossRef]
- Diebold, F. X., & Yilmaz, K. (2012). Better to give than to receive: Predictive directional measurement of volatility spillovers. International Journal of Forecasting, 28(1), 57–66. [Google Scholar] [CrossRef]
- Dieci, R., Schmitt, N., & Westerhoff, F. (2018). Interactions between stock, bond and housing markets. Journal of Economic Dynamics and Control, 91, 43–70. [Google Scholar] [CrossRef]
- Du, R., & Xu, P. (2024). Time-Varying spillover effects between clean and traditional energy under multiple uncertainty risk: Evidence from the U.S. market. Sustainability, 16(21), 9164. [Google Scholar] [CrossRef]
- Geng, J., Du, Y., Ji, Q., & Zhang, D. (2021). Modeling return and volatility spillover networks of global new energy companies. Renewable and Sustainable Energy Reviews, 135, 110214. [Google Scholar] [CrossRef]
- Gong, X., Liu, X., Xiong, X., & Zhang, W. (2020). Research on China’s financial systemic risk contagion under jump and heavy-tailed risk. International Review of Financial Analysis, 72, 101584. [Google Scholar] [CrossRef]
- He, X., & Hamori, S. (2023). Different moments create different spillovers: A study of commodity markets. The Singapore Economic Review, 1, 1–22. [Google Scholar] [CrossRef]
- Hu, G. X., & Wang, J. (2022). A review of China’s financial markets. Annual Review of Financial Economics, 14, 465–507. [Google Scholar] [CrossRef]
- Kalli, M., & Griffin, J. E. (2014). Time-varying sparsity in dynamic regression models. Journal of Econometrics, 178(2), 779–793. [Google Scholar] [CrossRef]
- Khalfaoui, R., Mefteh-Wali, S., Dogan, B., & Ghosh, S. (2023). Extreme spillover effect of COVID-19 pandemic-related news and cryptocurrencies on green bond markets: A quantile connectedness analysis. International Review of Financial Analysis, 86, 102496. [Google Scholar] [CrossRef]
- Koop, G., & Korobilis, D. (2013). Large time-varying parameter VARs. Journal of Econometrics, 177(2), 185–198. [Google Scholar] [CrossRef]
- Korobilis, D. (2013). Var forecasting using Bayesian variable selection. Journal of Applied Econometrics, 28(2), 204–230. [Google Scholar] [CrossRef]
- Korobilis, D., & Yilmaz, K. (2018). Measuring dynamic connectedness with large Bayesian VAR models. Available at SSRN 3099725. Available online: https://econpapers.repec.org/paper/kocwpaper/1802.htm (accessed on 19 April 2025).
- Kumar, S., Singh, G., & Kumar, A. (2022). Volatility spillover among prices of crude oil, natural gas, exchange rate, gold, and stock market: Fresh evidence from exponential generalized autoregressive conditional heteroscedastic model analysis. Journal of Public Affairs, 22(4), e2594. [Google Scholar] [CrossRef]
- Li, T., Ju, Y., & Dong, P. (2023). Investigating the interconnectedness of carbon, fossil energy, and financial markets: A dynamic spillover index approach. PLoS ONE, 18(12), e0295363. [Google Scholar] [CrossRef]
- Liow, K. H., & Song, J. (2021). Interdependence dynamics of corporate equity and public real estate markets. Journal of European Real Estate Research, 15(2), 147–178. [Google Scholar] [CrossRef]
- Liu, N., Liu, C., Da, B., Zhang, T., & Guan, F. (2021). Dependence and risk spillovers between green bonds and clean energy markets. Journal of Cleaner Production, 279, 123595. [Google Scholar] [CrossRef]
- Liu, Q., Xu, C., & Xie, J. (2024). Comparative analysis of spillover effects in the global stock market under normal and extreme market conditions. International Journal of Financial Studies, 12(2), 53. [Google Scholar] [CrossRef]
- Liu, Y., Zhang, J., Guo, N., & Liu, J. (2023). Investor sentiment contagion and network connectedness: Evidence from China and other international stock markets. The Manchester School, 91(6), 587–613. [Google Scholar] [CrossRef]
- Luo, R., & Li, Y. (2007). Some new features of the current relationship between stock market and real estate market. Southwest Finance, 9, 31–32. [Google Scholar]
- Mensi, W., Al Rababa’a, A. R., Vo, X. V., & Kang, S. H. (2021). Asymmetric spillover and network connectedness between crude oil, gold, and Chinese sector stock markets. Energy Economics, 98, 105262. [Google Scholar] [CrossRef]
- Mensi, W., Jiang, Z., Vo, X. V., & Yoon, S. (2023). Asymmetric volatility transmission and hedging strategies among REIT, stock, and oil markets. Australian Economic Papers, 62(4), 597–615. [Google Scholar] [CrossRef]
- Nakajima, J. (2011). Time-varying parameter VAR model with stochastic volatility: An overview of methodology and empirical applications. Monetary and Economic Studies, 29, 107–142. [Google Scholar]
- Ngene, G. M. (2021). What drives dynamic connectedness of the US equity sectors during different business cycles? The North American Journal of Economics and Finance, 58, 101493. [Google Scholar] [CrossRef]
- Nie, D., Li, Y., & Li, X. (2021). Dynamic spillovers and asymmetric spillover effect between the carbon emission trading market, fossil energy market, and new energy stock market in China. Energies, 14(19), 6438. [Google Scholar] [CrossRef]
- Primiceri, G. E. (2005). Time varying structural vector autoregressions and monetary policy. The Review of Economic Studies, 72(3), 821–852. [Google Scholar] [CrossRef]
- Shahzad, S. J. H., Naeem, M. A., Peng, Z., & Bouri, E. (2021). Asymmetric volatility spillover among Chinese sectors during COVID-19. International Review of Financial Analysis, 75, 101754. [Google Scholar] [CrossRef]
- Smith Stegen, K. (2015). Understanding China’s global energy strategy. International Journal of Emerging Markets, 10, 194–208. [Google Scholar] [CrossRef]
- Su, C. W., Wang, Z., Nian, R., & Zhao, Y. (2017). Does international capital flow lead to a housing boom? A time-varying evidence from China. The Journal of International Trade & Economic Development, 26(7), 851–864. [Google Scholar]
- Taruttis, L., & Weber, C. (2022). Estimating the impact of energy efficiency on housing prices in Germany: Does regional disparity matter? Energy Economics, 105, 105750. [Google Scholar] [CrossRef]
- Usman, M., Akhter, W., & Haque, A. (2023). Spillover effects of crash and jump events: Evidence from Chinese market. China Finance Review International, 13(4), 599–620. [Google Scholar] [CrossRef]
- Vo, D. H., & Nguyen, H. L. (2024). Market risk spillover and the asymmetric effects of macroeconomic fundamentals on market risk across Vietnamese sectors. Financial Innovation, 10(1), 95. [Google Scholar] [CrossRef]
- Wang, Q., Wei, Y., Wang, Y., & Liu, Y. (2022). On the safe-haven ability of bitcoin, gold, and commodities for international stock markets: Evidence from spillover index analysis. Discrete Dynamics in Nature and Society, 2022(1), 9520486. [Google Scholar] [CrossRef]
- Wang, X., Bian, S., & Wu, C. (2023). Spillover effects within supply chains: Evidence from Chinese-listed firms. Journal of International Financial Management & Accounting, 34(3), 594–632. [Google Scholar]
- Yang, G., Yin, X., Sun, Z., Bi, P., & Ma, Q. (2024). The spillover effect of real estate boom on stock market efficiency: Evidence from China. Applied Economics, 57(24), 3164–3179. [Google Scholar] [CrossRef]
- Zha, R., Yu, L., Su, Y., & Yin, H. (2023). Dependences and risk spillover effects between Bitcoin, crude oil and other traditional financial markets during the COVID-19 outbreak. Environmental Science and Pollution Research, 30(14), 40737–40751. [Google Scholar] [CrossRef] [PubMed]
- Zhang, W., He, X., Nakajima, T., & Hamori, S. (2020). How does the spillover among natural gas, crude oil, and electricity utility stocks change over time? Evidence from North America and Europe. Energies, 13(3), 727. [Google Scholar] [CrossRef]

| Research Focus | Main Conclusions | Key References |
|---|---|---|
| Energy-Real Estate Interactions |
| Basu and Gavin (2010); Chau and Zou (2018); Alhodiry et al. (2021) |
| Stock-Real Estate Linkages |
| Luo and Li (2007); Dieci et al. (2018); Akbari and Krystyniak (2021) |
| Asymmetric Spillovers |
| Shahzad et al. (2021); Mensi et al. (2021); Vo and Nguyen (2024) |
| Extreme Event Impacts |
| Zhang et al. (2020); Q. Wang et al. (2022); Li et al. (2023); Y. Liu et al. (2023); Q. Liu et al. (2024) |
| Methodological Limitations |
| Kumar et al. (2022); Ngene (2021); Yang et al. (2024) |
| Indicators | oilandLING | Coal | Estate | Hushen 300 |
|---|---|---|---|---|
| Mean | 17.35 | 23.21 | 18.37 | 14.62 |
| Median | 13.69 | 19.07 | 15.59 | 12.17 |
| Maximum | 162.19 | 138.81 | 115.92 | 104.29 |
| Minimum | 0.11 | 3.38 | 2.56 | 2.81 |
| Std.Deviation | 13.48 | 14.97 | 11.56 | 9.90 |
| Skewness | 3.71 *** | 2.33 *** | 2.41 *** | 3.40 *** |
| Kurtosis | 24.72 *** | 11.21 *** | 13.26 *** | 21.63 *** |
| JB | 55,931 *** | 9461.3 *** | 13,635 *** | 41,777 *** |
| ERS | −8.01 *** | −7.83 *** | −6.19 *** | −4.34 *** |
| Ljung–Box | 0.44 *** | 0.46 *** | 0.40 *** | 0.42 *** |
| Variable | oilandLING | Coal | Estate | Hushen 300 | FROM |
|---|---|---|---|---|---|
| oilandLING | 55.36 | 17.12 | 9.98 | 17.54 | 44.64 |
| coal | 17.70 | 51.13 | 13.00 | 18.17 | 48.87 |
| estate | 12.20 | 16.00 | 47.28 | 24.52 | 52.72 |
| Hushen 300 | 19.35 | 18.40 | 20.37 | 41.89 | 58.11 |
| TO | 49.25 | 51.52 | 43.34 | 60.23 | 204.34 |
| Inc.Own | 104.61 | 102.65 | 90.62 | 102.12 | TCI |
| NET | 4.61 | 2.65 | −9.38 | 2.12 | 51.09 |
Disclaimer/Publisher’s Note: The statements, opinions and data contained in all publications are solely those of the individual author(s) and contributor(s) and not of MDPI and/or the editor(s). MDPI and/or the editor(s) disclaim responsibility for any injury to people or property resulting from any ideas, methods, instructions or products referred to in the content. |
© 2025 by the authors. Licensee MDPI, Basel, Switzerland. This article is an open access article distributed under the terms and conditions of the Creative Commons Attribution (CC BY) license (https://creativecommons.org/licenses/by/4.0/).
Share and Cite
Xie, F.; Wang, J.; Wang, C. Dynamic Spillover Effects Among China’s Energy, Real Estate, and Stock Markets: Evidence from Extreme Events. Int. J. Financial Stud. 2025, 13, 97. https://doi.org/10.3390/ijfs13020097
Xie F, Wang J, Wang C. Dynamic Spillover Effects Among China’s Energy, Real Estate, and Stock Markets: Evidence from Extreme Events. International Journal of Financial Studies. 2025; 13(2):97. https://doi.org/10.3390/ijfs13020097
Chicago/Turabian StyleXie, Fusheng, Jingbo Wang, and Chunzi Wang. 2025. "Dynamic Spillover Effects Among China’s Energy, Real Estate, and Stock Markets: Evidence from Extreme Events" International Journal of Financial Studies 13, no. 2: 97. https://doi.org/10.3390/ijfs13020097
APA StyleXie, F., Wang, J., & Wang, C. (2025). Dynamic Spillover Effects Among China’s Energy, Real Estate, and Stock Markets: Evidence from Extreme Events. International Journal of Financial Studies, 13(2), 97. https://doi.org/10.3390/ijfs13020097