Article

From Policy Mandates to Market Signals: Causal and Dynamic Effects of Carbon Information Disclosure on Firm Value

by
Runyu Liu
1,2,
Mara Ridhuan Che Abdul Rahman
1,* and
Ainul Huda Jamil
1
1
Graduate School of Business, Universiti Kebangsaan Malaysia, Bangi 43600, Malaysia
2
School of Accounting, Nanjing Audit University Jinshen College, Nanjing 210023, China
*
Author to whom correspondence should be addressed.
Int. J. Financial Stud. 2025, 13(2), 98; https://doi.org/10.3390/ijfs13020098
Submission received: 5 April 2025 / Revised: 6 May 2025 / Accepted: 30 May 2025 / Published: 3 June 2025
(This article belongs to the Special Issue Sustainable Corporate Governance and Financial Performance)

Abstract

:
This study examines the causal and dynamic effects of carbon information disclosure on firm value, using a policy-driven setting in China’s carbon-intensive industries. In 2018, the Ministry of Ecology and Environment implemented a regulatory policy requiring internal carbon accounting and third-party verification for carbon-intensive enterprises, without mandating public disclosure. This exogenous policy shock offers a quasi-natural experiment to investigate how firms in carbon-intensive industries respond to environmental mandates through voluntary disclosure and how such disclosure affects their market valuation. Employing a difference-in-differences framework combined with two-stage least squares estimation, we identify a significant increase in carbon information disclosure following the policy intervention. This disclosure leads to a positive and growing effect on firm value, particularly when sustained over multiple years. Moreover, the valuation effect is moderated by regional environmental regulation: firms in areas with lower enforcement intensity benefit more from disclosure, as the signal is perceived to be more voluntary and credible. These findings provide robust causal evidence on the role of carbon information disclosure in shaping market outcomes under regulatory pressure. The study contributes to the literature on environmental regulation and corporate financial behavior in emerging markets.

1. Introduction

As governments around the world intensify environmental governance efforts, firms and stakeholders face increasing expectations to measure, manage, and disclose their carbon activities (Peters & Romi, 2014). Meanwhile, climate change exerts increasing pressure on financial markets and corporate decision-making, making carbon information disclosure a critical channel for firms to signal their environmental positioning and manage long-term economic risks (Du et al., 2022). Against this backdrop, carbon information disclosure has emerged as a key mechanism for firms to communicate their climate information, policy alignment, and transition readiness to external stakeholders (He et al., 2022).
Although prior studies have frequently linked carbon information disclosure to enhanced firm valuation, typically through mechanisms such as reduced information asymmetry or perceived environmental commitment, most rely on correlational analysis (R. Liu et al., 2025). This raises the unresolved question of whether carbon information disclosure itself creates value or merely reflects firm characteristics that independently drive valuation, such as governance quality, stakeholder engagement, or financial capacity (D. Z. X. Huang, 2022). In the absence of a causal identification strategy, these confounding factors make it difficult to determine whether disclosure serves as a meaningful signal or merely constitutes a byproduct of firm fundamentals. This study addresses this gap by leveraging the 2018 environmental policy reform as an exogenous regulatory shock (MEE, 2018), enabling identification of the causal effect of policy-induced disclosure on firm value.
Prior research presents two competing perspectives on the relationship between carbon information disclosure and corporate valuation (Saka & Oshika, 2014). One perspective views it as a voluntary and proactive act, reflecting a firm’s environmental leadership, responsiveness to stakeholder concerns, and strategic alignment with long-term sustainability goals (Qian & Schaltegger, 2017). Under this view, consistent carbon reporting is interpreted as a forward-looking signal of managerial quality and regulatory preparedness, which investors may reward. In contrast, the second perspective treats disclosure as reactive behavior, primarily driven by external mandates or reputational risk. When carbon information disclosure is motivated by compliance rather than internal commitment, its intent may be less credible and its informational value more difficult for investors to assess (Meng & Zhang, 2022).
These contrasting interpretations are particularly relevant in emerging markets, where environmental regulations are evolving rapidly but enforcement remains inconsistent across regions, especially in China (Cao et al., 2022). In such contexts, firms may increase the frequency or volume of carbon information disclosure in response to regulatory developments without necessarily improving the substantive quality of their environmental performance. Capital markets operating in these environments often struggle to distinguish genuine signals from symbolic compliance, resulting in delayed or muted valuation effects (Sun et al., 2022). These complexities raise a central question at the heart of this study: when carbon information disclosure is triggered by regulatory pressure rather than internal strategy, does it generate financial value, and under what regulatory conditions is this value recognized by markets?
Despite increasing scholarly attention, empirical findings on the financial effects of carbon information disclosure remain mixed (Wang, 2022). While many studies report a positive association between disclosure and firm value, most fail to adequately address endogeneity concerns (Siddique et al., 2021). For instance, firms with stronger financial standing may be both more able and more willing to disclose, making it difficult to ascertain whether disclosure itself creates value or merely reflects underlying firm capacity (Flammer et al., 2021). Moreover, both disclosure and valuation may be jointly influenced by unobservable factors, such as managerial quality or stakeholder orientation. These challenges are particularly pronounced in settings where disclosure is not standardized, externally assured, or legally mandated, making it difficult to isolate meaningful signals from background noise (Dutta & Dutta, 2021).
In addition, existing research often treats carbon information disclosure as a one-time event, overlooking its evolving nature (Sun et al., 2022). The credibility and financial impact of disclosure may not be immediately recognized by markets but instead develop over time as investors observe patterns of consistency, alignment with policy signals, and integration with corporate strategy. Moreover, few studies explicitly examine how environmental regulatory pressure shapes not only the likelihood of disclosure but also how such disclosure is interpreted by investors (Aragòn-Correa et al., 2020). Identical disclosures may be interpreted very differently depending on the intensity of local enforcement and investor expectations (Ameli et al., 2020). Without accounting for such regulatory variation, it becomes difficult to accurately assess when and why carbon information disclosure influences market valuation.
This study addresses these gaps by examining a quasi-natural experiment arising from China’s 2018 environmental policy reform. That year, the Ministry of Ecology and Environment (MEE) issued the Notice on Strengthening the 2018 Annual Carbon Emission Report, Verification, and Emission Monitoring Plan Development Work, requiring carbon-intensive enterprises to conduct standardized internal carbon accounting and submit verified data to regulators. Importantly, the policy did not mandate public disclosure. Its purpose was administrative oversight, not investor communication. Nonetheless, the policy introduced significant environmental regulatory pressure. Firms subject to the regulation, particularly those located in regions with stronger enforcement, responded by voluntarily increasing the amount of carbon information disclosed in their annual reports (MEE, 2018).
This policy context offers a valuable opportunity to assess whether carbon information disclosure, when driven by external regulatory pressure rather than internal strategic intent, has measurable financial consequences. Specifically, the analysis investigates whether such disclosure serves as a credible signal that influences investor perception and firm value. The study further explores how this valuation effect unfolds over time and whether it varies depending on the strength of regional regulatory enforcement. A key focus is whether capital markets are able to differentiate between symbolic compliance and substantive engagement in response to environmental policy signals.
This study distinguishes itself from prior research through both its identification strategy and empirical insights. Methodologically, this study adopts a difference-in-differences (DID) design, using the 2018 policy reform as a regulatory shock that differentially affected firms based on their exposure to emission intensity thresholds. To address potential endogeneity concerns, an instrumental variable (IV) approach is employed, using the interaction between time and baseline policy exposure as an instrument. This allows us to identify the causal effect of policy-induced carbon information disclosure on firm value, which is an aspect largely overlooked in previous research. Furthermore, we incorporate time-lagged disclosure variables to capture delayed valuation effects and introduce regional regulatory intensity to examine how enforcement environments shape investor responses.
Beyond the methodological approach, addressing key gaps in the existing literature is essential to position this study within the broader academic discourse. While previous studies have offered valuable insights into the association between carbon information disclosure and firm value, important gaps remain. First, most research relies on correlational analysis and fails to establish causality, particularly under policy-induced disclosure contexts. Second, the dynamic evolution of disclosure effects over time has been largely overlooked, limiting understanding of how market perceptions adjust. Third, the role of regional regulatory heterogeneity in shaping the valuation impact of disclosure has received insufficient attention. Addressing these gaps is critical to advancing both theory and practice in climate finance and corporate disclosure research.
Building on these distinctions, this study contributes to the literature in three key ways. First, it provides causal evidence on how carbon information disclosure, when driven by policy pressure, influences firm value. This addresses a major limitation in the existing correlational literature. Second, it introduces a dynamic perspective by demonstrating that the financial effects of disclosure unfold gradually over time rather than occurring immediately. Third, it highlights the moderating role of environmental regulation by showing that the valuation relevance of disclosure depends on the strength of regulatory enforcement in the firm’s operating region.
These findings offer distinct implications for corporate managers, investors, and policymakers. For corporate managers, the evidence suggests that carbon information disclosure can contribute to firm value, especially when it reflects a consistent response to regulatory expectations. A high level of organizational attention to carbon information can help firms better anticipate policy trends and align disclosure with external expectations. For investors, the findings underscore the importance of interpreting carbon information disclosure in context, considering both its substantive content and the regulatory motivations underlying it. For policymakers, the findings suggest that even non-mandatory environmental policies can influence market outcomes, particularly when they introduce credible regulatory pressure and signal future policy directions.
This paper is structured as follows. Section 2 reviews the literature and develops the hypotheses. Section 3 outlines the research design, data, and variables. Section 4 presents the empirical results, including dynamic and heterogeneous effects. Section 5 discusses the findings and concludes with implications for theory and practice.

2. Literature Review and Hypothesis Development

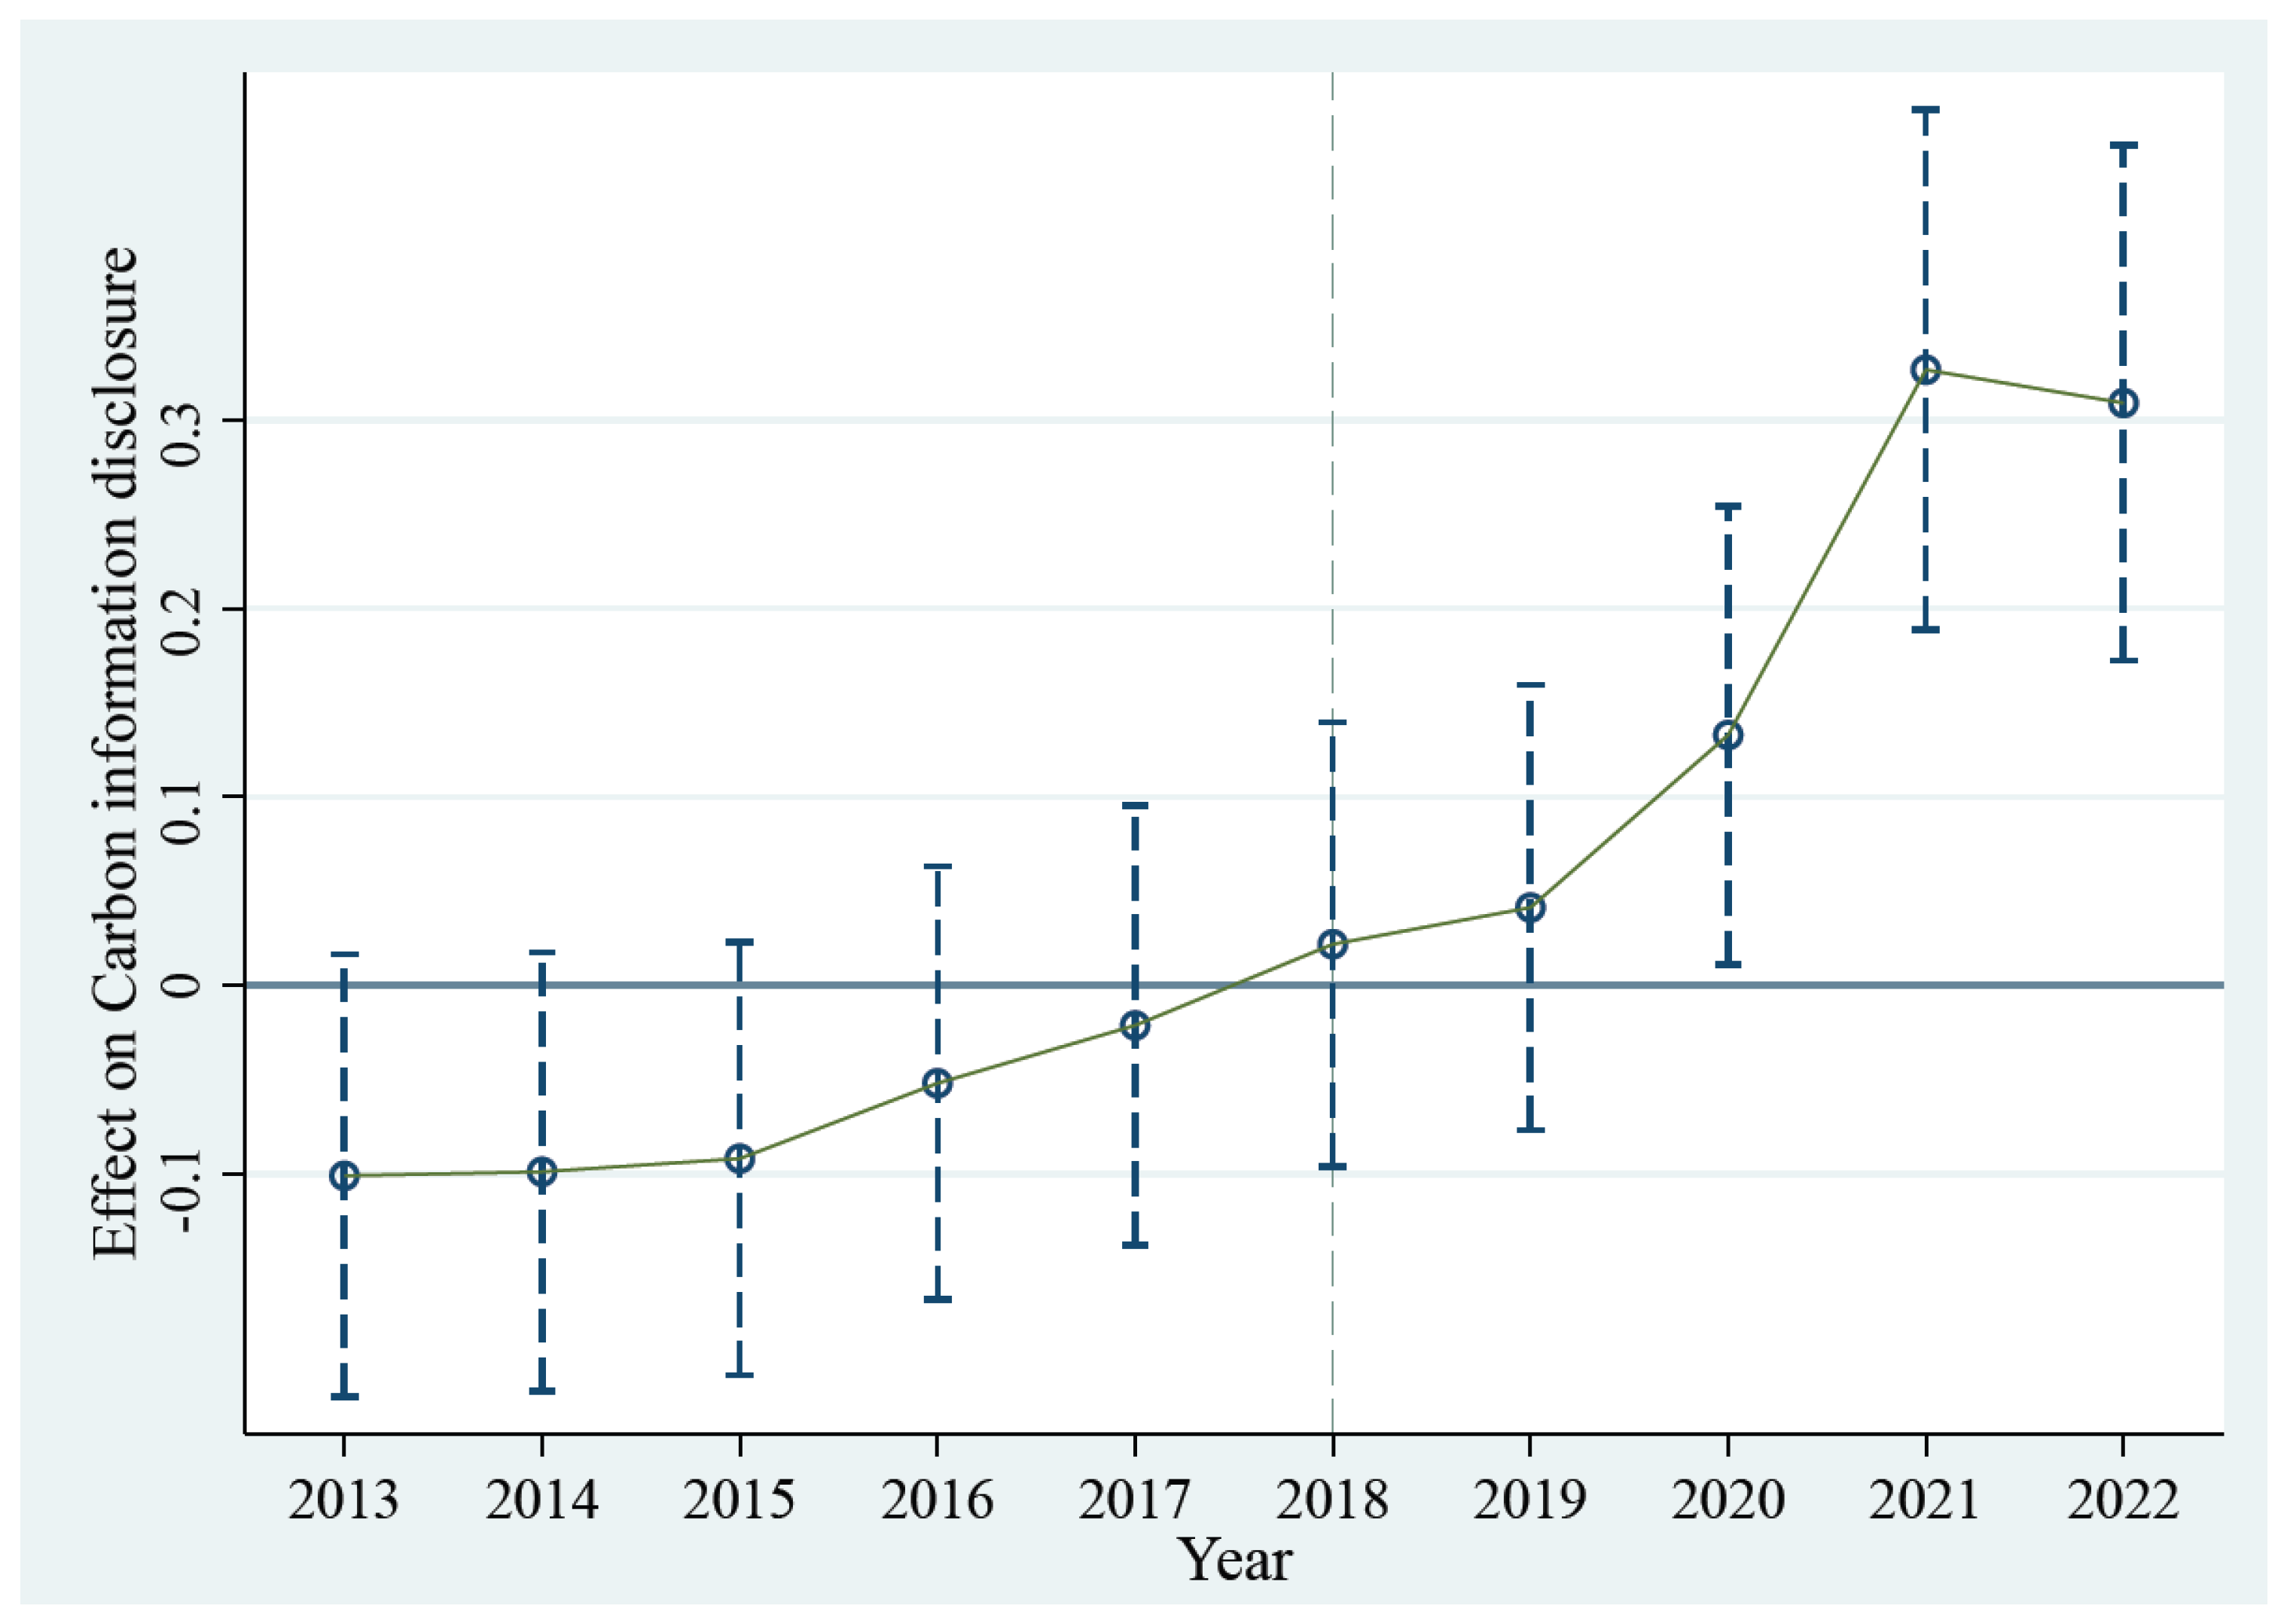
2.1. Causal Effects of Carbon Information Disclosure: Evidence from an Environmental Policy Shock

Recent studies have increasingly investigated the economic importance of carbon information disclosure, particularly its link to firm value (Hardiyansah et al., 2021). Many of these studies document a positive relationship, indicating that firms more actively engaged in carbon information disclosure tend to command higher valuations in capital markets (H. Huang et al., 2025). This effect is often attributed to enhanced investor perceptions, improved regulatory readiness, and a stronger environmental orientation (Borghei, 2021). However, the majority of this literature adopts a correlational framework, in which disclosure is treated as a voluntary, strategic choice shaped by internal firm characteristics such as governance quality, financial resources, or stakeholder responsiveness.
While informative, this approach makes it difficult to determine whether carbon information disclosure itself drives higher firm value or whether firms with greater value are simply more inclined to disclose. This inability to distinguish causality from correlation is especially problematic in regulatory context, where disclosure behavior may shift in response to external environmental policy rather than internal sustainability planning. In such settings, analyzing observed disclosure levels without accounting for the policy environment risks conflating regulatory compliance with proactive signaling.
These challenges are especially relevant in emerging economies where environmental regulations are tightening but enforcement remains inconsistent across regions (Qian et al., 2021). Firms operating in such environments may respond to increasing policy pressures by expanding the volume of carbon information disclosures in their reports without necessarily enhancing their actual environmental performance (Pitrakkos & Maroun, 2020). The market’s interpretation of such behavior hinges on whether disclosure is viewed as a sustained adaptation to regulatory expectations or merely as symbolic compliance. Nevertheless, if carbon information disclosure is seen as a reflection of managerial attention to climate policy and risk, it may still influence investor expectations and, over time, firm valuation.
Thus, establishing a credible causal link between carbon information disclosure and firm value necessitates identifying exogenous variation in disclosure behavior, which is not driven by firm-specific strategic intent. This study addresses this issue by exploiting a quasi-natural experiment: the 2018 environment policy required carbon-intensive firms to conduct internal carbon accounting and verification, but it did not mandate public disclosure. Despite the lack of a legal disclosure requirement, many affected firms voluntarily increased the amount of carbon information included in their annual reports. This behavioral shift was largely in response to regulatory pressure and occurred independently of firm-specific strategy, offering a plausible source of exogenous variation.
This policy environment offers a unique setting to examine whether carbon information disclosure, when prompted by regulatory pressure rather than internal strategy, has a measurable and causal effect on firm value. Based on this, this study proposed the following hypothesis:
H1. 
Carbon information disclosure has a positive causal effect on firm value, identified through the exogenous variation induced by the 2018 environmental policy.

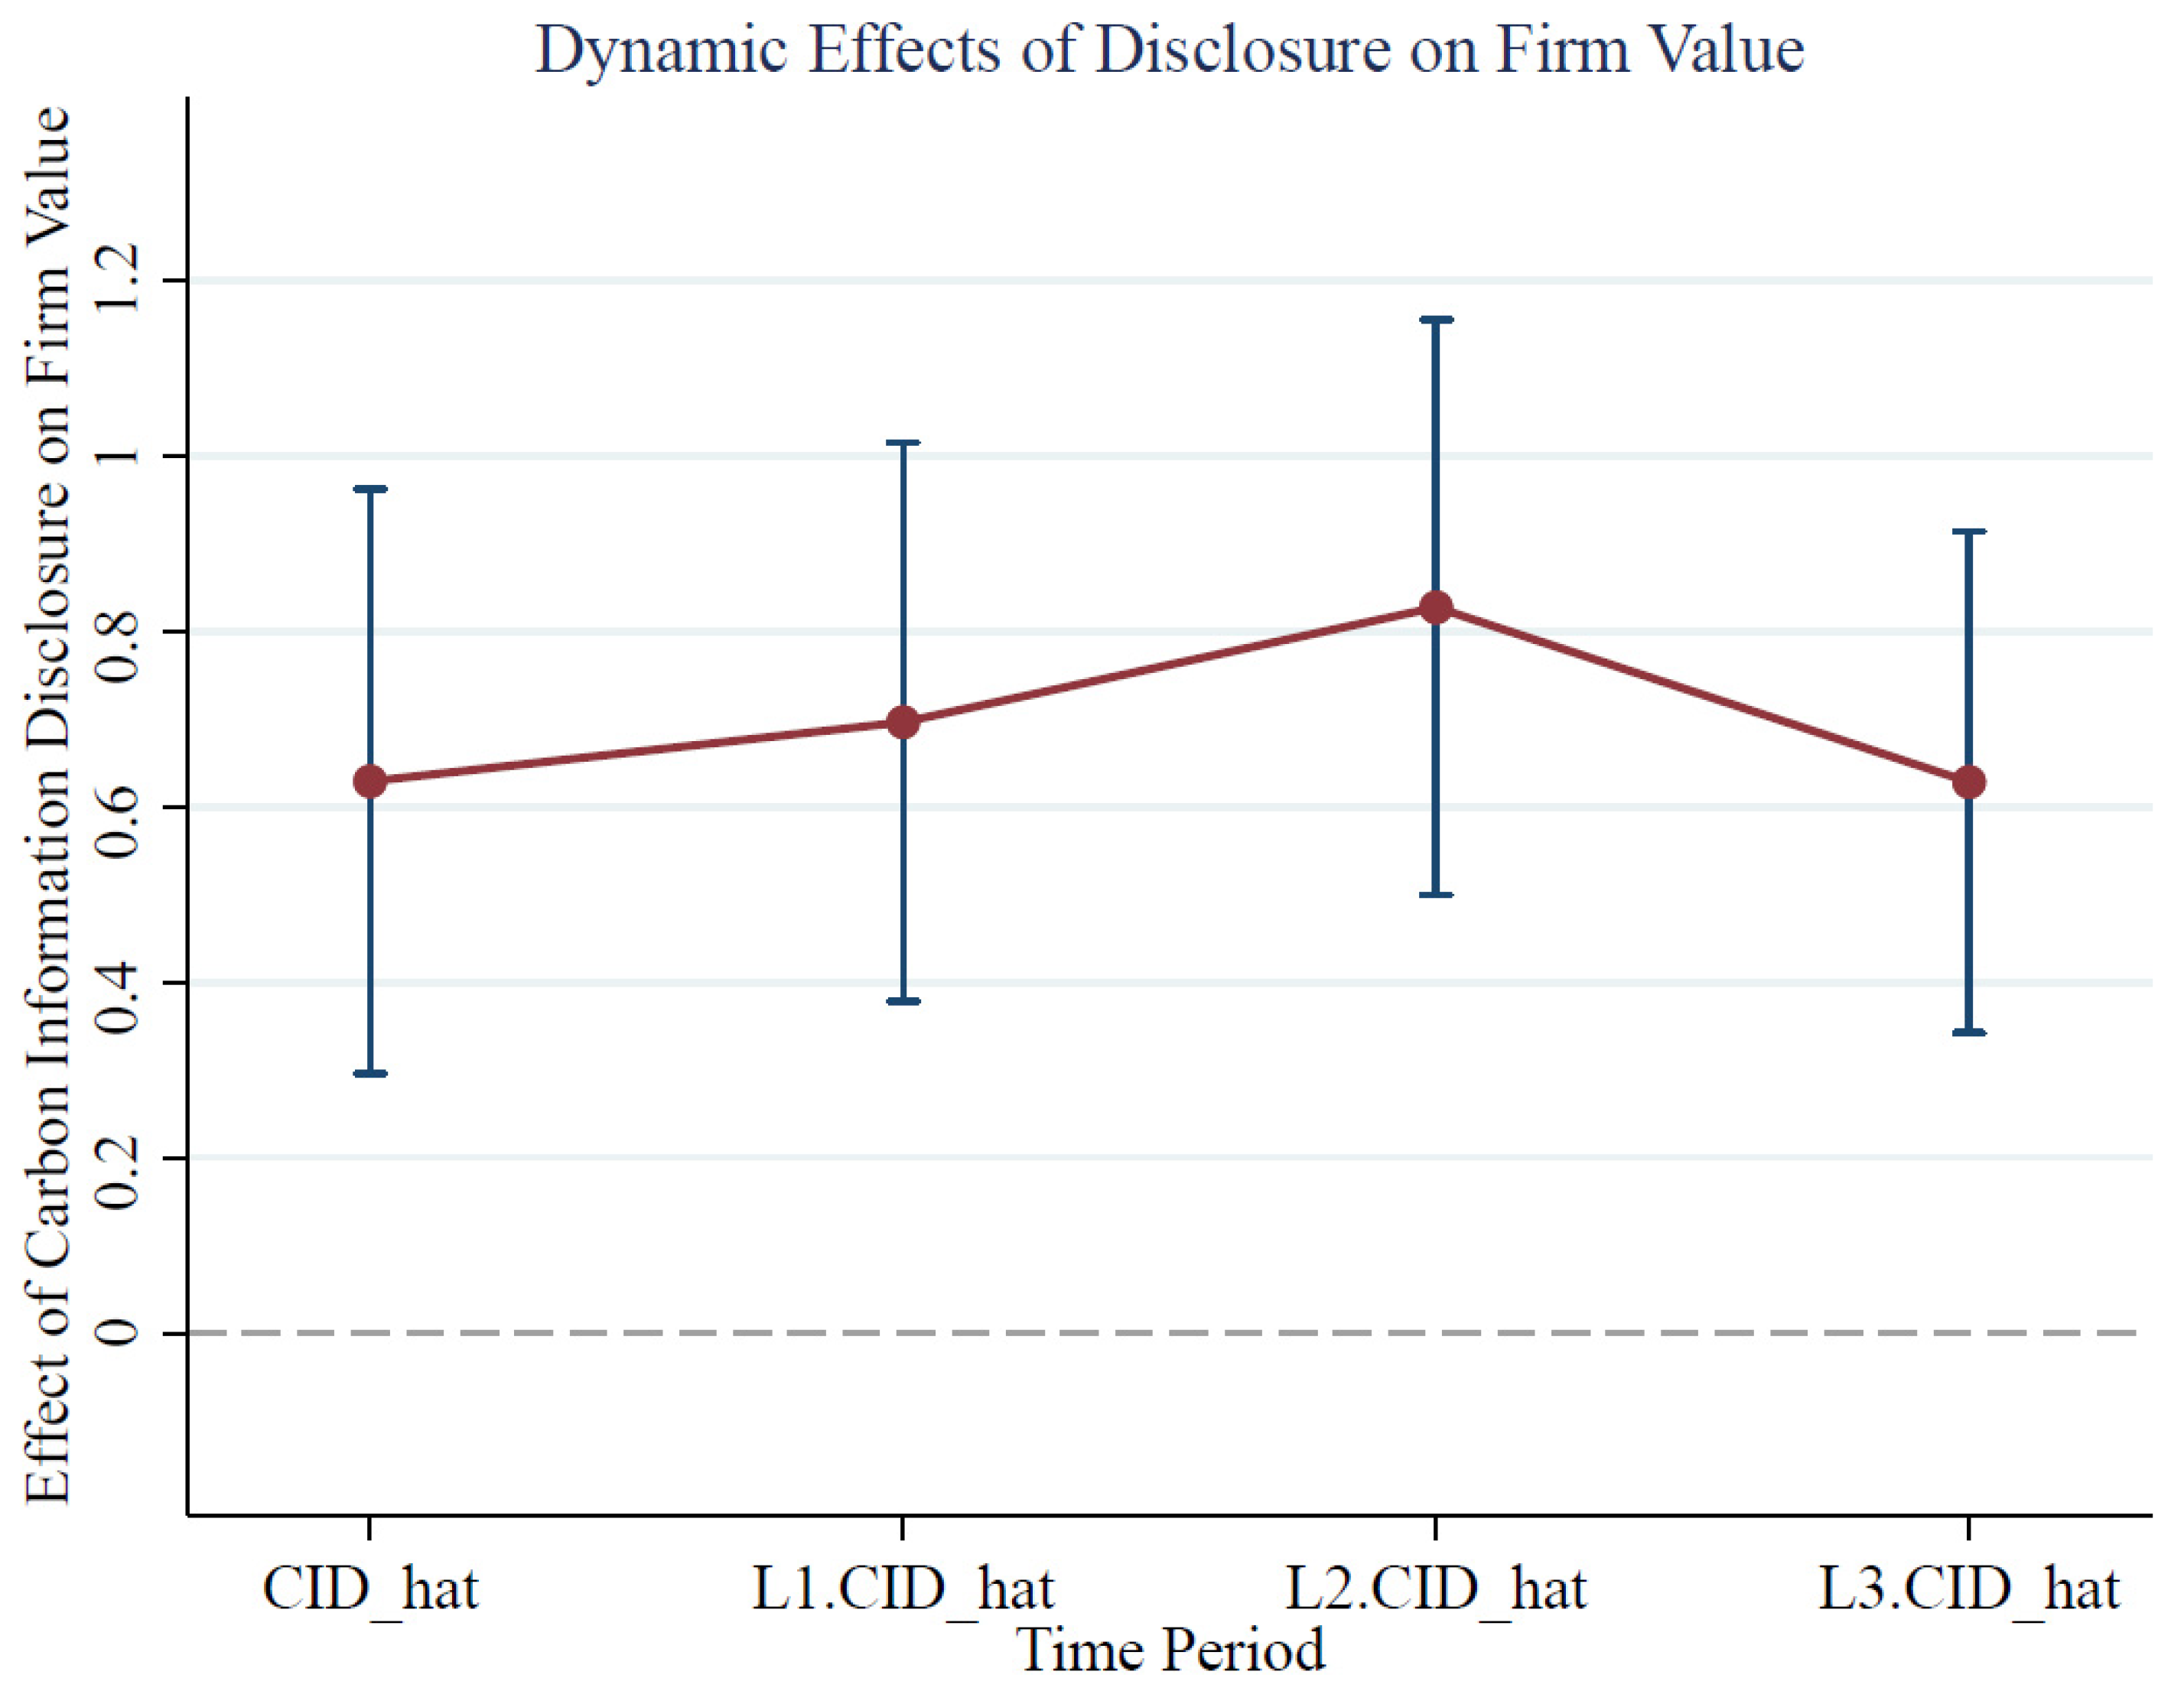
2.2. Dynamic Effects of Carbon Information Disclosure on Firm Value

An expanding body of research has investigated the relationship between carbon information disclosure and firm value, often identifying a positive association (Runyu et al., 2025). These studies suggest that firms that more actively disclose carbon information are viewed more favorably by investors, potentially due to perceived environmental responsibility, forward-looking strategy, or lower exposure to regulatory risks (Y.-J. Zhang & Liu, 2020). However, most of this literature relies on single-period analyses that assume that markets react immediately to disclosure activities. While such static approaches may be suitable in stable regulatory environments or under voluntary disclosure regimes, they provide limited insight into how carbon information disclosure affects firm value when prompted by sudden policy changes or evolving regulatory expectations.
When carbon information disclosure is triggered by environmental policy rather than initiated internally, its informational role may be interpreted differently (Radu et al., 2020). Investors may interpret policy-induced disclosures as reactive or symbolic, especially when they are not accompanied by substantive improvements in environmental investment or performance (Clementino & Perkins, 2021). In such cases, the market response may exhibit a temporal lag until it becomes clearer whether the disclosure reflects a genuine shift in firm behavior or is merely a procedural adaptation (Persakis et al., 2024). This suggests that the financial relevance of carbon information disclosure may not be immediate but rather develops gradually through repeated communication and behavioral reinforcement.
This temporal logic is consistent with signaling theory, which holds that the strength of a signal depends not only on its content but also on its consistency, frequency, and alignment with firm behavior (Connelly et al., 2025). Carbon information disclosure that is sustained across multiple reporting periods and supported by visible environmental engagement is more likely to shape investor expectations than one-time disclosures prompted by compliance concerns (Steuer & Tröger, 2022). Amid regulatory changes, investors may withhold judgment until firms demonstrate continued commitment to carbon information disclosure, before reflecting it in their valuation assessments (Grewal et al., 2022). Thus, the temporal structure of signal recognition is critical for understanding how policy-driven disclosures affect firm value.
Empirical evidence from the climate finance and ESG disclosure literature reinforces this dynamic perspective (M. Liu et al., 2024). Studies have shown that the capital market is more responsive to carbon information disclosure when it is maintained over time and integrated into broader environmental strategies (Diwan & Amarayil, 2024). Investors adjust their beliefs gradually, based on patterns of disclosure rather than isolated announcements. This is particularly relevant for carbon information disclosure, where the repetition and persistence of communication may serve as indirect evidence of regulatory adaptation, long-term environmental orientation, or improved governance (Y. Liu et al., 2024).
These dynamics are particularly pronounced in emerging economies like China, where environmental regulations are evolving and enforcement remains uneven (Lo et al., 2020). In these contexts, carbon information disclosures often arise in response to external policy signals rather than internal sustainability initiatives (Karplu et al., 2021). Accordingly, investors must evaluate disclosure behavior over multiple periods to determine whether it reflects substantive engagement or mere symbolic compliance (Y. Liu et al., 2023). As firms adapt their disclosure practices to regulatory developments, the market’s assessment of carbon information disclosures is shaped more by consistency than by immediacy.
From this perspective, carbon information disclosure should be conceptualized as a dynamic and cumulative signaling process, whose effect on firm value unfolds over time as markets interpret behavioral patterns and policy alignment. Analyses focusing solely on contemporaneous effects risk overlooking the gradual mechanisms through which disclosure gains credibility, relevance, and financial significance. Based on this, this study proposed the following hypothesis:
H2. 
The effect of carbon information disclosure on firm value is dynamic and materializes through lagged responses over subsequent periods.

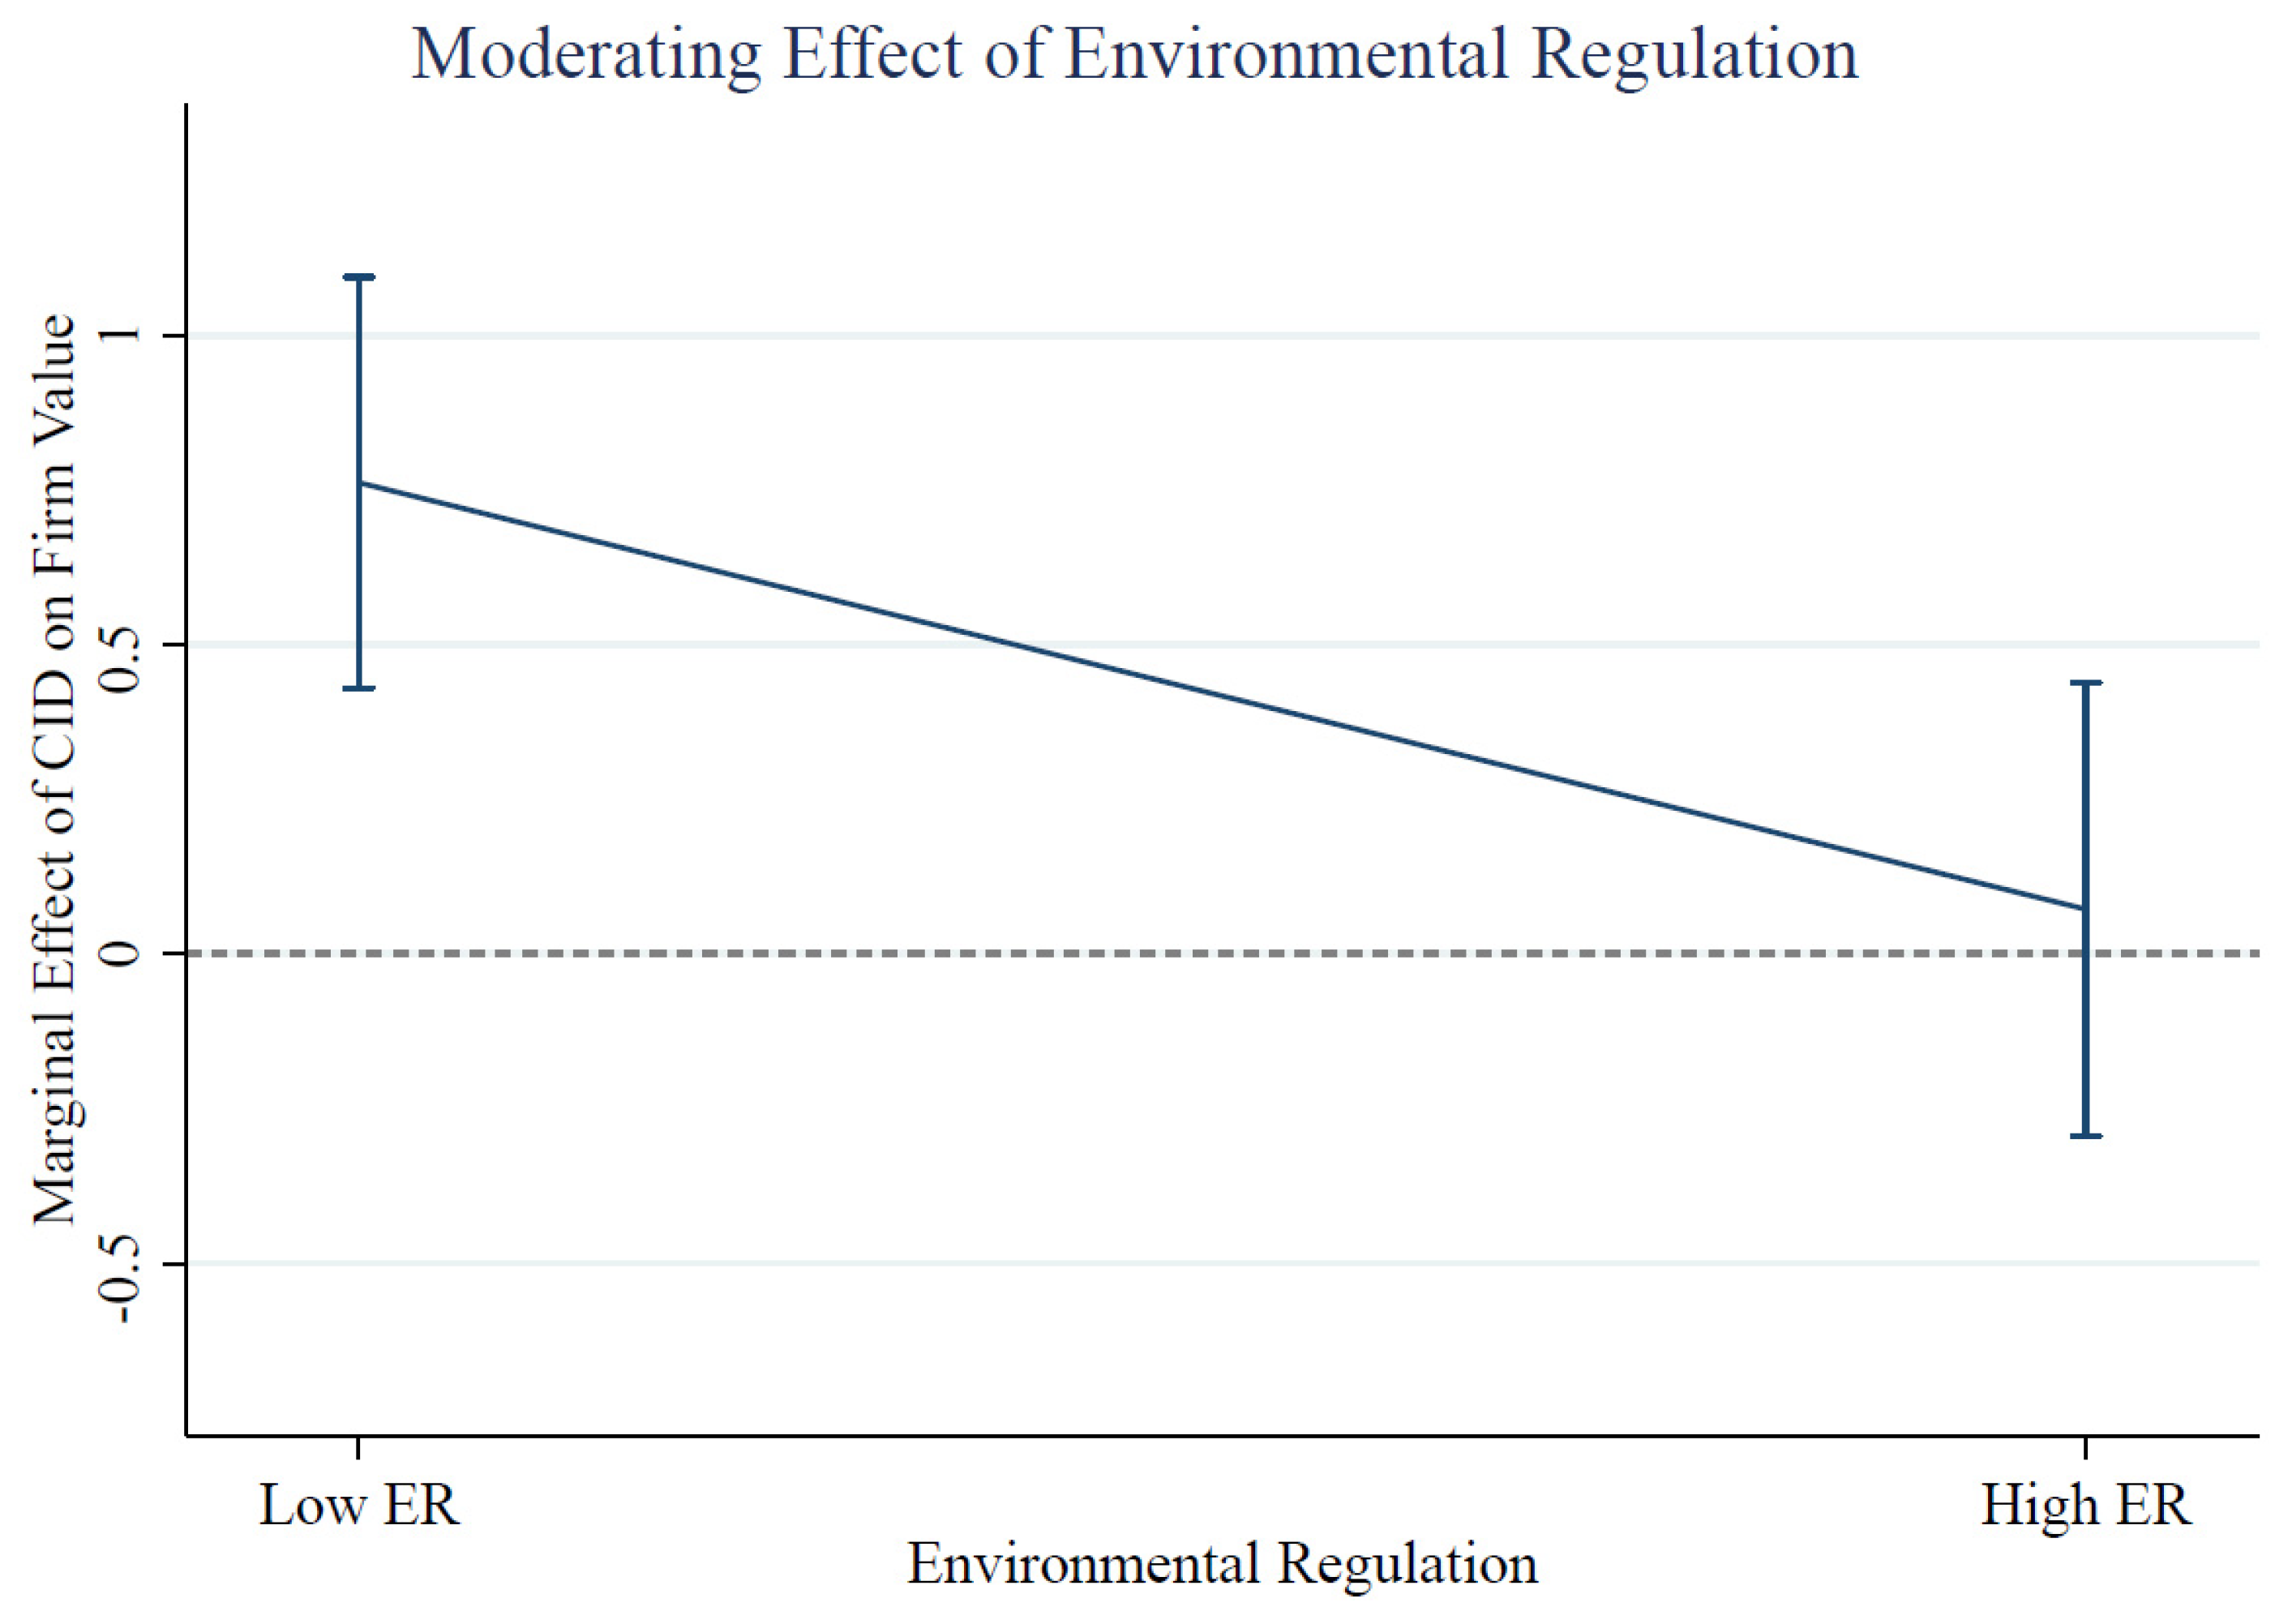
2.3. Moderating Effects of Environmental Regulation on the Relationship Between Carbon Information Disclosure and Firm Value

The financial impact of carbon information disclosure may vary across different regulatory environments (R. Liu et al., 2025). Beyond firm-specific behavior and temporal dynamics, regional variations in environmental regulatory pressure can significantly influence how investors perceive and value carbon information disclosures (Bu et al., 2022). When firms operate under different levels of enforcement, the same disclosure behavior may carry different meanings and signal strength in the eyes of the market.
In regions with strong environmental regulatory enforcement, firms are more likely to face external monitoring, administrative oversight, and reputational risks if they fail to align with policy expectations (Aragòn-Correa et al., 2020). Under such pressure, carbon information disclosure may be seen as a compliance response rather than a discretionary or strategic signal (Mateo-Márquez et al., 2020). When disclosure appears routine or externally compelled, investors may discount its informational value, viewing it as a procedural adjustment rather than a credible signal of long-term environmental commitment (Ding et al., 2023).
Conversely, in regions with weaker regulatory enforcement, disclosures are less likely to stem from coercive pressures (Pan et al., 2022). Firms that voluntarily disclose carbon information under such conditions may be perceived as more proactive, forward-looking, and strategically aligned with emerging policy trends. Since disclosure is less expected in low-regulation regions, it may send stronger signals regarding managerial attentiveness to climate risks and anticipation of future regulatory tightening. This contrast implies that environmental regulatory intensity can moderate the signaling effect of carbon information disclosure (Luo et al., 2022).
This argument is consistent with signaling theory, which emphasizes that the credibility and valuation impact of any signal depend on the perceived motivation and cost behind it. In low-pressure regulatory contexts, disclosure may be interpreted as costly and thus more informative (J. Zhang & Yang, 2023). In contrast, in high-regulation environments, disclosure may be expected and thus perceived as less informative. The perceived intent behind carbon information disclosure is closely related to the strength of regulatory enforcement in the firm’s operating environment (Pan et al., 2022).
Empirical studies in related fields have demonstrated that the valuation effects of ESG and environmental disclosures vary according to policy enforcement conditions (Krueger et al., 2024). For example, firms in strongly regulated regions are more likely to disclose as part of compliance routines, whereas those in less regulated areas disclose more selectively, thereby enhancing the signal’s salience. These findings support the idea that the capital market does not evaluate carbon information disclosure uniformly but interprets it in relation to the strength of the surrounding regulatory pressure.
In the case of China, where environmental regulations are centralized in policy but decentralized in enforcement, such variation is especially relevant (R. Liu et al., 2025). Although national environmental policies have become increasingly stringent, enforcement intensity varies widely across provinces and municipalities. Some regions enforce strict monitoring and policy implementation, while others demonstrate weaker enforcement due to administrative limitations or differing local priorities. Firms operating in high-enforcement regions may disclose carbon information due to elevated regulatory expectations, whereas firms in low-enforcement regions may disclose only if internally motivated (Han, 2020). This variation allows for a meaningful examination of whether carbon information disclosure is more valued by the market when it occurs under conditions of lower external regulatory pressure.
Taken together, these considerations suggest that environmental regulatory pressure moderates how carbon information disclosure affects firm value, with the strength and credibility of the disclosure signal depending on the surrounding enforcement environment. Based on this, this study proposed the following hypothesis:
H3. 
The effect of carbon information disclosure on firm value is moderated by environmental regulatory pressure.

2.4. Summary and Research Gaps

Despite the growing academic interest in carbon information disclosure, the existing literature remains fragmented and exhibits several conceptual and methodological limitations. Many studies adopt a voluntary disclosure framework, which assumes that firms disclose information primarily based on internal strategic considerations or stakeholder demands. This approach fails to account for disclosure behaviors that are shaped by external regulatory pressure, particularly in policy-driven environments. Furthermore, the majority of existing research relies on correlational analyses and cross-sectional data, which limits the ability to establish causal relationships between disclosure and firm value. Most studies do not investigate how policy shocks influence disclosure incentives, nor do they examine how institutional conditions affect the credibility and market interpretation of disclosed information. In addition, current research offers limited evidence on how investors process disclosure over time, making it difficult to assess the dynamic effects of carbon reporting. These limitations reveal a need for more robust, causally identified, and context-sensitive approaches to understanding the financial consequences of carbon information disclosure.
Building on this critique, this section has reviewed the literature on carbon information disclosure, corporate valuation, and environmental regulatory contexts. While prior studies have provided valuable insights into the association between disclosure practices and firm outcomes, several critical gaps remain. First, most existing research relies on correlational designs (J. Zhang & Yang, 2023; Yang et al., 2025; Chen et al., 2025), limiting causal interpretations, especially in the context of policy-driven disclosure. Second, the dynamic evolution of disclosure effects over time has received limited attention, constraining the understanding of how markets gradually assimilate carbon information. Third, the moderating role of regional regulatory enforcement in shaping disclosure valuation has been underexplored. Recognizing these gaps provides the motivation for the present study, which seeks to establish causal links, examine dynamic valuation effects, and explore contextual heterogeneity in the Chinese capital market.

3. Methodology

Compared with most existing studies that examine the association between carbon information disclosure and firm value using correlational designs, this study adopts a causal identification strategy (J. Zhang & Yang, 2023; Yang et al., 2025; Chen et al., 2025). We leverage a quasi-natural experiment created by the 2018 policy reform in China, which mandated internal carbon accounting but did not require public disclosure. This setting enables us to isolate policy-induced variation in disclosure behavior that is not confounded by firm-level strategic intent.
To further strengthen causal inference, we combine a difference-in-differences (DID) framework with an instrumental variable (IV) strategy. Specifically, we use the interaction between the post-policy period and firms’ baseline emission exposure as an instrument to address endogeneity concerns, including reverse causality and omitted variables. This approach allows us to estimate the causal effect of carbon information disclosure on firm value in a setting where disclosure is partly exogenous to firms’ internal motivations.

3.1. Research Design

This design departs from previous work by not only leveraging policy variation for identification but also integrating time dynamics and institutional heterogeneity into the empirical framework. Based on this, the empirical setting centers on the 2018 regulatory reform issued by China’s Ministry of Ecology and Environment (MEE), formally titled the Notice on Strengthening the 2018 Annual Carbon Emission Report, Verification, and Emission Monitoring Plan Development Work (MEE, 2018). This policy required carbon-intensive firms to conduct internal carbon accounting and submit third-party verified emissions data to regulators, but it did not mandate public disclosure in financial or sustainability reports. As such, firms were subject to increased administrative pressure and regulatory oversight but retained discretion over external communication of carbon information. This regulatory architecture created a quasi-natural experiment that isolates policy-induced variation in disclosure behavior under semi-voluntary conditions. Treated firms are those in carbon-intensive industries subject to verification requirements, while untreated firms serve as a control group. This framework enables a difference-in-differences approach to estimate the causal impact of disclosure behavior on firm value.
To identify the causal impact of the policy on carbon information disclosure and its downstream effect on firm value, the study employs a difference-in-differences (DID) design. Firms operating in carbon-intensive industries are assigned to the treatment group, while those in non-carbon-intensive industries constitute the control group. The DID framework compares changes in disclosure behavior and firm value between treatment and control groups before and after the policy intervention. This setup relies on the assumption that, in the absence of the policy, the treatment and control groups would have followed parallel trends. To assess this assumption and to capture the evolution of policy effects over time, the analysis includes event-study specifications with interactions between treatment status and year indicators. This allows for visualization of annual changes in disclosure and firm value, thereby supporting the validity of the identification strategy.
Building on signaling theory, the second hypothesis addresses the temporal dimension of valuation effects. If carbon information disclosure reflects sustained regulatory adaptation, its impact on firm value is expected to unfold gradually. Investors may require time to evaluate the consistency and strategic intent of carbon information disclosure, particularly when it is not externally assured. To capture these delayed responses, the model incorporates lagged values of disclosure. This specification allows the analysis to test whether the financial market reacts to disclosure cumulatively across multiple periods rather than immediately, consistent with the idea that repeated signals are more credible and informative.
The third hypothesis focuses on the heterogeneity introduced by regional variation in regulatory enforcement. In China, environmental policies are nationally formulated but unevenly enforced at the local level. This variation creates different degrees of regulatory pressure for firms, depending on their geographic location. To account for this, the model includes interaction terms between the treatment indicator and region-specific measures of environmental regulatory intensity. This enables the analysis to test whether firms in regions with stronger enforcement experienced different valuation effects in response to carbon information disclosure compared to those in regions with weaker regulatory oversight.
To strengthen causal identification, this study applies a two-stage least squares (2SLS) estimation. The instrumental variable is constructed by having a treatment indicator for carbon-intensive industries interact with a post-policy period dummy. This instrument captures exogenous variation in carbon information disclosure driven by policy exposure. In the first stage, the instrument predicts disclosure behavior; in the second stage, the estimated disclosure levels are used to assess their impact on firm value. This approach helps address potential endogeneity arising from reverse causality or omitted variables.
All regression models include firm fixed effects to control for unobserved time-invariant heterogeneity and year fixed effects to absorb macroeconomic shocks. Standard errors are clustered at the firm level. Control variables include firm size, leverage, profitability, ownership structure, liquidity, innovation input, and governance characteristics, ensuring that firm fundamentals are adequately accounted for.
This empirical strategy provides an integrated framework for testing the three hypotheses. By combining exogenous policy variation, industry-based treatment assignment, temporal lag structures, and cross-regional regulatory heterogeneity, the design offers a robust approach to identifying the causal effects of environmental regulation on carbon information disclosure and its financial implications. This comprehensive design not only enhances causal identification but also aligns with signaling theory by capturing both the persistence and perceived credibility of carbon information disclosure under varying institutional conditions.

3.2. Sample Selection and Variable Measurement

This study ensures the reliability and representativeness of our sample by selecting A-share listed companies on the Shanghai and Shenzhen Stock Exchanges from 2013 to 2022. The sample was drawn from multiple authoritative sources, including the CSMAR Database, the Intellectual Property Office of the People’s Republic of China (CNIPA), and the National Bureau of Statistics of China (NBS). Financial firms were excluded due to their distinct regulatory environment and financial structures, which differ substantially from other industries. Firms with ST (Special Treatment) status were also excluded to eliminate firms experiencing financial distress, as these firms may not represent typical business conditions and could distort the results. Additionally, firms with missing financial data were excluded to ensure the completeness and accuracy of the dataset.
After applying these criteria, the final sample included 1753 firms over a 10-year period (2013–2022), providing a comprehensive and representative view of China’s corporate landscape. This sample encompasses a diverse range of industries, allowing for generalizable findings on the relationship between carbon information disclosure and firm value.
This study uses a set of variables that capture firm-level financial outcomes, disclosure behavior, policy exposure, and governance environment. The main dependent variable is firm value (FV), measured by Tobin’s Q. It is calculated as the ratio of a firm’s market value to the book value of total assets, excluding intangible assets and goodwill (Kadim et al., 2020). This indicator reflects the firm’s market performance and is widely used in studies examining the financial implications of corporate disclosure.
The core explanatory variable is the policy shock (DID), which reflects the interaction between treatment status and policy timing. A firm is considered treated if it belongs to a carbon-intensive industry that falls under the scope of the 2018 verification guidelines. The post-policy period begins in 2018, the year the policy was implemented. The DID variable equals one for treated firms in post-policy years and zero otherwise. This construction allows the analysis to capture differential changes in disclosure and valuation attributable to the policy (MEE, 2018).
The key mediating variable is carbon information disclosure (CID). It is designed to reflect the extent to which firms publicly disclose carbon information in their annual reports (R. Liu et al., 2025). The variable is constructed by applying a text-mining approach using Python 3.10. Specific carbon-related keywords are identified, and their frequencies are counted for each firm-year observation. To ensure consistency across firms of different sizes and reporting styles, the raw count is adjusted by adding one and then transformed using a natural logarithm. This transformation helps reduce the influence of outliers and produces a smoother distribution for regression analysis. In addition, the resulting value is multiplied by ten to enhance the interpretability of regression coefficients. The CID variable reflects the firm’s level of attention to carbon issues in its public disclosures and serves as a proxy for disclosure intensity.
To examine institutional variation in the impact of disclosure, the study includes a moderating variable for environmental regulation (ER). This variable captures the strength of local regulatory enforcement. It is measured as the ratio of investment in pollution control (including wastewater treatment and air pollution management) to regional industrial output (Lyu et al., 2020). This ratio reflects not only environmental spending priorities but also local governments’ capacity and commitment to enforcing environmental regulations, which serve as a proxy for regional regulatory intensity. This ratio reflects the degree of environmental governance commitment at the local level and is used to test whether the financial effects of disclosure differ across institutional environments.
Several control variables are introduced to account for firm-specific characteristics that may influence disclosure behavior and firm value (R. Liu et al., 2025). Firm size is measured as the natural logarithm of total assets. Leverage is calculated as the ratio of total liabilities to total assets. Liquidity is measured by the current ratio, defined as current assets divided by current liabilities. Growth reflects the annual growth rate of net profit. Loss is a binary variable equal to one if the firm reports a negative net profit each year and zero otherwise.
Corporate governance characteristics are also included. Board size is measured as the logarithm of the total number of board members. Board independence reflects the proportion of independent directors on the board. Institutional ownership is captured by the ratio of institutional shares to total shares outstanding. Two additional variables capture aspects of external monitoring. The big four audit is an indicator variable equal to one if the firm is audited by one of the four global accounting firms and zero otherwise. Audit opinion is equal to one if the firm receives an unqualified audit opinion and zero otherwise.
All continuous variables are winsorized at the 1st and 99th percentiles to reduce the influence of extreme values. The full list of variables, definitions, and summary statistics is presented in Table 1.

3.3. Identification Strategy and Model Specification

To evaluate how carbon information disclosure affects firm value under regulatory pressure, this study specifies a series of panel regression models corresponding to the three main hypotheses. All models include firm fixed effects and year fixed effects to control for unobserved heterogeneity and macroeconomic shocks. Standard errors are clustered at the firm level.
The first hypothesis tests whether firm value is influenced by disclosure behavior that is induced by environmental policy. To address endogeneity concerns and identify a causal effect, a two-stage least squares (2SLS) framework is used. In the first stage, carbon information disclosure is predicted using the interaction between policy exposure and the post-policy period as an instrument. In the second stage, the predicted disclosure values are used to estimate their effect on firm value. The specification is as follows:
First stage:
C I D i , t ^ = α + β 1 ( T r e a t i × P o s t t ) + γ C o n t r o l s i , t + F i r m + Y e a r + ε i , t
Second stage:
F V i , t = α + δ 1 C I D i , t ^ + γ C o n t r o l s i , t + F i r m + Y e a r + ε i , t
In this framework, carbon information disclosure is not treated as an autonomous managerial decision but as a behavioral response to external regulatory signals. The second-stage coefficient C I D i , t ^ captures the average effect of policy-induced disclosure on firm value.
To test whether the effect of disclosure strengthens and persists over time, as proposed in the second hypothesis, the analysis estimates a set of separate regressions using lagged values of the predicted disclosure variable. Specifically, three models are estimated where firm value is regressed on one-period, two-period, and three-period lags of policy-induced disclosure, respectively (k = 1, 2, 3). This approach avoids multicollinearity among lag terms and allows for a clear examination of the temporal pattern of valuation effects. The specifications take the following form:
F V i , t = α + δ k C I D i , t k ^ + γ C o n t r o l s i , t + F i r m + Y e a r + ε i , t
This design reflects the idea that market participants require time to evaluate the credibility and relevance of non-financial disclosures. By estimating lag-specific effects, the analysis tests whether the market response to carbon information disclosure is delayed and whether the effect intensifies as the signal is reinforced over time.
To examine institutional heterogeneity, the third hypothesis tests whether the impact of disclosure on firm value varies by environmental regulatory intensity at the regional level. The model includes an interaction between predicted disclosure and a continuous measure of environmental regulation. The specification is as follows:
F V i , t = α + δ 1 C I D i , t ^ + δ 2 ( C I D i , t ^ × E R i , t ) + γ C o n t r o l s i , t + F i r m + Y e a r + ε i , t
This interaction term captures whether the valuation effect of disclosure is amplified in jurisdictions with stronger environmental governance. Regions with high regulatory intensity are typically characterized by greater investment in pollution control, more frequent inspections, and stricter compliance enforcement. In contrast, regions with weaker oversight often exhibit symbolic enforcement or administrative leniency due to limited capacity or competing local interests. As a result, the same disclosure may carry different informational value across regions: in low-enforcement regions, it is more likely to be perceived as proactive and credible, while in high-enforcement regions, it may be seen as a routine response to compliance expectations. This specification allows us to test whether institutional context shapes the credibility of disclosure signals and the strength of their market impact.
Together, these models provide a comprehensive empirical framework for testing how regulatory policy influences disclosure behavior and how that behavior translates into financial performance. The design combines causal identification, temporal analysis, and institutional differentiation to capture the full range of dynamics surrounding carbon information disclosure.

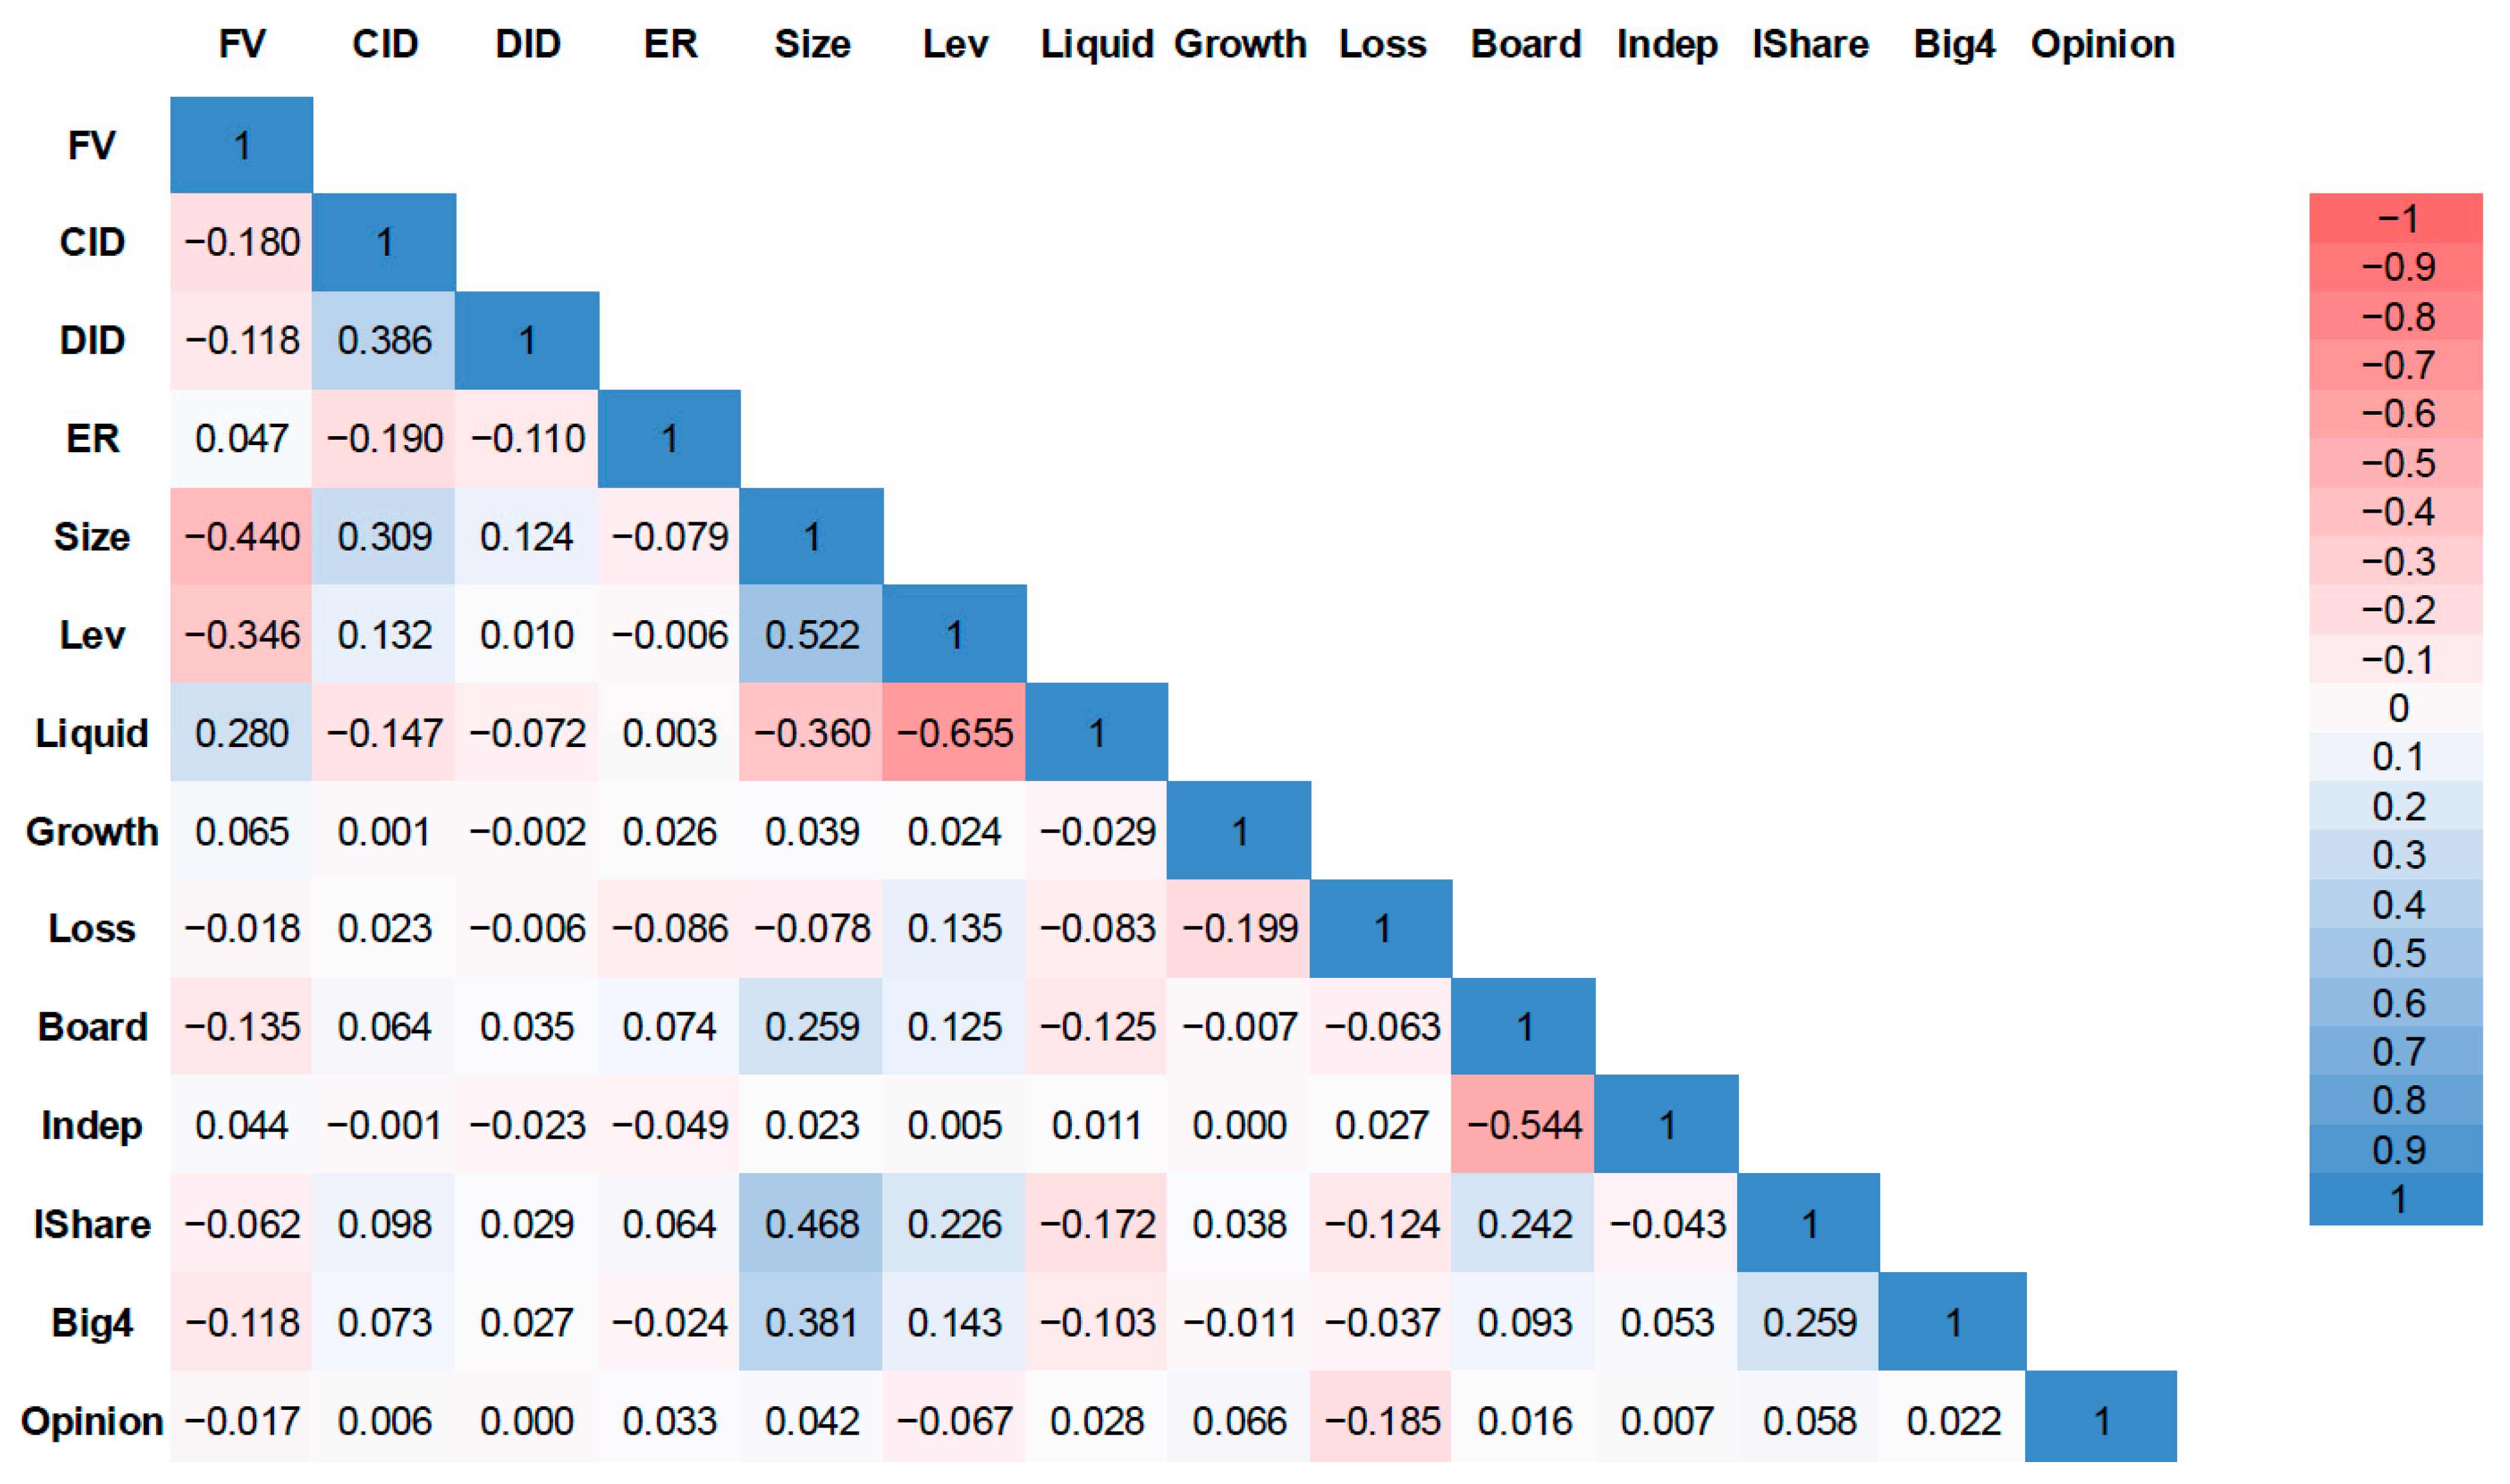
3.4. Descriptive Statistics and Correlation Analysis

The descriptive statistics of the main variables are presented in Table 2. The sample includes 1753 firm ten-year observations from 2013 to 2022. The dependent variable, firm value (FV), measured by Tobin’s Q, has a mean of 1.986 and a standard deviation of 1.226. The distribution is right-skewed, with a median value of 1.584 and a maximum of 7.491, indicating significant variation in market valuation across firms.
The key explanatory variable, carbon information disclosure (CID), is measured using a keyword frequency approach and scaled by a factor of ten. The mean value of CID is 0.23, with a standard deviation of 0.354. The median value is 0.115, while the 75th percentile is only 0.267, suggesting that most firms disclose limited carbon information and that only a minority exhibit high disclosure intensity. The minimum value is 0, reflecting non-disclosure by a substantial portion of firms.
The policy shock variable (DID) has a mean of 0.084, which is consistent with the expectation that only a subset of firms in carbon-intensive industries were directly affected by the 2018 policy. Environmental regulatory intensity (ER), measured at the regional level, shows considerable variation across observations, with a mean of 0.0017 and a range from 0.000057 to 0.0083. This variation allows for meaningful institutional heterogeneity analysis in later sections.
Among the control variables, firm size exhibits moderate dispersion (mean = 22.589, SD = 1.298), while leverage (Lev) and liquidity (Liquid) display wider variation. The net profit growth rate (Growth) ranges from −50.8% to 181.8%, indicating substantial heterogeneity in firm performance. About 10.6% of firm ten-year observations report a net loss, as captured by the binary Loss variable. The average proportion of independent directors is 37.699%, and the share of firms audited by a big four accounting firm is approximately 7.2%. Most firms receive an unqualified audit opinion, with a mean of 0.978 for the Opinion variable.
The overall statistics suggest that there is sufficient variation in both disclosure behavior and firm fundamentals to support causal identification. The relatively low mean and right-skewed distribution of CID further highlight the importance of exploring the determinants and consequences of policy-induced disclosure.
Figure 1 displays a correlation heatmap among the main variables. Most correlations fall within acceptable bounds, and no pairwise coefficient exceeds 0.7. CID shows a modest positive relationship with firm size and institutional shareholding and a weak negative correlation with firm value. This may reflect the tendency of larger firms or those with more external monitoring to engage in disclosure, even if such efforts are not immediately reflected in market valuation. The ER variable appears to be only weakly associated with both CID and FV, suggesting that its moderating role may not operate through direct associations.
To formally assess collinearity concerns (Table A1), variance inflation factors were calculated for all explanatory variables. The results confirm that VIF values are uniformly low, with the highest below 2.22, and the average is 1.43. These diagnostics provide strong support for the statistical validity of the regression models used in the subsequent analysis.

4. Empirical Results

4.1. Causal Effects of Policy-Induced Carbon Information Disclosure on Firm Value

To assess whether the 2018 environmental policy influenced firm value by affecting carbon information disclosure, this study adopts a two-stage least squares (2SLS) estimation approach. This method corresponds to Hypothesis 1, which proposes that the policy shock acted as an exogenous driver of disclosure behavior and that this disclosure subsequently affected capital market valuation. The 2SLS framework offers the advantage of addressing potential endogeneity issues, including reverse causality and omitted variable bias, especially the concern that firms with higher valuation may be more inclined to disclose carbon information.
Table 3 presents the empirical results. Columns (1) and (2) report the first-stage regressions, in which carbon information disclosure (CID) is regressed on the policy indicator (DID) and firm-level controls. The coefficient on DID is positive and highly significant, with an estimated value of approximately 0.2403. This suggests that firms in carbon-intensive industries significantly increased their carbon information disclosure efforts in response to the 2018 policy. This effect remains robust after controlling for size, leverage, liquidity, profitability, and governance variables. These findings indicate that the policy shock induced substantial exogenous variation in disclosure behavior, thereby supporting the validity of the DID variable as an instrument.
The strength of the instrument is confirmed by diagnostic tests. The first-stage F-statistic is 2621.81, far exceeding the conventional Stock–Yogo threshold of 16.38 for a single endogenous regressor, which rules out concerns of weak instruments. In addition, the Anderson–Rubin and Cragg–Donald tests support the relevance and identification of the instrument. Taken together, these findings validate the first stage of the causal chain: the 2018 policy exerted a significant and exogenous impact on carbon information disclosure.
Columns (3) and (4) present the second-stage regressions, where the fitted values of disclosure (CID_hat) are used to explain firm value (FV), measured by Tobin’s Q. In Column (3), which excludes controls, the coefficient on CID_hat is negative and statistically insignificant. However, after introducing firm-level and governance controls in Column (4), the coefficient becomes positive and significant at the 1% level. The estimated coefficient of 0.6290 implies that a one-unit increase in policy-induced carbon information disclosure corresponds to a 0.6290 increase in firm value, reflecting a substantial and economically meaningful effect.
The comparison between models with and without controls underscores the importance of accounting for firm-level heterogeneity. Without such controls, the effect of disclosure on valuation may be confounded or obscured. Once firm characteristics are incorporated, the valuation effect of carbon information disclosure becomes both statistically and economically significant. This pattern is consistent with the argument that investors value disclosure when it reflects a sustained and credible response to regulatory pressure.
These results support a signaling-based interpretation. The 2018 policy did not mandate public disclosure, but it increased internal reporting obligations and regulatory expectations. In response, many firms in carbon-intensive sectors voluntarily expanded the carbon information content in their annual reports. This behavior is neither fully voluntary nor purely symbolic, which may be interpreted by investors as a credible signal of long-term preparedness, environmental awareness, and alignment with anticipated regulatory trends.
Moreover, the findings contribute to a broader understanding of non-financial disclosure. While much of the existing literature focuses on voluntary disclosure and strategic signaling, this study shows that disclosure emerging from external regulatory pressure can also generate significant valuation effects. The market appears to consider not only the content of disclosure, but also its context and origin, especially when carbon information disclosure behavior reflects adaptation to credible policy shifts.
Overall, the results presented in Table 3 offer strong empirical support for Hypothesis 1. The environmental policy generated a significant increase in carbon information disclosure among firms in carbon-intensive industries, and this policy-induced disclosure had a positive causal effect on firm value. These findings underscore the broader market consequences of environmental regulation, even in the absence of mandatory disclosure requirements, and highlight the importance of policy design in shaping corporate communication and investor interpretation.
To assess the validity of the identification strategy underlying the DID framework, Figure 2 presents an event-study analysis that visualizes pre-treatment trends in carbon information disclosure for treated and control firms. The figure displays estimated yearly effects of the 2018 environmental policy on carbon information disclosure, based on a dynamic DID specification. The x-axis covers the period from 2013 to 2022, while the y-axis reports the estimated treatment effects along with 95% confidence intervals. Pre-treatment coefficients are statistically indistinguishable from zero, supporting the parallel trends assumption.
Figure 2 indicates that there were no statistically significant differences between treated and control groups prior to the policy implementation (2013–2017), thereby supporting the parallel trends assumption. Starting in 2018, the year of policy implementation, the estimated effects become positive and statistically significant, and they remain elevated in the following years. This pattern reinforces the interpretation that the observed increase in carbon information disclosure is a consequence of the 2018 policy intervention, rather than a result of prior trends or omitted variables.
The validity of this parallel trend supports the causal interpretation of the DID and 2SLS estimates reported in Table 3. These results confirm that the policy created a credible and exogenous source of variation in carbon information disclosure, providing a sound basis for identifying its causal impact on firm value.

4.2. Dynamic Valuation Effects of Policy-Induced Carbon Information Disclosure

To assess whether the effect of carbon information disclosure on firm value changes over time, this study estimates a series of dynamic regressions using lagged values of the predicted disclosure variable. The CID is constructed based on the frequency of carbon information keywords in annual reports, which reflects managerial attention to environmental issues and regulatory adaptation. Therefore, the market response to disclosure may develop gradually, as investors require time to observe consistent patterns before updating their valuation expectations.
Table 4 presents the regression results. In column (1), the coefficient on contemporaneous predicted disclosure (CID_hat) is 0.6290 and statistically significant at the 1% level. Column (2) replaces the contemporaneous term with the one-period lag (L1.CID_hat), producing a higher coefficient of 0.6964 significant at the 1% level. Column (3) includes the two-period lag (L2.CID_hat), with an even larger coefficient of 0.8273 significant at the 1% level. Column (4) shows that the three-period lag (L3.CID_hat) also remains positive and significant, with a coefficient of 0.6282. All models control for firm and year fixed effects, as well as relevant firm-level characteristics. This supports Hypothesis 2 and aligns with prior evidence that financial markets respond more favorably to consistent non-financial signals over time (Diwan & Amarayil, 2024).
The upward trajectory of coefficients suggests that capital markets interpret repeated carbon information disclosure as more credible, resulting in progressively stronger valuation responses. As firms continue to emphasize carbon issues in their annual reports, investors may gradually perceive this as an indicator of growing organizational attention to environmental risk and regulatory adaptation. The peak effect at the two-year lag implies that sustained disclosure across multiple reporting periods has a greater influence on firm valuation than sporadic or isolated disclosure. Even at the three-year lag, the effect remains statistically significant, reinforcing the long-term financial relevance of consistent disclosure behavior.
Adjusted R-squared values increase from 0.6748 in column (1) to 0.7274 in column (4), indicating improved explanatory power as temporal patterns are incorporated. This reinforces the idea that short-term models may understate the informational relevance of non-financial disclosure when it is policy-induced and evolving over time.
These findings align with a dynamic perspective on how markets interpret carbon information disclosures in the presence of regulatory pressure. In the Chinese context, where environmental policies are tightening but enforcement is regionally heterogeneous, investors may initially view increased carbon emphasis as tentative or compliance driven. However, when such disclosure emphasis is sustained, it may signal adaptive organizational behavior and greater alignment with evolving environmental expectations. Over time, this may reduce regulatory uncertainty and influence valuation.
In summary, the evidence supports Hypothesis 2 by showing that the effect of carbon information disclosure on firm value is dynamic and develops over time, as investors respond to sustained managerial emphasis on carbon information disclosure issues. These patterns underscore the long-term financial relevance of sustained environmental discourse and suggest that policy pressure can reshape capital market expectations through firm-level disclosure behavior.
Figure 3 further illustrates the dynamic valuation effects reported in Table 4 by visualizing the estimated coefficients and their 95% confidence intervals across current and lagged periods of carbon information disclosure. The x-axis represents the contemporaneous and lagged periods of predicted disclosure, while the y-axis shows the corresponding marginal effects on firm value.
The figure displays a clear temporal pattern. The estimated effect of disclosure in the current year is positive and statistically significant (β = 0.6290). This effect strengthens in the following two years, increasing to 0.6964 at a one-year lag and peaking at 0.8273 in the second year. Although the coefficient declines slightly to 0.6282 in the third year, it remains both statistically and economically significant.
This trajectory supports the notion that the capital market reacts to policy-driven carbon information disclosure with a delay. Investors may initially interpret increased disclosure cautiously, especially when it lacks external assurance. However, repeated and sustained disclosure over time appears to enhance recognition and credibility. The visual evidence reinforces the idea that the impact of disclosure accumulates over successive periods, consistent with Hypothesis 2.
Taken together, Figure 3 complements the regression results by providing an intuitive depiction of the delayed but strengthening market response to carbon information disclosure. The observed pattern underscores the importance of consistency, suggesting that markets reward persistent environmental communication more than isolated or symbolic efforts.
These findings are consistent with signaling theory, which emphasizes the importance of signal consistency and repetition in shaping market perceptions (Connelly et al., 2025). They also echo earlier studies that stress the long-term credibility of persistent ESG communication (Steuer & Tröger, 2022; Y. Liu et al., 2024) but go further by offering causal evidence using a quasi-experimental design.

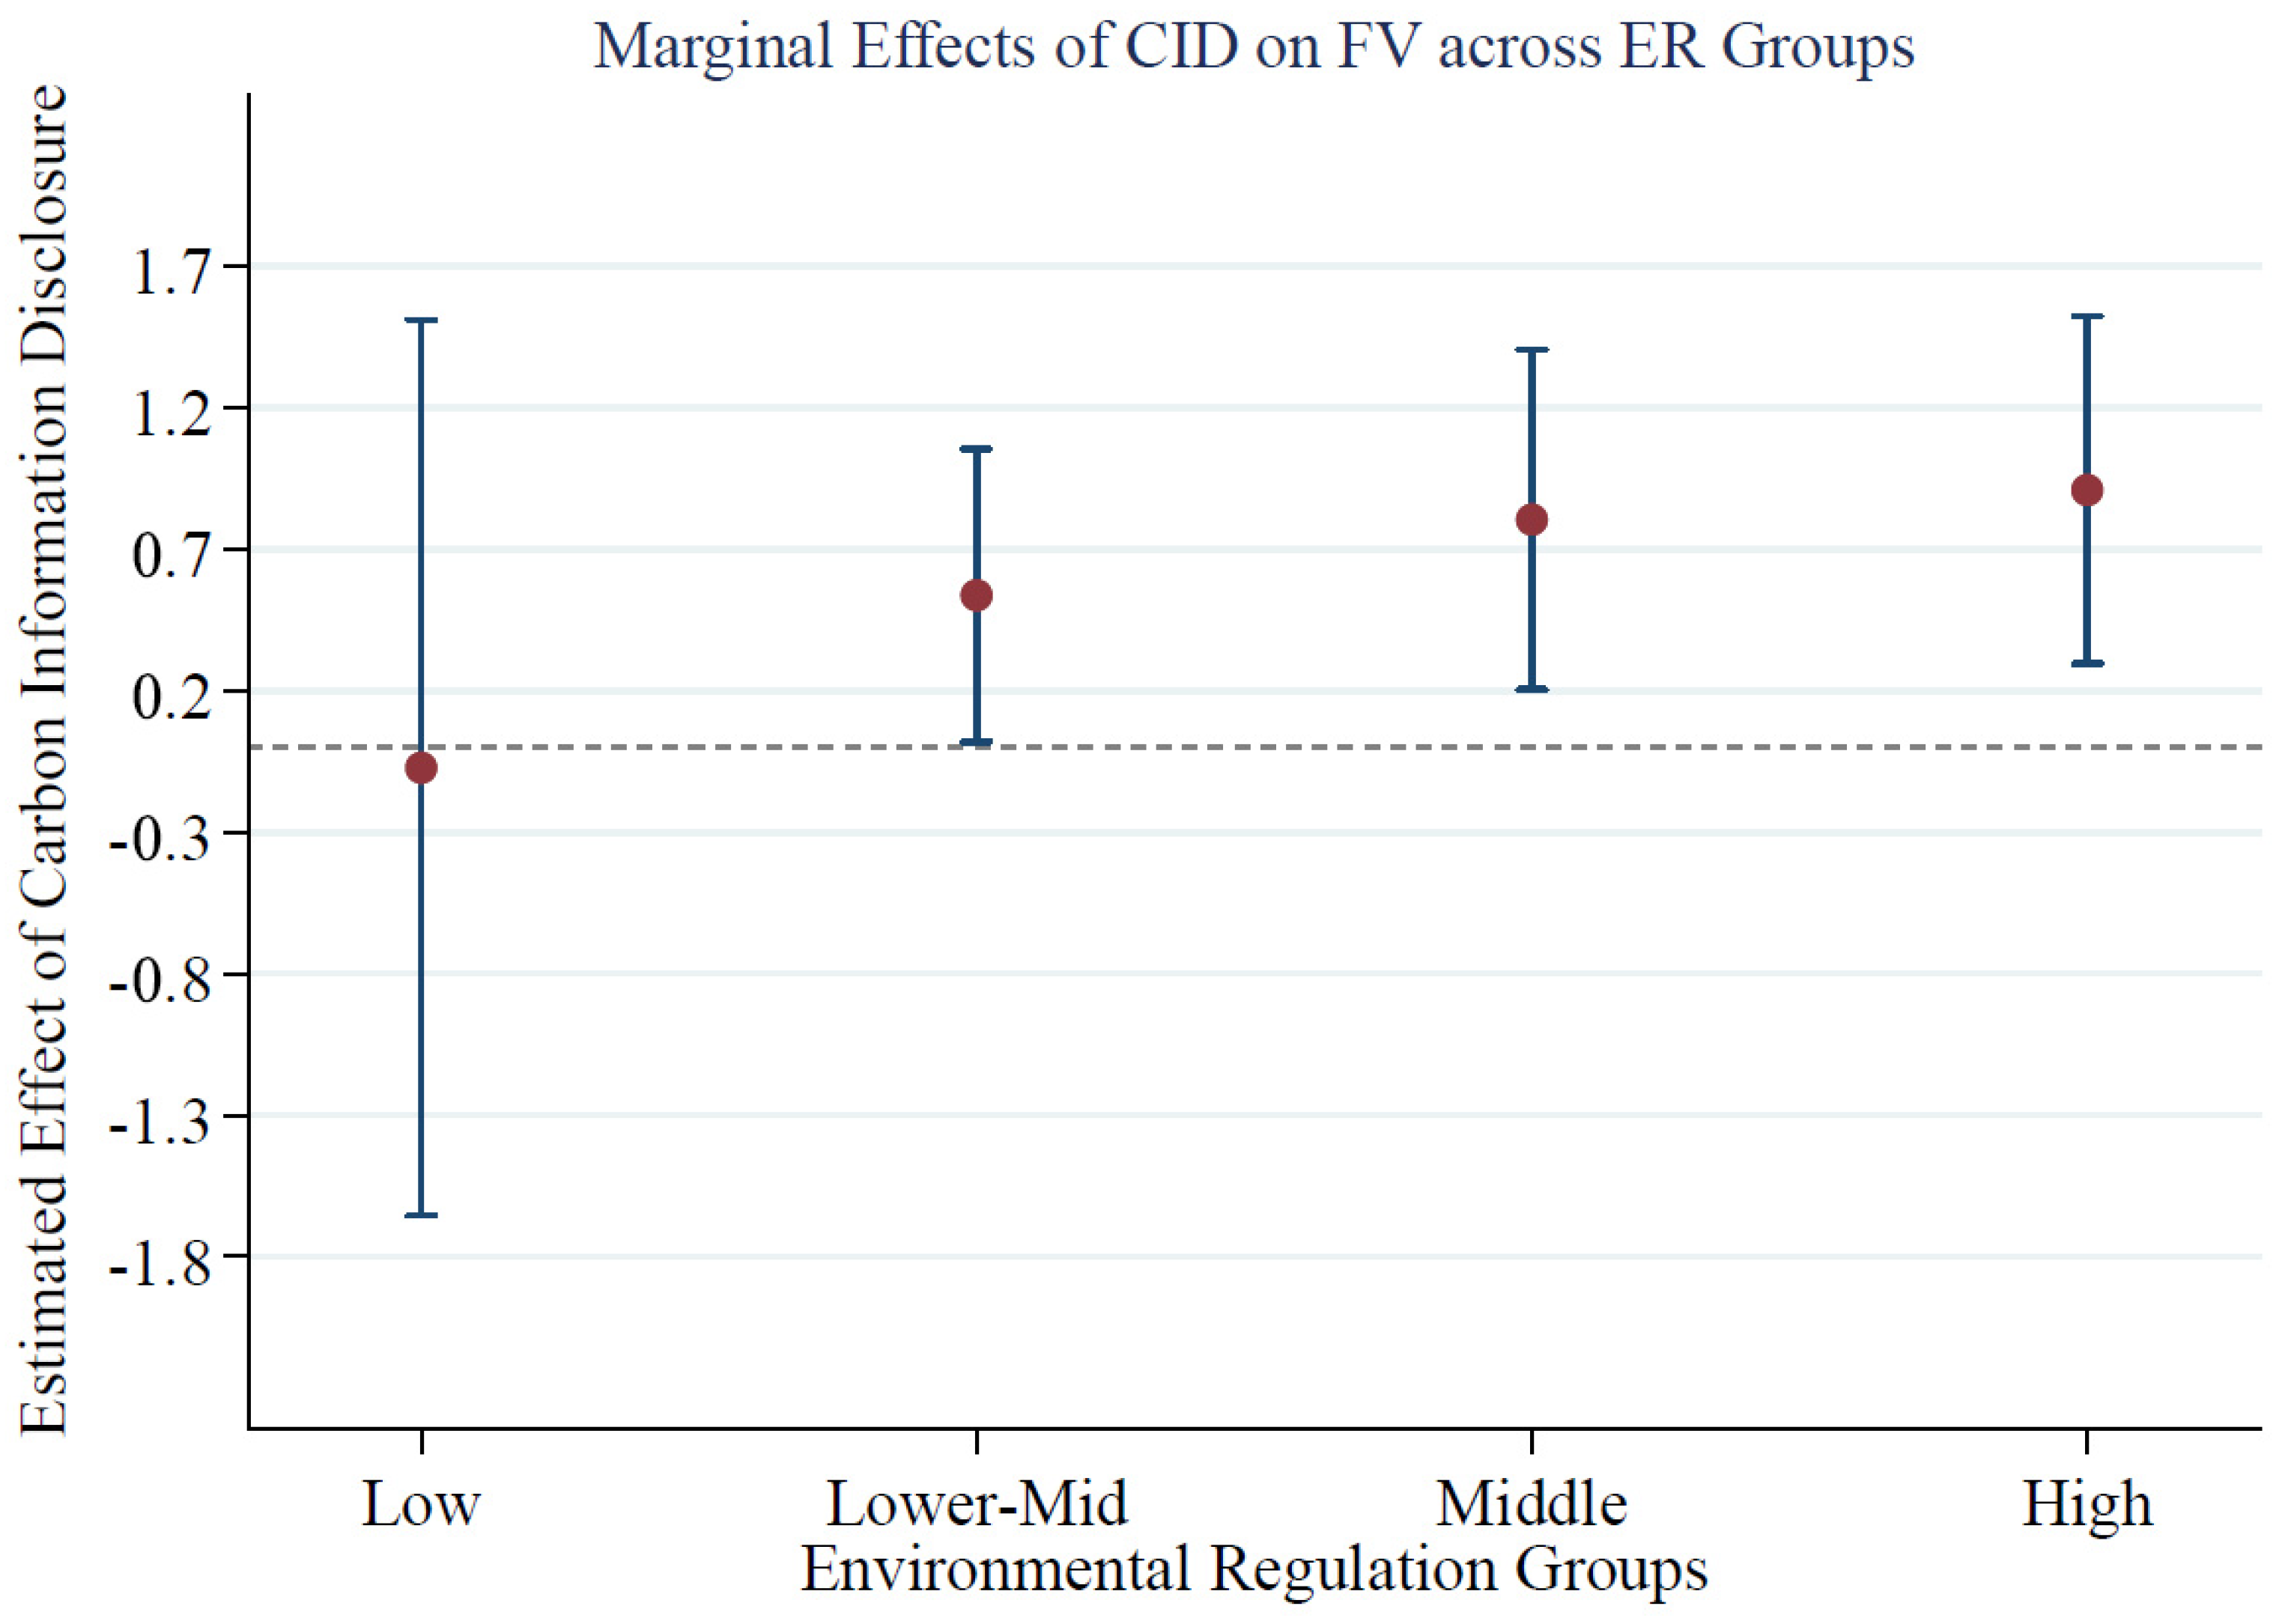
4.3. Moderating Role of Environmental Regulation

This section investigates whether the valuation impact of carbon information disclosure varies depending on the level of environmental regulatory pressure. Hypothesis 3 posits that environmental regulation moderates this relationship by shaping how investors perceive and interpret disclosure behavior. Table 5 presents the regression results using a stepwise modeling approach that sequentially incorporates controls, institutional variables, and interaction terms.
In Column (1), the model regresses firm value (FV) on the instrumental variable CID_hat only. The coefficient is negative and statistically insignificant (β = –0.0281), suggesting that without controlling for firm characteristics, the estimated effect of disclosure on value is imprecise. This baseline model does not incorporate firm-level heterogeneity or institutional differences, limiting its explanatory power.
In Column (2), control variables are added, including firm size, leverage, liquidity, growth, profitability status, board characteristics, audit quality, and institutional ownership. Once controls are included, the coefficient on CID_hat becomes positive and highly significant at the 1% level (β = 0.6290). This result indicates that carbon information disclosure, when induced by the 2018 policy shock, has a substantial and positive effect on firm value. The adjusted R2 improves to 0.6748, reflecting a better model fit.
Column (3) introduces the regulatory intensity variable (ER) to account for differences in environmental oversight across regions. The coefficient on ER is positive but statistically insignificant (β = −36.097), suggesting that regulatory intensity alone does not exert a direct influence on firm value. The coefficient on CID_hat remains stable and significant at the 1% level (β = 0.6249), indicating that the value effect of disclosure is robust to the inclusion of institutional factors.
In Column (4), the key interaction term between disclosure and regulatory pressure (CID_hat × ER) is added. The coefficient on CID_hat increases slightly (β = 0.7379) and significantly at the 1% level, while the interaction term is negative (β = −642.935) and significant at the 1% level. This result supports the presence of a negative moderating effect: as environmental regulation becomes more stringent, the marginal contribution of carbon information disclosure to firm value declines. The adjusted R2 increases slightly to 0.6767.
The negative interaction effect suggests that in regions with stringent regulatory enforcement, carbon information disclosure may be perceived as routine compliance rather than as a strategic or voluntary initiative. When disclosure becomes a common requirement under uniform regulatory expectations, its informational value diminishes, reducing its effectiveness in signaling firm-specific environmental commitment. By contrast, in regions with lower regulatory pressure, voluntary or policy-driven disclosure is more likely to be interpreted as proactive and credible, thereby enhancing its relevance for valuation.
In summary, the results in Table 5 provide empirical support for Hypothesis 3. Although carbon information disclosure generally increases firm value, this effect is conditional on the surrounding regulatory environment.
To further illustrate the moderating role of environmental regulation identified in Table 5, Figure 4 presents the marginal effects of carbon information disclosure on firm value under two distinct levels of regulatory pressure: low environmental regulation (measured at the 25th percentile) and high environmental regulation (measured at the 75th percentile). Environmental regulation is measured by the intensity of government-led pollution control, proxied by the ratio of investment in industrial wastewater and air pollution treatment to regional industrial value added. This metric reflects regional differences in enforcement intensity, administrative oversight, and environmental governance capabilities.
Figure 4 reveals a distinct downward trend in the marginal effect of disclosure as regulatory stringency increases. In low-regulation regions, the marginal effect of carbon information disclosure on firm value is strongly positive and statistically significant, indicating that such disclosure may be interpreted by investors as a credible and strategic signal. In contrast, in high-regulation regions, the estimated effect declines substantially and is no longer statistically distinguishable from zero. This suggests that under stronger environmental regulation, carbon information disclosure is more likely perceived as a compliance response rather than a voluntary, strategic communication, thereby weakening its incremental informational value in the eyes of investors.
This declining marginal effect aligns with the significantly negative interaction term reported in Table 5. Together, the regression and graphical results support the interpretation that regulatory intensity moderates the signaling function of carbon information disclosure. Under weak regulatory enforcement, disclosure may reflect managerial foresight or voluntary engagement with climate risk, thus providing valuable information to the capital market. However, when regulation becomes more stringent, disclosure may become routine or mandated in practice, reducing its salience and interpretive power for investors.
Overall, Figure 4 visually confirms the negative moderating effect predicted in Hypothesis 3. It underscores that the valuation impact of carbon information disclosure is not uniform across regulatory settings but is shaped by the broader environmental policy environment in which firms operate. These findings highlight the need to contextualize disclosure practices and emphasize the crucial role of regulatory credibility and enforcement intensity in shaping how investors interpret environmental information.
To further explore how environmental regulatory intensity moderates the disclosure–valuation relationship, Table 6 reports 2SLS regressions stratified by regulatory intensity quartiles. This subgroup analysis allows for the detection of potential nonlinearities and structural differences across institutional environments, which may not be fully reflected in interaction models. Firms are categorized into low, lower-middle, middle, and high ER groups based on the quartile distribution of regional environmental regulation intensity.
In the low ER group (Columns 1–2), corresponding to the bottom 25% of regulatory intensity, the coefficient on carbon information disclosure (CID_hat) is negative and statistically insignificant (β = −0.0728). This result implies that, in weak regulatory settings, carbon information disclosure lacks financial relevance, possibly due to limited investor trust in the credibility of signals issued under low enforcement pressure.
In the lower-middle ER group (Columns 3–4), the coefficient on CID_hat turns significantly positive (β = 0.5366) at the 5% significance level. This shift indicates that even modest increases in regulatory pressure can enhance the capital market’s recognition of carbon information disclosure. As environmental expectations begin to take hold, carbon information disclosure may be interpreted as a strategic adaptation to emerging institutional norms.
In the middle ER group (Columns 5–6), the estimated coefficient further increases (β = 0.8040) significantly at the 1% level. This suggests that as firms operate in stronger regulatory environments, carbon information disclosure becomes more aligned with policy expectations and is thus perceived as more credible and financially meaningful.
In the high ER group (Columns 7–8), which includes firms exposed to the top 25% of environmental regulation, carbon information disclosure has the strongest effect on firm value (β = 0.9086), which is significant at the 1% level. These results imply that in highly regulated settings, carbon information disclosure is particularly effective in conveying long-term risk management, policy readiness, and environmental governance, attributes that investors reward with higher firm valuation.
This clear monotonic increase in the magnitude of disclosure coefficients across regulatory quartiles reveals a structural pattern: carbon information disclosure becomes more valuable as the regulatory environment strengthens. At the same time, this pattern appears to contradict the negative interaction effect reported in Table 5.
However, this seeming inconsistency arises from the different analytical perspectives of the two approaches. The interaction model in Table 5 captures the marginal effect of regulatory intensity on the carbon information disclosure–value relationship across the full sample. It shows that as regulation increases, the additional effect of carbon information disclosure becomes smaller, potentially because such disclosure becomes standardized and less informative at the margin.
By contrast, the grouped estimation in Table 6 reveals a structural credibility effect: in stronger regulatory environments, baseline valuation effects from carbon information disclosure are higher. Investors are more likely to interpret such disclosure as credible and policy-aligned when it occurs in regions with stringent enforcement. Thus, even though the marginal impact declines, the overall effectiveness increases.
Taken together, these findings provide strong support for Hypothesis 3. They demonstrate that environmental regulatory pressure exerts a dual effect, dampening marginal disclosure signals while simultaneously enhancing baseline valuation credibility. Recognizing this duality is crucial for understanding how environmental policy frameworks shape the financial consequences of carbon information disclosure across diverse institutional settings.
Figure 5 offers a graphical summary of the estimated marginal effects of carbon information disclosure on firm value across the four regulatory intensity groups defined in Table 6. The vertical axis plots the estimated 2SLS coefficients for each group, and the vertical lines denote 95% confidence intervals. This figure complements the grouped regression results and provides a more intuitive depiction of how regulatory environments shape the valuation relevance of carbon information disclosure.
Figure 5 reveals a clear upward trend in the estimated effect of carbon information disclosure on firm value as regulatory pressure increases. In the low ER group, the point estimate is close to zero and statistically insignificant, indicating that in weakly regulated regions, carbon-related reporting is not perceived by the market as financially meaningful. In contrast, the lower-mid ER group already shows a significant positive effect (β = 0.5366), which increases to approximately 0.8040 in the middle ER group and peaks at 0.9086 in the high ER group. These estimates reflect progressively stronger valuation effects as firms operate under more stringent regulatory scrutiny.
Although these results visually reaffirm the regression estimates from Table 6, Figure 5 offers additional insight by revealing potential nonlinearities. In particular, the effect of disclosure appears to strengthen substantially only after regulatory intensity surpasses the median level, suggesting a threshold mechanism. This implies that the financial value of carbon information disclosure may not increase linearly with regulation but rather becomes economically salient only once firms operate under sufficiently strong institutional enforcement.
Moreover, the confidence intervals widen at both ends of the regulatory spectrum. This likely reflects sample variability and heterogeneity in firm responses within the low and high ER groups. Nevertheless, the central trend remains robust and reinforces the view that carbon information disclosure is more likely to be valued by investors in contexts characterized by stronger environmental oversight and policy alignment.
Together with Table 6, Figure 5 highlights the institutional dependence of the carbon information disclosure–value relationship. The results suggest that while disclosure alone may not suffice to influence valuation, its effectiveness is significantly enhanced when embedded within a credible and demanding regulatory environment. This pattern provides further empirical support for Hypothesis 3 and underscores the importance of contextualizing disclosure practices within broader policy and enforcement regimes.
These results confirm Hypothesis 3 and support the theoretical expectation that under strong regulatory oversight, disclosure is less likely to be interpreted as a voluntary or strategic signal. Rather, it may be seen as mandated compliance, thereby reducing its incremental information content for investors (M. Zhang et al., 2023)

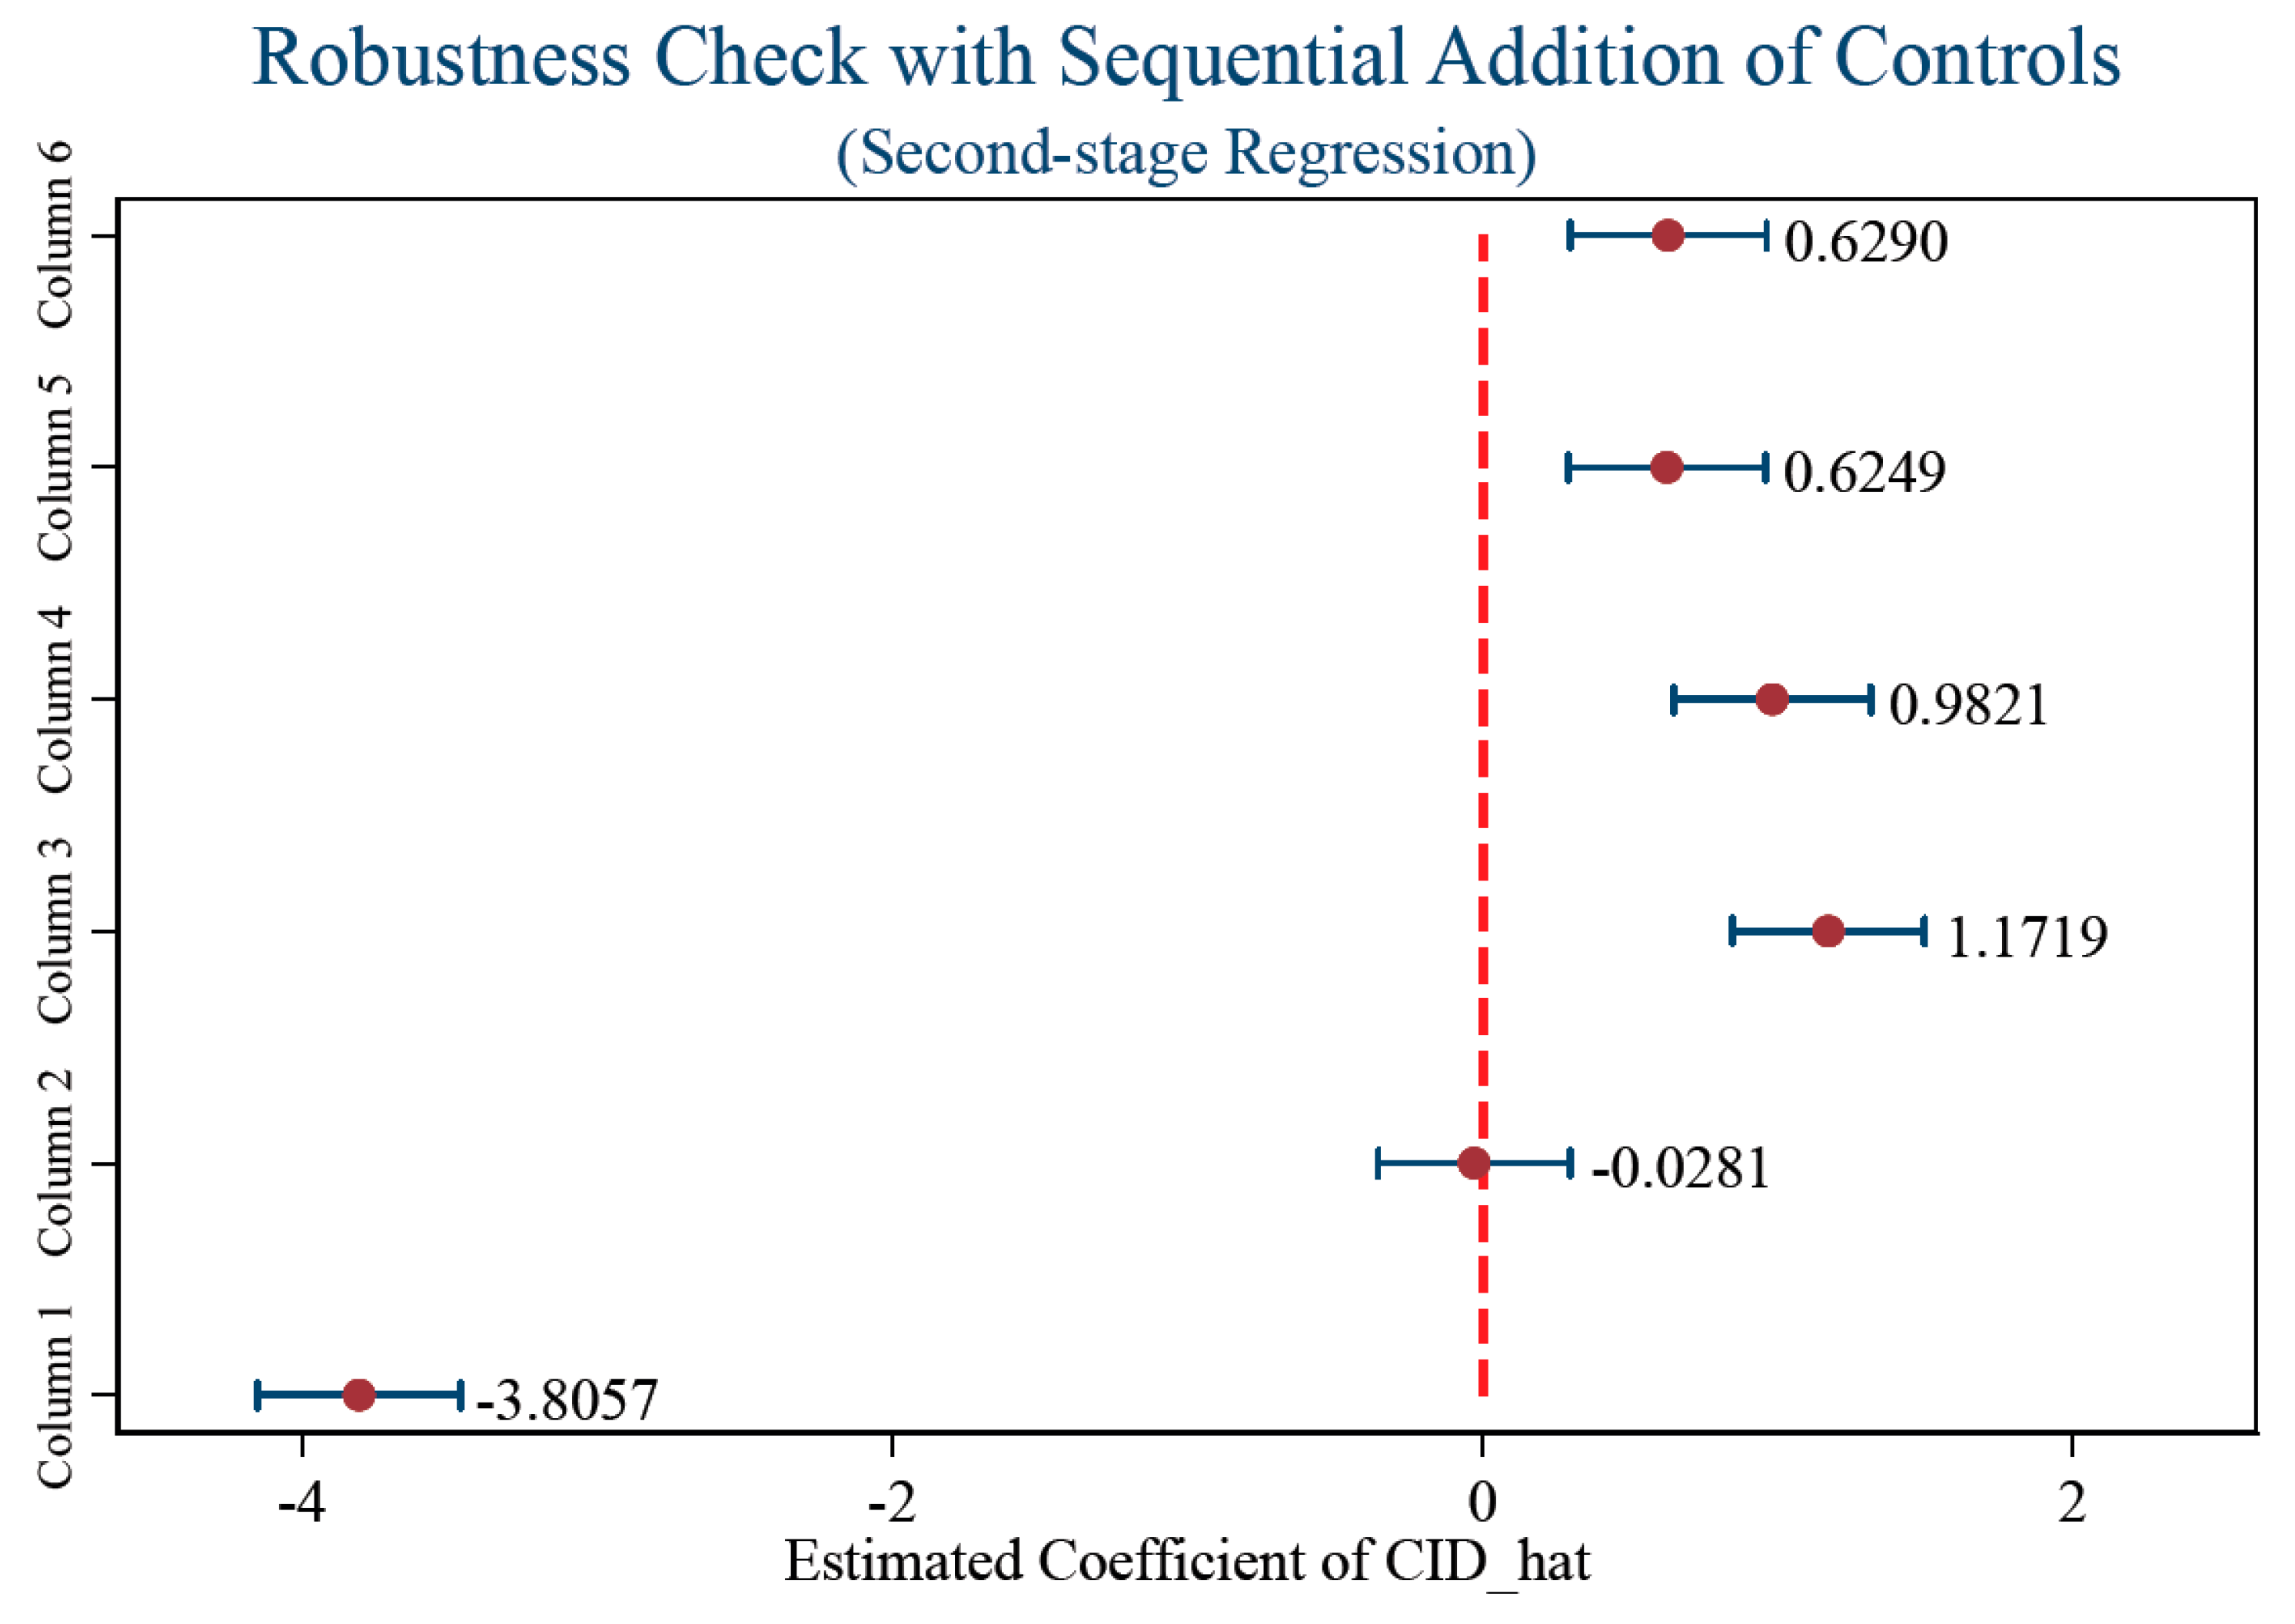
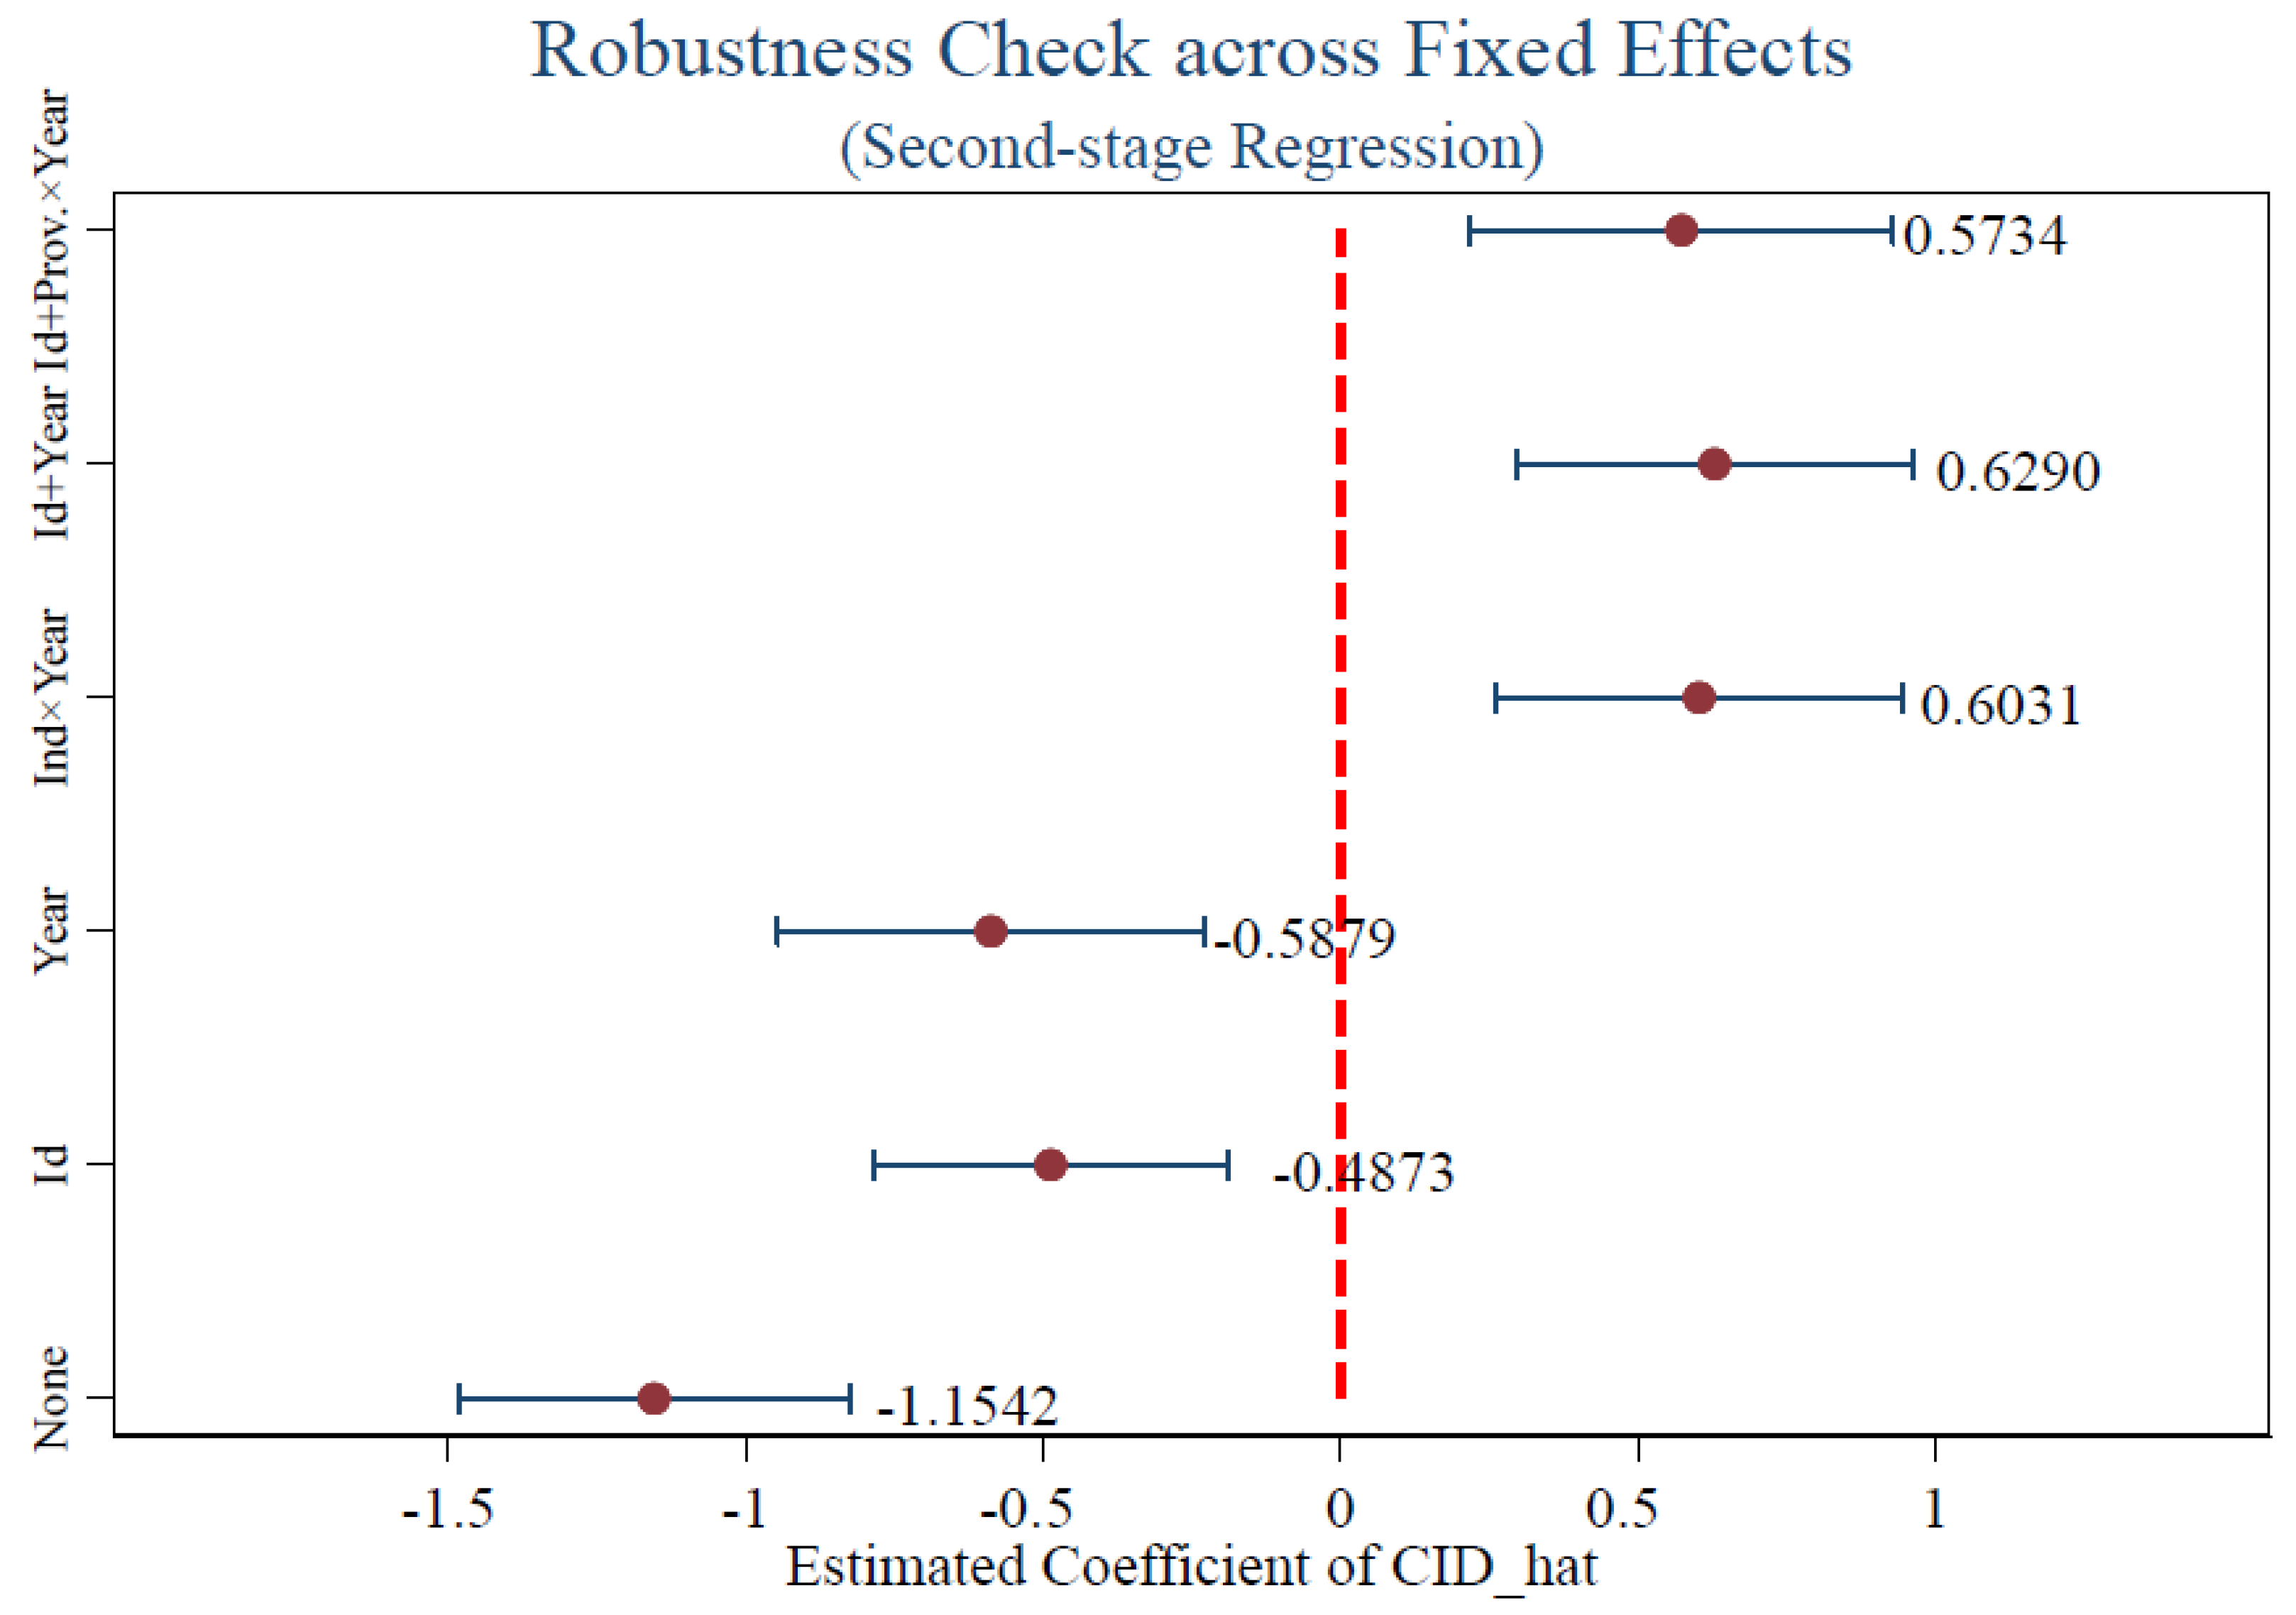
4.4. Robustness Tests

To ensure the credibility and robustness of our empirical results, we conduct a series of robustness checks that further substantiate the validity of our main findings. First, we validate the parallel trend assumption for the first-stage difference-in-differences (DID) analysis. The results confirm that prior to the 2018 policy intervention, there are no significant differences in carbon information disclosure between the treated and control firms. This is crucial for the validity of the DID identification strategy. As shown in Figure 1, the event-study plot reveals no statistically significant pre-treatment effects, further supporting the parallel trends assumption and the credibility of our causal inference.
Second, we assess the robustness of the relationship between carbon information disclosure and firm value by performing a dynamic analysis using lagged fitted disclosure variables. This dynamic analysis allows us to investigate how the disclosure effect evolves over time. In Table 4 (Time Dynamics of CID_hat Effect), we report the coefficients for the CID_hat variable across different time periods, highlighting the temporal evolution of the effect. Figure 3 (Time Evolution of CID_hat Coefficient) visually illustrates the changing magnitude of the CID_hat coefficient over time, showing that the effect becomes stronger and more statistically significant as time progresses. These results suggest that the market gradually incorporates the information from carbon information disclosures, reinforcing the temporal robustness of our findings.
Third, we perform a sequential addition of control variables to the baseline model to ensure that our results are not driven by omitted variable bias. As shown in Table 7 (Robustness Check with Sequential Addition of Control Variables) and Figure 6 (Second-stage CID_hat Coefficient Across Model Specifications), we find that the estimated effect of carbon information disclosure (CID_hat) remains stable and statistically significant as we progressively introduce firm characteristics and corporate governance factors. The coefficient for CID_hat does not change significantly as additional controls are added, confirming the robustness of our results to the inclusion of multiple control variables. Figure 6 provides a visual demonstration of this stability across various model specifications.
Fourth, we conduct robustness checks by replacing fixed effects structures and clustering standard errors at different levels. Specifically, we replace firm fixed effects with industry-year fixed effects and cluster standard errors at the provincial level. The results of these additional robustness checks are reported in Table 8 (Robustness Check with Stability of CID_hat under Alternative Fixed Effects Specifications). As shown in Figure 7 (Second-stage CID_hat Coefficient Across Fixed Effects), we find that the coefficient on CID_hat remains qualitatively unchanged across these alternative specifications. These results further confirm the robustness of our findings and demonstrate that the conclusions hold under different fixed effects and clustering structures.
Finally, we perform a placebo test by permuting the fitted disclosure variable (CID_hat) to simulate a null distribution. However, due to the endogenous nature of CID_hat, which is derived from the first-stage regression, the placebo distribution does not provide a meaningful counterfactual. This limitation is inherent in multi-stage identification strategies, where standard permutation methods are unsuitable for testing endogenous variables. While the placebo test does not yield a meaningful counterfactual, it highlights the necessity of using the DID approach with appropriate instruments, further validating the causal interpretation of our results.
Taken together, the combination of the parallel trends assumption, dynamic effects, sequential addition of control variables, robustness checks with alternative fixed effects structures, and clustering at different levels, as well as the additional robustness checks, strongly supports the robustness of our main conclusion: policy-induced carbon information disclosure has a positive and persistent effect on firm value. The consistency of our findings across these various robustness checks demonstrates the stability and reliability of our results, reinforcing the credibility of our conclusions.

5. Conclusions and Implications

5.1. Key Findings and Contributions

This study offers three key contributions to the literature on climate finance and ESG disclosure. First, it establishes a causal relationship between carbon information disclosure and firm value using a quasi-natural experiment, addressing endogeneity concerns prevalent in earlier correlational studies (Hardiyansah et al., 2021; Meng & Zhang, 2022). Second, it provides temporal insights into how this effect evolves, with lagged estimates revealing a progressively stronger market response, a dynamic dimension that has been largely overlooked in prior research (Steuer & Tröger, 2022; Y. Liu et al., 2024). Third, it demonstrates that the strength of regional regulatory enforcement significantly moderates the valuation impact of disclosure, aligning with theories of contextualized signaling (Aragòn-Correa et al., 2020; Pan et al., 2022).
Methodologically, the study contributes by integrating a difference-in-differences (DID) design with a two-stage least squares (2SLS) estimation to mitigate endogeneity concerns. This approach leverages exogenous variation from policy exposure to establish a causal pathway from regulation to carbon information disclosure and ultimately to firm value. In contrast to much of the prior literature that relies on correlational designs, the analytical strategy used here enables a more rigorous assessment of causality in disclosure–value relationships (R. Liu et al., 2025). This approach aligns with a growing body of empirical work that leverages DID strategies to evaluate the impact of environmental disclosure on market outcomes in China (J. Zhang & Yang, 2023; Yang et al., 2025; Chen et al., 2025).
Beyond causality, the findings also reveal how the market interprets disclosure signals over time. The effect of policy-induced carbon information disclosure on firm value develops over time, with increasing coefficients on lagged disclosure variables indicating a progressive market response to sustained disclosure. This pattern supports a dynamic signaling logic in which investors gradually revise their valuation expectations in response to consistent and repeated firm behavior. These findings offer a temporally detailed view of how policy-driven carbon information disclosure is interpreted by capital markets over multiple reporting periods. These dynamic results support the notion that capital markets assimilate disclosure signals incrementally, especially when such disclosures are policy-driven rather than strategically initiated. This is in line with signaling theory, which posits that repeated and consistent disclosures enhance signal credibility over time (Connelly et al., 2025).
The analysis also identifies heterogeneity in the firm value effects of carbon information disclosure across environmental regulation pressure. The interaction results suggest that under high regulatory intensity, the marginal valuation effect of disclosure declines, possibly because disclosure becomes routine and loses it signaling strength. However, grouped estimation results reveal that baseline valuation levels remain higher in more strictly regulated regions, indicating that regulatory credibility enhances the structural effectiveness of carbon information disclosure. This finding complements prior research suggesting that in high-regulation environments, investors may discount disclosures perceived as routine or compliance-based (Clementino & Perkins, 2021; Ding et al., 2023). However, our evidence nuances this view by showing that although the marginal effect declines, baseline valuation levels remain higher in strictly regulated regions, which implies that regulatory credibility strengthens the foundational signaling environment.
China’s policy-led but regionally uneven environmental governance provides a unique institutional context, but the underlying dynamics observed here have broader relevance. The dynamics of policy-induced signaling and market interpretation observed in this study offer valuable insights for other emerging economies with evolving regulatory regimes. In this sense, the study offers transferable insights into how regulatory architecture interacts with corporate communication and market valuation.

5.2. Policy and Managerial Implications

Building on these empirical insights, this section discusses the practical relevance of the findings for policymakers, corporate managers, investors, and ESG data providers. For environmental policymakers, the findings suggest that non-compulsory yet institutionally credible regulation can effectively guide firm behavior. The 2018 policy, while focused on internal carbon verification, created enough institutional momentum to alter external disclosure practices. This indicates that regulatory designs need not always rely on legal mandates to induce corporate action. However, the effectiveness of such measures depends on policy clarity, regulatory consistency, and enforcement credibility.
The observed variation in enforcement intensity across regions underscores the importance of tailoring policy implementation to local regulatory capacity. In areas with limited regulatory capacity, policy signals may lack credibility, reducing their influence on firm behavior and investor interpretation. Tailored implementation strategies such as differentiated enforcement benchmarks, regional performance evaluations, and targeted administrative support could improve the effectiveness of national environmental initiatives.
The findings also point to risks associated with symbolic compliance. Because the observed valuation effects are linked to disclosure volume rather than audited environmental outcomes, there is a risk that firms may engage in symbolic rather than substantive reporting. To improve the reliability of disclosed information, auxiliary mechanisms such as standardized reporting formats, public databases, and third-party assurance frameworks should be developed and institutionalized.
For corporate managers, the results emphasize the strategic value of sustained and credible carbon information disclosure. Firms that align their disclosure practices with evolving regulatory expectations may improve investor confidence and long-term valuation. However, market recognition of such efforts depends on consistency across reporting cycles. Short-term or opportunistic disclosure is unlikely to deliver durable financial benefits. Disclosure strategies should be integrated into broader governance, risk management, and sustainability planning frameworks.
From an investor perspective, the study underscores the importance of contextualizing disclosure signals. Identical disclosure behavior may carry different implications depending on the regulatory environment in which it is situated. Investors should evaluate carbon information disclosure not only in terms of quantity but also in relation to regional enforcement levels, historical disclosure trajectories, and broader institutional signals. Failure to do so risks misinterpreting symbolic gestures as indicators of substantive environmental engagement. To enhance interpretation accuracy, ESG rating agencies and institutional investors should consider regional regulatory context when evaluating the credibility of carbon information disclosure, as its signaling value is not uniform across enforcement regimes.

5.3. Limitations and Future Research

While the findings are robust and informative, several methodological and contextual limitations merit further discussion. The study is subject to several limitations. The study measures carbon information disclosure using keyword frequency in annual reports, which captures disclosure intensity but not necessarily its quality or credibility. In addition, future work could explore how provincial policy innovation, administrative inspections, or local emission trading schemes influence the credibility and impact of carbon information disclosure in China.
The analysis does not incorporate direct measures of firms’ environmental performance, such as actual carbon emissions. Without such data, it is difficult to determine whether disclosure reflects substantive operational improvements or is primarily symbolic. Integrating emissions or environmental audit data would allow for a more complete understanding of the relationship between disclosure behavior, performance, and market valuation.
Moreover, the operationalization of environmental regulation pressure relies on a region level to measure. While this captures meaningful variation, it may also proxy for other regional characteristics such as media attention or investor composition. Future work could employ multi-level modeling to account for these factors or develop alternative indices that capture other facets of institutional capacity and policy enforcement.
Future research should also investigate investor heterogeneity, as different types of investors, such as foreign institutions, domestic mutual funds, or retail investors, may interpret disclosure signals differently. Different investor groups such as foreign institutions, domestic mutual funds, or retail investors may interpret carbon information disclosures through distinct lenses. Examining how these interpretive differences affect valuation outcomes could provide deeper insight into the transmission of non-financial information in capital markets.
Although the study benefits from a rigorous identification strategy based on a quasi-natural experiment, the generalizability of the findings remains context-dependent and may be constrained by China’s unique institutional features. China’s hybrid model of centralized policymaking and decentralized enforcement may differ substantially from institutional arrangements in developed economies or resource-constrained emerging markets. Comparative studies across jurisdictions with varying regulatory regimes and disclosure norms would be valuable in assessing the broader applicability of the observed mechanisms.

Author Contributions

R.L.: conceptualization, methodology, software, validation, formal analysis, investigation, resources, data curation, and writing—original draft preparation; M.R.C.A.R.: conceptualization, validation, writing—review and editing, supervision, and project administration; A.H.J.: conceptualization, validation, writing—review and editing, and supervision. All authors have read and agreed to the published version of the manuscript.

Funding

This research received no external funding.

Institutional Review Board Statement

Not applicable.

Informed Consent Statement

Not applicable.

Data Availability Statement

The data used in this study are not publicly available due to confidentiality and research restrictions, as they originate from the author’s doctoral dissertation research. These data are intended for academic purposes only and will not be disclosed publicly. However, summary statistics may be provided upon reasonable request from the corresponding author.

Acknowledgments

The author expresses gratitude to UKM-GSB for providing academic resources and support throughout this research.

Conflicts of Interest

The authors declare no conflicts of interest.

Abbreviations

The following abbreviations are used in this manuscript:
CIDcarbon information disclosure
FVfirm value
ERenvironmental regulation
DIDdifference-in-differences

Appendix A

Table A1. Multicollinearity test.
VariablesVIF1/VIF
Lev2.220.451426
Size2.140.467208
Liquid1.780.562632
Board1.630.61329
Indep1.490.671408
IShare1.350.742063
CID1.320.75836
Big41.190.837162
DID1.190.843196
Loss1.140.874889
ER1.070.935326
Growth1.050.954768
Opinion1.040.957739
Mean VIF1.43

References

  1. Ameli, N., Drummond, P., Bisaro, A., Grubb, M., & Chenet, H. (2020). Climate finance and disclosure for institutional investors: Why transparency is not enough. Climatic Change, 160, 565–589. [Google Scholar] [CrossRef]
  2. Aragòn-Correa, J. A., Marcus, A. A., & Vogel, D. (2020). The effects of mandatory and voluntary regulatory pressures on firms’ environmental strategies: A review and recommendations for future research. Academy of Management Annals, 14, 339–365. [Google Scholar] [CrossRef]
  3. Borghei, Z. (2021). Carbon disclosure: A systematic literature review. Accounting & Finance, 61, 5255–5280. [Google Scholar]
  4. Bu, C., Zhang, K., Shi, D., & Wang, S. (2022). Does environmental information disclosure improve energy efficiency? Energy Policy, 164, 112919. [Google Scholar] [CrossRef]
  5. Cao, Q., Zhou, Y., Du, H., Ren, M., & Zhen, W. (2022). Carbon information disclosure quality, greenwashing behavior, and enterprise value. Frontiers in Psychology, 13, 892415. [Google Scholar] [CrossRef] [PubMed]
  6. Clementino, E., & Perkins, R. (2021). How do companies respond to environmental, social and governance (ESG) ratings? Evidence from Italy. Journal of Business Ethics, 171, 379–397. [Google Scholar] [CrossRef]
  7. Connelly, B. L., Certo, S. T., Reutzel, C. R., DesJardine, M. R., & Zhou, Y. S. (2025). Signaling theory: State of the theory and its future. Journal of management, 51, 24–61. [Google Scholar] [CrossRef]
  8. Ding, D., Liu, B., & Chang, M. (2023). Carbon emissions and TCFD aligned climate-related information disclosures. Journal of Business Ethics, 182, 967–1001. [Google Scholar] [CrossRef]
  9. Diwan, H., & Amarayil Sreeraman, B. (2024). From financial reporting to ESG reporting: A bibliometric analysis of the evolution in corporate sustainability disclosures. Environment, Development and Sustainability, 26, 13769–13805. [Google Scholar] [CrossRef]
  10. Du, M., Chai, S., Wei, W., Wang, S., & Li, Z. (2022). Will environmental information disclosure affect bank credit decisions and corporate debt financing costs? Evidence from China’s heavily polluting industries. Environmental Science and Pollution Research, 29, 47661–47672. [Google Scholar] [CrossRef] [PubMed]
  11. Dutta, P., & Dutta, A. (2021). Impact of external assurance on corporate climate change disclosures: New evidence from Finland. Journal of Applied Accounting Research, 22, 252–285. [Google Scholar] [CrossRef]
  12. Flammer, C., Toffel, M. W., & Viswanathan, K. (2021). Shareholder activism and firms’ voluntary disclosure of climate change risks. Strategic Management Journal, 42, 1850–1879. [Google Scholar] [CrossRef]
  13. Grewal, J., Richardson, G. D., & Wang, J. (2022). Effects of mandatory carbon reporting on unrepresentative environmental disclosures. SSRN, 4166184. [Google Scholar] [CrossRef]
  14. Han, Y. (2020). Impact of environmental regulation policy on environmental regulation level: A quasi-natural experiment based on carbon emission trading pilot. Environmental Science and Pollution Research, 27, 23602–23615. [Google Scholar] [CrossRef] [PubMed]
  15. Hardiyansah, M., Agustini, A. T., & Purnamawati, I. (2021). The effect of carbon emission disclosure on firm value: Environmental performance and industrial type. The Journal of Asian Finance, Economics and Business, 8, 123–133. [Google Scholar]
  16. He, R., Luo, L., & Tang, Q. (2022). Usefulness of corporate carbon information for decision-making. In Information for efficient decision making: Big data, blockchain and relevance (pp. 451–476). World Scientific. [Google Scholar]
  17. Huang, D. Z. X. (2022). Environmental, social and governance factors and assessing firm value: Valuation, signalling and stakeholder perspectives. Accounting & Finance, 62, 1983–2010. [Google Scholar]
  18. Huang, H., Zou, Y., Wang, L., Wang, W., & Ren, X. (2025). Impact of carbon information disclosure on corporate financing constraints: Evidence from the Carbon Disclosure Project. Australian Journal of Management, 50, 104–131. [Google Scholar] [CrossRef]
  19. Kadim, A., Sunardi, N., & Husain, T. (2020). The modeling firm’s value based on financial ratios, intellectual capital and dividend policy. Accounting, 6, 859–870. [Google Scholar] [CrossRef]
  20. Karplus, V. J., Zhang, J., & Zhao, J. (2021). Navigating and evaluating the labyrinth of environmental regulation in China. Review of Environmental Economics and Policy, 15, 300–322. [Google Scholar] [CrossRef]
  21. Krueger, P., Sautner, Z., Tang, D. Y., & Zhong, R. (2024). The effects of mandatory ESG disclosure around the world. Journal of Accounting Research, 62, 1795–1847. [Google Scholar] [CrossRef]
  22. Liu, M., Xia, C., Lan, H., Gao, Z., Yu, X., Wang, L., Liang, X., & Wu, Y. (2024). Driving toward sustainable cities: The interplay between Chinese emerging corporate ESG performance and climate finance in achieving low-carbon development. Urban Climate, 55, 101918. [Google Scholar] [CrossRef]
  23. Liu, R., Rahman, M. R. C. A., & Jamil, A. H. (2025). Leveraging environmental regulation: How green innovation moderates the relationship between carbon information disclosure and firm value. Sustainability, 17, 2597. [Google Scholar] [CrossRef]
  24. Liu, Y., Huang, H., Mbanyele, W., Wang, F., & Liu, H. (2024). Does the issuance of green bonds nudge environmental responsibility engagements? Evidence from the Chinese green bond market. Financial Innovation, 10, 92. [Google Scholar] [CrossRef]
  25. Liu, Y., Li, W., Wang, L., & Meng, Q. (2023). Why greenwashing occurs and what happens afterwards? A systematic literature review and future research agenda. Environmental Science and Pollution Research, 30, 118102–118116. [Google Scholar] [CrossRef] [PubMed]
  26. Lo, C. W.-H., Liu, N., Pang, X., & Li, P. H. Y. (2020). Unpacking the complexity of environmental regulatory governance in a globalizing world: A critical review for research agenda setting. Journal of Environmental Policy & Planning, 22, 594–607. [Google Scholar]
  27. Luo, X., Zhang, R., & Liu, W. (2022). Environmental legitimacy pressure, political connection and impression management of carbon information disclosure. Carbon Management, 13, 90–104. [Google Scholar] [CrossRef]
  28. Lyu, Y., Ye, H., Zhao, Z., Tian, J., & Chen, L. (2020). Exploring the cost of wastewater treatment in a chemical industrial Park: Model development and application. Resources, Conservation and Recycling, 155, 104663. [Google Scholar] [CrossRef]
  29. Mateo-Márquez, A. J., González-González, J. M., & Zamora-Ramírez, C. (2020). Countries’ regulatory context and voluntary carbon disclosures. Sustainability Accounting, Management and Policy Journal, 11, 383–408. [Google Scholar] [CrossRef]
  30. Meng, J., & Zhang, Z. (2022). Corporate environmental information disclosure and investor response: Evidence from China’s capital market. Energy Economics, 108, 105886. [Google Scholar] [CrossRef]
  31. Ministry of Ecology and Environment. (2018). Notice on strengthening the 2018 annual carbon emission report, verification, and emission monitoring plan development work. Available online: https://www.mee.gov.cn/xxgk2018/xxgk/xxgk06/201901/t20190124_690807.html (accessed on 17 January 2019).
  32. Pan, L., Han, W., Li, Y., & Wu, H. (2022). Legitimacy or efficiency? Carbon emissions transfers under the pressure of environmental law enforcement. Journal of Cleaner Production, 365, 132766. [Google Scholar] [CrossRef]
  33. Persakis, A., Fassas, A., & Koutoupis, A. (2024). How does world economic policy uncertainty influence the carbon dioxide emission reporting and performance? Study of Fortune Global 500 firms. Environmental Science and Pollution Research, 31, 24014–24041. [Google Scholar] [CrossRef] [PubMed]
  34. Peters, G. F., & Romi, A. M. (2014). Does the voluntary adoption of corporate governance mechanisms improve environmental risk disclosures? Evidence from greenhouse gas emission accounting. Journal of Business Ethics, 125, 637–666. [Google Scholar] [CrossRef]
  35. Pitrakkos, P., & Maroun, W. (2020). Evaluating the quality of carbon disclosures. Sustainability Accounting, Management and Policy Journal, 11, 553–589. [Google Scholar] [CrossRef]
  36. Qian, W., & Schaltegger, S. (2017). Revisiting carbon disclosure and performance: Legitimacy and management views. The British Accounting Review, 49, 365–379. [Google Scholar] [CrossRef]
  37. Qian, W., Tilt, C., & Belal, A. (2021). Social and environmental accounting in developing countries: Contextual challenges and insights. Accounting, Auditing & Accountability Journal, 34, 1021–1050. [Google Scholar]
  38. Radu, C., Caron, M. A., & Arroyo, P. (2020). Integration of carbon and environmental strategies within corporate disclosures. Journal of cleaner Production, 244, 118681. [Google Scholar] [CrossRef]
  39. Runyu, L., Rahman, M. R. C. A., & Jamil, A. H. B. (2025). A systematic literature review of carbon information disclosure on value effect. Journal of Lifestyle and SDGs Review, 5, e05011. [Google Scholar] [CrossRef]
  40. Saka, C., & Oshika, T. (2014). Disclosure effects, carbon emissions and corporate value. Sustainability Accounting, Management and Policy Journal, 5, 22–45. [Google Scholar] [CrossRef]
  41. Siddique, M. A., Akhtaruzzaman, M., Rashid, A., & Hammami, H. (2021). Carbon disclosure, carbon performance and financial performance: International evidence. International Review of Financial Analysis, 75, 101734. [Google Scholar] [CrossRef]
  42. Steuer, S., & Tröger, T. H. (2022). The role of disclosure in green finance. Journal of Financial Regulation, 8, 1–50. [Google Scholar] [CrossRef]
  43. Sun, Z.-Y., Wang, S.-N., & Li, D. (2022). The impacts of carbon emissions and voluntary carbon disclosure on firm value. Environmental Science and Pollution Research, 29, 60189–60197. [Google Scholar] [CrossRef] [PubMed]
  44. Wang, Q. (2022). Financial effects of carbon risk and carbon disclosure: A review. Accounting & Finance, 63, 4175–4219. [Google Scholar]
  45. Yang, Y., Xie, S., & Qiang, M. (2025). High-temperature risk and corporate social responsibility in China. Business Ethics, the Environment & Responsibility. [Google Scholar] [CrossRef]
  46. Yang, Y., Zhang, J., Song, C., Wu, Y., & Zhang, B. (2025). Does environmental information disclosure make financial markets more informative? Evidence from China. Journal of Contemporary Accounting & Economics, 21, 100468. [Google Scholar] [CrossRef]
  47. Zhang, J., & Yang, Y. (2023). Can environmental disclosure improve price efficiency? The perspective of price delay. Finance Research Letters, 52, 103556. [Google Scholar] [CrossRef]
  48. Zhang, M., Wang, A., & Zhou, S. (2023). Effect of analysts’ earnings pressure on environmental information disclosure of firms: Can corporate governance alleviate the earnings obsession? Borsa Istanbul Review, 23, 495–515. [Google Scholar] [CrossRef]
  49. Zhang, Y.-J., & Liu, J. Y. (2020). Overview of research on carbon information disclosure. Frontiers of Engineering Management, 7, 47–62. [Google Scholar] [CrossRef]
Figure 1. Correlation heatmap.
Ijfs 13 00098 g001
Figure 2. Event-study test of parallel trends in carbon information disclosure.
Ijfs 13 00098 g002
Figure 3. Dynamic effects of disclosure on firm value.
Ijfs 13 00098 g003
Figure 4. Moderating effect of environmental regulation.
Ijfs 13 00098 g004
Figure 5. Marginal effects of carbon information disclosure on firm value across environmental regulation groups.
Ijfs 13 00098 g005
Figure 6. Second-stage CID_hat coefficient across model specifications. Notes: This figure plots the coefficient estimates and 95% confidence intervals for CID_hat across model specifications reported in Table 7.
Ijfs 13 00098 g006
Figure 7. Second-stage CID_hat coefficient across fixed effects. Notes: This figure plots the coefficient estimates and 95% confidence intervals for CID_hat across fixed effects reported in Table 8.
Ijfs 13 00098 g007
Table 1. Variable measurement.
Variables SymbolDescriptions
Dependent VariableFirm valueFVTobin’s q, market value of firm/
total assets–net intangible assets–net goodwill
Independent VariablePolicy ShockDIDTreat × Post, treat target carbon-intensive industries plus 1; Post years from 2018 onward plus 1 and 0 for pre-2018 years.
Mediator VariableCarbon information disclosureCIDCarbon-related keywords are identified, and their frequencies are counted for each firm-year observation
Moderator VariableEnvironmental regulationERInvestment in wastewater treatment and air pollution control in location/Industrial added value
Control VariableSizeSizeTake logarithm of total assets
SolvencyLevTotal liabilities/total assets
LiquidityLiquidCurrent assets/current liabilities
Development abilityGrowthCurrent period net profit–last period net profit/last period net profit
Loss statusLossThe net profit of the year was less than 0 plus 1, otherwise plus 0
Size of boardBoardTake logarithm of board size
Governance capabilityIndepIndependent directors/total number of directors
External monitoring abilityIShareTotal institutional shares/total shares outstanding
Financial transparency Big4Audited by one of the big four for firm-year plus 1, otherwise plus 0
ReliabilityOpinionUnqualified audit opinion for firm-year plus 1, otherwise plus 0
Table 2. Summary statistics.
MeanSDp25p50p75MinMax
FV1.9861.2261.1871.5842.3110.8287.491
CID0.230.35400.1150.26702.023
DID0.0840.27800001
ER0.0020.0020.0010.0010.00200.008
Size22.5891.29821.66522.41623.35720.19326.25
Lev0.4360.1960.2820.4310.5830.0640.862
Liquid2.1761.9271.1351.5882.450.36612.422
Growth0.140.336−0.0330.090.236−0.5081.818
Loss0.1060.30800001
Board2.130.1961.9462.1972.1971.6092.639
Indep37.6995.50633.3336.3642.8633.3357.14
IShare45.80323.91228.21247.78664.5650.53490.973
Big40.0720.25800001
Opinion0.9780.14611101
Table 3. Two-stage least squares estimates: policy-induced carbon information disclosure and firm value.
(1)(2)(3)(4)
CIDCIDFVFV
DID0.2403 ***0.2332 ***
(0.0188)(0.0187)
CID_hat −0.02810.6290 ***
(0.1662)(0.1700)
Size 0.0553 *** −0.5961 ***
(0.0106) (0.0396)
Lev −0.0876 ** 0.3682 ***
(0.0358) (0.1366)
Liquid 0.0030 −0.0160
(0.0021) (0.0100)
Growth 0.0079 0.0522 **
(0.0065) (0.0224)
Loss −0.0173 ** −0.0931 ***
(0.0080) (0.0214)
Board −0.0023 0.0466
(0.0317) (0.0939)
Indep 0.0004 0.0060 **
(0.0009) (0.0026)
IShare 0.0005 * 0.0151 ***
(0.0003) (0.0012)
Big4 −0.0418 0.0262
(0.0258) (0.0822)
Opinion 0.0257 * 0.0064
(0.0151) (0.0520)
Constant0.2096 ***−1.0628 ***1.9929 ***14.1587 ***
(0.0016)(0.2557)(0.0382)(0.8805)
Year FEYESYESYESYES
Id FEYESYESYESYES
N17,53017,53017,53017,530
Adj. R20.5940.59820.64540.6748
Standard errors in parentheses. * p < 0.1, ** p < 0.05, *** p < 0.01. The first-stage F-statistic is 2621.81, exceeding the Stock–Yogo critical value of 16.38 for a single endogenous regressor at the 10% maximal IV size, indicating that the instrument is strong and weak instrument bias is unlikely to be a concern.
Table 4. Dynamic effects of policy-driven carbon information disclosure on firm value.
(1)(2)(3)(4)
FVFVFVFV
CID_hat0.6290 ***
(0.1700)
L1.CID_hat 0.6964 ***
(0.1627)
L2.CID_hat 0.8273 ***
(0.1675)
L3.CID_hat 0.6282 ***
(0.1459)
Size−0.5961 ***−0.5956 ***−0.6218 ***−0.5177 ***
(0.0396)(0.0454)(0.0537)(0.0533)
Lev0.3682 ***0.2748 *0.18440.2085
(0.1366)(0.1454)(0.1607)(0.1538)
Liquid−0.0160−0.00550.0087−0.0009
(0.0100)(0.0120)(0.0157)(0.0149)
Growth0.0522 **0.0481 **0.0553 **0.0384 *
(0.0224)(0.0226)(0.0243)(0.0220)
Loss−0.0931 ***−0.1124 ***−0.1026 ***−0.0681 ***
(0.0214)(0.0222)(0.0233)(0.0214)
Board0.04660.0197−0.0128−0.0333
(0.0939)(0.1052)(0.1150)(0.1030)
Indep0.0060 **0.0065 **0.0059 *0.0047 *
(0.0026)(0.0029)(0.0031)(0.0027)
IShare0.0151 ***0.0163 ***0.0187 ***0.0156 ***
(0.0012)(0.0014)(0.0017)(0.0016)
Big40.02620.0041−0.0665−0.0547
(0.0822)(0.0940)(0.1044)(0.0977)
Opinion0.00640.02110.01840.0322
(0.0520)(0.0546)(0.0569)(0.0503)
Constant14.1587 ***14.1879 ***14.7749 ***12.5800 ***
(0.8805)−10.299−12.236−12.049
Year FEYESYESYESYES
Id FEYESYESYESYES
N17,53015,77714,02412,271
Adj. R20.67480.69040.70610.7274
Standard errors in parentheses. * p < 0.1, ** p < 0.05, *** p < 0.01.
Table 5. Moderating effect of environmental regulation.
(1)(2)(3)(4)
FVFVFVFV
CID_hat−0.02810.6290 ***0.6249 ***0.7379 ***
(0.1662)(0.1700)(0.1702)(0.1707)
ER −36.09795.2403 ***
−74.889−161.712
CID_hat_ER −4.7 × 10² ***
−642.935
Size −0.5961 ***−0.5956 ***−0.5933 ***
(0.0396)(0.0396)(0.0393)
Lev 0.3682 ***0.3696 ***0.3757 ***
(0.1366)(0.1368)(0.1357)
Liquid −0.0160−0.0160−0.0147
(0.0100)(0.0100)(0.0099)
Growth 0.0522 **0.0520 **0.0562 **
(0.0224)(0.0224)(0.0222)
Loss −0.0931 ***−0.0932 ***−0.0920 ***
(0.0214)(0.0214)(0.0214)
Board 0.04660.04690.0444
(0.0939)(0.0939)(0.0928)
Indep 0.0060 **0.0060 **0.0059 **
(0.0026)(0.0026)(0.0026)
IShare 0.0151 ***0.0151 ***0.0154 ***
(0.0012)(0.0012)(0.0012)
Big4 0.02620.02590.0130
(0.0822)(0.0822)(0.0815)
Opinion 0.00640.00660.0109
(0.0520)(0.0520)(0.0510)
Constant1.9929 ***14.1587 ***14.1525 ***13.9811 ***
(0.0382)(0.8805)(0.8806)(0.8752)
Year FEYESYESYESYES
Id FEYESYESYESYES
N17,53017,53017,53017,530
Adj. R20.64540.67480.67480.6767
Standard errors in parentheses. ** p < 0.05, *** p < 0.01.
Table 6. Grouped 2SLS estimation by environmental regulation.
GroupLow ER Group (Below 25th Percentile)Lower-Middle ER Group (25th–50th Percentile)Middle ER Group (50th–75th Percentile)High ER Group (Above 75th Percentile)
(1)(2)(3)(4)(5)(6)(7)(8)
FVFVFVFVFVFVFVFV
DID0.2854 *** 0.1471 *** 0.1415 *** 0.1208 ***
(0.0770) (0.0248) (0.0241) (0.0310)
CID_hat −0.0728 0.5366 ** 0.8040 *** 0.9086 ***
(0.8074) (0.2641) (0.3063) (0.3132)
Size0.0827 ***−0.7751 ***0.0006−0.8359 ***0.0477 ***−0.8237 ***0.0187−0.8107 ***
(0.0261)(0.1072)(0.0146)(0.0905)(0.0162)(0.0791)(0.0143)(0.0692)
Lev−0.10050.32960.06850.3816−0.03990.9539 ***−0.0925 *0.9242 ***
(0.0893)(0.3303)(0.0564)(0.3557)(0.0538)(0.2752)(0.0490)(0.2603)
Liquid0.0087−0.0634 **0.00270.01150.0049 *0.0131−0.0027−0.0073
(0.0057)(0.0288)(0.0025)(0.0200)(0.0029)(0.0248)(0.0027)(0.0197)
Growth0.0330 **0.1255 ***−0.0043−0.0104−0.00550.0544−0.00190.0732 *
(0.0160)(0.0438)(0.0103)(0.0524)(0.0112)(0.0477)(0.0079)(0.0389)
Loss−0.0012−0.0687 **−0.0194−0.0424−0.0124−0.1277 ***0.0050−0.1634 ***
(0.0153)(0.0336)(0.0118)(0.0550)(0.0107)(0.0469)(0.0127)(0.0419)
Board−0.0810−0.20830.0081−0.3939 *0.0721 *0.28230.01670.4305 **
(0.0688)(0.2058)(0.0437)(0.2339)(0.0419)(0.1860)(0.0388)(0.2167)
Indep−0.00250.00120.0015−0.00020.00080.00580.00010.0100 *
(0.0020)(0.0049)(0.0012)(0.0068)(0.0013)(0.0050)(0.0012)(0.0055)
IShare0.00080.0152 ***0.00030.0204 ***0.00010.0161 ***0.00000.0106 ***
(0.0009)(0.0034)(0.0004)(0.0027)(0.0005)(0.0022)(0.0004)(0.0022)
Big4−0.0083−0.0636−0.0112−0.1546−0.0556 *−0.17600.0153−0.1677
(0.0453)(0.1575)(0.0496)(0.1613)(0.0298)(0.1297)(0.0288)(0.1104)
Opinion−0.04980.03030.01450.06210.0067−0.03000.0005−0.2310
(0.0324)(0.0705)(0.0153)(0.1216)(0.0278)(0.1096)(0.0232)(0.1449)
Constant−1.2359 **19.2531 ***0.019920.4471 ***−1.1010 ***18.4055 ***−0.267218.1197 ***
(0.6201)−23,429(0.3313)−21.468(0.3764)−17,076(0.3124)−15.456
Year FEYESYESYESYESYESYESYESYES
Id FEYESYESYESYESYESYESYESYES
N41784178404040404126412641354135
Adj. R20.73910.78810.71010.71420.67210.70580.60920.718
Standard errors in parentheses. * p < 0.1, ** p < 0.05, *** p < 0.01.
Table 7. Robustness check with sequential addition of control variables (second-stage regression).
(1)(2)(3)(4)(5)(6)
FVFVFVFVFVFV
CID_hat−3.8057 ***−0.02811.1719 ***0.9821 ***0.6249 ***0.6290 ***
(0.1759)(0.1662)(0.1661)(0.1704)(0.1696)(0.1700)
Size −0.5108 ***−0.5236 ***−0.5950 ***−0.5961 ***
(0.0412)(0.0414)(0.0398)(0.0396)
Lev 0.22460.2858 **0.3663 ***0.3682 ***
(0.1365)(0.1377)(0.1365)(0.1366)
Liquid −0.0162−0.0126−0.0160−0.0160
(0.0099)(0.0099)(0.0100)(0.0100)
Growth 0.0957 ***0.0523 **0.0522 **
(0.0225)(0.0224)(0.0224)
Loss −0.0996 ***−0.0935 ***−0.0931 ***
(0.0215)(0.0214)(0.0214)
Board 0.04730.0466
(0.0938)(0.0939)
Indep 0.0060 **0.0060 **
(0.0026)(0.0026)
IShare 0.0152 ***0.0151 ***
(0.0012)(0.0012)
Big4 0.0262
(0.0822)
Opinion 0.0064
(0.0520)
Constant2.8612 ***1.9929 ***13.1917 ***13.4876 ***14.1420 ***14.1587 ***
(0.0489)(0.0382)(0.8884)(0.8919)(0.8847)(0.8805)
Year FENOYESYESYESYESYES
Id FENOYESYESYESYESYES
N17,53017,53017,53017,53017,53017,530
Adj. R20.09580.64540.66220.66350.67480.6748
Standard errors in parentheses. ** p < 0.05, *** p < 0.01.
Table 8. Robustness check with stability of CID_hat under alternative fixed effects specifications.
(1)(2)(3)(4)(5)(6)
FVFVFVFVFVFV
CID_hat−1.1542 ***−0.4873 ***−0.5879 ***0.6031 ***0.6290 ***0.5734 ***
(0.1673)(0.1525)(0.1827)(0.1742)(0.1700)(0.1814)
Size−0.3551 ***−0.4933 ***−0.3932 ***−0.4485 ***−0.5961 ***−0.6008 ***
(0.0272)(0.0330)(0.0280)(0.0260)(0.0396)(0.0403)
Lev−0.7828 ***−0.0152−0.6409 ***−0.19920.3682 ***0.3968 ***
(0.1314)(0.1399)(0.1322)(0.1291)(0.1366)(0.1385)
Liquid0.0544 ***−0.0307 ***0.0617 ***0.0462 ***−0.0160−0.0141
(0.0127)(0.0108)(0.0127)(0.0125)(0.0100)(0.0102)
Growth0.3107 ***0.0818 ***0.2945 ***0.2003 ***0.0522 **0.0424 *
(0.0324)(0.0228)(0.0335)(0.0323)(0.0224)(0.0221)
Loss−0.0126−0.0882 ***−0.0158−0.0505−0.0931 ***−0.0874 ***
(0.0329)(0.0235)(0.0329)(0.0309)(0.0214)(0.0214)
Board−0.0698−0.1693 *−0.01620.00620.04660.0601
(0.1024)(0.0962)(0.1033)(0.0963)(0.0939)(0.0949)
Indep0.0122 ***0.00310.0132 ***0.0098 ***0.0060 **0.0069 ***
(0.0032)(0.0027)(0.0032)(0.0029)(0.0026)(0.0026)
IShare0.0099 ***0.0162 ***0.0095 ***0.0103 ***0.0151 ***0.0152 ***
(0.0008)(0.0012)(0.0009)(0.0008)(0.0012)(0.0012)
Big40.0891−0.03610.1199 **0.1667 ***0.02620.0055
(0.0599)(0.0827)(0.0602)(0.0541)(0.0822)(0.0807)
Opinion−0.1745 *0.0591−0.2084 **−0.2258 **0.00640.0163
(0.1046)(0.0587)(0.0989)(0.0935)(0.0520)(0.0528)
Constant9.8508 ***12.7595 ***10.4076 ***11.2997 ***14.1587 ***14.1838 ***
(0.6294)(0.7694)(0.6371)(0.6030)(0.8805)(0.8957)
Fixed EffectNoneIdYearIndustry
Year
Id
Year
Id
Province-Year
N17,53017,53017,53017,53017,53017,530
Adj. R20.25690.58210.33810.41050.67480.6795
Notes: This table reports the estimated coefficients of CID_hat under alternative fixed effects specifications. Standard errors clustered at the firm level are reported in parentheses. Column (4) includes industry-by-year fixed effects implemented via grouped interactions of industry and year. Column (6) includes province-by-year fixed effects using similar interaction groupings. All regressions control for the same set of firm-level covariates. Standard errors in parentheses. * p < 0.1, ** p < 0.05, *** p < 0.01.
Disclaimer/Publisher’s Note: The statements, opinions and data contained in all publications are solely those of the individual author(s) and contributor(s) and not of MDPI and/or the editor(s). MDPI and/or the editor(s) disclaim responsibility for any injury to people or property resulting from any ideas, methods, instructions or products referred to in the content.

