


Financial Literacy and Financial Well-Being Amid Varying Economic Conditions: Evidence from the Survey of Household Economics and Decisionmaking 2017–2022


Abstract
1. Introduction
2. Background
2.1. Relationship Between Financial Literacy and FWB
2.2. Relationship Between Economic Conditions and FWB
2.3. Moderating Role of Financial Literacy in the Relationship Between Economic Conditions and FWB
3. Data and Methods
3.1. Survey of Household Economics and Decisionmaking (SHED)
3.2. Key Explanatory Variable and Outcome Variables
3.2.1. Financial Literacy
3.2.2. FWB Indicators
3.3. Main Analytical Sample
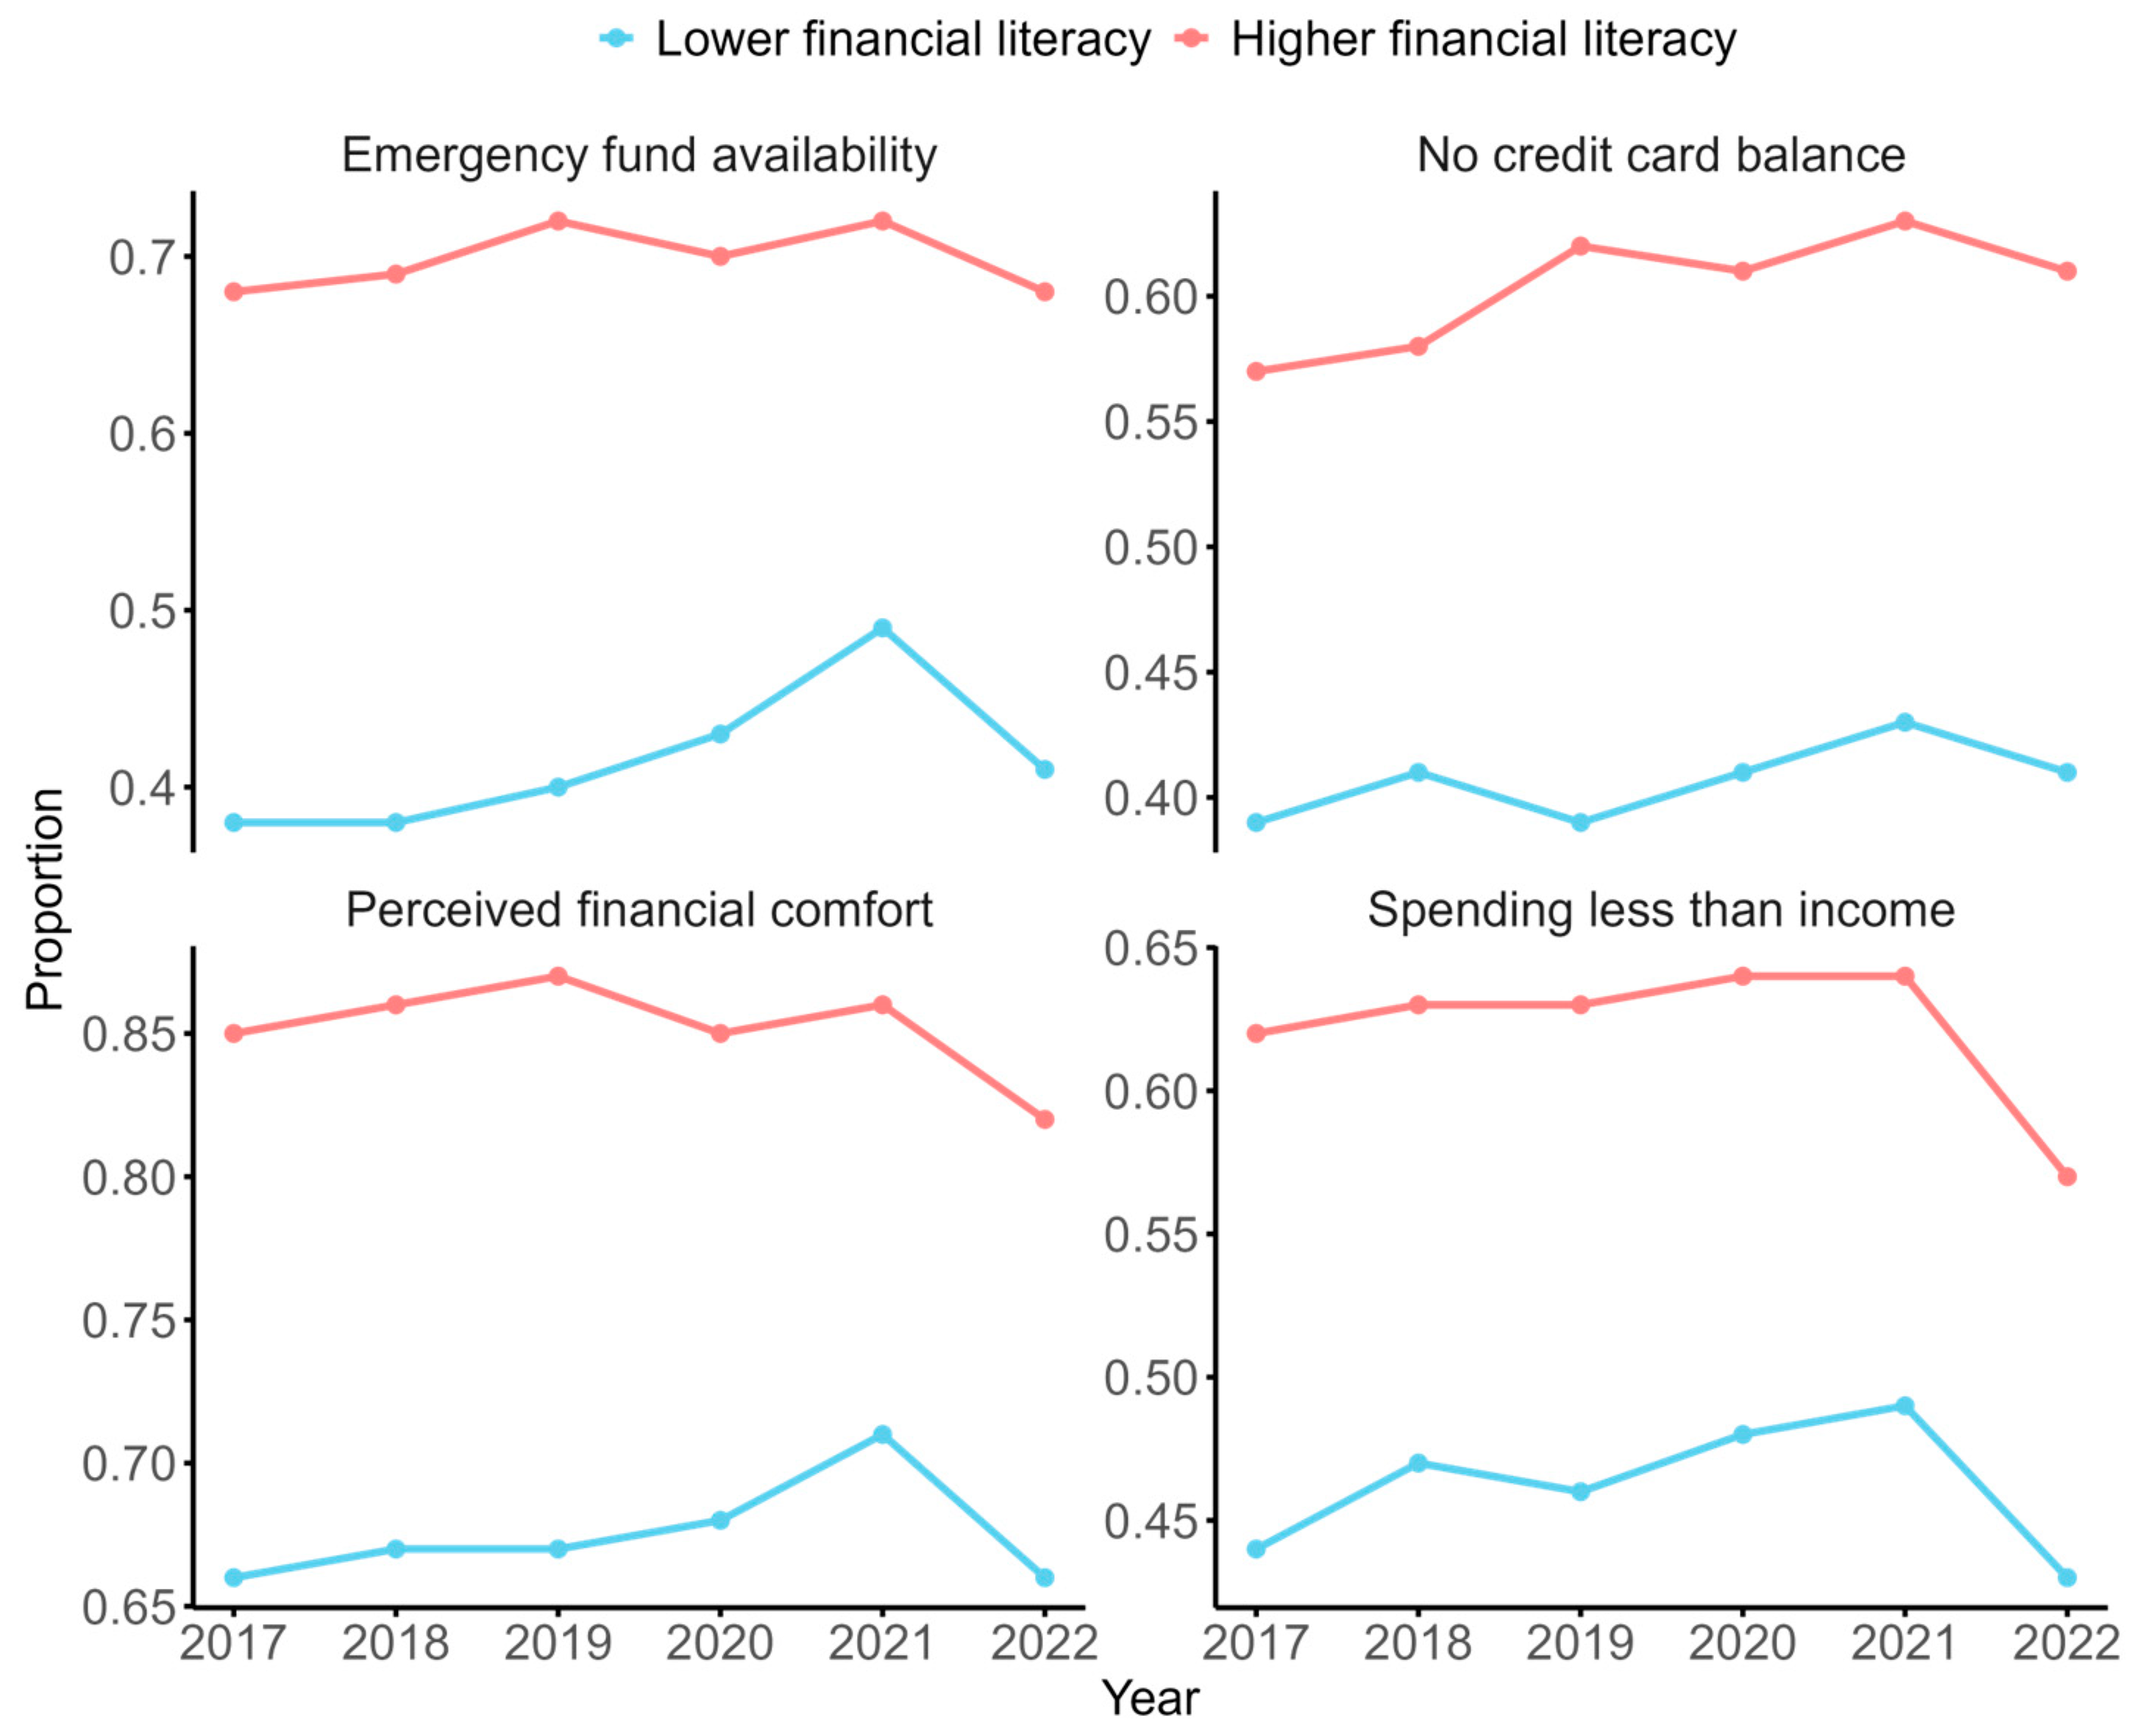
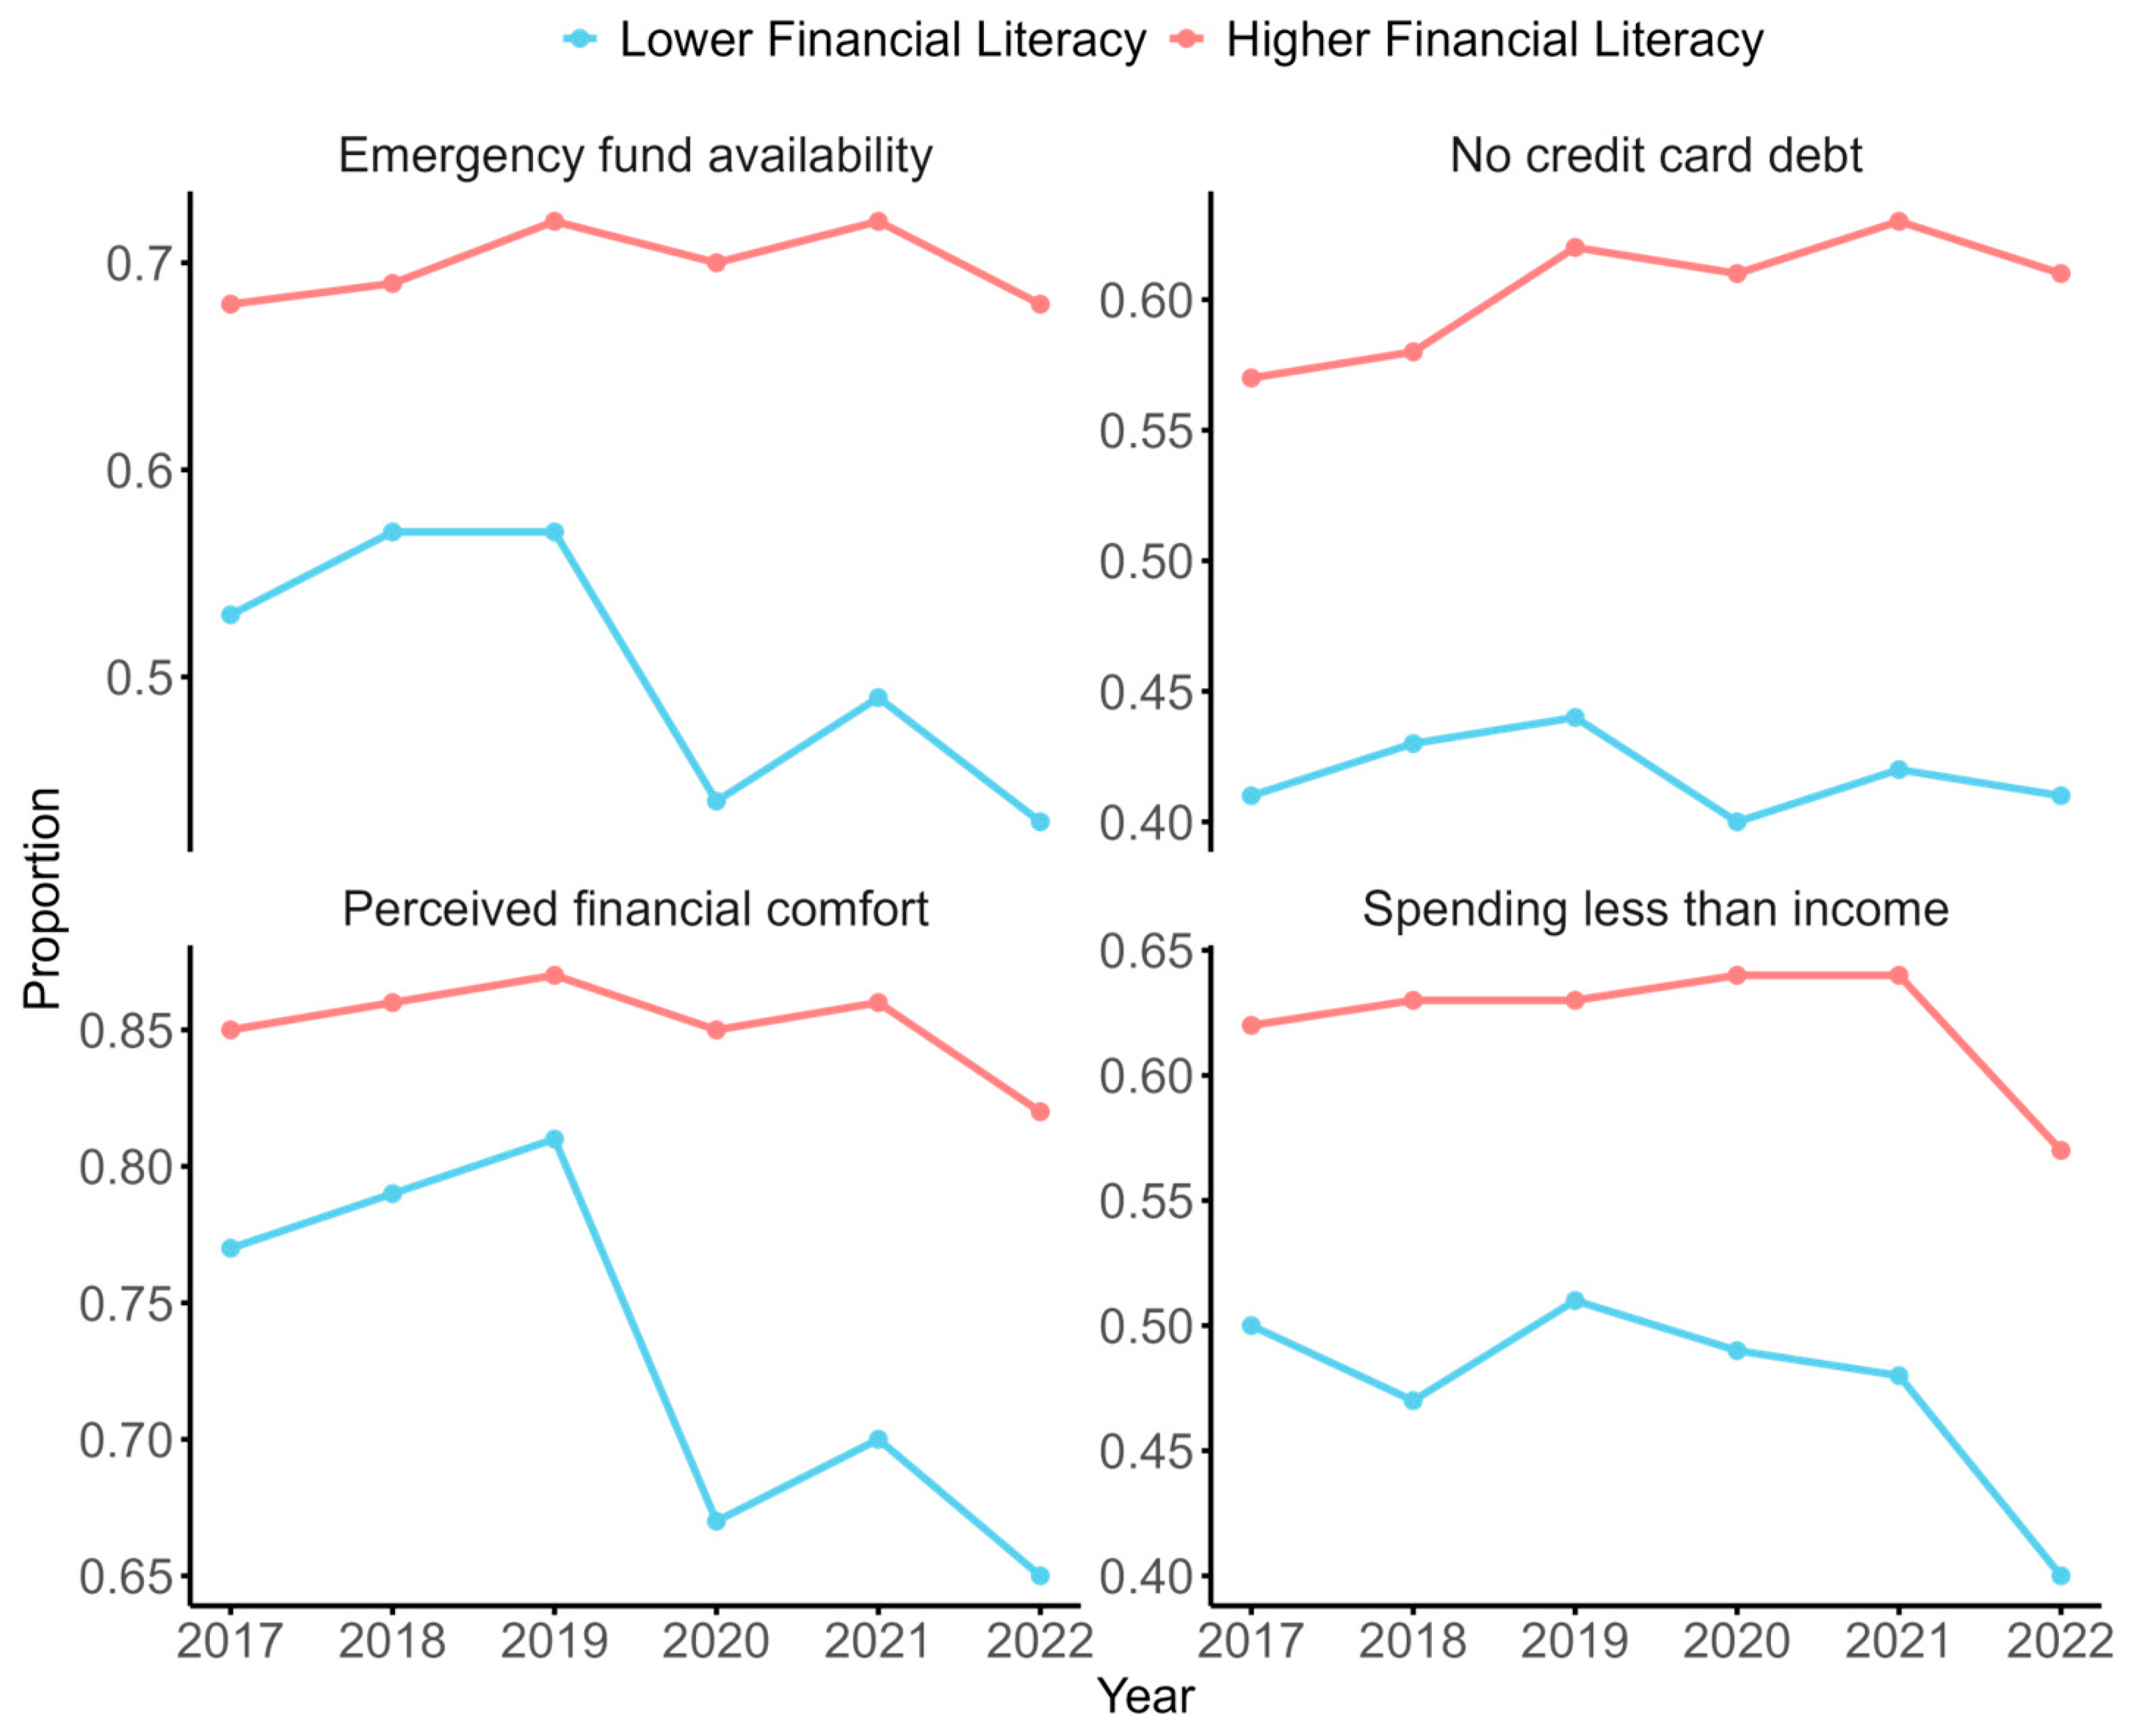
3.4. Yearly Trends in FWB Indicators
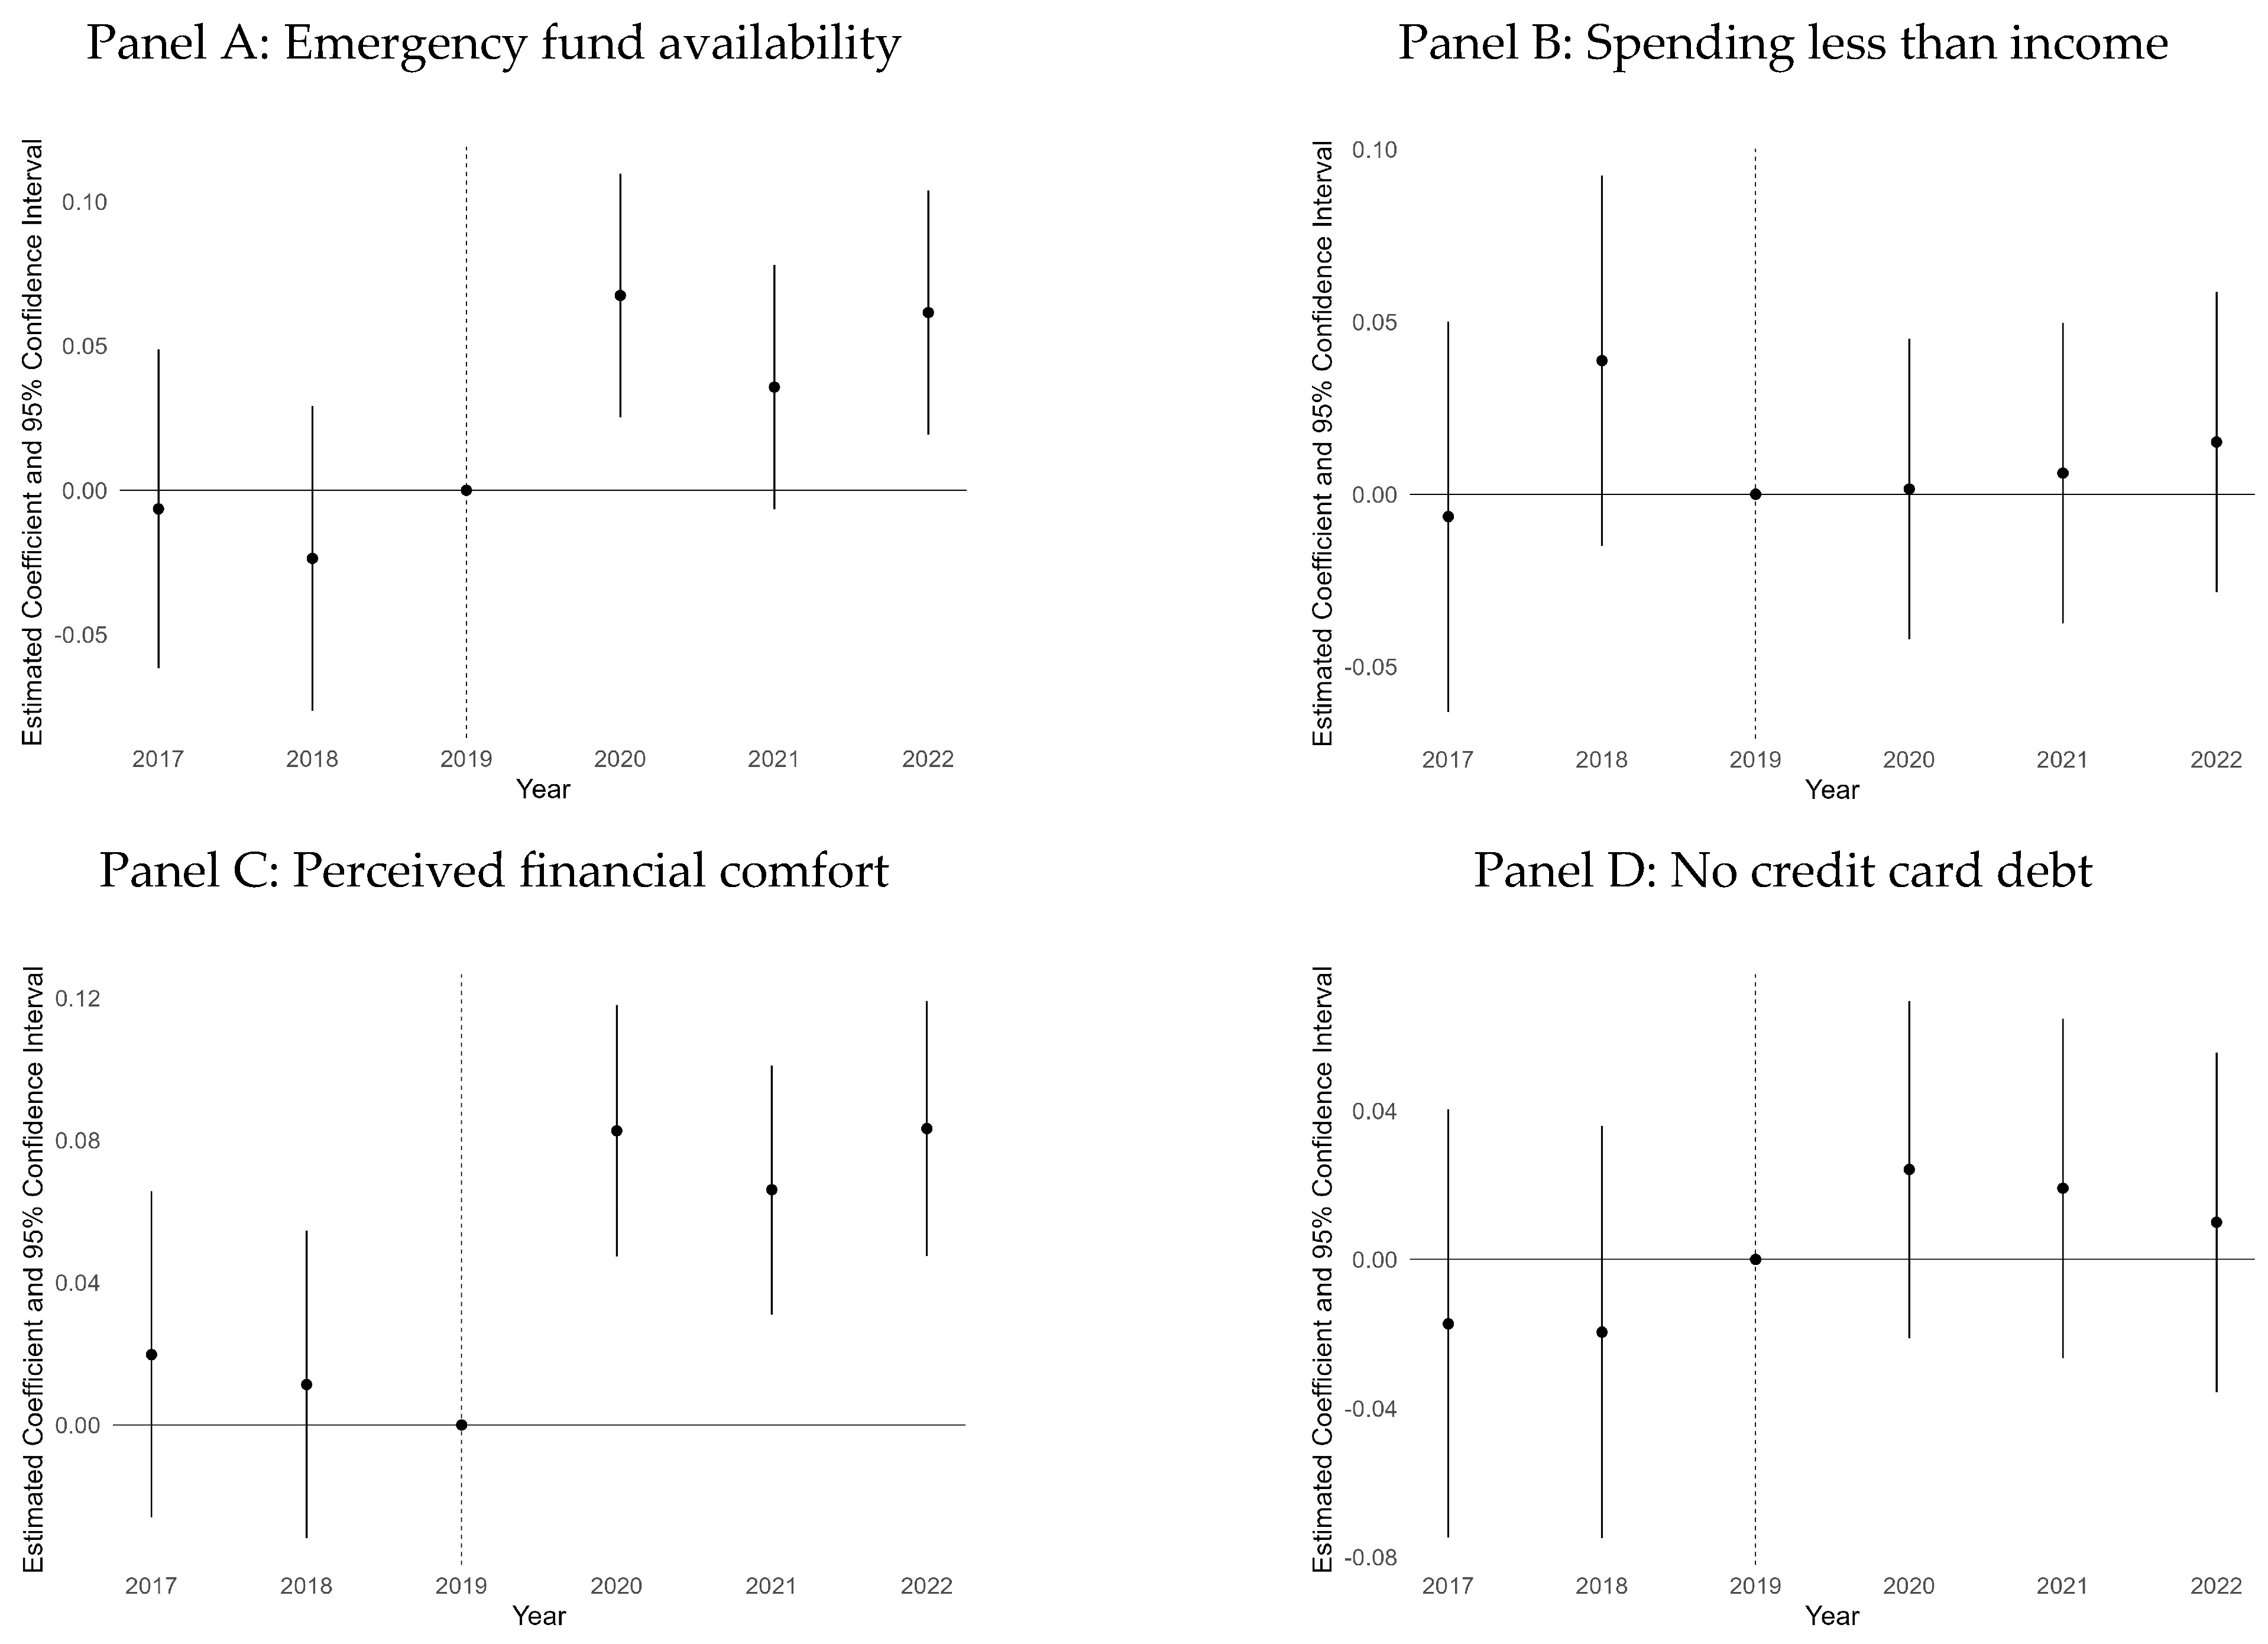
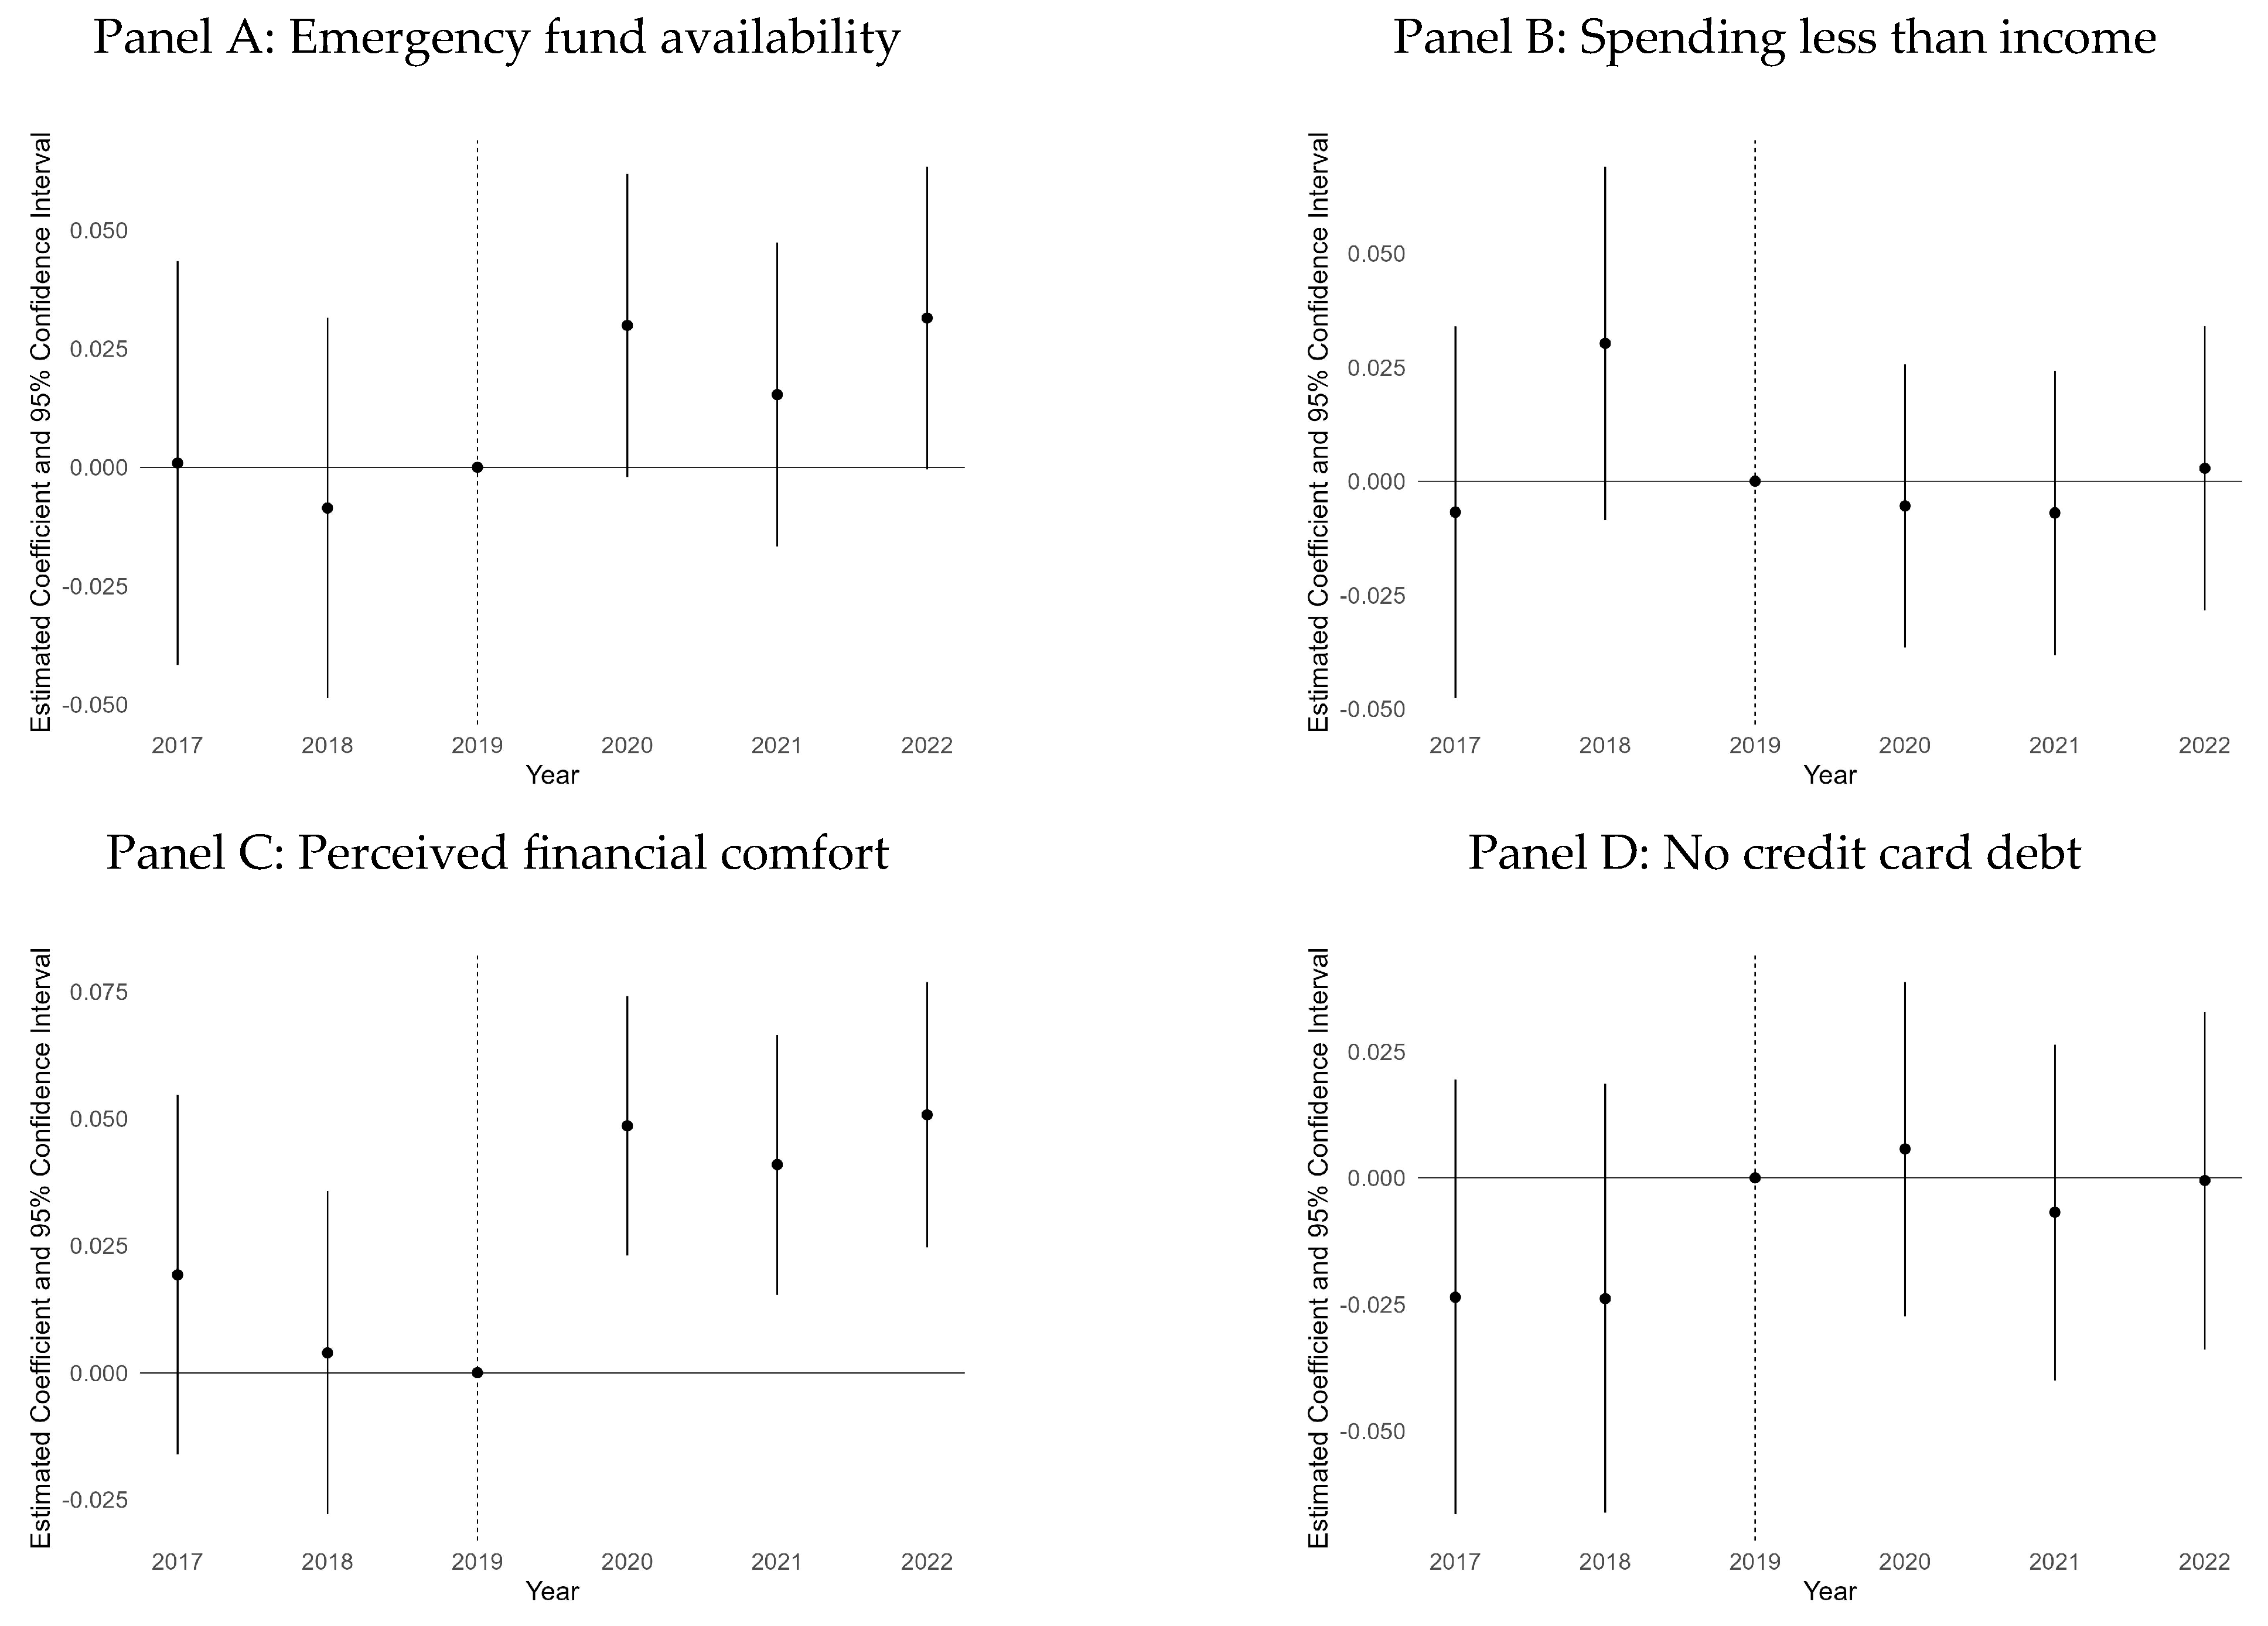
3.5. Regression Estimation
4. Regression Estimates
5. Discussion
6. Conclusions
Funding
Institutional Review Board Statement
Informed Consent Statement
Data Availability Statement
Conflicts of Interest
List of Abbreviations
| Abbreviation | Definition |
| DD | Difference-in-differences |
| FWB | Financial Well-Being |
| GFLEC | Global Financial Literacy Excellence Center |
| NFCS | National Financial Capability Study |
| SHED | Survey of Household Economics and Decisionmaking |
| SNAP | Supplemental Nutrition Assistance Program |
| TIAA | Teachers Insurance and Annuity Association |
Appendix A

| 2017 | 2018 | 2019 | 2020 | 2021 | 2022 | |
|---|---|---|---|---|---|---|
| Sample Size | 12,447 | 11,316 | 12,173 | 11,648 | 11,874 | 11,667 |
| Risk Diversification | ||||||
| Not In Universe (not asked) | 0.02 | 0.00 | 0.00 | 0.00 | 0.00 | 0.00 |
| Don’t know | 0.44 | 0.46 | 0.47 | 0.25 | 0.25 | 0.24 |
| Refused | 0.00 | 0.01 | 0.00 | 0.01 | 0.00 | 0.00 |
| True | 0.03 | 0.03 | 0.04 | 0.09 | 0.08 | 0.07 |
| False | 0.51 | 0.50 | 0.49 | 0.65 | 0.67 | 0.69 |
| Inflation | ||||||
| Not In Universe (not asked) | 0.02 | 0.00 | 0.00 | 0.00 | 0.00 | 0.00 |
| Don’t know | 0.21 | 0.25 | 0.23 | 0.12 | 0.11 | 0.10 |
| Refused | 0.01 | 0.01 | 0.01 | 0.01 | 0.00 | 0.00 |
| More than today | 0.03 | 0.04 | 0.04 | 0.06 | 0.04 | 0.03 |
| Exactly the same | 0.06 | 0.07 | 0.07 | 0.11 | 0.11 | 0.11 |
| Less than today | 0.67 | 0.63 | 0.66 | 0.70 | 0.74 | 0.76 |
| Interest | ||||||
| Not In Universe (not asked) | 0.02 | 0.00 | 0.00 | 0.00 | 0.00 | 0.00 |
| Don’t know | 0.14 | 0.16 | 0.14 | 0.07 | 0.08 | 0.08 |
| Refused | 0.01 | 0.01 | 0.01 | 0.01 | 0.00 | 0.00 |
| More than $102 | 0.73 | 0.71 | 0.74 | 0.79 | 0.78 | 0.76 |
| Exactly $102 | 0.05 | 0.06 | 0.06 | 0.07 | 0.08 | 0.09 |
| Less than $102 | 0.05 | 0.05 | 0.05 | 0.05 | 0.06 | 0.07 |
| Lower Financial Literacy | Higher Financial Literacy | |||
|---|---|---|---|---|
| 2017–2019 | 2020–2022 | 2017–2019 | 2020–2022 | |
| Sample size | 2720 | 6327 | 13,106 | 16,348 |
| Female | 0.48 (0.50) | 0.58 (0.49) | 0.40 (0.49) | 0.44 (0.50) |
| White | 0.60 (0.49) | 0.56 (0.50) | 0.77 (0.42) | 0.73 (0.44) |
| Black | 0.14 (0.35) | 0.15 (0.36) | 0.06 (0.23) | 0.07 (0.25) |
| Hispanic | 0.17 (0.38) | 0.21 (0.41) | 0.08 (0.28) | 0.11 (0.31) |
| Other | 0.09 (0.28) | 0.08 (0.27) | 0.09 (0.29) | 0.10 (0.29) |
| College | 0.33 (0.47) | 0.26 (0.44) | 0.57 (0.50) | 0.54 (0.50) |
| Age | 49.42 (16.80) | 48.73 (17.44) | 51.49 (16.50) | 51.13 (17.14) |
| Income below $50k | 0.30 (0.46) | 0.31 (0.46) | 0.15 (0.36) | 0.13 (0.34) |
| Income between $50k and $100k | 0.33 (0.47) | 0.35 (0.48) | 0.28 (0.45) | 0.28 (0.45) |
| Income above $100k | 0.37 (0.48) | 0.34 (0.47) | 0.57 (0.49) | 0.59 (0.49) |
| Employed | 0.69 (0.46) | 0.65 (0.48) | 0.70 (0.46) | 0.69 (0.46) |
| Unemployed (not retired, no disabilities) | 0.06 (0.24) | 0.07 (0.25) | 0.05 (0.22) | 0.04 (0.20) |
| Retired | 0.21 (0.41) | 0.22 (0.41) | 0.22 (0.42) | 0.24 (0.43) |
| Has disabilities | 0.01 (0.11) | 0.03 (0.17) | 0.01 (0.07) | 0.01 (0.12) |
| Married | 0.63 (0.48) | 0.56 (0.50) | 0.68 (0.47) | 0.67 (0.47) |
| Presence of children aged below 18 | 0.28 (0.45) | 0.30 (0.46) | 0.24 (0.43) | 0.26 (0.44) |
| (1) Emergency Fund Availability | (2) Spending Less Than Income | (3) Perceived Financial Comfort | (4) No Credit Card Debt | |
|---|---|---|---|---|
| Constant | 0.31 *** (0.06) | 0.48 *** (0.06) | 0.60 *** (0.04) | 0.49 *** (0.07) |
| FL | 0.03 ** (0.01) | 0.05 *** (0.01) | −0.02 * (0.01) | 0.07 *** (0.01) |
| Year_2018 | 0.01 (0.01) | −0.004 (0.01) | 0.004 (0.01) | 0.01 (0.01) |
| Year_2019 | 0.02 * (0.01) | −0.002 (0.01) | 0.01 (0.01) | 0.03 ** (0.01) |
| Year_2020 | −0.04 ** (0.01) | 0.02 (0.01) | −0.07 *** (0.01) | 0.01 (0.01) |
| Year_2021 | −0.01 (0.01) | 0.02 (0.01) | −0.05 *** (0.01) | 0.04 * (0.02) |
| Year_2022 | −0.06 *** (0.01) | −0.06 *** (0.01) | −0.10 *** (0.01) | 0.02 (0.02) |
| Alabama | −0.08 (0.06) | −0.12 * (0.06) | 0.01 (0.05) | −0.09 (0.08) |
| Arkansas | −0.14 * (0.07) | −0.15 * (0.06) | −0.02 (0.05) | −0.06 (0.08) |
| Arizona | −0.07 (0.06) | −0.15 * (0.06) | 0.01 (0.04) | −0.07 (0.07) |
| California | −0.06 (0.06) | −0.14 * (0.06) | −0.04 (0.04) | −0.05 (0.07) |
| Colorado | −0.04 (0.06) | −0.13 * (0.06) | −0.01 (0.04) | −0.04 (0.07) |
| Connecticut | −0.07 (0.06) | −0.12 * (0.06) | −0.05 (0.05) | −0.09 (0.07) |
| District of Columbia | −0.02 (0.07) | −0.13 † (0.07) | 0.04 (0.05) | −0.04 (0.08) |
| Delaware | −0.06 (0.07) | −0.18 ** (0.07) | −0.06 (0.06) | −0.05 (0.08) |
| Florida | −0.05 (0.06) | −0.16 ** (0.06) | −0.01 (0.04) | −0.07 (0.07) |
| Georgia | −0.03 (0.06) | −0.11 † (0.06) | 0.004 (0.04) | −0.07 (0.07) |
| Hawaii | −0.04 (0.07) | −0.11 (0.07) | −0.06 (0.06) | −0.01 (0.08) |
| Iowa | −0.05 (0.06) | −0.06 (0.06) | 0.01 (0.04) | 0.03 (0.08) |
| Idaho | −0.05 (0.06) | −0.10 (0.06) | 0.04 (0.05) | 0.02 (0.08) |
| Illinois | −0.06 (0.06) | −0.13 * (0.06) | −0.01 (0.04) | −0.06 (0.07) |
| Indiana | −0.09 (0.06) | −0.10 † (0.06) | −0.01 (0.04) | −0.09 (0.07) |
| Kansas | −0.05 (0.06) | −0.14 * (0.06) | 0.0004 (0.05) | −0.10 (0.08) |
| Kentucky | −0.12 † (0.06) | −0.13 * (0.06) | −0.0002 (0.05) | −0.09 (0.08) |
| Louisiana | −0.06 (0.06) | −0.11 † (0.06) | −0.02 (0.05) | −0.09 (0.08) |
| Massachusetts | −0.05 (0.06) | −0.14 * (0.06) | −0.01 (0.04) | −0.05 (0.07) |
| Maryland | −0.04 (0.06) | −0.09 (0.06) | 0.03 (0.04) | −0.04 (0.07) |
| Maine | 0.07 (0.07) | −0.07 (0.07) | 0.03 (0.05) | 0.07 (0.08) |
| Michigan | −0.06 (0.06) | −0.15 * (0.06) | 0.01 (0.04) | −0.06 (0.07) |
| Minnesota | −0.03 (0.06) | −0.13 * (0.06) | 0.03 (0.04) | −0.03 (0.07) |
| Missouri | −0.07 (0.06) | −0.10 † (0.06) | −0.01 (0.04) | −0.07 (0.07) |
| Mississippi | −0.10 (0.07) | −0.13 * (0.07) | 0.01 (0.05) | −0.16 * (0.08) |
| Montana | −0.17 * (0.07) | −0.18 * (0.08) | −0.16 * (0.07) | −0.18 * (0.09) |
| North Carolina | −0.08 (0.06) | −0.14 * (0.06) | 0.01 (0.04) | −0.12 † (0.07) |
| North Dakota | 0.03 (0.07) | 0.04 (0.07) | 0.06 (0.05) | 0.15 † (0.08) |
| Nebraska | −0.09 (0.07) | −0.12 † (0.06) | 0.004 (0.05) | −0.12 (0.08) |
| New Hampshire | −0.09 (0.07) | −0.16 * (0.07) | −0.02 (0.05) | −0.08 (0.08) |
| New Jersey | −0.03 (0.06) | −0.14 * (0.06) | −0.05 (0.04) | −0.05 (0.07) |
| New Mexico | −0.13 † (0.07) | −0.15 * (0.07) | −0.002 (0.05) | −0.11 (0.08) |
| Nevada | −0.07 (0.07) | −0.14 * (0.06) | −0.03 (0.05) | −0.13 † (0.08) |
| New York | −0.07 (0.06) | −0.14 * (0.06) | −0.02 (0.04) | −0.01 (0.07) |
| Ohio | −0.06 (0.06) | −0.08 (0.06) | 0.03 (0.04) | −0.03 (0.07) |
| Oklahoma | −0.15 * (0.06) | −0.13 * (0.06) | −0.09 † (0.05) | −0.13 (0.08) |
| Oregon | −0.08 (0.06) | −0.13 * (0.06) | 0.04 (0.04) | −0.06 (0.07) |
| Pennsylvania | −0.03 (0.06) | −0.09 (0.06) | 0.01 (0.04) | −0.05 (0.07) |
| Rhode Island | −0.04 (0.07) | −0.08 (0.07) | 0.04 (0.05) | −0.14 (0.08) |
| South Carolina | −0.10 † (0.06) | −0.12 * (0.06) | −0.04 (0.05) | −0.07 (0.07) |
| South Dakota | −0.09 (0.07) | −0.19 ** (0.07) | −0.01 (0.06) | −0.002 (0.08) |
| Tennessee | −0.06 (0.06) | −0.10 † (0.06) | −0.02 (0.04) | −0.10 (0.07) |
| Texas | −0.09 (0.06) | −0.13 * (0.06) | −0.02 (0.04) | −0.09 (0.07) |
| Utah | −0.04 (0.06) | −0.13 * (0.06) | −0.03 (0.05) | −0.01 (0.07) |
| Virginia | −0.07 (0.06) | −0.12 * (0.06) | −0.01 (0.04) | −0.08 (0.07) |
| Vermont | −0.04 (0.08) | −0.05 (0.08) | 0.04 (0.06) | −0.07 (0.09) |
| Washington | −0.02 (0.06) | −0.07 (0.06) | 0.03 (0.04) | −0.06 (0.07) |
| Wisconsin | −0.08 (0.06) | −0.10 † (0.06) | 0.01 (0.04) | −0.03 (0.07) |
| West Virginia | −0.16 * (0.07) | −0.19 ** (0.07) | −0.03 (0.05) | −0.14 (0.08) |
| Wyoming | −0.12 (0.08) | −0.27 ** (0.08) | 0.03 (0.07) | 0.02 (0.10) |
| Female | −0.001 (0.01) | −0.02 *** (0.01) | 0.01 (0.004) | −0.03 *** (0.01) |
| Black | −0.09 *** (0.01) | −0.04 *** (0.01) | −0.04 *** (0.01) | −0.27 *** (0.01) |
| Hispanic | −0.03 ** (0.01) | −0.03 *** (0.01) | −0.04 *** (0.01) | −0.13 *** (0.01) |
| Other | −0.004 (0.01) | 0.01 (0.01) | −0.02 † (0.01) | 0.06 *** (0.01) |
| College | 0.13 *** (0.01) | 0.03 *** (0.01) | 0.07 *** (0.004) | 0.13 *** (0.01) |
| Age | 0.003 *** (0.0002) | 0.001 *** (0.0002) | 0.0002 (0.0002) | −0.001 *** (0.0002) |
| Income between $50k and $100k | 0.12 *** (0.01) | 0.13 *** (0.01) | 0.19 *** (0.01) | 0.01 † (0.01) |
| Income above $100k | 0.22 *** (0.01) | 0.24 *** (0.01) | 0.28 *** (0.01) | 0.10 *** (0.01) |
| Unemployed (not retired, no disabilities) | −0.07 *** (0.01) | −0.07 *** (0.01) | −0.03 ** (0.01) | 0.12 *** (0.01) |
| Retired | 0.09 *** (0.01) | 0.01 (0.01) | 0.07 *** (0.01) | 0.20 *** (0.01) |
| Has disabilities | −0.18 *** (0.02) | −0.13 *** (0.02) | −0.20 *** (0.02) | −0.06 * (0.02) |
| Married | 0.06 *** (0.01) | 0.04 *** (0.01) | 0.05 *** (0.01) | 0.002 (0.01) |
| Presence of children aged below 18 | −0.07 *** (0.01) | −0.09 *** (0.01) | −0.05 *** (0.01) | −0.07 *** (0.01) |
| FL × Post | 0.06 *** (0.01) | −0.01 (0.01) | 0.06 *** (0.01) | 0.03 * (0.01) |
| Observations | 42,661 | 42,661 | 42,661 | 38,501 |
| Adj. R2 | 0.18 | 0.09 | 0.18 | 0.13 |
| (1) Emergency Fund Availability | (2) Spending Less Than Income | (3) Perceived Financial Comfort | (4) No Credit Card Debt | |
|---|---|---|---|---|
| Constant | 0.27 *** (0.06) | 0.39 *** (0.06) | 0.63 *** (0.05) | 0.43 *** (0.08) |
| FL | 0.02 ** (0.01) | 0.05 *** (0.01) | −0.02 ** (0.01) | 0.04 *** (0.01) |
| Year_2018 | 0.01 (0.01) | −0.004 (0.01) | 0.004 (0.01) | 0.01 (0.01) |
| Year_2019 | 0.02 * (0.01) | −0.002 (0.01) | 0.01 (0.01) | 0.03 ** (0.01) |
| Year_2020 | −0.07 * (0.03) | 0.05 † (0.03) | −0.12 *** (0.02) | −0.004 (0.03) |
| Year_2021 | −0.04 (0.03) | 0.05 † (0.03) | −0.10 *** (0.02) | 0.02 (0.03) |
| Year_2022 | −0.09 ** (0.03) | −0.03 (0.03) | −0.15 *** (0.02) | 0.001 (0.03) |
| Alabama | −0.08 (0.06) | −0.12 * (0.06) | 0.01 (0.05) | −0.10 (0.08) |
| Arkansas | −0.14 * (0.07) | −0.15 * (0.06) | −0.02 (0.05) | −0.06 (0.08) |
| Arizona | −0.07 (0.06) | −0.15 * (0.06) | 0.01 (0.04) | −0.07 (0.07) |
| California | −0.06 (0.06) | −0.13 * (0.06) | −0.04 (0.04) | −0.05 (0.07) |
| Colorado | −0.04 (0.06) | −0.13 * (0.06) | −0.01 (0.04) | −0.04 (0.07) |
| Connecticut | −0.07 (0.06) | −0.12 * (0.06) | −0.06 (0.05) | −0.09 (0.07) |
| District of Columbia | −0.02 (0.07) | −0.13 † (0.07) | 0.04 (0.05) | −0.04 (0.08) |
| Delaware | −0.06 (0.07) | −0.18 * (0.07) | −0.07 (0.06) | −0.05 (0.08) |
| Florida | −0.05 (0.06) | −0.16 ** (0.06) | −0.01 (0.04) | −0.07 (0.07) |
| Georgia | −0.02 (0.06) | −0.11 † (0.06) | 0.003 (0.04) | −0.07 (0.07) |
| Hawaii | −0.03 (0.07) | −0.11 (0.07) | −0.06 (0.06) | −0.01 (0.08) |
| Iowa | −0.05 (0.06) | −0.06 (0.06) | 0.01 (0.04) | 0.04 (0.08) |
| Idaho | −0.05 (0.06) | −0.09 (0.06) | 0.05 (0.05) | 0.02 (0.08) |
| Illinois | −0.06 (0.06) | −0.13 * (0.06) | −0.01 (0.04) | −0.06 (0.07) |
| Indiana | −0.09 (0.06) | −0.10 † (0.06) | −0.02 (0.04) | −0.09 (0.07) |
| Kansas | −0.05 (0.06) | −0.14 * (0.06) | 0.0001 (0.05) | −0.10 (0.08) |
| Kentucky | −0.12 † (0.06) | −0.12 * (0.06) | −0.001 (0.05) | −0.09 (0.07) |
| Louisiana | −0.06 (0.06) | −0.10 † (0.06) | −0.02 (0.05) | −0.09 (0.08) |
| Massachusetts | −0.05 (0.06) | −0.14 * (0.06) | −0.01 (0.04) | −0.05 (0.07) |
| Maryland | −0.03 (0.06) | −0.09 (0.06) | 0.03 (0.04) | −0.03 (0.07) |
| Maine | 0.07 (0.07) | −0.07 (0.07) | 0.02 (0.05) | 0.07 (0.08) |
| Michigan | −0.06 (0.06) | −0.15 * (0.06) | 0.01 (0.04) | −0.06 (0.07) |
| Minnesota | −0.02 (0.06) | −0.13 * (0.06) | 0.03 (0.04) | −0.03 (0.07) |
| Missouri | −0.07 (0.06) | −0.10 † (0.06) | −0.01 (0.04) | −0.07 (0.07) |
| Mississippi | −0.09 (0.07) | −0.13 * (0.07) | 0.01 (0.05) | −0.16 * (0.08) |
| Montana | −0.17 * (0.07) | −0.18 * (0.08) | −0.16 * (0.07) | −0.19 * (0.09) |
| North Carolina | −0.08 (0.06) | −0.14 * (0.06) | 0.01 (0.04) | −0.12 † (0.07) |
| North Dakota | 0.03 (0.07) | 0.04 (0.07) | 0.06 (0.05) | 0.15 † (0.08) |
| Nebraska | −0.08 (0.07) | −0.12 † (0.06) | 0.003 (0.05) | −0.12 (0.08) |
| New Hampshire | −0.09 (0.07) | −0.16 * (0.07) | −0.02 (0.05) | −0.08 (0.08) |
| New Jersey | −0.03 (0.06) | −0.13 * (0.06) | −0.05 (0.04) | −0.06 (0.07) |
| New Mexico | −0.13 † (0.07) | −0.15 * (0.07) | −0.004 (0.05) | −0.12 (0.08) |
| Nevada | −0.07 (0.07) | −0.14 * (0.06) | −0.03 (0.05) | −0.14 † (0.08) |
| New York | −0.07 (0.06) | −0.14 * (0.06) | −0.02 (0.04) | −0.01 (0.07) |
| Ohio | −0.06 (0.06) | −0.08 (0.06) | 0.03 (0.04) | −0.03 (0.07) |
| Oklahoma | −0.15 * (0.06) | −0.12 † (0.06) | −0.09 † (0.05) | −0.13 (0.08) |
| Oregon | −0.08 (0.06) | −0.13 * (0.06) | 0.04 (0.04) | −0.05 (0.07) |
| Pennsylvania | −0.03 (0.06) | −0.09 (0.06) | 0.01 (0.04) | −0.05 (0.07) |
| Rhode Island | −0.04 (0.07) | −0.07 (0.07) | 0.04 (0.05) | −0.13 (0.08) |
| South Carolina | −0.10 † (0.06) | −0.12 * (0.06) | −0.04 (0.05) | −0.07 (0.07) |
| South Dakota | −0.09 (0.07) | −0.19 * (0.07) | −0.01 (0.06) | −0.002 (0.08) |
| Tennessee | −0.06 (0.06) | −0.10 † (0.06) | −0.02 (0.04) | −0.10 (0.07) |
| Texas | −0.08 (0.06) | −0.13 * (0.06) | −0.02 (0.04) | −0.09 (0.07) |
| Utah | −0.03 (0.06) | −0.13 * (0.06) | −0.03 (0.05) | −0.01 (0.07) |
| Virginia | −0.07 (0.06) | −0.12 * (0.06) | −0.01 (0.04) | −0.08 (0.07) |
| Vermont | −0.04 (0.08) | −0.04 (0.08) | 0.04 (0.06) | −0.07 (0.09) |
| Washington | −0.02 (0.06) | −0.07 (0.06) | 0.03 (0.04) | −0.05 (0.07) |
| Wisconsin | −0.08 (0.06) | −0.10 † (0.06) | 0.01 (0.04) | −0.03 (0.07) |
| West Virginia | −0.16 * (0.07) | −0.19 ** (0.07) | −0.04 (0.05) | −0.14 (0.08) |
| Wyoming | −0.11 (0.08) | −0.27 ** (0.08) | 0.03 (0.07) | 0.03 (0.10) |
| Female | −0.003 (0.01) | −0.02 *** (0.01) | 0.01 (0.004) | −0.03 *** (0.01) |
| Black | −0.09 *** (0.01) | −0.03 *** (0.01) | −0.05 *** (0.01) | −0.27 *** (0.01) |
| Hispanic | −0.03 *** (0.01) | −0.03 ** (0.01) | −0.04 *** (0.01) | −0.13 *** (0.01) |
| Other | −0.004 (0.01) | 0.01 (0.01) | −0.02 † (0.01) | 0.06 *** (0.01) |
| College | 0.13 *** (0.01) | 0.03 *** (0.01) | 0.07 *** (0.004) | 0.14 *** (0.01) |
| Age | 0.003 *** (0.0002) | 0.001 *** (0.0002) | 0.0002 (0.0002) | −0.001 *** (0.0002) |
| Income between $50k and $100k | 0.12 *** (0.01) | 0.13 *** (0.01) | 0.19 *** (0.01) | 0.01 † (0.01) |
| Income above $100k | 0.23 *** (0.01) | 0.24 *** (0.01) | 0.28 *** (0.01) | 0.10 *** (0.01) |
| Unemployed (not retired, no disabilities) | −0.07 *** (0.01) | −0.07 *** (0.01) | −0.03 ** (0.01) | 0.12 *** (0.01) |
| Retired | 0.09 *** (0.01) | 0.01 (0.01) | 0.07 *** (0.01) | 0.20 *** (0.01) |
| Has disabilities | −0.18 *** (0.02) | −0.13 *** (0.02) | −0.20 *** (0.02) | −0.06 * (0.02) |
| Married | 0.06 *** (0.01) | 0.04 *** (0.01) | 0.05 *** (0.01) | 0.003 (0.01) |
| Presence of children aged below 18 | −0.07 *** (0.01) | −0.08 *** (0.01) | −0.05 *** (0.01) | −0.07 *** (0.01) |
| FL × Post | 0.03 ** (0.01) | −0.01 (0.01) | 0.04 *** (0.01) | 0.01 (0.01) |
| Observations | 42,661 | 42,661 | 42,661 | 38,501 |
| Adj. R2 | 0.18 | 0.09 | 0.18 | 0.12 |
| (1) Emergency Fund Availability | (2) Spending Less Than Income | (3) Perceived Financial Comfort | (4) No Credit Card Debt | |
|---|---|---|---|---|
| Constant | 0.31 *** (0.06) | 0.49 *** (0.06) | 0.59 *** (0.05) | 0.50 *** (0.07) |
| FL | 0.04 * (0.02) | 0.04 * (0.02) | −0.03 * (0.01) | 0.08 *** (0.02) |
| Year_2018 | 0.03 (0.03) | −0.04 (0.03) | 0.01 (0.02) | 0.01 (0.03) |
| Year_2019 | 0.02 (0.03) | −0.01 (0.03) | 0.02 (0.02) | 0.02 (0.03) |
| Year_2020 | −0.05 * (0.02) | 0.01 (0.02) | −0.07 *** (0.02) | 0.01 (0.02) |
| Year_2021 | −0.0001 (0.02) | 0.01 (0.02) | −0.03 † (0.02) | 0.03 (0.02) |
| Year_2022 | −0.06 ** (0.02) | −0.07 ** (0.02) | −0.09 *** (0.02) | 0.02 (0.02) |
| Alabama | −0.08 (0.06) | −0.12 * (0.06) | 0.01 (0.05) | −0.09 (0.08) |
| Arkansas | −0.14 * (0.07) | −0.15 * (0.06) | −0.02 (0.05) | −0.06 (0.08) |
| Arizona | −0.07 (0.06) | −0.15 * (0.06) | 0.01 (0.04) | −0.07 (0.07) |
| California | −0.06 (0.06) | −0.14 * (0.06) | −0.04 (0.04) | −0.05 (0.07) |
| Colorado | −0.04 (0.06) | −0.13 * (0.06) | −0.01 (0.04) | −0.04 (0.07) |
| Connecticut | −0.07 (0.06) | −0.12 * (0.06) | −0.05 (0.05) | −0.09 (0.07) |
| District of Columbia | −0.02 (0.07) | −0.13 † (0.07) | 0.04 (0.05) | −0.04 (0.08) |
| Delaware | −0.07 (0.07) | −0.18 ** (0.07) | −0.06 (0.06) | −0.05 (0.08) |
| Florida | −0.05 (0.06) | −0.16 ** (0.06) | −0.01 (0.04) | −0.07 (0.07) |
| Georgia | −0.03 (0.06) | −0.11 † (0.06) | 0.004 (0.04) | −0.07 (0.07) |
| Hawaii | −0.04 (0.07) | −0.11 (0.07) | −0.06 (0.06) | −0.01 (0.08) |
| Iowa | −0.05 (0.06) | −0.06 (0.06) | 0.01 (0.04) | 0.03 (0.08) |
| Idaho | −0.05 (0.06) | −0.10 (0.06) | 0.04 (0.05) | 0.02 (0.08) |
| Illinois | −0.06 (0.06) | −0.13 * (0.06) | −0.01 (0.04) | −0.06 (0.07) |
| Indiana | −0.09 (0.06) | −0.10 † (0.06) | −0.01 (0.04) | −0.09 (0.07) |
| Kansas | −0.05 (0.06) | −0.14 * (0.06) | 0.0004 (0.05) | −0.10 (0.08) |
| Kentucky | −0.12 † (0.06) | −0.13 * (0.06) | −0.0002 (0.05) | −0.09 (0.07) |
| Louisiana | −0.06 (0.06) | −0.11 † (0.06) | −0.02 (0.05) | −0.09 (0.08) |
| Massachusetts | −0.05 (0.06) | −0.14 * (0.06) | −0.01 (0.04) | −0.05 (0.07) |
| Maryland | −0.04 (0.06) | −0.09 (0.06) | 0.03 (0.04) | −0.04 (0.07) |
| Maine | 0.07 (0.07) | −0.07 (0.07) | 0.03 (0.05) | 0.07 (0.08) |
| Michigan | −0.06 (0.06) | −0.15 * (0.06) | 0.01 (0.04) | −0.06 (0.07) |
| Minnesota | −0.03 (0.06) | −0.13 * (0.06) | 0.03 (0.04) | −0.03 (0.07) |
| Missouri | −0.07 (0.06) | −0.10 † (0.06) | −0.01 (0.04) | −0.07 (0.07) |
| Mississippi | −0.10 (0.07) | −0.13 * (0.07) | 0.01 (0.05) | −0.16 * (0.08) |
| Montana | −0.17 * (0.07) | −0.18 * (0.08) | −0.16 * (0.07) | −0.18 * (0.09) |
| North Carolina | −0.08 (0.06) | −0.14 * (0.06) | 0.01 (0.04) | −0.12 † (0.07) |
| North Dakota | 0.03 (0.07) | 0.04 (0.07) | 0.06 (0.05) | 0.15 † (0.08) |
| Nebraska | −0.08 (0.07) | −0.12 † (0.06) | 0.004 (0.05) | −0.12 (0.08) |
| New Hampshire | −0.09 (0.07) | −0.16 * (0.07) | −0.02 (0.05) | −0.08 (0.08) |
| New Jersey | −0.03 (0.06) | −0.14 * (0.06) | −0.05 (0.04) | −0.05 (0.07) |
| New Mexico | −0.13 † (0.07) | −0.15 * (0.07) | −0.002 (0.05) | −0.11 (0.08) |
| Nevada | −0.07 (0.07) | −0.14 * (0.06) | −0.03 (0.05) | −0.13 † (0.08) |
| New York | −0.07 (0.06) | −0.14 * (0.06) | −0.02 (0.04) | −0.01 (0.07) |
| Ohio | −0.06 (0.06) | −0.08 (0.06) | 0.03 (0.04) | −0.03 (0.07) |
| Oklahoma | −0.15 * (0.06) | −0.13 * (0.06) | −0.09 † (0.05) | −0.13 (0.08) |
| Oregon | −0.08 (0.06) | −0.13 * (0.06) | 0.04 (0.04) | −0.06 (0.07) |
| Pennsylvania | −0.03 (0.06) | −0.09 (0.06) | 0.01 (0.04) | −0.05 (0.07) |
| Rhode Island | −0.04 (0.07) | −0.08 (0.07) | 0.04 (0.05) | −0.14 (0.08) |
| South Carolina | −0.10 † (0.06) | −0.12 * (0.06) | −0.04 (0.05) | −0.07 (0.07) |
| South Dakota | −0.09 (0.07) | −0.19 ** (0.07) | −0.01 (0.06) | −0.001 (0.08) |
| Tennessee | −0.06 (0.06) | −0.10 † (0.06) | −0.02 (0.04) | −0.10 (0.07) |
| Texas | −0.08 (0.06) | −0.13 * (0.06) | −0.02 (0.04) | −0.09 (0.07) |
| Utah | −0.04 (0.06) | −0.13 * (0.06) | −0.03 (0.05) | −0.01 (0.07) |
| Virginia | −0.07 (0.06) | −0.12 * (0.06) | −0.01 (0.04) | −0.08 (0.07) |
| Vermont | −0.04 (0.08) | −0.04 (0.08) | 0.04 (0.06) | −0.07 (0.09) |
| Washington | −0.02 (0.06) | −0.07 (0.06) | 0.03 (0.04) | −0.06 (0.07) |
| Wisconsin | −0.08 (0.06) | −0.10 † (0.06) | 0.01 (0.04) | −0.03 (0.07) |
| West Virginia | −0.16 * (0.07) | −0.19 ** (0.07) | −0.03 (0.05) | −0.14 (0.08) |
| Wyoming | −0.12 (0.08) | −0.27 ** (0.08) | 0.03 (0.07) | 0.02 (0.10) |
| Female | −0.001 (0.01) | −0.02 *** (0.01) | 0.01 (0.004) | −0.03 *** (0.01) |
| Black | −0.09 *** (0.01) | −0.04 *** (0.01) | −0.04 *** (0.01) | −0.27 *** (0.01) |
| Hispanic | −0.03 *** (0.01) | −0.03 *** (0.01) | −0.04 *** (0.01) | −0.13 *** (0.01) |
| Other | −0.004 (0.01) | 0.01 (0.01) | −0.02 † (0.01) | 0.06 *** (0.01) |
| College | 0.13 *** (0.01) | 0.03 *** (0.01) | 0.07 *** (0.004) | 0.13 *** (0.01) |
| Age | 0.003 *** (0.0002) | 0.001 *** (0.0002) | 0.0002 (0.0002) | −0.001 *** (0.0002) |
| Income between $50k and $100k | 0.12 *** (0.01) | 0.13 *** (0.01) | 0.19 *** (0.01) | 0.01 † (0.01) |
| Income above $100k | 0.22 *** (0.01) | 0.24 *** (0.01) | 0.28 *** (0.01) | 0.10 *** (0.01) |
| Unemployed (not retired, no disabilities) | −0.07 *** (0.01) | −0.07 *** (0.01) | −0.03 ** (0.01) | 0.12 *** (0.01) |
| Retired | 0.09 *** (0.01) | 0.01 (0.01) | 0.07 *** (0.01) | 0.20 *** (0.01) |
| Has disabilities | −0.18 *** (0.02) | −0.13 *** (0.02) | −0.20 *** (0.02) | −0.06 * (0.02) |
| Married | 0.06 *** (0.01) | 0.03 *** (0.01) | 0.05 *** (0.01) | 0.002 (0.01) |
| Presence of children aged below 18 | −0.07 *** (0.01) | −0.09 *** (0.01) | −0.05 *** (0.01) | −0.07 *** (0.01) |
| FL × Year_2017 | −0.01 (0.03) | −0.01 (0.03) | 0.02 (0.02) | −0.02 (0.03) |
| FL × Year_2018 | −0.02 (0.03) | 0.04 (0.03) | 0.01 (0.02) | −0.02 (0.03) |
| FL × Year_2020 | 0.07 ** (0.02) | 0.001 (0.02) | 0.08 *** (0.02) | 0.02 (0.02) |
| FL × Year_2021 | 0.03 (0.02) | 0.01 (0.02) | 0.06 *** (0.02) | 0.02 (0.02) |
| FL × Year_2022 | 0.06 ** (0.02) | 0.01 (0.02) | 0.08 *** (0.02) | 0.01 (0.02) |
| Observations | 42,661 | 42,661 | 42,661 | 38,501 |
| Adj. R2 | 0.18 | 0.09 | 0.18 | 0.13 |
| (1) Emergency Fund Availability | (2) Spending Less Than Income | (3) Perceived Financial Comfort | (4) No Credit Card Debt | |
|---|---|---|---|---|
| Constant | 0.26 *** (0.07) | 0.43 *** (0.07) | 0.60 *** (0.06) | 0.45 *** (0.09) |
| FL | 0.03 † (0.01) | 0.04 ** (0.01) | −0.03 * (0.01) | 0.06 *** (0.01) |
| Year_2018 | 0.04 (0.06) | −0.11 † (0.06) | 0.04 (0.05) | 0.01 (0.07) |
| Year_2019 | 0.03 (0.06) | −0.02 (0.06) | 0.06 (0.05) | −0.03 (0.06) |
| Year_2020 | −0.07 (0.05) | 0.02 (0.05) | −0.10 * (0.05) | −0.04 (0.05) |
| Year_2021 | −0.01 (0.05) | 0.02 (0.05) | −0.06 (0.05) | 0.01 (0.05) |
| Year_2022 | −0.09 † (0.05) | −0.08 (0.05) | −0.13 ** (0.05) | −0.02 (0.05) |
| Alabama | −0.08 (0.06) | −0.12 * (0.06) | 0.01 (0.05) | −0.10 (0.08) |
| Arkansas | −0.14 * (0.07) | −0.15 * (0.06) | −0.02 (0.05) | −0.06 (0.08) |
| Arizona | −0.07 (0.06) | −0.15 * (0.06) | 0.01 (0.04) | −0.07 (0.07) |
| California | −0.06 (0.06) | −0.13 * (0.06) | −0.04 (0.04) | −0.05 (0.07) |
| Colorado | −0.04 (0.06) | −0.13 * (0.06) | −0.01 (0.04) | −0.04 (0.07) |
| Connecticut | −0.07 (0.06) | −0.12 * (0.06) | −0.06 (0.05) | −0.09 (0.07) |
| District of Columbia | −0.02 (0.07) | −0.13 † (0.07) | 0.04 (0.05) | −0.04 (0.08) |
| Delaware | −0.06 (0.07) | −0.18 * (0.07) | −0.07 (0.06) | −0.04 (0.08) |
| Florida | −0.05 (0.06) | −0.16 ** (0.06) | −0.01 (0.04) | −0.07 (0.07) |
| Georgia | −0.02 (0.06) | −0.11 † (0.06) | 0.003 (0.04) | −0.07 (0.07) |
| Hawaii | −0.03 (0.07) | −0.11 (0.07) | −0.06 (0.06) | −0.01 (0.08) |
| Iowa | −0.05 (0.06) | −0.06 (0.06) | 0.01 (0.04) | 0.04 (0.08) |
| Idaho | −0.05 (0.06) | −0.09 (0.06) | 0.05 (0.05) | 0.02 (0.08) |
| Illinois | −0.06 (0.06) | −0.13 * (0.06) | −0.01 (0.04) | −0.06 (0.07) |
| Indiana | −0.09 (0.06) | −0.10 † (0.06) | −0.02 (0.04) | −0.09 (0.07) |
| Kansas | −0.05 (0.06) | −0.14 * (0.06) | 0.0001 (0.05) | −0.10 (0.08) |
| Kentucky | −0.12 † (0.06) | −0.12 * (0.06) | −0.001 (0.05) | −0.09 (0.07) |
| Louisiana | −0.06 (0.06) | −0.10 † (0.06) | −0.02 (0.05) | −0.09 (0.08) |
| Massachusetts | −0.05 (0.06) | −0.14 * (0.06) | −0.01 (0.04) | −0.05 (0.07) |
| Maryland | −0.03 (0.06) | −0.09 (0.06) | 0.03 (0.04) | −0.03 (0.07) |
| Maine | 0.07 (0.07) | −0.07 (0.07) | 0.02 (0.05) | 0.07 (0.08) |
| Michigan | −0.06 (0.06) | −0.14 * (0.06) | 0.01 (0.04) | −0.06 (0.07) |
| Minnesota | −0.02 (0.06) | −0.13 * (0.06) | 0.03 (0.04) | −0.03 (0.07) |
| Missouri | −0.07 (0.06) | −0.10 † (0.06) | −0.01 (0.04) | −0.07 (0.07) |
| Mississippi | −0.09 (0.07) | −0.13 * (0.06) | 0.01 (0.05) | −0.16 * (0.08) |
| Montana | −0.17 * (0.07) | −0.18 * (0.08) | −0.16 * (0.07) | −0.18 * (0.09) |
| North Carolina | −0.08 (0.06) | −0.14 * (0.06) | 0.01 (0.04) | −0.12 † (0.07) |
| North Dakota | 0.03 (0.07) | 0.04 (0.07) | 0.06 (0.05) | 0.15 † (0.08) |
| Nebraska | −0.08 (0.07) | −0.12 † (0.06) | 0.003 (0.05) | −0.12 (0.08) |
| New Hampshire | −0.09 (0.07) | −0.16 * (0.07) | −0.02 (0.05) | −0.08 (0.08) |
| New Jersey | −0.03 (0.06) | −0.13 * (0.06) | −0.05 (0.04) | −0.06 (0.07) |
| New Mexico | −0.13 † (0.07) | −0.15 * (0.07) | −0.003 (0.05) | −0.11 (0.08) |
| Nevada | −0.06 (0.07) | −0.14 * (0.06) | −0.03 (0.05) | −0.13 † (0.08) |
| New York | −0.07 (0.06) | −0.13 * (0.06) | −0.02 (0.04) | −0.01 (0.07) |
| Ohio | −0.06 (0.06) | −0.08 (0.06) | 0.03 (0.04) | −0.03 (0.07) |
| Oklahoma | −0.15 * (0.06) | −0.12 † (0.06) | −0.09 † (0.05) | −0.13 (0.08) |
| Oregon | −0.08 (0.06) | −0.13 * (0.06) | 0.04 (0.04) | −0.05 (0.07) |
| Pennsylvania | −0.03 (0.06) | −0.09 (0.06) | 0.01 (0.04) | −0.05 (0.07) |
| Rhode Island | −0.04 (0.07) | −0.07 (0.07) | 0.04 (0.05) | −0.13 (0.08) |
| South Carolina | −0.10 † (0.06) | −0.12 * (0.06) | −0.04 (0.05) | −0.07 (0.07) |
| South Dakota | −0.09 (0.07) | −0.19 * (0.07) | −0.01 (0.06) | −0.001 (0.08) |
| Tennessee | −0.06 (0.06) | −0.10 † (0.06) | −0.02 (0.04) | −0.10 (0.07) |
| Texas | −0.08 (0.06) | −0.13 * (0.06) | −0.02 (0.04) | −0.09 (0.07) |
| Utah | −0.03 (0.06) | −0.13 * (0.06) | −0.03 (0.05) | −0.01 (0.07) |
| Virginia | −0.07 (0.06) | −0.12 * (0.06) | −0.01 (0.04) | −0.08 (0.07) |
| Vermont | −0.04 (0.08) | −0.04 (0.08) | 0.04 (0.06) | −0.07 (0.09) |
| Washington | −0.02 (0.06) | −0.07 (0.06) | 0.03 (0.04) | −0.05 (0.07) |
| Wisconsin | −0.08 (0.06) | −0.10 † (0.06) | 0.01 (0.04) | −0.03 (0.07) |
| West Virginia | −0.16 * (0.07) | −0.19 ** (0.07) | −0.04 (0.05) | −0.14 (0.08) |
| Wyoming | −0.11 (0.08) | −0.27 ** (0.08) | 0.03 (0.07) | 0.03 (0.10) |
| Female | −0.003 (0.01) | −0.02 *** (0.01) | 0.01 (0.004) | −0.03 *** (0.01) |
| Black | −0.09 *** (0.01) | −0.03 *** (0.01) | −0.05 *** (0.01) | −0.27 *** (0.01) |
| Hispanic | −0.03 *** (0.01) | −0.03 ** (0.01) | −0.04 *** (0.01) | −0.13 *** (0.01) |
| Other | −0.004 (0.01) | 0.01 (0.01) | −0.02 † (0.01) | 0.06 *** (0.01) |
| College | 0.13 *** (0.01) | 0.03 *** (0.01) | 0.07 *** (0.004) | 0.14 *** (0.01) |
| Age | 0.003 *** (0.0002) | 0.001 *** (0.0002) | 0.0002 (0.0002) | −0.001 *** (0.0002) |
| Income between $50k and $100k | 0.12 *** (0.01) | 0.13 *** (0.01) | 0.19 *** (0.01) | 0.02 † (0.01) |
| Income above $100k | 0.23 *** (0.01) | 0.24 *** (0.01) | 0.29 *** (0.01) | 0.10 *** (0.01) |
| Unemployed (not retired, no disabilities) | −0.07 *** (0.01) | −0.07 *** (0.01) | −0.03 ** (0.01) | 0.12 *** (0.01) |
| Retired | 0.09 *** (0.01) | 0.01 (0.01) | 0.07 *** (0.01) | 0.20 *** (0.01) |
| Has disabilities | −0.18 *** (0.02) | −0.13 *** (0.02) | −0.20 *** (0.02) | −0.06 * (0.02) |
| Married | 0.06 *** (0.01) | 0.04 *** (0.01) | 0.05 *** (0.01) | 0.003 (0.01) |
| Presence of children aged below 18 | −0.07 *** (0.01) | −0.08 *** (0.01) | −0.05 *** (0.01) | −0.07 *** (0.01) |
| FL × Year_2017 | 0.002 (0.02) | −0.01 (0.02) | 0.02 (0.02) | −0.02 (0.02) |
| FL × Year_2018 | −0.01 (0.02) | 0.03 (0.02) | 0.01 (0.02) | −0.02 (0.02) |
| FL × Year_2020 | 0.03 † (0.02) | −0.01 (0.02) | 0.05 *** (0.01) | 0.01 (0.02) |
| FL × Year_2021 | 0.02 (0.02) | −0.01 (0.02) | 0.04 ** (0.01) | −0.01 (0.02) |
| FL × Year_2022 | 0.03 † (0.02) | 0.001 (0.02) | 0.05 *** (0.01) | −0.001 (0.02) |
| Observations | 42,661 | 42,661 | 42,661 | 38,501 |
| Adj. R2 | 0.18 | 0.09 | 0.18 | 0.12 |
Appendix B
| Lower Financial Literacy | Higher Financial Literacy | |||
|---|---|---|---|---|
| 2017–2019 | 2020–2022 | 2017–2019 | 2020–2022 | |
| Sample size | 13,576 | 7282 | 13,897 | 17,489 |
| Female | 0.60 (0.49) | 0.59 (0.49) | 0.39 (0.49) | 0.43 (0.50) |
| White | 0.61 (0.49) | 0.58 (0.49) | 0.76 (0.43) | 0.72 (0.45) |
| Black | 0.13 (0.34) | 0.14 (0.35) | 0.06 (0.23) | 0.07 (0.26) |
| Hispanic | 0.19 (0.39) | 0.20 (0.40) | 0.09 (0.28) | 0.11 (0.32) |
| Other | 0.07 (0.25) | 0.08 (0.26) | 0.09 (0.29) | 0.10 (0.29) |
| College | 0.21 (0.41) | 0.23 (0.42) | 0.55 (0.50) | 0.51 (0.50) |
| Age | 46.91 (17.50) | 46.79 (17.77) | 50.82 (16.79) | 50.28 (17.46) |
| Income below $50k | 0.44 (0.50) | 0.39 (0.49) | 0.17 (0.37) | 0.16 (0.37) |
| Income between $50k and $100k | 0.32 (0.47) | 0.31 (0.46) | 0.28 (0.45) | 0.28 (0.45) |
| Income above $100k | 0.24 (0.43) | 0.29 (0.46) | 0.55 (0.50) | 0.56 (0.50) |
| Employed | 0.60 (0.49) | 0.60 (0.49) | 0.70 (0.46) | 0.68 (0.47) |
| Unemployed (not retired, no disabilities) | 0.13 (0.34) | 0.11 (0.31) | 0.06 (0.24) | 0.05 (0.23) |
| Retired | 0.19 (0.39) | 0.19 (0.39) | 0.22 (0.41) | 0.23 (0.42) |
| Has disabilities | 0.04 (0.20) | 0.06 (0.24) | 0.01 (0.09) | 0.02 (0.15) |
| Married | 0.50 (0.50) | 0.49 (0.50) | 0.66 (0.47) | 0.64 (0.48) |
| Presence of children aged below 18 | 0.29 (0.45) | 0.30 (0.46) | 0.25 (0.43) | 0.26 (0.44) |
| Lower Financial Literacy | Higher Financial Literacy | |||
|---|---|---|---|---|
| 2017–2019 | 2020–2022 | 2017–2019 | 2020–2022 | |
| Sample size | 10,492 | 5827 | 13,106 | 16,348 |
| Female | 0.62 (0.48) | 0.62 (0.49) | 0.40 (0.49) | 0.44 (0.50) |
| White | 0.65 (0.48) | 0.62 (0.49) | 0.77 (0.42) | 0.73 (0.44) |
| Black | 0.11 (0.31) | 0.12 (0.33) | 0.06 (0.23) | 0.07 (0.25) |
| Hispanic | 0.18 (0.38) | 0.19 (0.39) | 0.08 (0.28) | 0.11 (0.31) |
| Other | 0.07 (0.25) | 0.07 (0.26) | 0.09 (0.29) | 0.10 (0.29) |
| College | 0.26 (0.44) | 0.29 (0.45) | 0.57 (0.50) | 0.54 (0.50) |
| Age | 49.13 (17.34) | 49.03 (17.61) | 51.49 (16.50) | 51.13 (17.14) |
| Income below $50k | 0.36 (0.48) | 0.31 (0.46) | 0.15 (0.36) | 0.13 (0.34) |
| Income between $50k and $100k | 0.36 (0.48) | 0.34 (0.47) | 0.28 (0.45) | 0.28 (0.45) |
| Income above $100k | 0.29 (0.45) | 0.35 (0.48) | 0.57 (0.49) | 0.59 (0.49) |
| Employed | 0.64 (0.48) | 0.65 (0.48) | 0.70 (0.46) | 0.69 (0.46) |
| Unemployed (not retired, no disabilities) | 0.09 (0.29) | 0.07 (0.26) | 0.05 (0.22) | 0.04 (0.20) |
| Retired | 0.22 (0.41) | 0.21 (0.41) | 0.22 (0.42) | 0.24 (0.43) |
| Has disabilities | 0.02 (0.15) | 0.03 (0.18) | 0.01 (0.07) | 0.01 (0.12) |
| Married | 0.57 (0.50) | 0.56 (0.50) | 0.68 (0.47) | 0.67 (0.47) |
| Presence of children aged below 18 | 0.27 (0.45) | 0.28 (0.45) | 0.24 (0.43) | 0.26 (0.44) |
| Lower Financial Literacy | Higher Financial Literacy | ||||||
|---|---|---|---|---|---|---|---|
| (1) 2017–2019 | (2) 2020–2022 | Δ1= (2) − (1) | (3) 2017–2019 | (4) 2020–2022 | Δ2= (4) − (3) | DD= Δ2 − Δ1 | |
| Emergency fund availability | 0.39 (0.49) | 0.44 (0.50) | 0.05 *** (0.01) | 0.70 (0.46) | 0.70 (0.46) | −0.00 (0.01) | −0.06 *** (0.01) |
| Spending less than income | 0.45 (0.50) | 0.47 (0.50) | 0.02 * (0.01) | 0.63 (0.48) | 0.61 (0.49) | −0.02 * (0.01) | −0.03 ** (0.01) |
| Perceived financial comfort | 0.67 (0.47) | 0.69 (0.46) | 0.02 ** (0.01) | 0.86 (0.35) | 0.84 (0.36) | −0.02 *** (0.00) | −0.04 *** (0.01) |
| No credit card debt | 0.40 (0.49) | 0.42 (0.49) | 0.02 * (0.01) | 0.59 (0.49) | 0.62 (0.49) | 0.03 *** (0.01) | 0.01 (0.01) |
| (1) Emergency Fund Availability | (2) Spending Less Than Income | (3) Perceived Financial Comfort | (4) No Credit Card Debt | |
|---|---|---|---|---|
| Constant | 0.13 * (0.06) | 0.31 *** (0.07) | 0.48 *** (0.06) | 0.41 *** (0.06) |
| FL | 0.15 *** (0.01) | 0.06 *** (0.01) | 0.06 *** (0.01) | 0.09 *** (0.01) |
| Year_2018 | 0.002 (0.01) | 0.01 † (0.01) | 0.003 (0.01) | 0.01 (0.01) |
| Year_2019 | 0.02 * (0.01) | 0.01 (0.01) | 0.004 (0.01) | 0.02 † (0.01) |
| Year_2020 | 0.05 *** (0.01) | 0.03 ** (0.01) | 0.01 (0.01) | 0.02 † (0.01) |
| Year_2021 | 0.08 *** (0.01) | 0.03 ** (0.01) | 0.03 *** (0.01) | 0.04 *** (0.01) |
| Year_2022 | 0.03 ** (0.01) | −0.03 ** (0.01) | −0.01 (0.01) | 0.02 † (0.01) |
| Alabama | −0.03 (0.06) | −0.05 (0.07) | −0.01 (0.06) | −0.07 (0.07) |
| Arkansas | −0.06 (0.06) | 0.003 (0.07) | 0.002 (0.06) | −0.04 (0.07) |
| Arizona | −0.02 (0.06) | −0.01 (0.07) | 0.01 (0.06) | −0.04 (0.06) |
| California | −0.03 (0.05) | −0.01 (0.07) | −0.02 (0.06) | −0.03 (0.06) |
| Colorado | 0.01 (0.06) | 0.01 (0.07) | 0.01 (0.06) | 0.02 (0.06) |
| Connecticut | −0.02 (0.06) | −0.02 (0.07) | −0.03 (0.06) | −0.07 (0.07) |
| District of Columbia | 0.02 (0.06) | 0.001 (0.08) | 0.07 (0.06) | 0.0002 (0.08) |
| Delaware | −0.04 (0.06) | −0.06 (0.08) | −0.09 (0.06) | −0.04 (0.07) |
| Florida | −0.03 (0.05) | −0.02 (0.07) | −0.01 (0.06) | −0.05 (0.06) |
| Georgia | −0.01 (0.06) | 0.003 (0.07) | 0.01 (0.06) | −0.06 (0.06) |
| Hawaii | 0.04 (0.07) | 0.01 (0.08) | −0.06 (0.07) | −0.02 (0.08) |
| Iowa | −0.001 (0.06) | 0.06 (0.07) | 0.02 (0.06) | 0.02 (0.07) |
| Idaho | 0.01 (0.06) | 0.03 (0.07) | 0.06 (0.06) | 0.02 (0.07) |
| Illinois | −0.02 (0.06) | 0.001 (0.07) | −0.01 (0.06) | −0.03 (0.06) |
| Indiana | −0.06 (0.06) | 0.03 (0.07) | −0.01 (0.06) | −0.08 (0.06) |
| Kansas | −0.05 (0.06) | −0.002 (0.07) | 0.02 (0.06) | −0.05 (0.07) |
| Kentucky | −0.09 (0.06) | 0.01 (0.07) | −0.01 (0.06) | −0.05 (0.07) |
| Louisiana | −0.004 (0.06) | 0.02 (0.07) | 0.01 (0.06) | −0.11 † (0.07) |
| Massachusetts | −0.02 (0.06) | −0.02 (0.07) | −0.003 (0.06) | −0.02 (0.06) |
| Maryland | −0.03 (0.06) | 0.01 (0.07) | 0.01 (0.06) | −0.03 (0.06) |
| Maine | 0.03 (0.06) | 0.05 (0.08) | −0.01 (0.06) | 0.04 (0.07) |
| Michigan | −0.03 (0.06) | 0.003 (0.07) | 0.03 (0.06) | −0.03 (0.06) |
| Minnesota | −0.01 (0.06) | 0.004 (0.07) | 0.04 (0.06) | −0.01 (0.06) |
| Missouri | −0.06 (0.06) | 0.01 (0.07) | −0.02 (0.06) | −0.06 (0.06) |
| Mississippi | 0.01 (0.06) | 0.07 (0.07) | 0.08 (0.06) | −0.12 (0.07) |
| Montana | −0.14 * (0.07) | −0.05 (0.08) | −0.13 † (0.07) | −0.15 † (0.08) |
| North Carolina | −0.05 (0.06) | −0.01 (0.07) | 0.004 (0.06) | −0.10 (0.06) |
| North Dakota | 0.07 (0.06) | 0.10 (0.08) | 0.12 † (0.06) | 0.13 † (0.07) |
| Nebraska | −0.07 (0.06) | −0.05 (0.07) | 0.04 (0.06) | −0.07 (0.07) |
| New Hampshire | −0.07 (0.06) | −0.01 (0.08) | 0.02 (0.06) | −0.04 (0.07) |
| New Jersey | 0.0002 (0.06) | −0.003 (0.07) | −0.04 (0.06) | −0.02 (0.06) |
| New Mexico | −0.07 (0.06) | −0.01 (0.07) | 0.03 (0.06) | −0.04 (0.07) |
| Nevada | −0.01 (0.06) | −0.04 (0.07) | −0.04 (0.06) | −0.14 * (0.07) |
| New York | −0.04 (0.05) | −0.003 (0.07) | −0.01 (0.06) | 0.002 (0.06) |
| Ohio | −0.03 (0.05) | 0.04 (0.07) | 0.04 (0.06) | −0.01 (0.06) |
| Oklahoma | −0.09 (0.06) | 0.05 (0.07) | 0.004 (0.06) | −0.09 (0.07) |
| Oregon | −0.04 (0.06) | −0.01 (0.07) | 0.02 (0.06) | −0.02 (0.07) |
| Pennsylvania | −0.01 (0.05) | 0.04 (0.07) | 0.02 (0.06) | −0.02 (0.06) |
| Rhode Island | 0.02 (0.07) | 0.05 (0.08) | 0.06 (0.06) | −0.06 (0.08) |
| South Carolina | −0.04 (0.06) | 0.01 (0.07) | 0.02 (0.06) | −0.04 (0.07) |
| South Dakota | −0.05 (0.07) | 0.01 (0.08) | 0.03 (0.06) | 0.07 (0.08) |
| Tennessee | −0.04 (0.06) | 0.05 (0.07) | −0.01 (0.06) | −0.05 (0.06) |
| Texas | −0.04 (0.05) | 0.01 (0.07) | 0.01 (0.06) | −0.06 (0.06) |
| Utah | 0.02 (0.06) | 0.01 (0.07) | 0.03 (0.06) | 0.002 (0.07) |
| Virginia | −0.02 (0.06) | 0.03 (0.07) | 0.01 (0.06) | −0.03 (0.06) |
| Vermont | −0.08 (0.07) | 0.01 (0.08) | 0.04 (0.06) | −0.13 (0.08) |
| Washington | −0.003 (0.06) | 0.05 (0.07) | 0.04 (0.06) | −0.02 (0.06) |
| Wisconsin | −0.06 (0.06) | 0.02 (0.07) | 0.001 (0.06) | −0.01 (0.06) |
| West Virginia | −0.10 (0.06) | 0.03 (0.08) | −0.001 (0.06) | −0.01 (0.07) |
| Wyoming | −0.06 (0.07) | −0.11 (0.09) | 0.03 (0.08) | 0.07 (0.09) |
| Female | 0.002 (0.01) | −0.03 *** (0.01) | 0.01 ** (0.004) | −0.03 *** (0.01) |
| Black | −0.10 *** (0.01) | −0.02 * (0.01) | −0.04 *** (0.01) | −0.25 *** (0.01) |
| Hispanic | −0.05 *** (0.01) | −0.03 ** (0.01) | −0.03 *** (0.01) | −0.11 *** (0.01) |
| Other | −0.01 (0.01) | 0.01 (0.01) | −0.02 * (0.01) | 0.08 *** (0.01) |
| College | 0.13 *** (0.01) | 0.04 *** (0.01) | 0.07 *** (0.004) | 0.14 *** (0.01) |
| Age | 0.004 *** (0.0002) | 0.001 *** (0.0002) | 0.0004 * (0.0002) | −0.001 *** (0.0002) |
| Income between $50k and $100k | 0.13 *** (0.01) | 0.14 *** (0.01) | 0.21 *** (0.01) | 0.03 *** (0.01) |
| Income above $100k | 0.23 *** (0.01) | 0.25 *** (0.01) | 0.30 *** (0.01) | 0.11 *** (0.01) |
| Unemployed (not retired, no disabilities) | −0.06 *** (0.01) | −0.04 *** (0.01) | −0.02 * (0.01) | 0.13 *** (0.01) |
| Retired | 0.09 *** (0.01) | 0.01 (0.01) | 0.07 *** (0.01) | 0.19 *** (0.01) |
| Has disabilities | −0.17 *** (0.01) | −0.13 *** (0.01) | −0.19 *** (0.01) | −0.02 (0.02) |
| Married | 0.06 *** (0.01) | 0.03 *** (0.01) | 0.06 *** (0.01) | −0.002 (0.01) |
| Presence of children aged below 18 | −0.07 *** (0.01) | −0.08 *** (0.01) | −0.05 *** (0.01) | −0.07 *** (0.01) |
| FL × Post | −0.04 *** (0.01) | −0.01 (0.01) | −0.02 * (0.01) | 0.02 † (0.01) |
| Observations | 52,244 | 52,244 | 52,244 | 45,773 |
| Adj. R2 | 0.23 | 0.09 | 0.19 | 0.13 |
| (1) Emergency Fund Availability | (2) Spending Less Than Income | (3) Perceived Financial Comfort | (4) No Credit Card Debt | |
|---|---|---|---|---|
| Constant | 0.07 (0.05) | 0.29 *** (0.07) | 0.47 *** (0.06) | 0.38 *** (0.06) |
| FL | 0.07 *** (0.003) | 0.02 *** (0.004) | 0.02 *** (0.003) | 0.04 *** (0.004) |
| Year_2018 | 0.004 (0.01) | 0.02 † (0.01) | 0.004 (0.01) | 0.01 (0.01) |
| Year_2019 | 0.02 ** (0.01) | 0.01 (0.01) | 0.01 (0.01) | 0.02 * (0.01) |
| Year_2020 | 0.06 *** (0.01) | 0.02 (0.01) | 0.01 (0.01) | 0.01 (0.02) |
| Year_2021 | 0.08 *** (0.01) | 0.02 (0.01) | 0.03 * (0.01) | 0.03 (0.02) |
| Year_2022 | 0.03 * (0.01) | −0.04 ** (0.01) | −0.01 (0.01) | 0.01 (0.02) |
| Alabama | −0.04 (0.06) | −0.05 (0.07) | −0.01 (0.06) | −0.07 (0.07) |
| Arkansas | −0.07 (0.06) | 0.001 (0.07) | −0.001 (0.06) | −0.05 (0.07) |
| Arizona | −0.03 (0.05) | −0.01 (0.07) | 0.01 (0.06) | −0.04 (0.06) |
| California | −0.04 (0.05) | −0.02 (0.07) | −0.02 (0.06) | −0.03 (0.06) |
| Colorado | 0.01 (0.06) | 0.01 (0.07) | 0.01 (0.06) | 0.02 (0.06) |
| Connecticut | −0.02 (0.06) | −0.02 (0.07) | −0.03 (0.06) | −0.08 (0.07) |
| District of Columbia | 0.01 (0.06) | −0.002 (0.08) | 0.06 (0.06) | −0.001 (0.08) |
| Delaware | −0.04 (0.06) | −0.07 (0.08) | −0.10 (0.06) | −0.05 (0.07) |
| Florida | −0.04 (0.05) | −0.03 (0.07) | −0.01 (0.06) | −0.05 (0.06) |
| Georgia | −0.01 (0.05) | 0.001 (0.07) | 0.01 (0.06) | −0.06 (0.06) |
| Hawaii | 0.03 (0.06) | 0.002 (0.08) | −0.07 (0.07) | −0.03 (0.08) |
| Iowa | −0.01 (0.06) | 0.06 (0.07) | 0.01 (0.06) | 0.02 (0.07) |
| Idaho | −0.001 (0.06) | 0.03 (0.07) | 0.05 (0.06) | 0.02 (0.07) |
| Illinois | −0.03 (0.05) | −0.002 (0.07) | −0.01 (0.06) | −0.04 (0.06) |
| Indiana | −0.06 (0.05) | 0.02 (0.07) | −0.01 (0.06) | −0.08 (0.06) |
| Kansas | −0.06 (0.06) | −0.01 (0.07) | 0.02 (0.06) | −0.05 (0.07) |
| Kentucky | −0.10 † (0.06) | 0.003 (0.07) | −0.01 (0.06) | −0.05 (0.07) |
| Louisiana | −0.01 (0.06) | 0.01 (0.07) | 0.01 (0.06) | −0.12 † (0.07) |
| Massachusetts | −0.02 (0.05) | −0.02 (0.07) | −0.01 (0.06) | −0.02 (0.06) |
| Maryland | −0.04 (0.05) | 0.01 (0.07) | 0.01 (0.06) | −0.03 (0.06) |
| Maine | 0.02 (0.06) | 0.05 (0.08) | −0.01 (0.06) | 0.04 (0.07) |
| Michigan | −0.04 (0.05) | −0.0001 (0.07) | 0.03 (0.06) | −0.03 (0.06) |
| Minnesota | −0.02 (0.05) | 0.001 (0.07) | 0.04 (0.06) | −0.01 (0.06) |
| Missouri | −0.06 (0.05) | 0.01 (0.07) | −0.03 (0.06) | −0.07 (0.06) |
| Mississippi | −0.002 (0.06) | 0.06 (0.08) | 0.08 (0.06) | −0.12 † (0.07) |
| Montana | −0.15 * (0.06) | −0.05 (0.08) | −0.13 † (0.07) | −0.15 * (0.08) |
| North Carolina | −0.06 (0.05) | −0.02 (0.07) | 0.001 (0.06) | −0.10 (0.06) |
| North Dakota | 0.06 (0.06) | 0.09 (0.08) | 0.11 † (0.06) | 0.12 (0.07) |
| Nebraska | −0.08 (0.06) | −0.05 (0.07) | 0.03 (0.06) | −0.07 (0.07) |
| New Hampshire | −0.08 (0.06) | −0.02 (0.08) | 0.01 (0.06) | −0.04 (0.07) |
| New Jersey | −0.01 (0.05) | −0.01 (0.07) | −0.05 (0.06) | −0.03 (0.06) |
| New Mexico | −0.07 (0.06) | −0.01 (0.07) | 0.03 (0.06) | −0.04 (0.07) |
| Nevada | −0.01 (0.06) | −0.04 (0.07) | −0.04 (0.06) | −0.15 * (0.07) |
| New York | −0.05 (0.05) | −0.01 (0.07) | −0.01 (0.06) | −0.001 (0.06) |
| Ohio | −0.04 (0.05) | 0.04 (0.07) | 0.04 (0.06) | −0.01 (0.06) |
| Oklahoma | −0.10 † (0.06) | 0.04 (0.07) | 0.0001 (0.06) | −0.09 (0.07) |
| Oregon | −0.05 (0.06) | −0.01 (0.07) | 0.01 (0.06) | −0.02 (0.07) |
| Pennsylvania | −0.01 (0.05) | 0.04 (0.07) | 0.01 (0.06) | −0.02 (0.06) |
| Rhode Island | 0.01 (0.06) | 0.05 (0.08) | 0.06 (0.06) | −0.07 (0.08) |
| South Carolina | −0.05 (0.06) | 0.01 (0.07) | 0.01 (0.06) | −0.04 (0.07) |
| South Dakota | −0.06 (0.07) | 0.01 (0.08) | 0.03 (0.06) | 0.06 (0.08) |
| Tennessee | −0.05 (0.05) | 0.05 (0.07) | −0.01 (0.06) | −0.06 (0.06) |
| Texas | −0.05 (0.05) | 0.004 (0.07) | 0.01 (0.06) | −0.06 (0.06) |
| Utah | 0.01 (0.06) | 0.01 (0.07) | 0.02 (0.06) | −0.0002 (0.07) |
| Virginia | −0.02 (0.05) | 0.03 (0.07) | 0.01 (0.06) | −0.04 (0.06) |
| Vermont | −0.10 (0.07) | 0.004 (0.08) | 0.03 (0.06) | −0.14 † (0.08) |
| Washington | −0.01 (0.05) | 0.05 (0.07) | 0.03 (0.06) | −0.03 (0.06) |
| Wisconsin | −0.07 (0.05) | 0.01 (0.07) | −0.002 (0.06) | −0.01 (0.06) |
| West Virginia | −0.11 † (0.06) | 0.03 (0.08) | −0.01 (0.06) | −0.02 (0.07) |
| Wyoming | −0.08 (0.07) | −0.12 (0.09) | 0.02 (0.08) | 0.06 (0.09) |
| Female | 0.002 (0.01) | −0.03 *** (0.01) | 0.01 * (0.004) | −0.04 *** (0.01) |
| Black | −0.09 *** (0.01) | −0.02 † (0.01) | −0.04 *** (0.01) | −0.25 *** (0.01) |
| Hispanic | −0.04 *** (0.01) | −0.03 ** (0.01) | −0.03 *** (0.01) | −0.11 *** (0.01) |
| Other | −0.01 (0.010) | 0.01 (0.01) | −0.02 * (0.01) | 0.08 *** (0.01) |
| College | 0.13 *** (0.01) | 0.04 *** (0.01) | 0.07 *** (0.004) | 0.14 *** (0.01) |
| Age | 0.003 *** (0.0002) | 0.001 *** (0.0002) | 0.0003 * (0.0002) | −0.001 *** (0.0002) |
| Income between $50k and $100k | 0.12 *** (0.01) | 0.14 *** (0.01) | 0.21 *** (0.01) | 0.03 *** (0.01) |
| Income above $100k | 0.23 *** (0.01) | 0.25 *** (0.01) | 0.30 *** (0.01) | 0.11 *** (0.01) |
| Unemployed (not retired, no disabilities) | −0.05 *** (0.01) | −0.04 *** (0.01) | −0.02 * (0.01) | 0.13 *** (0.01) |
| Retired | 0.09 *** (0.01) | 0.01 (0.01) | 0.07 *** (0.01) | 0.19 *** (0.01) |
| Has disabilities | −0.16 *** (0.01) | −0.13 *** (0.01) | −0.19 *** (0.01) | −0.02 (0.02) |
| Married | 0.06 *** (0.01) | 0.03 *** (0.01) | 0.06 *** (0.01) | −0.002 (0.01) |
| Presence of children aged below 18 | −0.07 *** (0.01) | −0.08 *** (0.01) | −0.05 *** (0.01) | −0.07 *** (0.01) |
| FL × Post | −0.01 * (0.004) | 0.003 (0.01) | −0.004 (0.004) | 0.01 * (0.01) |
| Observations | 52,244 | 52,244 | 52,244 | 45,773 |
| Adj. R2 | 0.23 | 0.09 | 0.18 | 0.13 |
| (1) Emergency Fund Availability | (2) Spending Less Than Income | (3) Perceived Financial Comfort | (4) No Credit Card Debt | |
|---|---|---|---|---|
| Constant | 0.13 * (0.06) | 0.30 *** (0.07) | 0.48 *** (0.06) | 0.42 *** (0.06) |
| FL | 0.15 *** (0.01) | 0.05 *** (0.01) | 0.06 *** (0.01) | 0.12 *** (0.01) |
| Year_2018 | −0.01 (0.01) | 0.02 † (0.01) | 0.01 (0.01) | 0.01 (0.01) |
| Year_2019 | 0.02 (0.01) | 0.01 (0.01) | 0.01 (0.01) | −0.002 (0.01) |
| Year_2020 | 0.04 ** (0.01) | 0.03 * (0.01) | 0.01 (0.01) | 0.01 (0.01) |
| Year_2021 | 0.09 *** (0.01) | 0.04 ** (0.01) | 0.04 ** (0.01) | 0.03 * (0.02) |
| Year_2022 | 0.02 † (0.01) | −0.02 (0.01) | −0.01 (0.01) | 0.01 (0.02) |
| Alabama | −0.03 (0.06) | −0.05 (0.07) | −0.01 (0.06) | −0.07 (0.07) |
| Arkansas | −0.06 (0.06) | 0.003 (0.07) | 0.002 (0.06) | −0.04 (0.07) |
| Arizona | −0.02 (0.06) | −0.01 (0.07) | 0.01 (0.06) | −0.04 (0.06) |
| California | −0.03 (0.05) | −0.01 (0.07) | −0.02 (0.06) | −0.03 (0.06) |
| Colorado | 0.01 (0.06) | 0.01 (0.07) | 0.01 (0.06) | 0.02 (0.06) |
| Connecticut | −0.02 (0.06) | −0.02 (0.07) | −0.03 (0.06) | −0.07 (0.06) |
| District of Columbia | 0.01 (0.06) | 0.001 (0.08) | 0.07 (0.06) | −0.00002 (0.08) |
| Delaware | −0.04 (0.06) | −0.06 (0.08) | −0.09 (0.06) | −0.04 (0.07) |
| Florida | −0.03 (0.05) | −0.02 (0.07) | −0.01 (0.06) | −0.05 (0.06) |
| Georgia | −0.01 (0.06) | 0.003 (0.07) | 0.01 (0.06) | −0.06 (0.06) |
| Hawaii | 0.04 (0.07) | 0.01 (0.08) | −0.06 (0.07) | −0.02 (0.07) |
| Iowa | −0.001 (0.06) | 0.06 (0.07) | 0.02 (0.06) | 0.02 (0.07) |
| Idaho | 0.01 (0.06) | 0.03 (0.07) | 0.06 (0.06) | 0.02 (0.07) |
| Illinois | −0.02 (0.06) | 0.001 (0.07) | −0.01 (0.06) | −0.03 (0.06) |
| Indiana | −0.06 (0.06) | 0.03 (0.07) | −0.01 (0.06) | −0.08 (0.06) |
| Kansas | −0.05 (0.06) | −0.002 (0.07) | 0.02 (0.06) | −0.05 (0.07) |
| Kentucky | −0.09 (0.06) | 0.01 (0.07) | −0.01 (0.06) | −0.05 (0.07) |
| Louisiana | −0.004 (0.06) | 0.02 (0.07) | 0.01 (0.06) | −0.11 † (0.07) |
| Massachusetts | −0.02 (0.06) | −0.02 (0.07) | −0.003 (0.06) | −0.02 (0.06) |
| Maryland | −0.03 (0.06) | 0.01 (0.07) | 0.01 (0.06) | −0.03 (0.06) |
| Maine | 0.03 (0.06) | 0.05 (0.08) | −0.01 (0.06) | 0.04 (0.07) |
| Michigan | −0.03 (0.06) | 0.003 (0.07) | 0.03 (0.06) | −0.03 (0.06) |
| Minnesota | −0.01 (0.06) | 0.004 (0.07) | 0.04 (0.06) | −0.01 (0.06) |
| Missouri | −0.06 (0.06) | 0.02 (0.07) | −0.02 (0.06) | −0.06 (0.06) |
| Mississippi | 0.01 (0.06) | 0.07 (0.07) | 0.08 (0.06) | −0.12 (0.07) |
| Montana | −0.14 * (0.07) | −0.05 (0.08) | −0.13 † (0.07) | −0.15 * (0.08) |
| North Carolina | −0.05 (0.06) | −0.01 (0.07) | 0.004 (0.06) | −0.10 (0.06) |
| North Dakota | 0.07 (0.06) | 0.10 (0.08) | 0.12 † (0.06) | 0.13 † (0.07) |
| Nebraska | −0.07 (0.06) | −0.05 (0.07) | 0.04 (0.06) | −0.07 (0.07) |
| New Hampshire | −0.07 (0.06) | −0.01 (0.08) | 0.02 (0.06) | −0.04 (0.07) |
| New Jersey | 0.0001 (0.06) | −0.003 (0.07) | −0.04 (0.06) | −0.03 (0.06) |
| New Mexico | −0.07 (0.06) | −0.01 (0.07) | 0.03 (0.06) | −0.04 (0.07) |
| Nevada | −0.01 (0.06) | −0.04 (0.07) | −0.04 (0.06) | −0.15 * (0.07) |
| New York | −0.04 (0.05) | −0.003 (0.07) | −0.01 (0.06) | 0.001 (0.06) |
| Ohio | −0.03 (0.05) | 0.04 (0.07) | 0.04 (0.06) | −0.01 (0.06) |
| Oklahoma | −0.09 (0.06) | 0.04 (0.07) | 0.003 (0.06) | −0.09 (0.07) |
| Oregon | −0.04 (0.06) | −0.01 (0.07) | 0.02 (0.06) | −0.02 (0.06) |
| Pennsylvania | −0.01 (0.05) | 0.04 (0.07) | 0.02 (0.06) | −0.02 (0.06) |
| Rhode Island | 0.02 (0.07) | 0.05 (0.08) | 0.06 (0.06) | −0.06 (0.08) |
| South Carolina | −0.04 (0.06) | 0.01 (0.07) | 0.02 (0.06) | −0.04 (0.06) |
| South Dakota | −0.05 (0.07) | 0.01 (0.08) | 0.03 (0.06) | 0.07 (0.08) |
| Tennessee | −0.04 (0.06) | 0.05 (0.07) | −0.01 (0.06) | −0.06 (0.06) |
| Texas | −0.04 (0.05) | 0.01 (0.07) | 0.01 (0.06) | −0.06 (0.06) |
| Utah | 0.01 (0.06) | 0.01 (0.07) | 0.03 (0.06) | 0.001 (0.07) |
| Virginia | −0.02 (0.06) | 0.03 (0.07) | 0.01 (0.06) | −0.03 (0.06) |
| Vermont | −0.08 (0.07) | 0.01 (0.08) | 0.04 (0.06) | −0.13 (0.08) |
| Washington | −0.003 (0.06) | 0.06 (0.07) | 0.04 (0.06) | −0.03 (0.06) |
| Wisconsin | −0.06 (0.06) | 0.02 (0.07) | 0.001 (0.06) | −0.01 (0.06) |
| West Virginia | −0.10 (0.06) | 0.03 (0.08) | −0.001 (0.06) | −0.01 (0.07) |
| Wyoming | −0.06 (0.07) | −0.11 (0.09) | 0.03 (0.08) | 0.06 (0.09) |
| Female | 0.002 (0.01) | −0.03 *** (0.01) | 0.01 ** (0.004) | −0.03 *** (0.01) |
| Black | −0.10 *** (0.01) | −0.02 * (0.01) | −0.04 *** (0.01) | −0.25 *** (0.01) |
| Hispanic | −0.05 *** (0.01) | −0.03 ** (0.01) | −0.03 *** (0.01) | −0.11 *** (0.01) |
| Other | −0.01 (0.01) | 0.01 (0.01) | −0.02 * (0.01) | 0.08 *** (0.01) |
| College | 0.13 *** (0.01) | 0.04 *** (0.01) | 0.07 *** (0.004) | 0.14 *** (0.01) |
| Age | 0.004 *** (0.0002) | 0.001 *** (0.0002) | 0.0004 * (0.0002) | −0.001 *** (0.0002) |
| Income between $50k and $100k | 0.13 *** (0.01) | 0.14 *** (0.01) | 0.21 *** (0.01) | 0.03 *** (0.01) |
| Income above $100k | 0.23 *** (0.01) | 0.25 *** (0.01) | 0.30 *** (0.01) | 0.11 *** (0.01) |
| Unemployed (not retired, no disabilities) | −0.06 *** (0.01) | −0.04 *** (0.01) | −0.02 * (0.01) | 0.13 *** (0.01) |
| Retired | 0.09 *** (0.01) | 0.01 (0.01) | 0.07 *** (0.01) | 0.19 *** (0.01) |
| Has disabilities | −0.17 *** (0.01) | −0.13 *** (0.01) | −0.19 *** (0.01) | −0.02 (0.02) |
| Married | 0.06 *** (0.01) | 0.03 *** (0.01) | 0.06 *** (0.01) | −0.002 (0.01) |
| Presence of children aged below 18 | −0.07 *** (0.01) | −0.08 *** (0.01) | −0.05 *** (0.01) | −0.07 *** (0.01) |
| FL × Year_2017 | −0.01 (0.02) | 0.01 (0.02) | 0.003 (0.01) | −0.04 * (0.02) |
| FL × Year_2018 | 0.01 (0.01) | −0.01 (0.02) | −0.0004 (0.01) | −0.04 * (0.02) |
| FL × Year_2020 | −0.03 † (0.01) | 0.002 (0.02) | −0.01 (0.01) | −0.01 (0.02) |
| FL × Year_2021 | −0.06 *** (0.02) | −0.01 (0.02) | −0.02 † (0.01) | −0.01 (0.02) |
| FL × Year_2022 | −0.03 * (0.02) | −0.03 (0.02) | −0.02 † (0.01) | −0.01 (0.02) |
| Observations | 52,244 | 52,244 | 52,244 | 45,773 |
| Adj. R2 | 0.23 | 0.09 | 0.19 | 0.13 |
| (1) Emergency Fund Availability | (2) Spending Less Than Income | (3) Perceived Financial Comfort | (4) No Credit Card Debt | |
|---|---|---|---|---|
| Constant | 0.08 (0.06) | 0.29 *** (0.07) | 0.47 *** (0.06) | 0.40 *** (0.07) |
| FL | 0.07 *** (0.01) | 0.03 *** (0.01) | 0.03 *** (0.01) | 0.05 *** (0.01) |
| Year_2018 | −0.02 (0.02) | 0.03 (0.02) | 0.01 (0.02) | 0.01 (0.02) |
| Year_2019 | 0.01 (0.02) | 0.002 (0.02) | −0.01 (0.02) | −0.02 (0.02) |
| Year_2020 | 0.03 (0.02) | 0.02 (0.02) | −0.01 (0.02) | −0.01 (0.02) |
| Year_2021 | 0.08 *** (0.02) | 0.01 (0.02) | 0.03 (0.02) | 0.02 (0.03) |
| Year_2022 | 0.03 (0.02) | −0.02 (0.02) | −0.01 (0.02) | −0.01 (0.03) |
| Alabama | −0.04 (0.06) | −0.05 (0.07) | −0.01 (0.06) | −0.07 (0.07) |
| Arkansas | −0.07 (0.06) | 0.001 (0.07) | −0.001 (0.06) | −0.05 (0.07) |
| Arizona | −0.03 (0.05) | −0.01 (0.07) | 0.01 (0.06) | −0.04 (0.06) |
| California | −0.04 (0.05) | −0.02 (0.07) | −0.02 (0.06) | −0.03 (0.06) |
| Colorado | 0.01 (0.06) | 0.01 (0.07) | 0.01 (0.06) | 0.02 (0.06) |
| Connecticut | −0.02 (0.06) | −0.02 (0.07) | −0.03 (0.06) | −0.08 (0.07) |
| District of Columbia | 0.01 (0.06) | −0.001 (0.08) | 0.06 (0.06) | −0.002 (0.08) |
| Delaware | −0.04 (0.06) | −0.06 (0.08) | −0.10 (0.06) | −0.05 (0.07) |
| Florida | −0.04 (0.05) | −0.03 (0.07) | −0.01 (0.06) | −0.05 (0.06) |
| Georgia | −0.01 (0.05) | 0.001 (0.07) | 0.01 (0.06) | −0.06 (0.06) |
| Hawaii | 0.03 (0.06) | 0.003 (0.08) | −0.07 (0.07) | −0.03 (0.08) |
| Iowa | −0.01 (0.06) | 0.06 (0.07) | 0.01 (0.06) | 0.02 (0.07) |
| Idaho | −0.001 (0.06) | 0.03 (0.07) | 0.05 (0.06) | 0.02 (0.07) |
| Illinois | −0.03 (0.05) | −0.002 (0.07) | −0.01 (0.06) | −0.04 (0.06) |
| Indiana | −0.06 (0.05) | 0.02 (0.07) | −0.01 (0.06) | −0.09 (0.06) |
| Kansas | −0.06 (0.06) | −0.01 (0.07) | 0.02 (0.06) | −0.05 (0.07) |
| Kentucky | −0.10 † (0.06) | 0.004 (0.07) | −0.01 (0.06) | −0.06 (0.07) |
| Louisiana | −0.01 (0.06) | 0.01 (0.07) | 0.01 (0.06) | −0.12 † (0.07) |
| Massachusetts | −0.02 (0.05) | −0.02 (0.07) | −0.01 (0.06) | −0.02 (0.06) |
| Maryland | −0.04 (0.05) | 0.01 (0.07) | 0.01 (0.06) | −0.03 (0.06) |
| Maine | 0.02 (0.06) | 0.05 (0.08) | −0.01 (0.06) | 0.04 (0.07) |
| Michigan | −0.04 (0.05) | 0.0002 (0.07) | 0.03 (0.06) | −0.04 (0.06) |
| Minnesota | −0.02 (0.05) | 0.001 (0.07) | 0.04 (0.06) | −0.01 (0.06) |
| Missouri | −0.06 (0.05) | 0.01 (0.07) | −0.03 (0.06) | −0.07 (0.06) |
| Mississippi | −0.002 (0.06) | 0.06 (0.07) | 0.08 (0.06) | −0.12 † (0.07) |
| Montana | −0.15 * (0.06) | −0.05 (0.08) | −0.13 † (0.07) | −0.15 * (0.08) |
| North Carolina | −0.06 (0.05) | −0.02 (0.07) | 0.001 (0.06) | −0.10 (0.06) |
| North Dakota | 0.06 (0.06) | 0.09 (0.08) | 0.11 (0.06) | 0.12 (0.07) |
| Nebraska | −0.08 (0.06) | −0.05 (0.07) | 0.03 (0.06) | −0.07 (0.07) |
| New Hampshire | −0.08 (0.06) | −0.02 (0.08) | 0.01 (0.06) | −0.04 (0.07) |
| New Jersey | −0.01 (0.05) | −0.01 (0.07) | −0.05 (0.06) | −0.03 (0.06) |
| New Mexico | −0.07 (0.06) | −0.01 (0.07) | 0.03 (0.06) | −0.04 (0.07) |
| Nevada | −0.01 (0.06) | −0.04 (0.07) | −0.04 (0.06) | −0.15 * (0.07) |
| New York | −0.05 (0.05) | −0.01 (0.07) | −0.01 (0.06) | −0.002 (0.06) |
| Ohio | −0.04 (0.05) | 0.04 (0.07) | 0.04 (0.06) | −0.01 (0.06) |
| Oklahoma | −0.10 † (0.06) | 0.04 (0.07) | −0.0001 (0.06) | −0.09 (0.07) |
| Oregon | −0.05 (0.06) | −0.01 (0.07) | 0.01 (0.06) | −0.03 (0.07) |
| Pennsylvania | −0.01 (0.05) | 0.04 (0.07) | 0.01 (0.06) | −0.02 (0.06) |
| Rhode Island | 0.01 (0.06) | 0.05 (0.08) | 0.06 (0.06) | −0.07 (0.08) |
| South Carolina | −0.05 (0.06) | 0.01 (0.07) | 0.01 (0.06) | −0.04 (0.07) |
| South Dakota | −0.06 (0.07) | 0.01 (0.08) | 0.03 (0.06) | 0.06 (0.08) |
| Tennessee | −0.05 (0.05) | 0.05 (0.07) | −0.01 (0.06) | −0.06 (0.06) |
| Texas | −0.05 (0.05) | 0.004 (0.07) | 0.01 (0.06) | −0.06 (0.06) |
| Utah | 0.01 (0.06) | 0.01 (0.07) | 0.02 (0.06) | −0.002 (0.07) |
| Virginia | −0.02 (0.05) | 0.03 (0.07) | 0.01 (0.06) | −0.04 (0.06) |
| Vermont | −0.10 (0.07) | 0.004 (0.08) | 0.03 (0.06) | −0.14 † (0.08) |
| Washington | −0.01 (0.05) | 0.05 (0.07) | 0.03 (0.06) | −0.03 (0.06) |
| Wisconsin | −0.06 (0.05) | 0.01 (0.07) | −0.002 (0.06) | −0.01 (0.06) |
| West Virginia | −0.11 † (0.06) | 0.03 (0.08) | −0.01 (0.06) | −0.02 (0.07) |
| Wyoming | −0.08 (0.07) | −0.12 (0.09) | 0.02 (0.08) | 0.05 (0.09) |
| Female | 0.002 (0.01) | −0.03 *** (0.01) | 0.01 * (0.004) | −0.04 *** (0.01) |
| Black | −0.09 *** (0.01) | −0.02 † (0.01) | −0.04 *** (0.01) | −0.25 *** (0.01) |
| Hispanic | −0.04 *** (0.01) | −0.03 ** (0.01) | −0.03 *** (0.01) | −0.11 *** (0.01) |
| Other | −0.01 (0.01) | 0.01 (0.01) | −0.02 * (0.01) | 0.08 *** (0.01) |
| College | 0.13 *** (0.01) | 0.04 *** (0.01) | 0.07 *** (0.004) | 0.14 *** (0.01) |
| Age | 0.003 *** (0.0002) | 0.001 *** (0.0002) | 0.0003 * (0.0002) | −0.001 *** (0.0002) |
| Income between $50k and $100k | 0.12 *** (0.01) | 0.14 *** (0.01) | 0.21 *** (0.01) | 0.03 *** (0.01) |
| Income above $100k | 0.23 *** (0.01) | 0.25 *** (0.01) | 0.30 *** (0.01) | 0.11 *** (0.01) |
| Unemployed (not retired, no disabilities) | −0.05 *** (0.01) | −0.04 *** (0.01) | −0.02 * (0.01) | 0.13 *** (0.01) |
| Retired | 0.09 *** (0.01) | 0.01 (0.01) | 0.07 *** (0.01) | 0.19 *** (0.01) |
| Has disabilities | −0.16 *** (0.01) | −0.13 *** (0.01) | −0.19 *** (0.01) | −0.02 (0.02) |
| Married | 0.06 *** (0.01) | 0.03 *** (0.01) | 0.06 *** (0.01) | −0.002 (0.01) |
| Presence of children aged below 18 | −0.07 *** (0.01) | −0.08 *** (0.01) | −0.05 *** (0.01) | −0.07 *** (0.01) |
| FL × Year_2017 | −0.01 (0.01) | −0.002 (0.01) | −0.01 (0.01) | −0.02 * (0.01) |
| FL × Year_2018 | 0.003 (0.01) | −0.01 (0.01) | −0.01 (0.01) | −0.02 * (0.01) |
| FL × Year_2020 | −0.004 (0.01) | 0.002 (0.01) | −0.003 (0.01) | 0.001 (0.01) |
| FL × Year_2021 | −0.01 * (0.01) | 0.004 (0.01) | −0.01 (0.01) | −0.002 (0.01) |
| FL × Year_2022 | −0.01 † (0.01) | −0.01 (0.01) | −0.01 (0.01) | 0.0003 (0.01) |
| Observations | 52,244 | 52,244 | 52,244 | 45,773 |
| Adj. R2 | 0.23 | 0.09 | 0.18 | 0.13 |
References
- Ando, A., & Modigliani, F. (1963). The “life cycle” hypothesis of saving: Aggregate implications and tests. The American Economic Review, 53(1), 55–84. [Google Scholar]
- Board of Governors of the Federal Reserve System. (2024). Survey of household economics and decisionmaking. Available online: https://www.federalreserve.gov/consumerscommunities/shed.htm (accessed on 30 October 2024).
- Botha, F., de New, J. P., de New, S. C., Ribar, D. C., & Salamanca, N. (2021). Implications of COVID-19 labour market shocks for inequality in financial wellbeing. Journal of Population Economics, 34(2), 655–689. [Google Scholar] [CrossRef] [PubMed]
- Bucher-Koenen, T., & Ziegelmeyer, M. (2014). Once burned, twice shy? Financial literacy and wealth losses during the financial crisis. Review of Finance, 18(6), 2215–2246. [Google Scholar] [CrossRef]
- Bureau of Labor Statistics. (2022, July 18). Consumer prices up 9.1 percent over the year ended June 2022, largest increase in 40 years. The Economics Daily. Available online: https://www.bls.gov/opub/ted/2022/consumer-prices-up-9-1-percent-over-the-year-ended-june-2022-largest-increase-in-40-years.htm (accessed on 30 October 2024).
- Center on Budget and Policy Priorities. (2023, March 6). Robust COVID relief bolstered economy and reduced hardship for millions. Available online: https://www.cbpp.org/research/poverty-and-inequality/robust-covid-relief-bolstered-economy-and-reduced-hardship-for (accessed on 15 November 2024).
- Center on Budget and Policy Priorities. (2024, April 3). Chart book: Tracking the recovery from the pandemic recession. Available online: https://www.cbpp.org/research/economy/tracking-the-recovery-from-the-pandemic-recession (accessed on 5 January 2025).
- Chu, Z., Wang, Z., Xiao, J. J., & Zhang, W. (2017). Financial literacy, portfolio choice and financial well-being. Social Indicators Research, 132(2), 799–820. [Google Scholar] [CrossRef]
- Congressional Research Service. (2021, August 20). Unemployment rates during the COVID-19 pandemic. Available online: https://crsreports.congress.gov/product/pdf/R/R46554/9 (accessed on 7 November 2024).
- Cooney, P., & Shaefer, H. L. (2022, October 27). Material hardship and well-being of U.S. households in 2022. Available online: https://poverty.umich.edu/publications/material-hardship-and-well-being-of-u-s-households-in-2022/ (accessed on 11 January 2025).
- Cooney, P., Shaefer, H. L., & Jubaed, S. (2022, March 22). Material hardship and well-being of U.S. households at the end of 2021. Available online: https://poverty.umich.edu/publications/material-hardship-and-well-being-of-u-s-households-at-the-end-of-2021/ (accessed on 11 January 2025).
- Cox, J. (2022, December 14). Fed raises interest rates half a point to highest level in 15 years. CNBC. Available online: https://www.cnbc.com/2022/12/14/fed-rate-decision-december-2022.html (accessed on 11 January 2025).
- Das, V. (2024). Cash assistance through the tax system and financial hardship experienced by lower-income households during the COVID-19 pandemic: How long did the association last? Journal of Family and Economic Issues, 1–24. [Google Scholar] [CrossRef]
- Disney, R., & Gathergood, J. (2013). Financial literacy and consumer credit portfolios. Journal of Banking and Finance, 37(7), 2246–2254. [Google Scholar] [CrossRef]
- Friedline, T., Chen, Z., & Morrow, S. (2021). Families’ financial stress & well-being: The importance of the economy and economic environments. Journal of Family and Economic Issues, 42(Suppl. S1), S34–S51. [Google Scholar] [CrossRef]
- Friedman, M. (1957). A theory of the consumption function. Princeton University Press. [Google Scholar]
- Hasler, A., Lusardi, A., Yagnik, N., & Yakoboski, P. (2023). Resilience and wellbeing in the midst of the COVID-19 pandemic: The role of financial literacy. Journal of Accounting and Public Policy, 42(2), 107079. [Google Scholar] [CrossRef]
- Hilgert, M. A., Hogarth, J. M., & Beverly, S. G. (2003). Household financial management: The connection between knowledge and behavior. Federal Reserve Bulletin, 89(7), 309–322. [Google Scholar]
- Huang, J., Kim, Y., & Birkenmaier, J. (2016). Unemployment and household food hardship in the economic recession. Public Health Nutrition, 19(3), 511–519. [Google Scholar] [CrossRef]
- Huston, S. J. (2010). Measuring financial literacy. Journal of Consumer Affairs, 44(2), 296–316. [Google Scholar] [CrossRef]
- Hwang, H., & Park, H. I. (2023). The relationships of financial literacy with both financial behavior and financial well-being: Meta-analyses based on the selective literature review. Journal of Consumer Affairs, 57(1), 222–244. [Google Scholar] [CrossRef]
- Karpman, M., Zuckerman, S., Gonzalez, D., & Kenney, G. M. (2020). The COVID-19 pandemic is straining families’ abilities to afford basic needs. Urban Institute. Available online: https://www.urban.org/sites/default/files/publication/102124/the-covid-19-pandemic-is-straining-families-abilities-to-afford-basic-needs_2.pdf (accessed on 9 January 2025).
- Klapper, L. F., Lusardi, A., & Panos, G. A. (2012). Financial literacy and the financial crisis (No. w17930). National Bureau of Economic Research. [Google Scholar] [CrossRef]
- Lee, B., Kim, H., & Tavakoli, A. (2023). The impact of economic growth, inflation and unemployment on subjective financial satisfaction: A New global evidence. Cogent Economics and Finance, 11, 2287908. [Google Scholar] [CrossRef]
- Lusardi, A., Hasler, A., & Yakoboski, P. J. (2021). Building up financial literacy and financial resilience. Mind and Society, 20(2), 181–187. [Google Scholar] [CrossRef]
- Lusardi, A., & Mitchell, O. S. (2008). Planning and financial literacy: How do women fare? American Economic Review: Papers & Proceedings, 98(2), 413–417. [Google Scholar] [CrossRef]
- Lusardi, A., & Mitchell, O. S. (2011). Financial literacy: Implications for retirement well-being (No. w17078). National Bureau of Economic Research. [Google Scholar] [CrossRef]
- Lusardi, A., & Streeter, J. L. (2023). Financial literacy and financial well-being: Evidence from the US. Journal of Financial Literacy and Wellbeing, 1(2), 169–198. [Google Scholar] [CrossRef]
- Marley-Payne, J., Fontes, A., & Valdes, O. (2024). You know more than you think: Unrealized knowledge in “Don’t know” responses to financial knowledge questions. Insights: Financial Capability, FINRA Investor Education Foundation. Available online: https://www.finrafoundation.org/sites/finrafoundation/files/2024-12/dont-know-finance-knowledge-brief.pdf (accessed on 20 January 2025).
- Mitchell, O. S., & Lusardi, A. (2015). Financial literacy and economic outcomes: Evidence and policy implications. The Journal of Retirement, 3(1), 107–114. [Google Scholar] [CrossRef]
- Modigliani, F., & Brumberg, R. (1954). Utility analysis and the consumption function: An interpretation of cross-section data. In K. K. Kurihara (Ed.), Post-keynesian economics (pp. 388–436). Rutgers University Press. [Google Scholar]
- Mottola, G. R. (2013). In our best interest: Women, financial literacy, and credit card behavior. Numeracy, 6(2), 4. [Google Scholar] [CrossRef]
- Parker, K., Minkin, R., & Bennett, J. (2020, September 24). Economic fallout from COVID-19 continues to hit lower-income Americans the hardest. Pew Research Center. Available online: https://www.pewresearch.org/social-trends/2020/09/24/economic-fallout-from-covid-19-continues-to-hit-lower-income-americans-the-hardest/ (accessed on 3 January 2025).
- Parolin, Z., Curran, M., Matsudaira, J., Waldfogel, J., & Wimer, C. (2022). Estimating monthly poverty rates in the United States. Journal of Policy Analysis and Management, 41(4), 1177–1203. [Google Scholar] [CrossRef]
- Pearson, B., Korankye, T., Liu, Y., & Qing, D. (2024). Knowing the “don’t knows” to financial literacy questions in the U.S. National Financial Capability Study. Journal of Financial Counseling and Planning, 35(2), 292–304. [Google Scholar] [CrossRef]
- Pilkauskas, N. V., Currie, J. M., & Garfinkel, I. (2012). The great recession, public transfers, and material hardship. Social Service Review, 86(3), 401–427. [Google Scholar] [CrossRef] [PubMed]
- Tranfaglia, A., Lloro, A., & Merry, E. (2024). Question design and the gender gap in financial literacy. FEDS Notes. Board of Governors of the Federal Reserve System. [Google Scholar] [CrossRef]
- Wilmarth, M. J., Kim, K. T., & Pak, T. Y. (2023). What do we really know about “don’t know”? Re-assessing the measurement of financial knowledge. Journal of Consumer Affairs, 57(4), 1623–1649. [Google Scholar] [CrossRef]
- Xiao, J. J., Chen, C., & Chen, F. (2014). Consumer financial capability and financial satisfaction. Social Indicators Research, 118, 415–432. [Google Scholar] [CrossRef]
- Xiao, J. J., Kim, K. T., & Lee, S. (2024). Consumer financial capability and financial wellbeing; Multi-year analyses. Applied Research in Quality of Life, 19(2), 547–580. [Google Scholar] [CrossRef]
- Zhang, Y., & Chatterjee, S. (2023). Financial well-being in the United States: The roles of financial literacy and financial stress. Sustainability, 15(5), 4505. [Google Scholar] [CrossRef]
| Question | Response Options |
|---|---|
| Do you think the following statement is true or false? Buying a single company’s stock usually provides a safer return than a stock mutual fund. | Don’t know True False |
| Imagine that the interest rate on your savings account was 1% per year and inflation was 2% per year. After 1 year, how much would you be able to buy with the money in this account? | Don’t know More than today Exactly the same Less than today |
| Suppose you had $100 in a savings account and the interest rate was 2% per year. After 5 years, how much do you think you would have in the account if you left the money to grow? | Don’t know More than $102 Exactly $102 Less than $102 |
| Variable | Question | Response Options | Coding |
|---|---|---|---|
| Emergency fund availability | Have you set aside emergency or rainy day funds that would cover your expenses for 3 months in case of sickness, job loss, economic downturn, or other emergencies? | No Yes | 1 if “Yes” |
| Spending less than income | In the past month, would you say that your and your spouse’s or partner’s total spending was: | Less than your income The same as your income More than your income | 1 if “Less than your income” |
| Perceived financial comfort | Overall, which one of the following best describes how well you are managing financially these days? | Finding it difficult to get by Just getting by Doing okay Living comfortably | 1 if “Doing okay” or “Living comfortably” |
| No credit card debt | In the past 12 months, how frequently have you carried an unpaid balance on one or more of your credit cards? | Never carried an unpaid balance (always pay in full) Once Some of the time Most or all of the time | 1 if “Never carried an unpaid balance (always pay in full)” |
| Lower Financial Literacy | Higher Financial Literacy | |||
|---|---|---|---|---|
| 2017–2019 | 2020–2022 | 2017–2019 | 2020–2022 | |
| Sample size | 3201 | 8074 | 13,897 | 17,489 |
| Female | 0.47 (0.50) | 0.56 (0.50) | 0.39 (0.49) | 0.43 (0.50) |
| White | 0.56 (0.50) | 0.52 (0.50) | 0.76 (0.43) | 0.72 (0.45) |
| Black | 0.16 (0.37) | 0.17 (0.38) | 0.06 (0.23) | 0.07 (0.26) |
| Hispanic | 0.19 (0.39) | 0.23 (0.42) | 0.09 (0.28) | 0.11 (0.32) |
| Other | 0.08 (0.28) | 0.08 (0.27) | 0.09 (0.29) | 0.10 (0.29) |
| College | 0.29 (0.46) | 0.21 (0.41) | 0.55 (0.50) | 0.51 (0.50) |
| Age | 47.64 (17.01) | 46.37 (17.37) | 50.82 (16.79) | 50.28 (17.46) |
| Income below $50k | 0.35 (0.48) | 0.41 (0.49) | 0.17 (0.37) | 0.16 (0.37) |
| Income between $50k and $100k | 0.31 (0.46) | 0.31 (0.46) | 0.28 (0.45) | 0.28 (0.45) |
| Income above $100k | 0.34 (0.47) | 0.28 (0.45) | 0.55 (0.50) | 0.56 (0.50) |
| Employed | 0.67 (0.47) | 0.61 (0.49) | 0.70 (0.46) | 0.68 (0.47) |
| Unemployed (not retired, no disabilities) | 0.09 (0.28) | 0.10 (0.30) | 0.06 (0.24) | 0.05 (0.23) |
| Retired | 0.19 (0.39) | 0.19 (0.39) | 0.22 (0.41) | 0.23 (0.42) |
| Has disabilities | 0.03 (0.16) | 0.06 (0.24) | 0.01 (0.09) | 0.02 (0.15) |
| Married | 0.57 (0.50) | 0.49 (0.50) | 0.66 (0.47) | 0.64 (0.48) |
| Presence of children aged below 18 | 0.29 (0.45) | 0.32 (0.47) | 0.25 (0.43) | 0.26 (0.44) |
| Lower Financial Literacy | Higher Financial Literacy | ||||||
|---|---|---|---|---|---|---|---|
| (1) 2017–2019 | (2) 2020–2022 | Δ1= (2) − (1) | (3) 2017–2019 | (4) 2020–2022 | Δ2= (4) − (3) | DD= Δ2 − Δ1 | |
| Emergency fund availability | 0.55 (0.50) | 0.45 (0.50) | −0.10 *** (0.01) | 0.70 (0.46) | 0.70 (0.46) | −0.00 (0.01) | 0.10 *** (0.01) |
| Spending less than income | 0.49 (0.50) | 0.46 (0.50) | −0.03 ** (0.01) | 0.63 (0.48) | 0.62 (0.49) | −0.01 * (0.01) | 0.02 † (0.01) |
| Perceived financial comfort | 0.79 (0.41) | 0.68 (0.47) | −0.11 *** (0.01) | 0.86 (0.35) | 0.84 (0.36) | −0.02 *** (0.00) | 0.09 *** (0.01) |
| No credit card debt | 0.43 (0.49) | 0.42 (0.49) | −0.01 (0.01) | 0.59 (0.49) | 0.62 (0.49) | 0.03 *** (0.01) | 0.04 *** (0.01) |
| (1) Emergency Fund Availability | (2) Spending Less Than Income | (3) Perceived Financial Comfort | (4) No Credit Card Debt |
|---|---|---|---|
| 0.06 *** (0.01) | −0.01 (0.01) | 0.06 *** (0.01) | 0.03 * (0.01) |
| Emergency Fund Availability | Spending Less Than Income | Perceived Financial Comfort | No Credit Card Debt |
|---|---|---|---|
| 0.03 ** (0.01) | −0.01 (0.01) | 0.04 *** (0.01) | 0.01 (0.01) |
Disclaimer/Publisher’s Note: The statements, opinions and data contained in all publications are solely those of the individual author(s) and contributor(s) and not of MDPI and/or the editor(s). MDPI and/or the editor(s) disclaim responsibility for any injury to people or property resulting from any ideas, methods, instructions or products referred to in the content. |
© 2025 by the author. Licensee MDPI, Basel, Switzerland. This article is an open access article distributed under the terms and conditions of the Creative Commons Attribution (CC BY) license (https://creativecommons.org/licenses/by/4.0/).
Share and Cite
Das, V. Financial Literacy and Financial Well-Being Amid Varying Economic Conditions: Evidence from the Survey of Household Economics and Decisionmaking 2017–2022. Int. J. Financial Stud. 2025, 13, 79. https://doi.org/10.3390/ijfs13020079
Das V. Financial Literacy and Financial Well-Being Amid Varying Economic Conditions: Evidence from the Survey of Household Economics and Decisionmaking 2017–2022. International Journal of Financial Studies. 2025; 13(2):79. https://doi.org/10.3390/ijfs13020079
Chicago/Turabian StyleDas, Vivekananda. 2025. "Financial Literacy and Financial Well-Being Amid Varying Economic Conditions: Evidence from the Survey of Household Economics and Decisionmaking 2017–2022" International Journal of Financial Studies 13, no. 2: 79. https://doi.org/10.3390/ijfs13020079
APA StyleDas, V. (2025). Financial Literacy and Financial Well-Being Amid Varying Economic Conditions: Evidence from the Survey of Household Economics and Decisionmaking 2017–2022. International Journal of Financial Studies, 13(2), 79. https://doi.org/10.3390/ijfs13020079