

Green Finance and Regional Technological Innovation in China: The Mediating Role of R&D Investment


Abstract
1. Introduction
1.1. Research Background
1.2. Research Gap and Contributions
1.3. Research Structure
2. Literature Review and Theoretical Examination
2.1. Literature Review
2.2. Theoretical Examination and Research Hypotheses
3. Methodological Approach
3.1. Acquisition of Data
3.2. Introduction to Variables
3.2.1. Explained Variables
3.2.2. Explanatory Variables
- ①
- Normalization of Indicators: Raw data are standardized to mitigate the effects of differing units and scales. For positive indicators, the normalization formula is:
- ②
- Calculation of Information Entropy: Based on the standardized values, the entropy for each indicator is computed, reflecting the degree of data variability.
- ③
- Assignment of Indicator Weights: Using the calculated information entropy, the weight of each indicator () is determined:
- ④
- Synthesis of the Green Financial Development Index: Finally, the composite index is derived by aggregating the weighted standardized values:
3.2.3. Control Variables
3.2.4. Mediating and Moderating Variables
3.3. Data Description
3.4. Econometric Specification
3.4.1. Panel Data Fixed Effects Specification
3.4.2. Path Analysis Framework for Mediation Effects
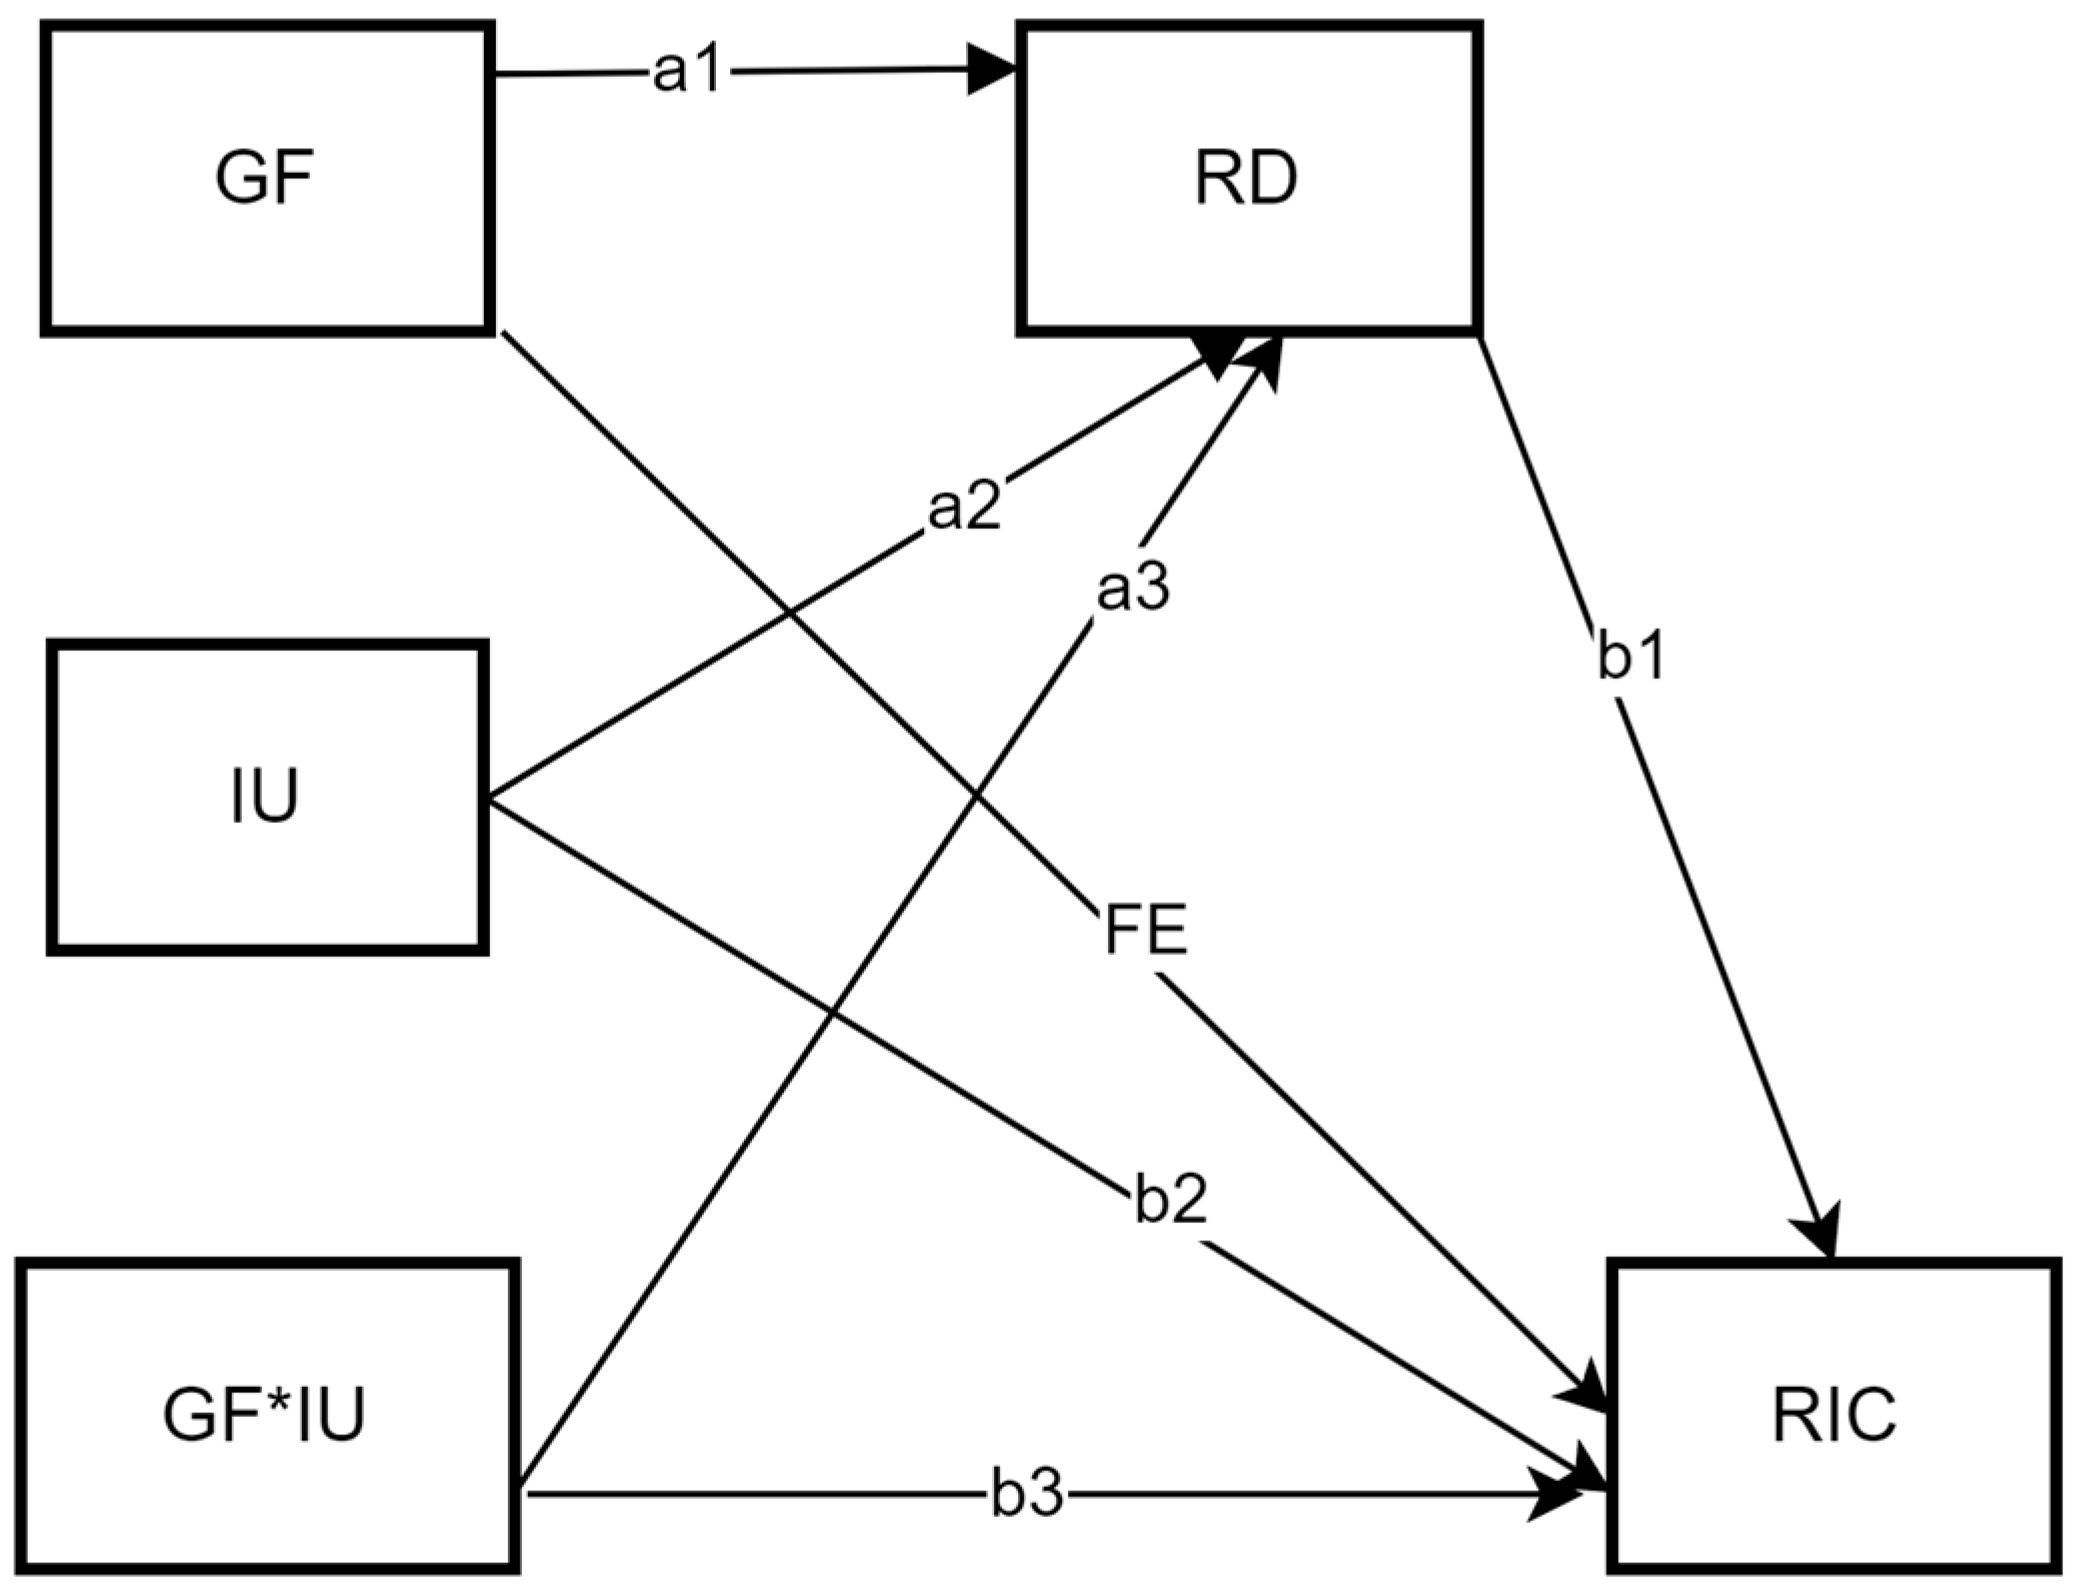
3.4.3. Moderated Mediation Model
4. Observed Findings
4.1. Benchmark Regression Analysis
4.2. Analysis of Mediating Effects
5. Robustness Tests
5.1. Bootstrap Test and Random Shuffling
5.2. Variable Substitution
5.3. Sample Period Adjustment
5.4. Exclusion of Outlier Samples
5.5. Endogeneity Test
5.5.1. Endogeneity Tests for Relationships Among Variables
5.5.2. Endogeneity Test for Sample Selection Bias
- (1)
- Heckman Two-Step Approach
- (2)
- Propensity Score-Based Matching Approach
- (3)
- Weighted Least Squares (WLS)
6. Conclusions, Innovations, and Policy Implications
6.1. Synthesis of Key Findings
6.2. Theoretical and Empirical Innovations
6.2.1. Mediation Mechanism Breakthrough
6.2.2. Regional Heterogeneity Redefined
6.2.3. Methodological Advancements
6.3. Policy Implications
6.4. Constraint and Future Investigations
Author Contributions
Funding
Institutional Review Board Statement
Informed Consent Statement
Data Availability Statement
Conflicts of Interest
References
- Bao, J., & He, M. (2022). Does green credit promote green sustainable development in regional economies? Empirical evidence from 280 cities in China. PLoS ONE, 17(11), e0277569. [Google Scholar] [CrossRef] [PubMed]
- Barney, J. (1991). Firm resources and sustained competitive advantage. Journal of Management, 17(1), 99–120. [Google Scholar] [CrossRef]
- China Science and Technology Strategy Research Institute. (2024). China regional science and technology innovation evaluation report Beijing, China. China Science and Technology Strategy Research Institute. (In Chinese) [Google Scholar]
- Climate Bonds Initiative. (2023). Global state of the market report 2023. Available online: https://www.climatebonds.net/resources/reports/global-state-market-report-2023 (accessed on 26 September 2024).
- Cooke, P. (1992). Regional innovation systems: Competitive regulation in the new Europe. Geoforum, 23(3), 365–382. [Google Scholar] [CrossRef]
- Cooke, P., Uranga, M. G., & Etxebarria, G. (1997). Regional innovation systems: Institutional and organizational dimensions. Research Policy, 26(4–5), 475–491. [Google Scholar] [CrossRef]
- Cui, Y., Zhong, C., Cao, J., & Guo, M. (2023). Can green finance effectively mitigate PM2.5 pollution? What role will green technological innovation play? Energy & Environment. [Google Scholar] [CrossRef]
- Deng, W., Kharuddin, S., & Ashhari, Z. M. (2024). Green finance transforms developed countries’ green growth: Mediating effect of clean technology innovation and threshold effect of environmental tax. Journal of Cleaner Production, 448, 141642. [Google Scholar] [CrossRef]
- Dikau, S., & Volz, U. (2021). Central bank mandates, sustainability objectives and the promotion of green finance. Ecological Economics, 184, 107022. [Google Scholar] [CrossRef]
- Esposito, P., Dicorato, S. L., & Doronzo, E. (2021). The effect of ownership on sustainable development and environmental policy in urban waste management: An explicatory empirical analysis of Italian municipal corporations. Business Strategy and the Environment, 30(2), 1067–1079. [Google Scholar] [CrossRef]
- Funaba, M. (1988). Technology policy and economic performance: Lessons from Japan by christopher freeman and evaluating applied research: Lessons from Japan by John irvine (book review). Japan Quarterly, 35(3), 326. [Google Scholar]
- Geddes, A., Schmidt, T. S., & Steffen, B. (2018). The multiple roles of state investment banks in low-carbon energy finance: An analysis of Australia, the UK and Germany. Energy Policy, 115, 158–170. [Google Scholar] [CrossRef]
- Hu, B., Guo, P., & Gao, M. (2023). Enhancing high-quality development in regional innovation ecosystems. Physics and Chemistry of the Earth, Parts A/B/C, 132, 103488. [Google Scholar] [CrossRef]
- Huang, Y., Chen, C., Lei, L., & Zhang, Y. (2022). Impacts of green finance on green innovation: A spatial and nonlinear perspective. Journal of Cleaner Production, 365, 132548. [Google Scholar] [CrossRef]
- Huang, Z., Liao, G., & Li, Z. (2019). Loaning scale and government subsidy for promoting green innovation. Technological Forecasting and Social Change, 144, 148–156. [Google Scholar] [CrossRef]
- Irfan, M., Razzaq, A., Sharif, A., & Yang, X. (2022). Influence mechanism between green finance and green innovation: Exploring regional policy intervention effects in China. Technological Forecasting Technological Forecasting and Social Change, 182, 121882. [Google Scholar] [CrossRef]
- Jiang, P., Xu, C., & Chen, Y. (2024). Can green finance reduce carbon emission? A theoretical analysis and empirical evidence from China. Pollution Research, 31(24), 35396–35411. [Google Scholar] [CrossRef]
- Jiang, S., Liu, X., Liu, Z., Shi, H., & Xu, H. (2022). Does green finance promote enterprises’ green technology innovation in China? Frontiers in Environmental Science, 10, 981013. [Google Scholar] [CrossRef]
- Lee, C. C., & Lee, C. C. (2022). How does green finance affect green total factor productivity? Evidence from China. Energy Economics, 107, 105863. [Google Scholar] [CrossRef]
- Li, H., Liu, J., & Wang, H. (2024). Impact of green technology innovation on the quality of regional economic development. International Review of Economics & Finance, 93, 463–476. [Google Scholar]
- Li, L., Ma, X., Ma, S., & Gao, F. (2024). Role of green finance in regional heterogeneous green innovation: Evidence from China. Humanities and Social Sciences Communications, 11(1), 1011. [Google Scholar] [CrossRef]
- Lin, B., & Zhang, A. (2024). Digital finance, regional innovation environment, and renewable energy technology innovation: Threshold effects. Renewable Energy, 223, 120036. [Google Scholar] [CrossRef]
- Liu, C., Dai, C., Chen, S., & Zhong, J. (2023). How does green finance affect the innovation performance of enterprises? Evidence from China. Environmental Science and Pollution Research, 30(35), 84516–84536. [Google Scholar] [CrossRef] [PubMed]
- Liu, J. Y., Xia, Y., Fan, Y., Lin, S. M., & Wu, J. (2017). Assessment of a green credit policy aimed at energy-intensive industries in China based on a financial CGE model. Journal of Cleaner Production, 163, 293–302. [Google Scholar] [CrossRef]
- Liu, S., & Wang, Y. (2023). Green innovation effect of pilot zones for green finance reform: Evidence of quasi natural experiment. Technological Forecasting and Social Change, 186, 122079. [Google Scholar] [CrossRef]
- Liu, Y., Deng, W., Wen, H., & Li, S. (2024). Promoting green technology innovation through policy synergy: Evidence from the dual pilot policy of low-carbon city and innovative city. Economic Analysis and Policy, 84, 957–977. [Google Scholar] [CrossRef]
- Lv, C., Bian, B., Lee, C. C., & He, Z. (2021). Regional gap and the trend of green finance development in China. Energy Economics, 102, 105476. [Google Scholar] [CrossRef]
- Meng, Y., Yu, J., Yu, Y., & Ren, Y. (2024). Impact of green finance on green total factor productivity: New evidence from improved synthetic control methods. Journal of Environmental Management, 372, 123394. [Google Scholar] [CrossRef]
- Meo, M. S., & Abd Karim, M. Z. (2022). The role of green finance in reducing CO2 emissions: An overview. finance in reducing CO2 emissions: An empirical analysis. Borsa Istanbul Review, 22(1), 169–178. [Google Scholar]
- Muganyi, T., Yan, L., & Sun, H. P. (2021). Green finance, fintech, and environmental protection: Evidence from China. Ecotechnology, 7, 100107. [Google Scholar] [CrossRef]
- National Bureau of Statistics of China. (2023). China statistical yearbook 2023. Available online: https://data.stats.gov.cn/easyquery.htm?cn=C01 (accessed on 17 November 2024).
- People’s Bank of China. (2024). China’s green loan balance exceeds 30 trillion yuan. People’s Daily Overseas Edition. Available online: https://www.gov.cn/lianbo/bumen/202401/content_6928561.htm (accessed on 26 September 2024). (In Chinese)
- Rasoulinezhad, E., & Taghizadeh-Hesary, F. (2022). Role of green finance in improving energy efficiency and renewable energy development. Energy Efficiency, 15(2), 14. [Google Scholar] [CrossRef]
- Ren, X., Shao, Q., & Zhong, R. (2020). Nexus between green finance, non-fossil energy use, and carbon intensity: Empirical evidence from China based on a vector error correction model. Journal of Cleaner Production, 277, 122844. [Google Scholar] [CrossRef]
- Rogers, E. M. (1962). Diffusion of innovations (3rd ed., pp. 154–196). Free Press. [Google Scholar]
- Schoenmaker, D., & Van Tilburg, R. (2016). What role for financial supervisors in addressing environmental risks? Comparative Economic Studies, 58, 317–334. [Google Scholar] [CrossRef]
- Schumpeter, J. A., & Swedberg, R. (2021). The theory of economic development. Routledge. [Google Scholar]
- Shayegh, S., Reissl, S., Roshan, E., & Calcaterra, M. (2023). An assessment of different transition pathways to a green global economy. Communications Earth & Environment, 4(1), 448. [Google Scholar]
- Shi, L., Sun, J., Lin, J., & Zhao, Y. (2019). Factor decomposition of carbon emissions in Chinese megacities. Journal of Environmental Sciences, 75, 209–215. [Google Scholar] [CrossRef] [PubMed]
- Sun, H., Luo, Y., Liu, J., & Bhuiyan, M. A. (2024). Digital inclusive finance, R&D investment, and green technology innovation nexus. PLoS ONE, 19(1), e0297264. [Google Scholar]
- Surminski, S., & Eldridge, J. (2017). Flood insurance in England—An assessment of the current and newly proposed insurance scheme in the context of rising flood risk. Journal of Flood Risk Management, 10(4), 415–435. [Google Scholar] [CrossRef]
- Tu, W., Zhang, L., Sun, D., & Mao, W. (2023). Evaluating high-tech industries’ technological innovation capability and spatial pattern evolution characteristics: Evidence from China. Journal of Innovation & Knowledge, 8(1), 100287. [Google Scholar]
- Volz, U. (2018). Fostering green finance for sustainable development in Asia. In Routledge handbook of banking and finance in Asia (pp. 488–504). Routledge. [Google Scholar]
- Wang, Y. L., & Zhou, Y. H. (2023). Green finance development and enterprise innovation. Journal of Finance and Economics, 49(01), 49–62. [Google Scholar]
- Wen, Z., & Ye, B. (2014a). Analyses of mediating effects: The development of methods and models. Advances in Psychological Science, 22(5), 731. [Google Scholar] [CrossRef]
- Wen, Z., & Ye, B. (2014b). Different methods for testing moderated mediation models: Competitors or backups? Acta Psychologica sinica, 46, 49–62. [Google Scholar] [CrossRef]
- Wernerfelt, B. (1984). A resource-based view of the firm. Strategic Management Journal, 5(2), 171–180. [Google Scholar] [CrossRef]
- Xinhua. (2024, March 5). China’s R&D expenditure exceeds 3.3 trln yuan in 2023: Minister. Available online: https://english.news.cn/20240305/d3d97f55bdf44d40a49d9ae2224ce0dc/c.html (accessed on 26 September 2024).
- Xu, L., Shu, H., Lu, X., & Li, T. (2024). Regional technological innovation and industrial upgrading in China: An analysis using interprovincial panel data from 2008 to 2020. Finance Research Letters, 66, 105621. [Google Scholar] [CrossRef]
- Zhou, G., Zhu, J., & Luo, S. (2022). The impact of fintech innovation on green growth in China: Mediating effect of green finance. Ecological Economics, 193, 107308. [Google Scholar] [CrossRef]
- Zhou, X., Tang, X., & Zhang, R. (2020). Impact of green finance on economic development and environmental quality: A study based on provincial panel data from China. Science and Pollution Research, 27, 19915–19932. [Google Scholar] [CrossRef] [PubMed]


| Level 1 Indicators | Level 2 Indicators | Description of Indicators | Causality |
|---|---|---|---|
| Regional Innovation capacity (ric) | Knowledge creation 15% | Measuring a region’s ability to generate new knowledge. | Positive |
| Knowledge acquisition 15% | Measurement of a region’s ability to utilise external knowledge and cooperation between industry, academia and research. | Positive | |
| Enterprise innovation 25% | Measures the ability of firms within a region to apply new knowledge, develop new technologies, utilize innovative processes, and manufacture new products. | Positive | |
| Innovation environment 25% | Measure the ability of a region to provide the appropriate environment for the generation, flow and application of technology. | Positive | |
| Innovation performance 20% | The ability to measure the benefits of innovation for the growth and advancement of a region’s economy and society. | Positive |
| L 1 Indicators | L 2 Indicators | L 3 Indicators | Description of Indicators | Causality |
|---|---|---|---|---|
| Green Finance Development Index (gf) | Green credit 50% | Proportion of interest costs within energy-intensive industrial sectors | Interest costs of the six major energy-consuming industrial Industries/Total interest expenditure of industrial industries | Negative |
| Ratio of new bank lending to environmental firms with A-share listings | New bank credit by A-share listed environmental protection companies/Credit to banks by A-share listed companies | Positive | ||
| Green securities 25% | Market capitalisation of A-share listed environmental enterprises | Market capitalisation of A-share listed environmental enterprises/Total market capitalisation of A-share listed enterprises | Positive | |
| Percentage of A-share value of A-share listed companies with high energy consumption | Market capitalisation of A-share listed energy-intensive enterprises/Total market capitalisation of A-share listed enterprises | Negative | ||
| Green insurance 15% | Scale environmental pollution insurance | Income from agricultural insurance/property insurance | Positive | |
| Percentage of compensation from environmental pollution insurance | Agricultural insurance expenditure/Income from agricultural insurance | Positive | ||
| Green investment 10% | Percentage of investment in environmental pollution regulation | Expenditure in environmental pollution control/GDP | Positive | |
| Percentage of fiscal spending on environmental conservation | Fiscal expenditure on environmental protection/Total fiscal expenditure | Positive |
| Name | Symbol | Definition |
|---|---|---|
| Regional innovation capacity | ric | Calculated by the weighted integrated evaluation method |
| Green finance development Index | gf | Entropy weighting |
| Industry Makeup | ind | Value added of secondary sector/GDP |
| Human capital | lnhes | Logarithmic number of general higher education institutions |
| Urbanisation level | ur | Urban/Resident population |
| Science and technology focus | techi | Local finance science and technology expenditure/Local finance general budget expenditure |
| Carbon footprint | lnco2 | Logarithmic carbon dioxide emissions by province and region |
| Capital investment | capi | Investment in fixed assets/Gross regional product |
| Variable | N | Mean | P50 | Sd | Min | Max |
|---|---|---|---|---|---|---|
| lnric | 420 | 3.359 | 3.315 | 0.309 | 2.820 | 4.197 |
| gf | 420 | 0.152 | 0.136 | 0.063 | 0.072 | 0.45 |
| ind | 420 | 0.418 | 0.427 | 0.083 | 0.16 | 0.62 |
| hes | 420 | 84.14 | 83.5 | 38.48 | 9 | 167 |
| ur | 420 | 0.575 | 0.557 | 0.131 | 0.291 | 0.896 |
| techi | 420 | 0.021 | 0.013 | 0.015 | 0.004 | 0.072 |
| co2 | 420 | 362.3 | 265.9 | 305 | 32.12 | 2100 |
| capi | 420 | 0.138 | 0.128 | 0.057 | 0.0450 | 0.457 |
| Variable | VIF | Tolerance |
|---|---|---|
| gf | 1.30 | 0.770 |
| ind | 1.79 | 0.559 |
| lnhes | 2.19 | 0.456 |
| ur | 2.58 | 0.387 |
| techi | 2.93 | 0.341 |
| lnco2 | 2.10 | 0.475 |
| capi | 1.18 | 0.849568 |
| Mean VIF | 2.01 | / |
| Test Method | Statistic | p-Value | corr | abs(corr) | Conclusion |
|---|---|---|---|---|---|
| Hausman Test | 57.88 | 0.001 | / | / | Fixed-effects model selected |
| Pesaran CD Test | 0.83 | 0.395 | 0.012 | 0.045 | Cross-sectional independence |
| Phillips-Perron Test | −3.7521 | 0.0001 | / | / | Panel stationarity |
| Kao Test | 2.677 | 0.003 | / | / | Cointegration exists |
| Variable | Model 1 | Model 2 | Model 3 | Model 4 |
|---|---|---|---|---|
| lnric | lnric | lnric | lnric | |
| gf | 1.315 *** (0.235) | 0.214 *** (0.052) | 0.148 (0.133) | 0.207 *** (0.052) |
| ind | 0.742 *** (0.118) | 0.757 *** (0.133) | ||
| lnhes | 0.174 *** (0.017) | 0.142 ** (0.057) | ||
| ur | 0.337 *** (0.089) | 0.252 (0.300) | ||
| techi | 13.187 *** (0.850) | 2.097 *** (0.477) | ||
| lnco2 | −0.070 *** (0.013) | −0.029 * (0.015) | ||
| capi | 0.427 *** (0.138) | 0.500 *** (0.082) | ||
| Constant | 3.159 *** (0.039) | 3.326 *** (0.008) | 2.142 *** (0.095) | 2.309 *** (0.211) |
| N | 420 | 420 | 420 | 420 |
| R2 | 0.069 | 0.950 | 0.775 | 0.960 |
| Prov FE | NO | YES | NO | YES |
| Year FE | NO | YES | NO | YES |
| r2_a | 0.067 | 0.944 | 0.771 | 0.954 |
| Variable | Model 7 | Model 8 | ||
|---|---|---|---|---|
| rd | lnric | rd | lnric | |
| gf | 0.004 * (0.002) | 0.168 ** (0.068) | 0.063 * (0.031) | 1.609 * (0.891) |
| rd | 9.464 *** (2.781) | 11.469 *** (3.368) | ||
| lniu | −0.006 *** (0.001) | 0.051 (0.046) | ||
| gf × lniu | 0.015 * (0.007) | 0.412 * (0.197) | ||
| control variable | YES | YES | YES | YES |
| Constant | 0.015 *** (0.004) | 2.171 *** (0.203) | 0.026 *** (0.005) | 2.299 *** (0.293) |
| N | 420 | 420 | 420 | 420 |
| Prov FE | YES | YES | YES | YES |
| Year FE | YES | YES | YES | YES |
| R2 | 0.945 | 0.961 | 0.951 | 0.963 |
| R2–a | 0.938 | 0.956 | 0.944 | 0.957 |
| Within– R² | 0.371 | 0.238 | 0.438 | 0.261 |
| F-statistic | 188.17 | 62.52 | 216.49 | 70.57 |
| Sobel Z | 2.347 | 2.103 | ||
| Sobel Z-p value | 0.019 | 0.035 | ||
| bootstrap Z | 2.13 | 1.98 | ||
| bootstrap Z-p value | 0.033 | 0.048 | ||
| Percentage of intermediary effects | 49% | 39.8% | ||
| Variable | (1) | (2) | (3) | (4) | (5) | (6) |
|---|---|---|---|---|---|---|
| lnric | lnci | lnric | lnric | lnric | lnric | |
| gf | 0.207 *** | 0.684 *** | 0.614 *** | 0.573 *** | 0.773 *** | 0.601 *** |
| (0.053) | (0.180) | (0.156) | (0.163) | (0.200) | (0.175) | |
| ind | 0.757 *** | 1.562 *** | 1.286 ** | 3.019 *** | 1.467 ** | |
| (0.135) | (0.500) | (0.519) | (0.590) | (0.568) | ||
| is | −1.705 *** | |||||
| (0.462) | ||||||
| lnhes | 0.142 ** | −0.213 | −0.413 | −0.552 | −0.235 | |
| (0.059) | (0.255) | (0.263) | (0.330) | (0.260) | ||
| hep | −35.255 | |||||
| (26.260) | ||||||
| ur | 0.252 | 0.636 | 0.294 | 2.822 ** | 2.742 | 1.460 |
| (0.301) | (0.760) | (0.842) | (1.094) | (1.694) | (1.027) | |
| techi | 2.097 *** | 4.302 ** | 5.425 *** | 2.040 | 4.526 * | 4.803 ** |
| (0.475) | (1.762) | (1.483) | (1.358) | (2.284) | (1.918) | |
| lnco2 | −0.029 * | −0.028 | −0.069 | −0.095 | 0.001 | |
| (0.015) | (0.049) | (0.048) | (0.058) | (0.056) | ||
| lnso2 | 0.086 * | |||||
| (0.042) | ||||||
| capi | 0.500 *** | 0.997 ** | 1.135 *** | 0.844 ** | 0.730 * | 1.046 ** |
| (0.088) | (0.354) | (0.348) | (0.339) | (0.374) | (0.350) | |
| od | −0.521 ** | |||||
| (0.176) | ||||||
| ep | −0.516 | |||||
| (1.455) | ||||||
| fd | −0.323 | |||||
| (1.347) | ||||||
| lnsize | 0.887 * | |||||
| (0.449) | ||||||
| Constant | 2.309 *** | 3.076 ** | 3.524 *** | −3.983 | 3.066 *** | 2.565 ** |
| (0.213) | (1.060) | (0.454) | (3.251) | (0.887) | (1.098) | |
| N | 420 | 420 | 420 | 420 | 300 | 392 |
| Prov FE | YES | YES | YES | YES | YES | YES |
| Year FE | YES | YES | YES | YES | YES | YES |
| R² | 0.960 | 0.868 | 0.871 | 0.880 | 0.893 | 0.859 |
| R²_a | 0.960 | 0.851 | 0.853 | 0.863 | 0.874 | 0.840 |
| Within_ R² | 0.205 | 0.127 | 0.144 | 0.208 | 0.191 | 0.136 |
| F-statistic | 426.23 | 26.57 | 28.25 | 497.77 | 108.14 | 14.99 |
| Variable | Coefficient | Number of Permutations | p-Value | 95% Confidence Interval |
|---|---|---|---|---|
| gf | 0.207 | 1000 | 0.001 | [0.0000253, 0.0055589] |
| Variable | GF & RIC | RD & RIC | GF & RD | |||
|---|---|---|---|---|---|---|
| (1) lnric | (2) lnric | (3) lnric | (4) lnric | (5) lnric | (6) lnric | |
| gfl1 | 0.129 ** (0.062) | 0.175 ** (0.103) | ||||
| gfl1, lngdp | 0.118 ** (0.056) | |||||
| rdl1 | 2.598 ** (1.019) | |||||
| rdl1, hep | 2.640 ** (1.018) | |||||
| gfl1, fd | 0.170 ** (0.154) | |||||
| control variable | YES | YES | YES | YES | YES | YES |
| Constant | −0.022 (0.041) | −0.016 (0.045) | 0.096 * (0.051) | 0.097 * (0.051) | 0.143 (0.041) | 0.141 (0.045) |
| Prov FE | YES | YES | YES | YES | YES | YES |
| Year FE | YES | YES | YES | YES | YES | YES |
| First-stage F statistic | 939.513 | 469.257 | 743.148 | 829.754 | 939.513 | 474.851 |
| Kleibergen-Paap rk LM statistic | 11.934 *** | 11.941 *** | 12.463 *** | 12.637 *** | 11.934 *** | 12.525 *** |
| Kleibergen-Paap Wald rk F statistic | 1016.958 (16.38) | 735.997 (19.93) | 770.996 (16.38) | 1133.605 (19.93) | 1016.958 (16.38) | 551.437 (19.93) |
| Hansen J p value | / | (0.270) | / | (0.331) | / | (0.148) |
| N | 390 | 390 | 390 | 390 | 390 | 390 |
| 0.504 | 0.534 | 0.614 | 0.644 | 0.509 | 0.610 | |
| Variable | Heckman | PSM | WLS | |
|---|---|---|---|---|
| Selected | lnric | lnric | lnric | |
| gf | 0.498 ** (5.166) | 0.320 * (0.158) | ||
| gfdummy | 0.040 ** (0.017) | 0.057 *** (0.015) | ||
| ind | 10.353 * (5.593) | 0.844 *** (0.158) | 0.751 *** (0.138) | 0.584 ** (0.208) |
| lnhes | 2.164 (2.934) | 0.070 (0.060) | 0.126 ** (0.055) | 0.106 (0.068) |
| ur | 11.128 (11.064) | 0.373 (0.297) | 0.155 (0.312) | 0.369 (0.397) |
| techi | −85.195 *** (31.270) | 1.028 (0.928) | 2.181 *** (0.475) | 2.466 *** (0.583) |
| lnco2 | 0.206 (1.135) | −0.035 (0.020) | −0.035 ** (0.015) | −0.018 (0.019) |
| capi | −8.384 * (4.345) | 0.575 *** (0.137) | 0.514 *** (0.079) | 0.508 *** (0.092) |
| mills | −0.007 (0.010) | |||
| ATT | 0.090 *** (0.030) | |||
| Constant | −11.934 (9.463) | 2.528 *** (0.355) | 2.459 *** (0.222) | 2.353 *** (0.263) |
| Observations | 238 | 238 | 420 | 420 |
| R-squared | 0.534 | 0.934 | 0.960 | 0.960 |
Disclaimer/Publisher’s Note: The statements, opinions and data contained in all publications are solely those of the individual author(s) and contributor(s) and not of MDPI and/or the editor(s). MDPI and/or the editor(s) disclaim responsibility for any injury to people or property resulting from any ideas, methods, instructions or products referred to in the content. |
© 2025 by the authors. Licensee MDPI, Basel, Switzerland. This article is an open access article distributed under the terms and conditions of the Creative Commons Attribution (CC BY) license (https://creativecommons.org/licenses/by/4.0/).
Share and Cite
Li, A.; Supanut, A.; Liu, J. Green Finance and Regional Technological Innovation in China: The Mediating Role of R&D Investment. Int. J. Financial Stud. 2025, 13, 78. https://doi.org/10.3390/ijfs13020078
Li A, Supanut A, Liu J. Green Finance and Regional Technological Innovation in China: The Mediating Role of R&D Investment. International Journal of Financial Studies. 2025; 13(2):78. https://doi.org/10.3390/ijfs13020078
Chicago/Turabian StyleLi, Ading, Adul Supanut, and Jianxu Liu. 2025. "Green Finance and Regional Technological Innovation in China: The Mediating Role of R&D Investment" International Journal of Financial Studies 13, no. 2: 78. https://doi.org/10.3390/ijfs13020078
APA StyleLi, A., Supanut, A., & Liu, J. (2025). Green Finance and Regional Technological Innovation in China: The Mediating Role of R&D Investment. International Journal of Financial Studies, 13(2), 78. https://doi.org/10.3390/ijfs13020078