1. Introduction
The impact of environmental, social, and governance (ESG) on the economy, in particular the energy industry, is not well understood. Energy companies are the heart of the ESG ecosystem as their environmental exposure is the highest among all the sectors (
S&P Global Ratings, 2019,
2020). The social and governance risks of this sector are also well above the averages of other industries in the economy. In addition, increasing scrutiny from primary project stakeholders, including environmental campaigners, has galvanized public and boardroom-level opinions of the leading financial institutions. While this applies to many industries, energy companies face more pressure from external environmental and social justice lobbying groups that exert pressure on public and government opinions. A vast majority of energy companies are mindful of such mounting pressure and have put strong ESG policies and procedures in place as risk management tools. There has also been an increasingly wide range of ESG performance data disclosed by companies. However, it is unclear what specific ESG-related activities have a positive impact and which ones are the drags on the short-term financial performances. Such analysis is the main contribution of our research. We accomplish this by examining how a wide range of ESG-related activities and controversies in the energy sector are priced in the stock market.
ESG activities are essentially a form of investment that entails initial outlays and recurring costs for future benefits. The main criticism lies in its conflicting goals of maximizing shareholder value and spending capital on environmental and social well-being. ESG is expected to positively impact companies’ growth, profitability, capital efficiency, risk exposure, and valuations. A strong ESG proposition also has the potential to create value due to non-financial factors such as environmental stewardship, reputation, transparency, employee satisfaction, stakeholders’ engagement, customer value, etc. (
Taliento et al., 2019;
Wibbens & Siggelkow, 2020;
Zumente & Bistrova, 2021;
Siew et al., 2013;
Eccles et al., 2014). On the other hand, the popular press and analysts have made arguments on whether the benefits outweigh the costs (
Russo & Fouts, 1997;
Branco & Rodrigues, 2006;
Barnett, 2007;
Gregory et al., 2014;
Maurer, 2024;
Duque-Grisales & Aguilera-Caracuel, 2021).
The existing empirical tests on ESG performance and valuations have documented mixed results. Although most of the studies show that the linkages between ESG and financial performance are growing, it is unclear what aspects of ESG specifically affect valuation. It is suggested that further scholarship with broader ESG parameters that capture a wide variety of ESG metrics as a part of overall firm activity would add value to the current literature. It is important to identify which ESG factors or a combination of factors underlie improved financial performance (
Esty & Cort, 2020). Accordingly, we go beyond the three ESG performance scores and dig deeper by incorporating a wide variety of ESG risk factors and ESG controversy metrics that capture ESG scandals and penalties in our analysis.
We conduct our analysis in three stages, beginning with the overall impact of ESG performance, followed by an assessment of the relative influence of the three ESG pillars, and concluding with an analysis of specific ESG subcategories. Our study makes the following contributions: first, in addition to the three ESG performance scores, we also include 10 additional ESG metrics that capture systematic and unsystematic risks embedded in the ESG activities. We also analyze the impact of ESG controversy variables on market valuations. The inclusion of these 10 ESG risk factors and ESG controversy variables is one of the major contributions of our research. Third, our study focuses exclusively on the oil and gas industry, which, although is one of the most sensitive sectors to ESG activities, is little studied in the context of ESG. Fourth, we analyze the ESG trends and examine the dynamic relationship among ESG performances, factors, controversies, and market valuations. We do so by employing the most comprehensive ESG data provided by LSEG (formerly Refinitiv), which is considered to be of high quality, auditable, and the most objective in the industry. Overall, we aim to provide a detailed evaluation of companies’ sustainability by examining the mechanisms by which ESG leads to value creation and erosion in the oil and gas industry. We provide empirical tests on the identification of the specific types of ESG activities that drive valuations and the ones that distort them in the energy sector.
Consistent with prior studies, we find significant positive impacts of ESG score and the environmental and governance performance pillar metrics on market capitalization. We also find that the magnitude of the impact of the environmental pillar is the highest, which corroborates the findings that the environmental risk of the energy sector, such as inherent exposure to greenhouse emissions and pollution, is one of the highest among all industries in the economy. Specifically, among the environmental risk factors, there are significant positive effects of environmental resource use and environmental innovations, while a negative impact of environmental emissions on valuations. This suggests that in the context of ESG, the use of new environmental technologies and processes is one of the major drivers of value creation, while outlays towards reducing emissions in production and operational processes distort valuation in the oil and gas industry. Among social factors, effectiveness towards fundamental human rights and commitments towards public health and business ethics are value enhancers. Similarly, commitment and effectiveness towards corporate governance principles has also a positive impact on valuation. Lastly, we find that the strong linkages between ESG risks and market valuations have consistently held over the recent years.
These findings have significant implications for energy companies, which, on average, are under-allocating resources to environmental initiatives and potentially missing opportunities to improve valuations. Although these companies are proficient in managing environmental emissions—which negatively impact valuations—they are lagging in environmental innovation, which has a positive effect on market performance. This suggests that energy firms are prioritizing ESG efforts that erode value, while under-investing in ESG initiatives that could create value.
Overall, the results suggest that ESG performances seem to factor into asset valuation equations as both risks as well as opportunities. The analysis of ESG risk factors has the potential to improve valuations. We argue that sustainability can create value and mitigate risks as companies become more resilient, particularly when it is aligned to core competencies. These findings carry important implications for both academic research and industry practice. First, the relatively higher influence of the environmental pillar compared to governance suggests that ESG-related studies on the energy sector should allocate greater analytical emphasis to environmental dimensions, particularly in modeling firm performance, risk, and valuation. The differential impact among environmental subcategories—positive for resource use and innovation, and negative for emissions—highlights the need for more granular ESG analyses that go beyond aggregated scores. For practitioners, these results reinforce the strategic importance of targeted environmental investments and emissions management as key drivers of stakeholder trust and long-term firm value. The results have also important implications for investors who can improve their portfolio performances by incorporating ESG in their investment strategy. Investors’ portfolio performance can therefore be improved if one can identify the level and the types of ESG activities and firm commitments that have the potential to create value despite negative short-term financial performances (for example, investments in environmental innovations) and ones that can potentially distort value (for example, investments in reducing environmental emissions).
The remainder of this paper is organized as follows:
Section 2 discusses the theoretical foundation, while
Section 3 presents the model.
Section 4 presents the data and
Section 5 presents the estimation results.
Section 6 concludes.
3. Model
We investigate the following three research questions: (i) What is the relative impact of ESG performance and ESG controversies on market valuations? (ii) What is the relative impact of the 10 unique ESG systematic and idiosyncratic risks on market valuations? (iii) How has the dynamic relationship of ESG performance, systematic and idiosyncratic risk, and controversies with market valuation changed after the pandemic? We describe our model to examine the above research questions as follows:
Firstly, we formulate the following equations to investigate the extent to which the ESG performance and ESG controversies impact valuations, i.e., the mechanism in which ESG leads to value creation and erosion:
where
MCit is the market capitalization of the
ith company in the year
t. In Model (1a), the coefficients
β1 and
β2 capture the impact of the ESG performances and controversies on the market valuations. The second Equation (1b) is modeled to examine whether the impact of the ESG score and controversies has significantly increased or decreased in the post-COVID period. Following (
Chatterjee et al., 2022), we introduce an indicator variable POST (=1 for years 2020 and onwards, zero otherwise). A significant positive (negative) parameter
β2 would suggest that the market valuations have significantly increased (decreased) during the post-COVID period. Similarly, the interaction of the variable POST with ESG captures whether the impact of ESG during the post-COVID period is higher or lower during the earlier periods. Specifically, a significant positive (negative) parameter
β3 would suggest that the impact of ESG on market valuations has significantly increased (decreased) during the post-COVID period. Since the interaction variable is created to capture the incremental effect of ESG during the post-pandemic period, it will be included in the model (1b) only if the impact of ESG is significant in Equation (1a).
Following the above approach, we formulate the following Equations (2a) and (2b) to investigate the relative impact of the 3 ESG performance pillars on market valuations and whether their effects have significantly increased or decreased during the post-COVID period:
where the variables
Eit,
Sit, and
Git are the three pillar scores for environmental, social, and governance, respectively.
Ct is a set of control variables that have been shown to impact valuations in the conditional asset pricing literature. In Model (2a), the coefficients
β1,
β2, and
β3 capture the effects of the environmental, social, and governance pillars, respectively, on market valuations. In Equation (2b), the interactions of POST with E, S, and G capture their incremental effects in the post-pandemic period. A significant positive (negative) parameter
β4 would suggest that the market valuations have significantly increased (decreased) during the post-COVID period. Similarly, the interaction of the variable POST with the variables, E, S and, G captures whether the impact of three performance pillars during the post-COVID period is higher or lower during the earlier periods. Specifically, significant positive (negative) parameters
β5,
β6, and
β7 would suggest that their impacts have significantly increased (decreased) during the post-COVID period.
To obtain an in-depth understanding of how several activities related to environmental, social, and governance topics for a company impact its market valuation, we dig deeper by incorporating the criteria that are the determinates of the three ESG pillars. Specifically, we employ 3 subcategories for environmental, 4 for social, and 3 for governance. Accordingly, we formulate Equations (3a)–(5b) to investigate our research question on the relative impact of the environmental, social, and governance criteria scores, respectively, on market valuations. To avoid overparameterization, we employ three sets of separate regressions:
where
MCit is the market capitalization of the
ith company in the year
t. The variables
E1it, E2it, and
E3it are the three environmental criteria scores (resource use, emission, and innovation) for the
ith company in the year
t. Cit is a set of control variables that have been shown to impact valuations in the conditional asset pricing literature. In Equation (3a), coefficients
1 −
3 capture the effects of the three determinants of the environmental score—resource use (E1), emission (E2), and innovation (E3)—on the market valuations. We model Equation (3b), which includes interactions of the variable POST with the variables E1, E2, and E3 to capture their incremental effects in the post-COVID period. A significant positive (negative) parameter
4 would suggest that the market valuations have significantly increased (decreased) during the post-COVID period. Similarly, the interaction of the variable POST with the variables E1, E2, and E3 captures whether the impact of the three determinants of the environmental pillar during the post-COVID period is higher or lower during the earlier periods. Specifically, significant positive (negative) parameters
5,
6, and
7 would suggest that their impacts have significantly increased (decreased) during the post-COVID period.
We follow the above-described approach and model the following Equations (4a) and (4b) to analyze the impact of the four subcategories of the social pillar and if the effects have increased during the post-pandemic period:
where
MCit is the market capitalization of the
ith company in the year
t. The variables
S1it,
S2it,
S3it, and
S4it are the four social criteria scores (workforce, human rights, community, and product responsibility) for the
ith company in the year
t. Cit is a set of control variables that have been shown to impact valuations in the conditional asset pricing literature. In Equation (4a), the parameters
1 −
4 capture the effects of the four social subcategories on the market valuations. Equation (4b) is designed to examine whether the association of the three social subcategories, S1, S2, S3, and S4 differ in the pre-and post-periods. A significant positive (negative) parameter
5 would suggest that the market valuations have significantly increased (decreased) during the post-pandemic period. Similarly, the interaction of the variable POST with the variables, S1, S2, S3, and, S4 captures whether the impact of the four determinants of social pillar during the post-pandemic period is higher or lower during the earlier periods. Specifically, significant positive (negative) coefficients
6,
7,
8, and
9 would suggest that their impacts have significantly increased (decreased) during the post-COVID period.
On similar lines, we focus on the governance subcategories G1, G2, and G3 on market valuation. To do so, we use the following regression models:
where
MCit is the market capitalization of the
ith company in the year
t. The variables
G1it,
G2it, and
G3it are the three governance criteria scores (management, shareholders, and CSR strategies) for the
ith company in the year
t. Cit is a set of control variables that have been shown to impact valuations in the conditional asset pricing literature. In Equation (5a), the parameters
ϕ1 −
ϕ3 capture the effects of these three governance subcategories on the market valuations. In Model (5b), the interaction variables of POST with three governance subcategories isolate their incremental impact of G1, G2, and G3 during the post-pandemic period. A significant positive (negative) parameter
ϕ4 would suggest that the market valuations have significantly increased (decreased) during the post-pandemic period. Similarly, the interaction variable captures if the effects of the three governance subcategories have increased or decreased during the post-pandemic periods. Specifically, significant positive (negative) coefficients
5,
ϕ6, and
ϕ7 would suggest that their impacts have significantly increased (decreased) during the post-COVID period.
We reiterate that in the above Equations (1b)–(5b), a dummy variable (POST) is multiplied with a set of independent variables to examine their incremental impact during the post-pandemic period. Therefore, we include these interaction variables in the estimation process only if the impact of the respective independent variables is significant in the first set of Equations (1a)–(5a). To avoid over-parametrization and multicollinearity, the insignificant variables in the first set of equations are not used as interaction variables in the second set of equations.
Finally, we place importance on jointly modeling all the ESG to examine the related effect of each of the ESG activities. Studies show that there is interconnectedness between ESG and financial performance but it is unclear what aspects of sustainability specifically drive financial performance. Accordingly, we present the final model below:
As before, the dependent variable (MC) continues to be the log value of the market capitalization of the firm in a given year t. The above equations include the 10 ESG subcategories variables to investigate their relative impact on market valuation, and that is one of the major contributions of our research. This allows us to conduct a detailed evaluation of the company’s sustainability and its impact on market valuation in the oil and gas sector over time.
An alternative approach to the models presented could involve incorporating industry sub-segments through the use of dummy variables. This would allow for the differentiation of firms based on specific characteristics within the broader energy sector—such as renewable versus non-renewable energy, upstream versus downstream operations, or traditional versus emerging technologies. By doing so, the model could account for potential heterogeneity in ESG effects across these sub-segments, offering more nuanced insights into how ESG factors influence firm valuation within distinct areas of the energy industry. We discuss the results in the next section.
4. Data
We obtain our data from LSEG, which is one of the most comprehensive and reliable sources for ESG scores, especially because they independently collect the data and do not rely on companies’ self-reporting of the ESG data. LSEG captures and calculates over 630 company-level ESG measures, of which a subset of 186 of the most comparable and material per industry is used for the overall company assessment and scoring process. Our initial sample consists of 430 firms in the energy industry over 6 years from 2017 to 2022. We start with a total sample of 2580 firm-year observations. We delete observations with missing values on key variables to arrive at a final sample of 1300 observations for 130 unique firms (since we require a balanced panel, we delete firm-year observations that do not have data for all years in the sample period). We restrict our sample period to 2017–2022 as the ESG data is very thinly populated in the years prior to this period. We require a balanced panel, so the inclusion of data prior to 2017 results in losing significant firms that have ESG-related scores in the sample period. Our final sample contains annual data on 130 energy companies for the financial years 2017–2022. Specifically, we have obtained data for the “oil, gas, and consumable fuels” industry, which includes the following five subcategories: coal and consumable fuels, integrated oil and gas, oil and gas exploration and production, oil and gas refining and marketing, and oil and gas storage and transpiration.
ESG ratings often exhibit considerable variation across providers, largely due to differences in data sources, methodological frameworks, and the degree of transparency. Leading providers such as MSCI and Sustainalytics integrate a blend of qualitative assessments, proprietary data, and analyst discretion, introducing greater subjectivity into the evaluation process. These methodological divergences frequently result in low correlations among ESG scores from different providers, which pose challenges for investment decision-making. LSEG’s emphasis on transparency and its structured, replicable framework render it particularly suitable for academic analyses aimed at achieving consistency and methodological rigor.
We employ the following three categories of data:
(1) Market capitalization (MC): The value of a company can be determined from different perspectives, with different objectives, and by using different calculation methods (enterprise value, market capitalization, Tobin’s Q, book value, price-to-earnings ratio, discounted cash flow, etc.). Since our objective is to link valuations with ESG, we follow
Șerban et al. (
2022), which suggests that market capitalization is a better measure of the discounted (future) cash flows from investors’ perspectives. It gives a clear picture from investors’ perspectives since it is based on the expectations of both financial performance and non-financial factors. Market capitalization as a measure of valuation is also used in studies for oil and gas companies (
Ewing & Thompson, 2016;
Kumar & Kumara, 2021) and converges with our objective of linking ESG with valuation in the oil and gas sector. We calculate the log values of the market capitalization in USD millions in our estimation.
(2) ESG data: We gather data for the overall ESG, three ESG pillars, ESG controversy, and 10 ESG criteria scores which reflect the company’s ESG performance, commitment, and effectiveness based on publicly reported information. These ratings are on a scale from 0 (worst) to 100 (best) and the details are as follows:
(a) ESG pillar scores: Companies with higher ratings demonstrate strong ESG performance and lower exposure to ESG risks;
(b) Environmental score (E): Environmental pillar score is the weightage average relative rating of a company based on reported environmental information and the resulting three environmental category scores (resource use, emission, and innovation);
(c) Social score (S): Social pillar score is the weightage average relative rating of a company based on reported social information and the resulting four social category scores (workforce, human rights, community, and product responsibility);
(d) Governance score (G): Governance pillar score is the weightage average relative rating of a company based on reported governance information and the resulting three governance category scores (management, shareholders, and CSR strategy);
(e) ESG criteria scores: The 10 ESG category scores that are rolled up into three pillar scores are as follows:
(i) Resource use (E1): This reflects a company’s performance and capacity to reduce the use of materials, energy, or water and to find more eco-efficient solutions by improving supply chain management;
(ii) Emission (E2): This measures a company’s commitment and effectiveness towards reducing environmental emissions in its production and operational processes;
(iii) Innovation (E3): This reflects a company’s capacity to reduce the environmental costs and burdens for its customers, thereby creating new market opportunities through new environmental technologies and processes or eco-designed products;
(iv) Workforce (S1): This score measures a company’s effectiveness in terms of providing job satisfaction and a healthy and safe workplace, maintaining diversity and equal opportunities, and providing development opportunities for its workforce;
(v) Human rights (S2): This measures a company’s effectiveness in terms of respecting fundamental human rights conventions;
(vi) Community (S3): The community score measures the company’s commitment to being a good citizen, protecting public health, and respecting business ethics;
(vii) Product responsibility (S4): This reflects a company’s capacity to produce quality goods and services, integrating the customer’s health and safety, integrity, and data privacy;
(viii) Management (G1): The management score measures a company’s commitment and effectiveness towards following best practice corporate governance principles;
(ix) Shareholders (G2): The shareholders score measures a company’s effectiveness towards equal treatment of shareholders and the use of anti-takeover devices;
(x) CSR strategy (G3): This score reflects a company’s practices to communicate that it integrates economic (financial), social, and environmental dimensions into its day-to-day decision-making processes;
(f) ESG controversies (EC): This score is calculated based on 23 ESG controversy topics. During the year, if a scandal occurs, the company involved is penalized and this affects their overall ESG score. The controversies score also addresses the market cap bias which large-cap companies suffer, as they attract more media attention than smaller-cap companies. Companies with no controversies receive a score of 100, while the ones with greater controversies are given lower scores.
(3) Control variables: We include the following four control variables that have been shown to impact market valuations in prior studies on ESG (
Gregory et al., 2014;
Fernando et al., 2010;
Pavone, 2019;
Alareeni & Hamdan, 2020;
Diana, 2015;
Dang et al., 2019;
Landi & Sciarelli, 2019;
Al-Afeef, 2020;
Deng & Cheng, 2019;
Șerban et al., 2022):
(i) Total assets (TA), to calculate the log values of total assets in USD millions to control for size;
(ii) Return on assets (ROA), to capture profitability;
(iii) EBITDA, to capture the cash flow from operations (CF);
(iv) Earnings per share (EPS), to measure stock market performance.
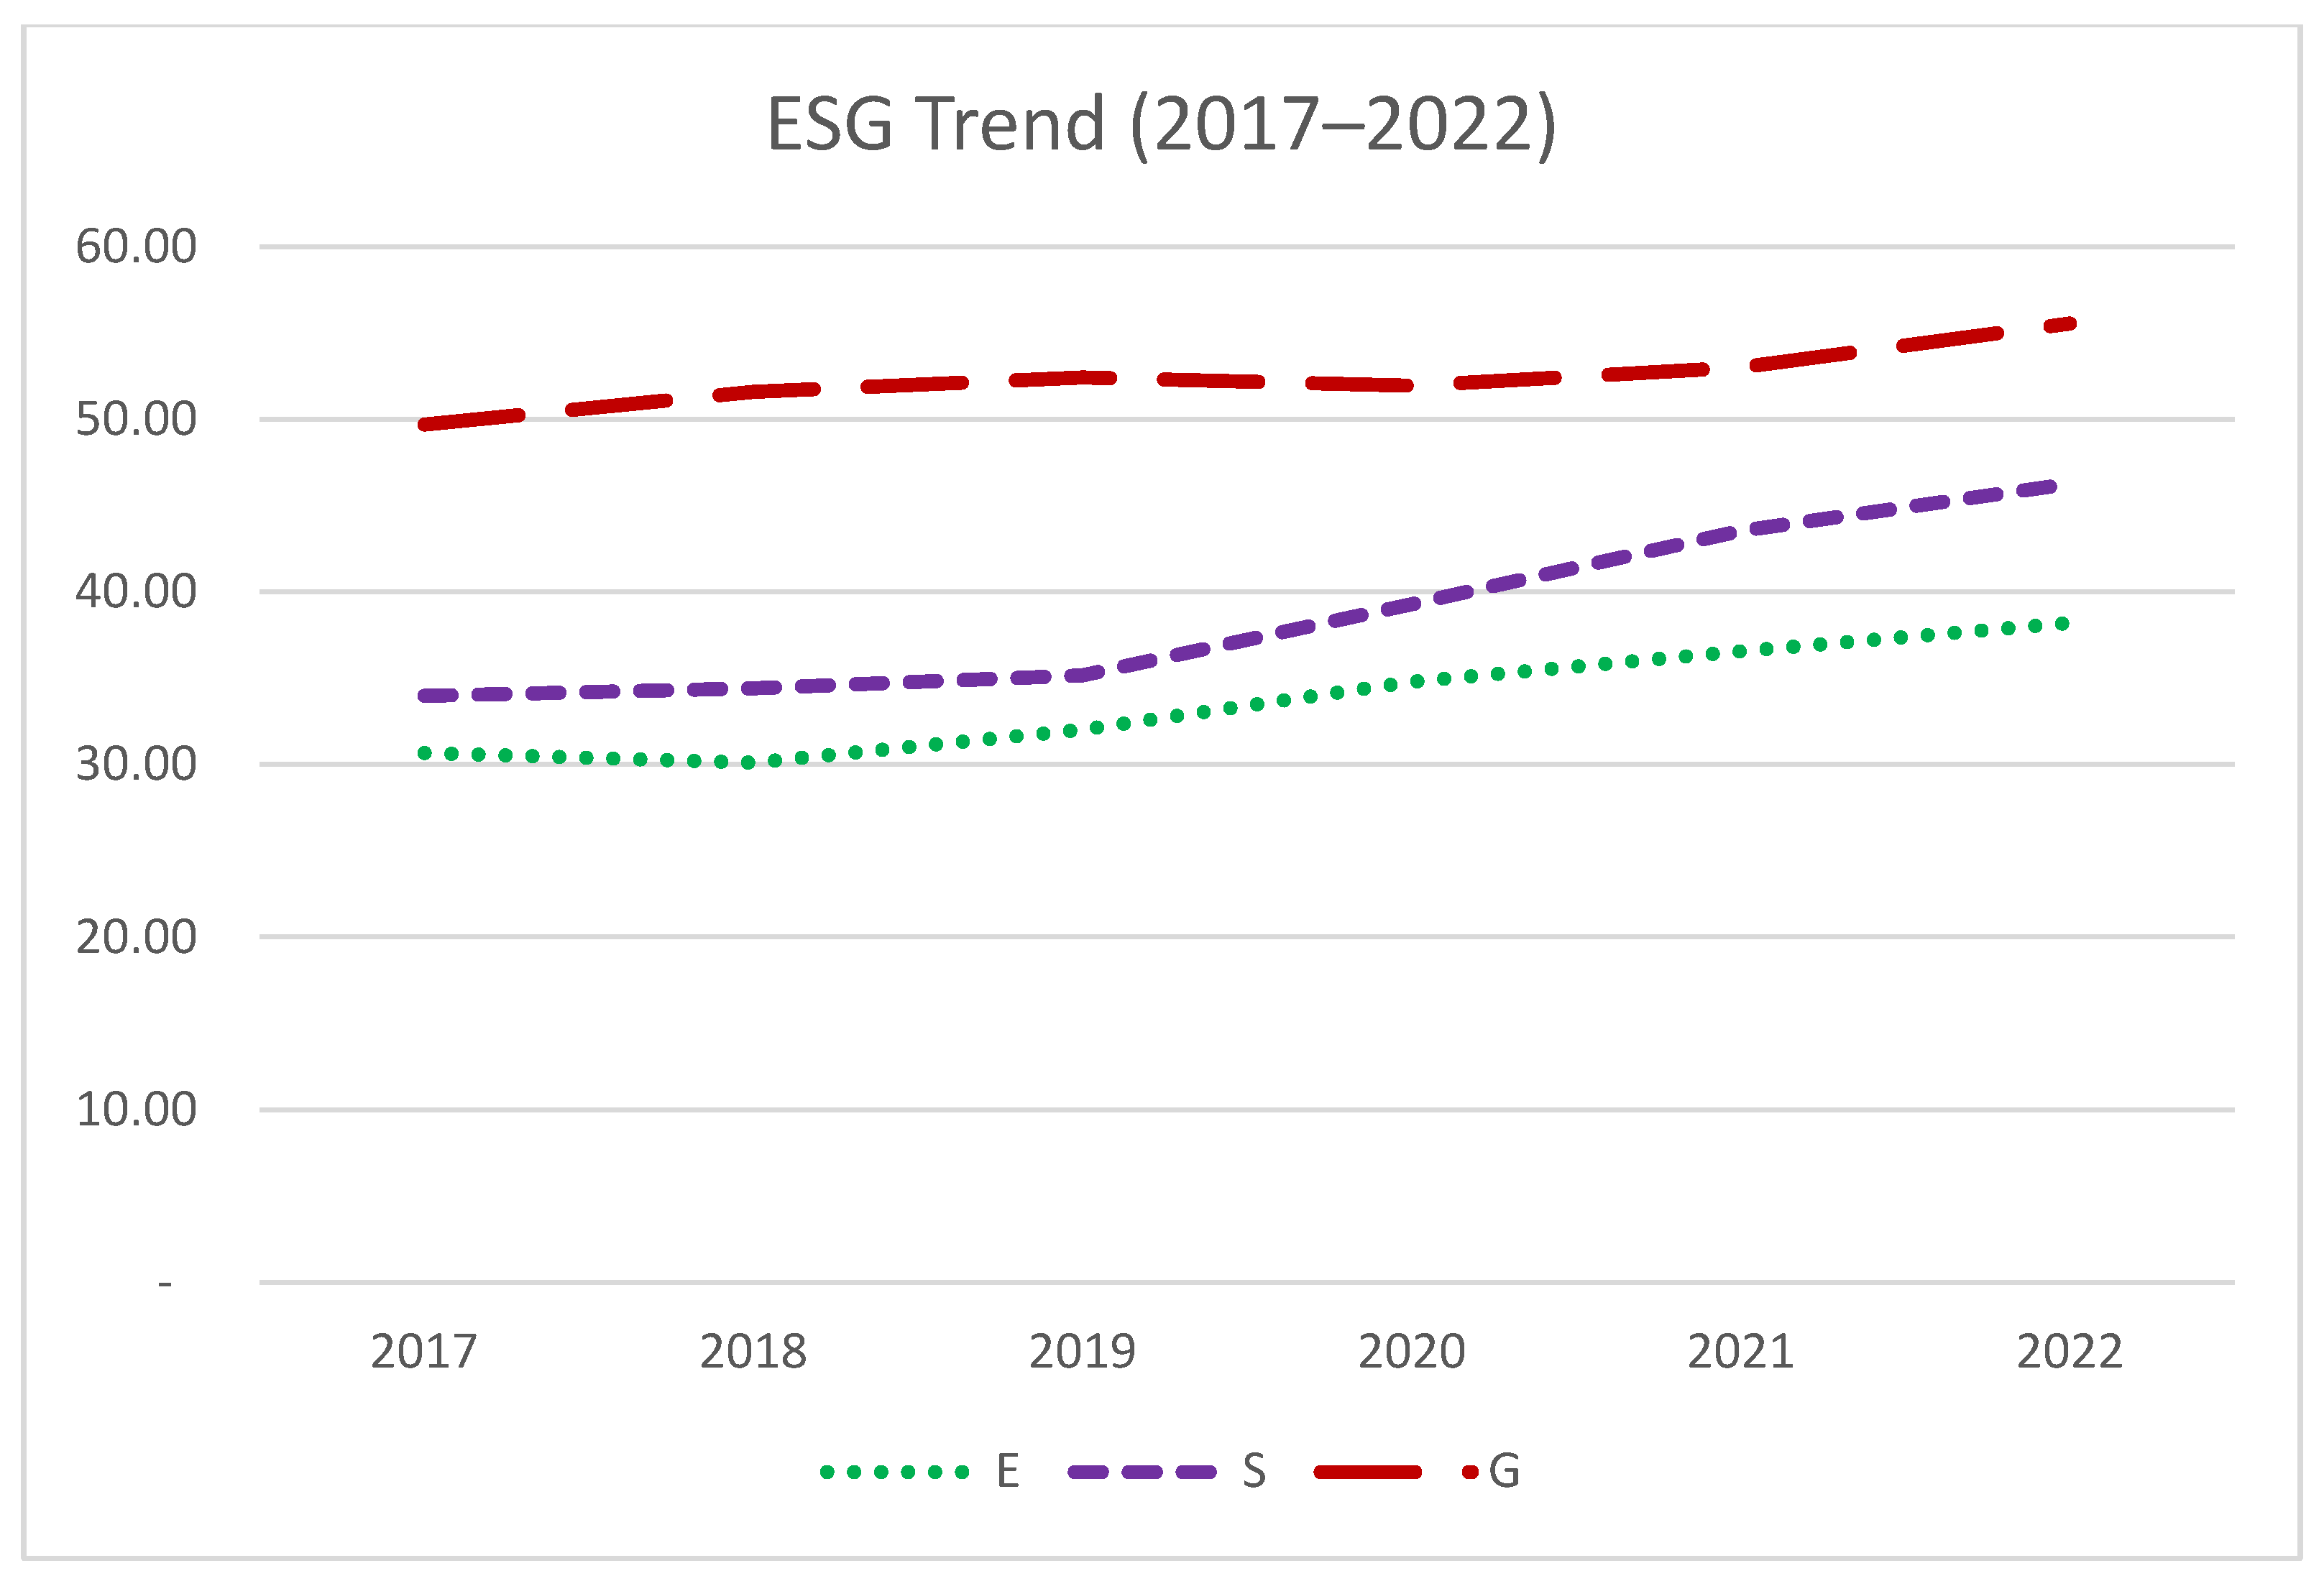
Figure 1 presents a trend analysis of the average scores for the three ESG components from 2017 to 2022, showing an overall upward trend across the sample period. Governance consistently scores the highest, followed by social and environmental factors. The lower score for the E pillar aligns with the findings of
Apergis et al. (
2022), which link low ESG scores to risks and liabilities arising from operational, legal, and regulatory challenges within specific areas. This may explain why oil and gas companies score lowest in the E pillar, as their environmental liabilities are among the most significant in the economy. The energy sector, in particular, faces stringent regulations on fossil fuels that threaten the oil, gas, and coal industries.
The low E pillar score is also consistent with
Van der Ploeg and Rezai’s (
2020) findings that large-scale fossil fuel projects, like offshore oil rigs, are at greater risk of devaluation due to unexpected advancements in renewable technologies and increased government climate policies. Notably, post-pandemic data shows that all three pillar scores are trending upward, suggesting that companies are improving sustainability efforts in response to growing pressure from investors, regulators, policy-makers, and the public. This observation aligns with
Goss and Roberts (
2011), who found that firms with poor social responsibility scores face higher debt costs, indicating that companies may engage in ESG activities to lower their cost of capital.
However, this trend reveals a dichotomy: despite being central to the ESG ecosystem due to their environmental exposures, energy firms score lowest on the E pillar, underperforming relative to their social and governance efforts. This disparity suggests poor environmental performance, likely driven by high carbon emissions, resource extraction impacts, heavy energy consumption, waste generation, and slow transitions to sustainable energy sources. Conversely, energy companies often excel in the S and G pillars due to investments in community development, employee welfare, strong corporate governance, and transparency in reporting. Yet, despite these strengths, the significant environmental challenges inherent to their operations continue to result in lower environmental scores.
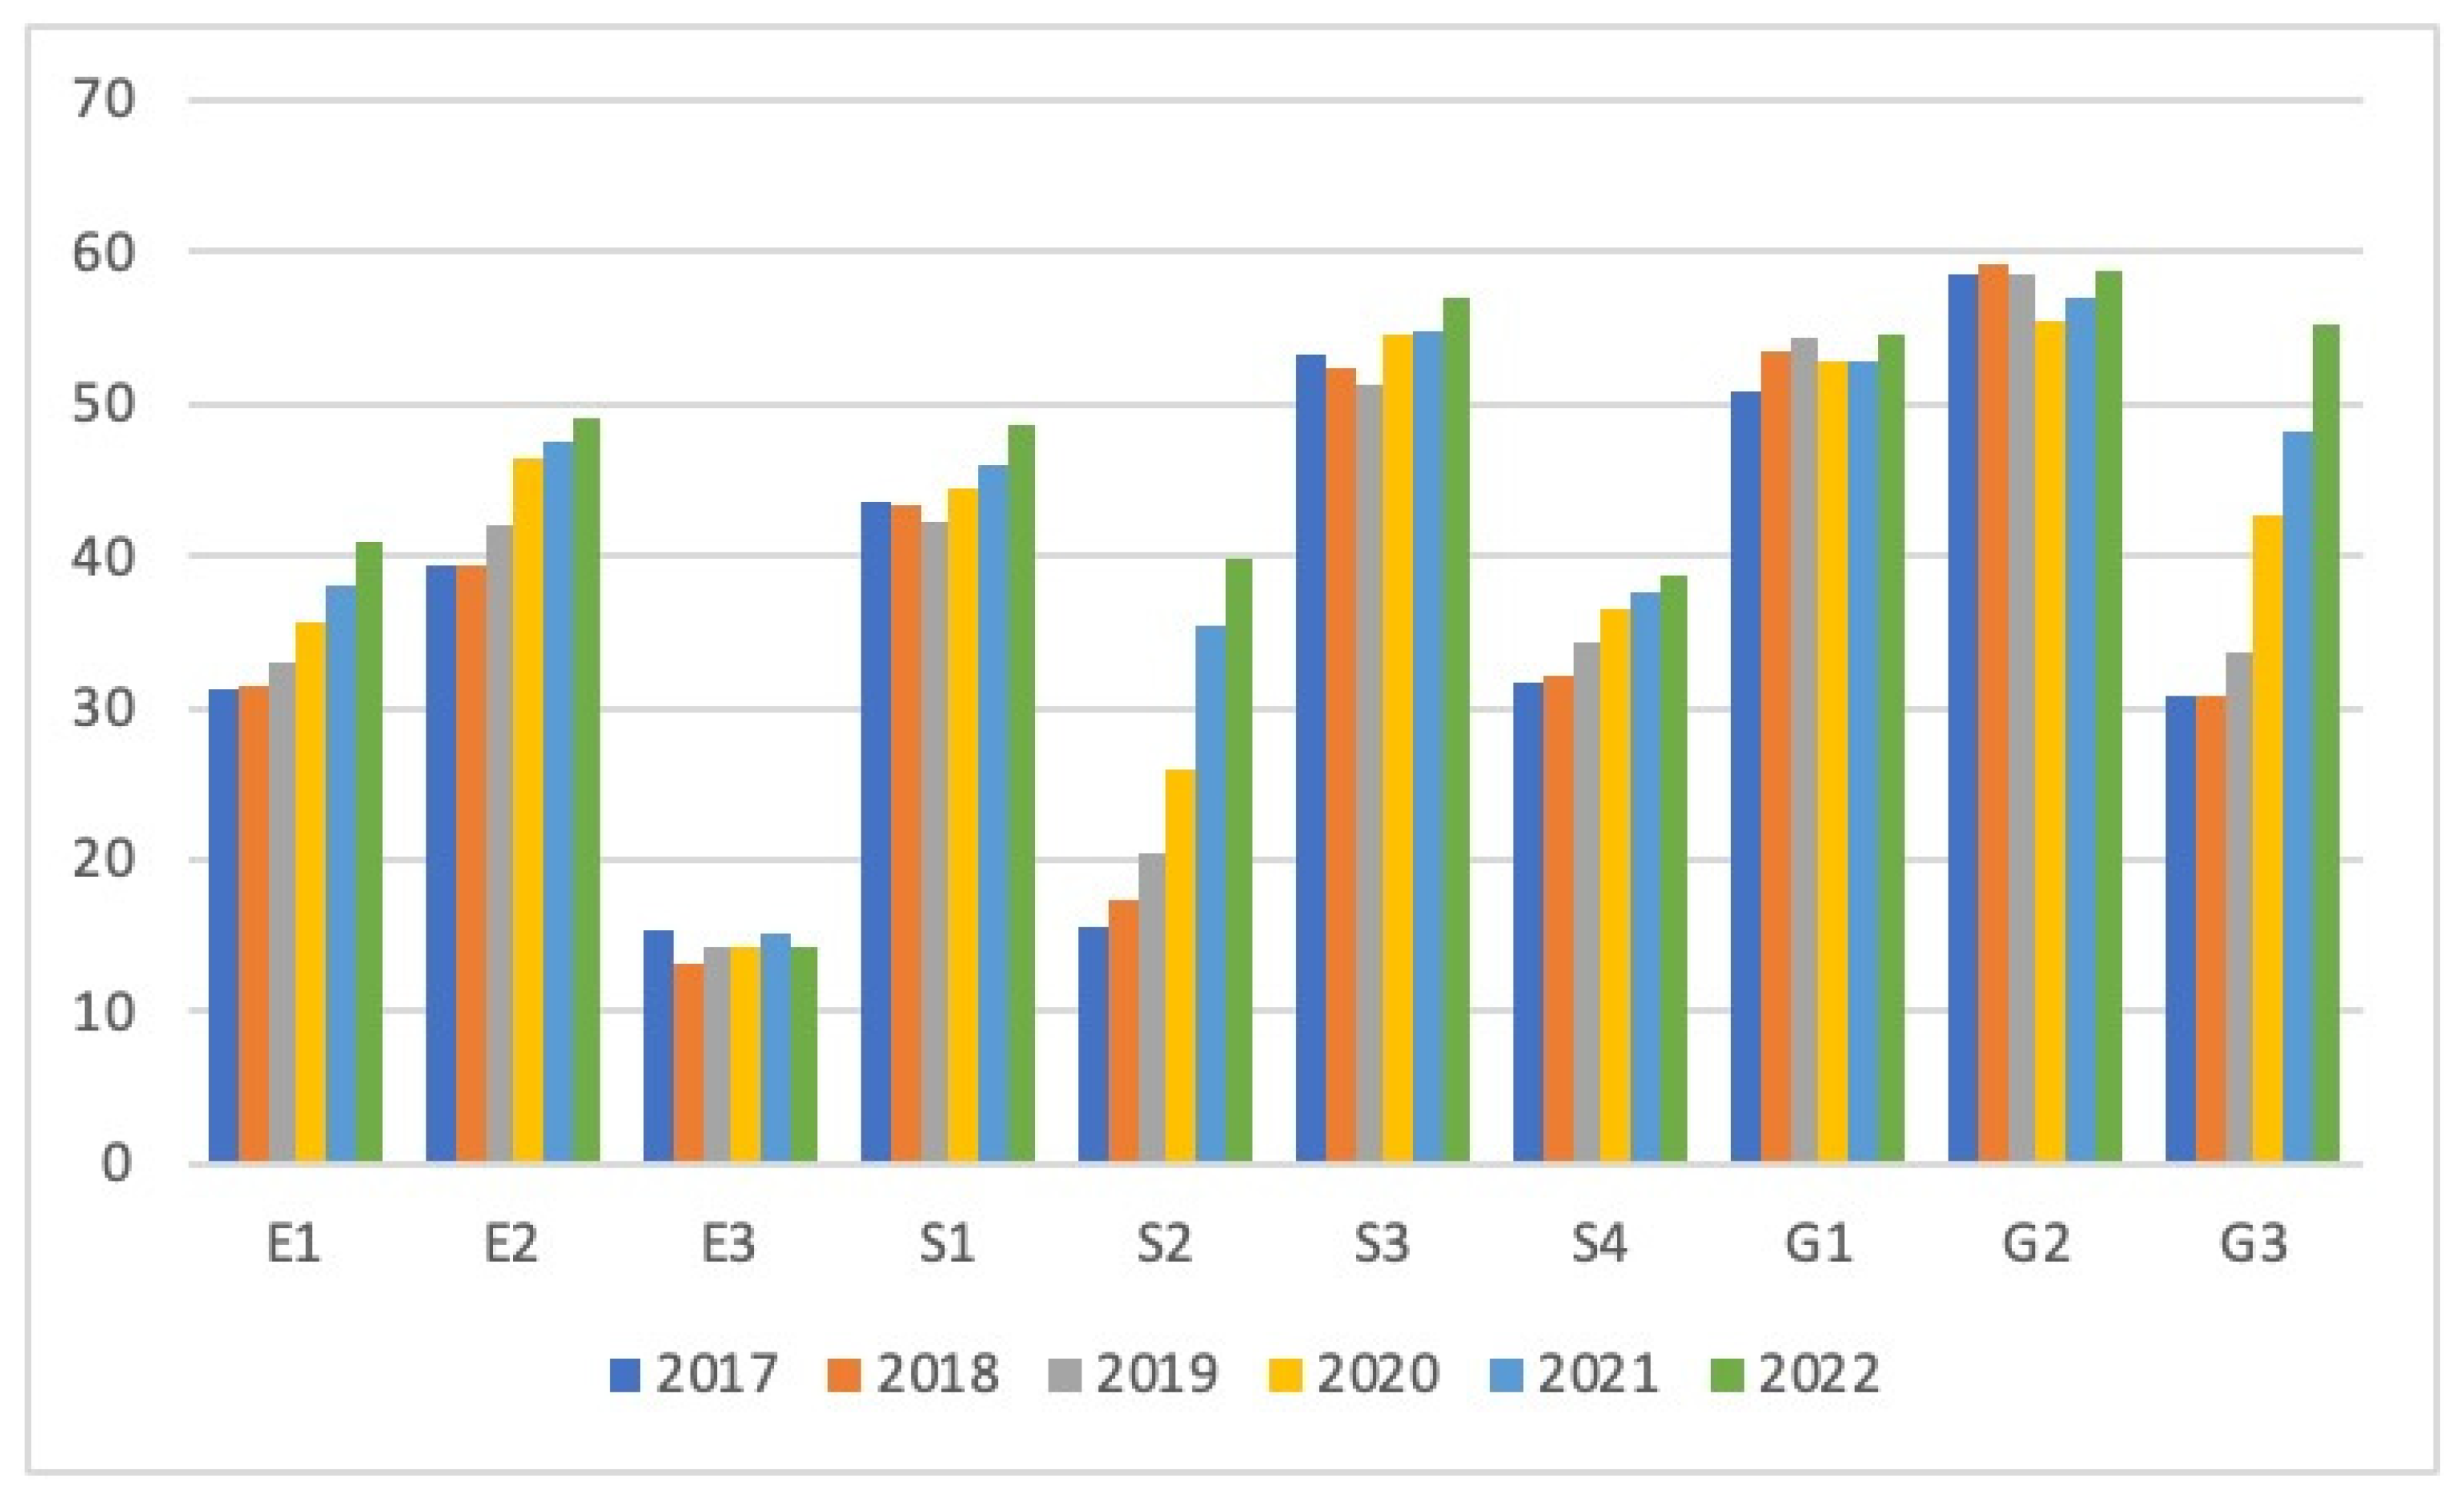
Next, we analyze the trends across the 10 components of ESG scores.
Figure 2 presents data on the ESG subcategories for energy companies from 2017 to 2022. The environmental pillar consists of three components: emissions, resource use, and innovations. The data reveals that emissions have the highest scores, while innovations score the lowest. Resource use scores are close to those of emissions, indicating that energy companies prioritize reducing carbon dioxide, sulfur, and nitrogen oxide emissions, managing waste and water pollutants, addressing biodiversity issues, participating in emissions trading initiatives, and implementing environmental management systems and partnerships. Additionally, these companies have shown efficiency in resource use activities, such as improving energy, material, and water efficiency, optimizing supply chains, developing environmental management teams, and investing in green infrastructure and sustainable packaging.
However, environmental innovation remains a weak area for energy companies. The data shows relatively low engagement in research and development (R&D) and capital expenditures related to renewable energy. These companies also exhibit poor performance in metrics that measure the positive environmental impact of new products, services, and green revenues. While the trends for emissions and resource use show a positive slope, the trend for innovations remains largely flat.
In contrast, energy companies have performed better in social and governance initiatives. Governance activities, particularly those related to shareholder rights and takeover defenses, score the highest, followed by a strong commitment to corporate governance principles. Notably, the steepest improvements are seen in CSR strategies, ESG reporting, and transparency, reflecting a growing global emphasis on sustainability. In the social domain, high scores for community and workforce initiatives align with an increased focus on business ethics, diversity and inclusion, and human rights.
Overall, our analysis suggests that energy companies have concentrated their efforts on reducing emissions and optimizing resource use while paying less attention to environmental innovation. Simultaneously, these companies have made greater strides in governance and social sustainability initiatives.
Table 1 reports the descriptive statistics of the data over the sample period of 2017–2022. The mean (median) value of the market capitalization of the sample firms is USD 15.26B (USD 2.09B), indicating that the sample firms comprise small-, mid-, and large-sized energy firms. Due to the skewness in the distribution, we take the log values of the market capitalization for the purpose of empirical analysis. The closeness in the mean and median values (7.75 and 7.65, respectively) of the log transformation of market capitalization indicates a close to normal distribution. The ESG data is available for only 648 firm-year observations. The average (median) value of the ESG scores of the sample firms is 40.84 (38.93), also indicative of a normal distribution. The mean ESG score falls in the second quartile of the LSEG ESG scores and indicates satisfactory relative ESG performance and a moderate degree of transparency in reporting material ESG data publicly. However, the minimum and maximum values of 3.64 and 94.44 suggest that some energy companies have extreme levels of commitment and effectiveness towards ESG factors. Among the three pillars, the mean score for governance is the highest at 52.61, which falls in the third quartile and indicates good relative governance performance and above-average degree of transparency in management, shareholders, and CSR strategy. The average scores of the environmental and social pillars are 34.18 and 39.49 and therefore suggest satisfactory relative performance in these two areas. The distribution of each of the three pillars, which are properly distributed as indicated from their mean and median values.
Among the environmental subcategories, the mean emission score is the highest at 44.49, suggesting that on average energy firms have a satisfactory level of commitment and effectiveness towards reducing environmental emissions in production and operational processes. On the other hand, the average score for environmental innovation of energy companies is the lowest among all the 10 subcategories. Among the social factors, the average score for the community is the highest at 54.10, suggesting good relative performance relating to energy companies’ commitment towards public health and business ethics. However, the mean scores for workforce, human rights, and product responsibility are 45, 27.16, and 54.10, respectively, indicating satisfactory-to-good levels of effectiveness towards these three social factors. The highest score being the governance pillar is probably due to the shareholder factor, which has the highest mean score of 57.89. This suggests that the oil and gas industry has been effective towards equal treatment of shareholders and the use of anti-takeover devices. On similar lines, the average scores of the other two governance factors are 53.23 and 41.59, indicating good performance toward corporate governance principles and CSR strategy respectively.
Unlike the data for the ESG pillars and subcategories, the ESG controversies score is positively skewed, where over 75% of the observations have a value of 100. The majority of the sample firms have an EC score of 100, suggesting that most firms have little or no controversy regarding the firm’s public information on ESG. In other words, there are only a few instances of scandals and penalties for the sample data. However, the standard deviation is similar to that of other variables, suggesting some variability in the ESG controversies.
Among the control variables, the average ROA of the sample is negative 0.03%, indicating that a majority of our sample has negative net income. This information is also reflected in the distribution of the EPS, which has a negative mean. Additionally, the positive value of median EPS indicates that the distribution of this variable is skewed to the left. The small difference between the mean and median of the remaining two firm attributes, TA and CFO, indicates the normal distribution of both these variables.
1 Overall, these summary statistics represent a well-diversified sample of firms in the energy sector population.
Table 2 provides pairwise correlations for all variables. On average, there is a high correlation between the market value and ESG performance of the sample firms. In particular, the correlation with the environmental pillar is the highest, followed by the social and governance scores. This is consistent with the argument that sustainable practices relating to climate change have the potential for improved valuations in the energy sector. Among the environmental subcategories, effectiveness in the use of environmental resources (E1) and reducing emissions (E2) have higher correlations with market capitalization than environmental innovations (E3). Likewise, the two social subcategories relating to workforce (S1) and community (S3) have stronger relationships than human rights (S2) and product responsibility (S4). Such high correlations support the notion that social factors play an important role, especially employee satisfaction and community engagement, in improving shareholders’ returns in the oil and gas industry. Along similar lines, the correlations of ESG scores with E and S are much higher than with G, suggesting that ESG performances are driven by environmental and social performances to a greater extent than the governance factors. We also find high correlations between some of the ESG subcategories scores, which indicates that companies that are leaders in one spectrum of ESG are also displaying responsible behaviors in other areas of sustainability. For example, the environmental resource use score (E1) has high correlations not only with the other environmental factor, emissions (E2), but also with two social performance measures, workforce (S1) and community (S3), and a governance factor, CSR strategies (G3). This suggests that companies that recognize the benefits of becoming greener also are taking strides in the social and governance spectrums of ESG. Lastly, some of the control variables also have high correlations with both market valuations and ESG measures. The firm attributes TA and CFO are also highly correlated with the market value of the firm suggesting large firms with healthy cash flows tend to have higher valuations. Including these variables in the model will help isolate the impact of ESG on the firm value.
2 Overall, the correlations suggest that ESG performance impacts market valuations and is mainly driven by environmental and social factors in the oil and gas industry. Effective environmental resource use, emission control, workforce satisfaction, community engagement, and CSR strategy seem to be the main drivers of this relationship.
5. Estimation Results
We employ Models (1a) and (1b) to answer our first research question on the impact of ESG and ESG controversies on valuations and present the results in
Table 3. The first column presents the estimation results for the entire sample based on Equation (1), while Column (2) reports the incremental effects of the significant variables during the post-pandemic period based on Equation (1b). The estimation results in the first column suggest a significant positive impact of ESG scores on market valuations. However, we do not find any significant impact of ESG controversies on market valuation. A possible reason could be that there exist only a few instances of scandals and penalties in our data. Most of the sample firms have an EC score of 100, suggesting that most firms have little or no controversy.
We estimate the second regression following Equation (1b) to examine whether the impact of the ESG score has significantly increased or decreased in the post-COVID period. We do not include EC as an exogenous variable since it is insignificant in our first regression. The coefficient for the interaction variable POST with ESG is insignificant, which suggests that the linkages between ESG and market valuations have consistently held during the pre- and post-pandemic periods.
This table reports the results corresponding to Model (1), where we examine the impact of the overall ESG performance and ESG controversies on market capitalization. The variables that are statistically significant are presented in bold. Column (1) presents the base model and Column (2) presents the incremental impact in the post-period. The post-period is defined as the years 2020–2022.
Next, we proceed to test our second research question where we examine the relative impact of the individual pillars—E, S, and G—on the market valuation of firms in the energy sector. Accordingly, we estimate Equations (2a) and (2b) and report the results in
Table 4. The estimation results in the first column suggest a significant positive impact of pillars E and G and an insignificant effect of pillar S on market valuations. In addition, the impact of the environmental pillar is higher than that of the governance factor. This is likely due to the significant environmental exposure and elevated governance risks that energy companies face compared to other sectors. Conversely, social sustainability is the weakest pillar, as investments in this area have not yielded positive returns.
This table reports the results corresponding to Model (2) where we examine the impact of the components E, S, and G on the market capitalization of the firm. Column (1) presents the base model and Column (2) presents the incremental impact in the post-period. The post-period is defined as the years 2020–2022.
These findings, alongside the trends presented in
Table 1, have significant implications. Regression analysis shows that environmental scores most strongly influence market capitalizations. However, the trends indicate that energy companies lag behind in environmental performance compared to social and governance factors. This suggests that energy companies may be under-investing in environmental initiatives, thereby missing opportunities for creating values. Conversely, companies that prioritize environmental sustainability are likely to see improved market valuations.
We estimate the second regression following Equation (2b) to examine whether the impact of E and G have increased or decreased in the post-COVID period. We do not include the interaction of the dummy variable, POST, with S since it is insignificant in our first regression. The coefficient for the interaction variable POST with both E and G are insignificant, which suggests that the response of market valuations to the environmental and governance pillar scores is stable during the pre- and post-pandemic periods. Lastly, consistent with our results for Equation (1), we find significant impacts of all four control variables (ROA, TA, CFO, and EPS) in both regressions (Equations (2a) and (2b)), suggesting that profitability, size, cash flows, and earnings play an important role in market valuations of energy companies.
In the next set of analyses, we dig deeper and examine the relative impact of each theme of the ESG pillars on market valuations. First, we examine the environmental subcategories and accordingly estimate regressions following Equations (3a) and (3b). The estimation results reported in
Table 5 indicate that two of the three environmental subcategories—E1 and E3—significantly and positively impact market valuations. However, the environmental theme E2 has significant and negative effects on market valuation. The environmental theme E1 encompasses commitments and effectiveness in improving material, energy, and water usage efficiency, optimizing supply chain management, enhancing environmental management teams, and investing in green buildings and sustainable packaging. Effective management in these areas suggests that energy companies could potentially enhance market valuations through improved resource efficiency.
This table reports the results corresponding to Model (3) where we examine the impact of the environmental themes on the market capitalizations. Column (1) presents the base model and Column (2) presents the incremental impact in the post-period. The post-period is defined as the years 2020–2022.
In contrast, environmental theme E3 focuses on R&D and capital expenditures related to renewable energy products with positive environmental impacts, generating green revenue, and product innovations. This indicates that market valuations can be boosted by reducing environmental costs for customers and creating new opportunities through environmental technologies and eco-designed products. However, the negative coefficient for E2 suggests that expenditures on reducing environmental emissions can have detrimental effects on market valuations. Investments aimed at reducing carbon dioxide, sulfur, and nitrogen oxide emissions, managing biodiversity, and addressing waste and water pollutants, as well as developing emissions trading initiatives and environmental management systems, are costly for firms. This is not surprising, as the high costs associated with emissions reduction—such as investments in new technologies or purchasing carbon credits—can adversely impact valuations.
We estimate the second regression following Equation (3b) to examine whether the impact of E1, E2, and E3 has significantly increased or decreased in the post-COVID period. The coefficients for the interaction variable POST with these three variables are insignificant, which suggests that the response of market valuations to the environmental theme is consistently strong during the pre- and post-pandemic periods. In addition, we find significant effects of control variables in both regressions suggesting the role of profitability, size, cash flows, and earnings in market valuations of energy companies.
Following Equations (4a) and (4b), we report the regression results for the impact of social themes on market valuations in
Table 6. We find a significant positive impact of S2 and S3 suggesting increased valuations due to being a good citizen, protecting public health, respecting business ethics, and also respecting fundamental human rights conventions. The impact of effectiveness and commitment towards human rights is higher than those of the community engagements. These results are consistent with the recent developments in the corporate world, where the focus is higher on managing human rights and supporting the community (
Stromquist, 2019;
European Foundation for ILO, 2019;
Becchetti et al., 2022).
We estimate the second regression following Equation (4b) to examine whether the impact of social factors have significantly increased or decreased in the post-COVID period. The coefficient for the interaction variable POST with these three variables is insignificant, which suggests that the response of market valuations to the environmental theme is consistently strong during the pre- and post-pandemic periods. Column (2) presents the impact of the social subcategories in accordance with Equation (4b) to examine whether their impacts have significantly increased or decreased during the post-pandemic. The coefficients for the interaction variable POST with S2 and S3 are insignificant which suggests linkages between market valuations and effectiveness and commitment towards human rights and community are consistently strong during the pre- and post-pandemic periods.
Overall, we find that changes in social themes, especially ones related to human rights and community, are important influences on issues such as productivity, job satisfaction, health, safety, and well-being, all of which are intrinsically linked to sustainable development, leading to improved financial performance. On the other hand, the workforce and product-responsibility scores have an insignificant bearing on the market valuations. Further, consistent with earlier findings, we find significant effects of control variables in both regressions suggesting the role of profitability, size, cash flows, and earnings in market valuations of energy companies.
Table 6 reports the results corresponding to Model (4) where we examine the impact of the components of the social factors, S1, S2, S3, and S4, on the market capitalization of the firm. Column (1) presents the base model and Column (2) presents the incremental impact in the post-period. The post-period is defined as the years 2020–2022.
Table 7 reports the results of the impact of governance themes on market valuations. We estimate regressions following Equations (5a) and (5b). Out of the three subcategories for the governance pillar, we find a significant impact of only G1. This suggests companies’ commitment and effectiveness towards following best practice corporate governance principles.
This result is consistent with those of
Bhagat and Bolton (
2019), which find that effective corporate governance as measured by management’s stock ownership is positively related to future corporate performance. It is also in line with those of
Paniagua et al. (
2018) and
Klein (
1998), which demonstrate significant linkages between corporate governance, ownership structure, and board composition on financial performances.
In the second regression for Equation (5b), we examine whether the significant impact of G1 on market valuations is consistent during the post-pandemic period. The coefficient for the interaction variable POST with G1 suggests that the response of market valuations to the governance theme, and management is consistently strong during the post-pandemic period also. Specifically, the coefficient for the interaction variable POST with G1 is insignificant.
Overall, we find that effective management structures, including independence, diversity, committees, and compensations, are important determinants of market valuations. However, there are insignificant impacts of companies’ communications about incorporating sustainability into day-to-day operations, shareholders’ treatments, and anti-takeover devices on market capitalization. Lastly, there are significant positive impacts of financial performance measures captured by ROA, EPS, CFO, and TA on market valuations.
This table reports the results corresponding to Model (5) where we examine the impact of the components of the governance parameter, G1, G2, and G3, on the market capitalization of the firm. Column (1) presents the base model and Column (2) presents the incremental impact in the post-period. The post-period is defined as years 2020–2022.


