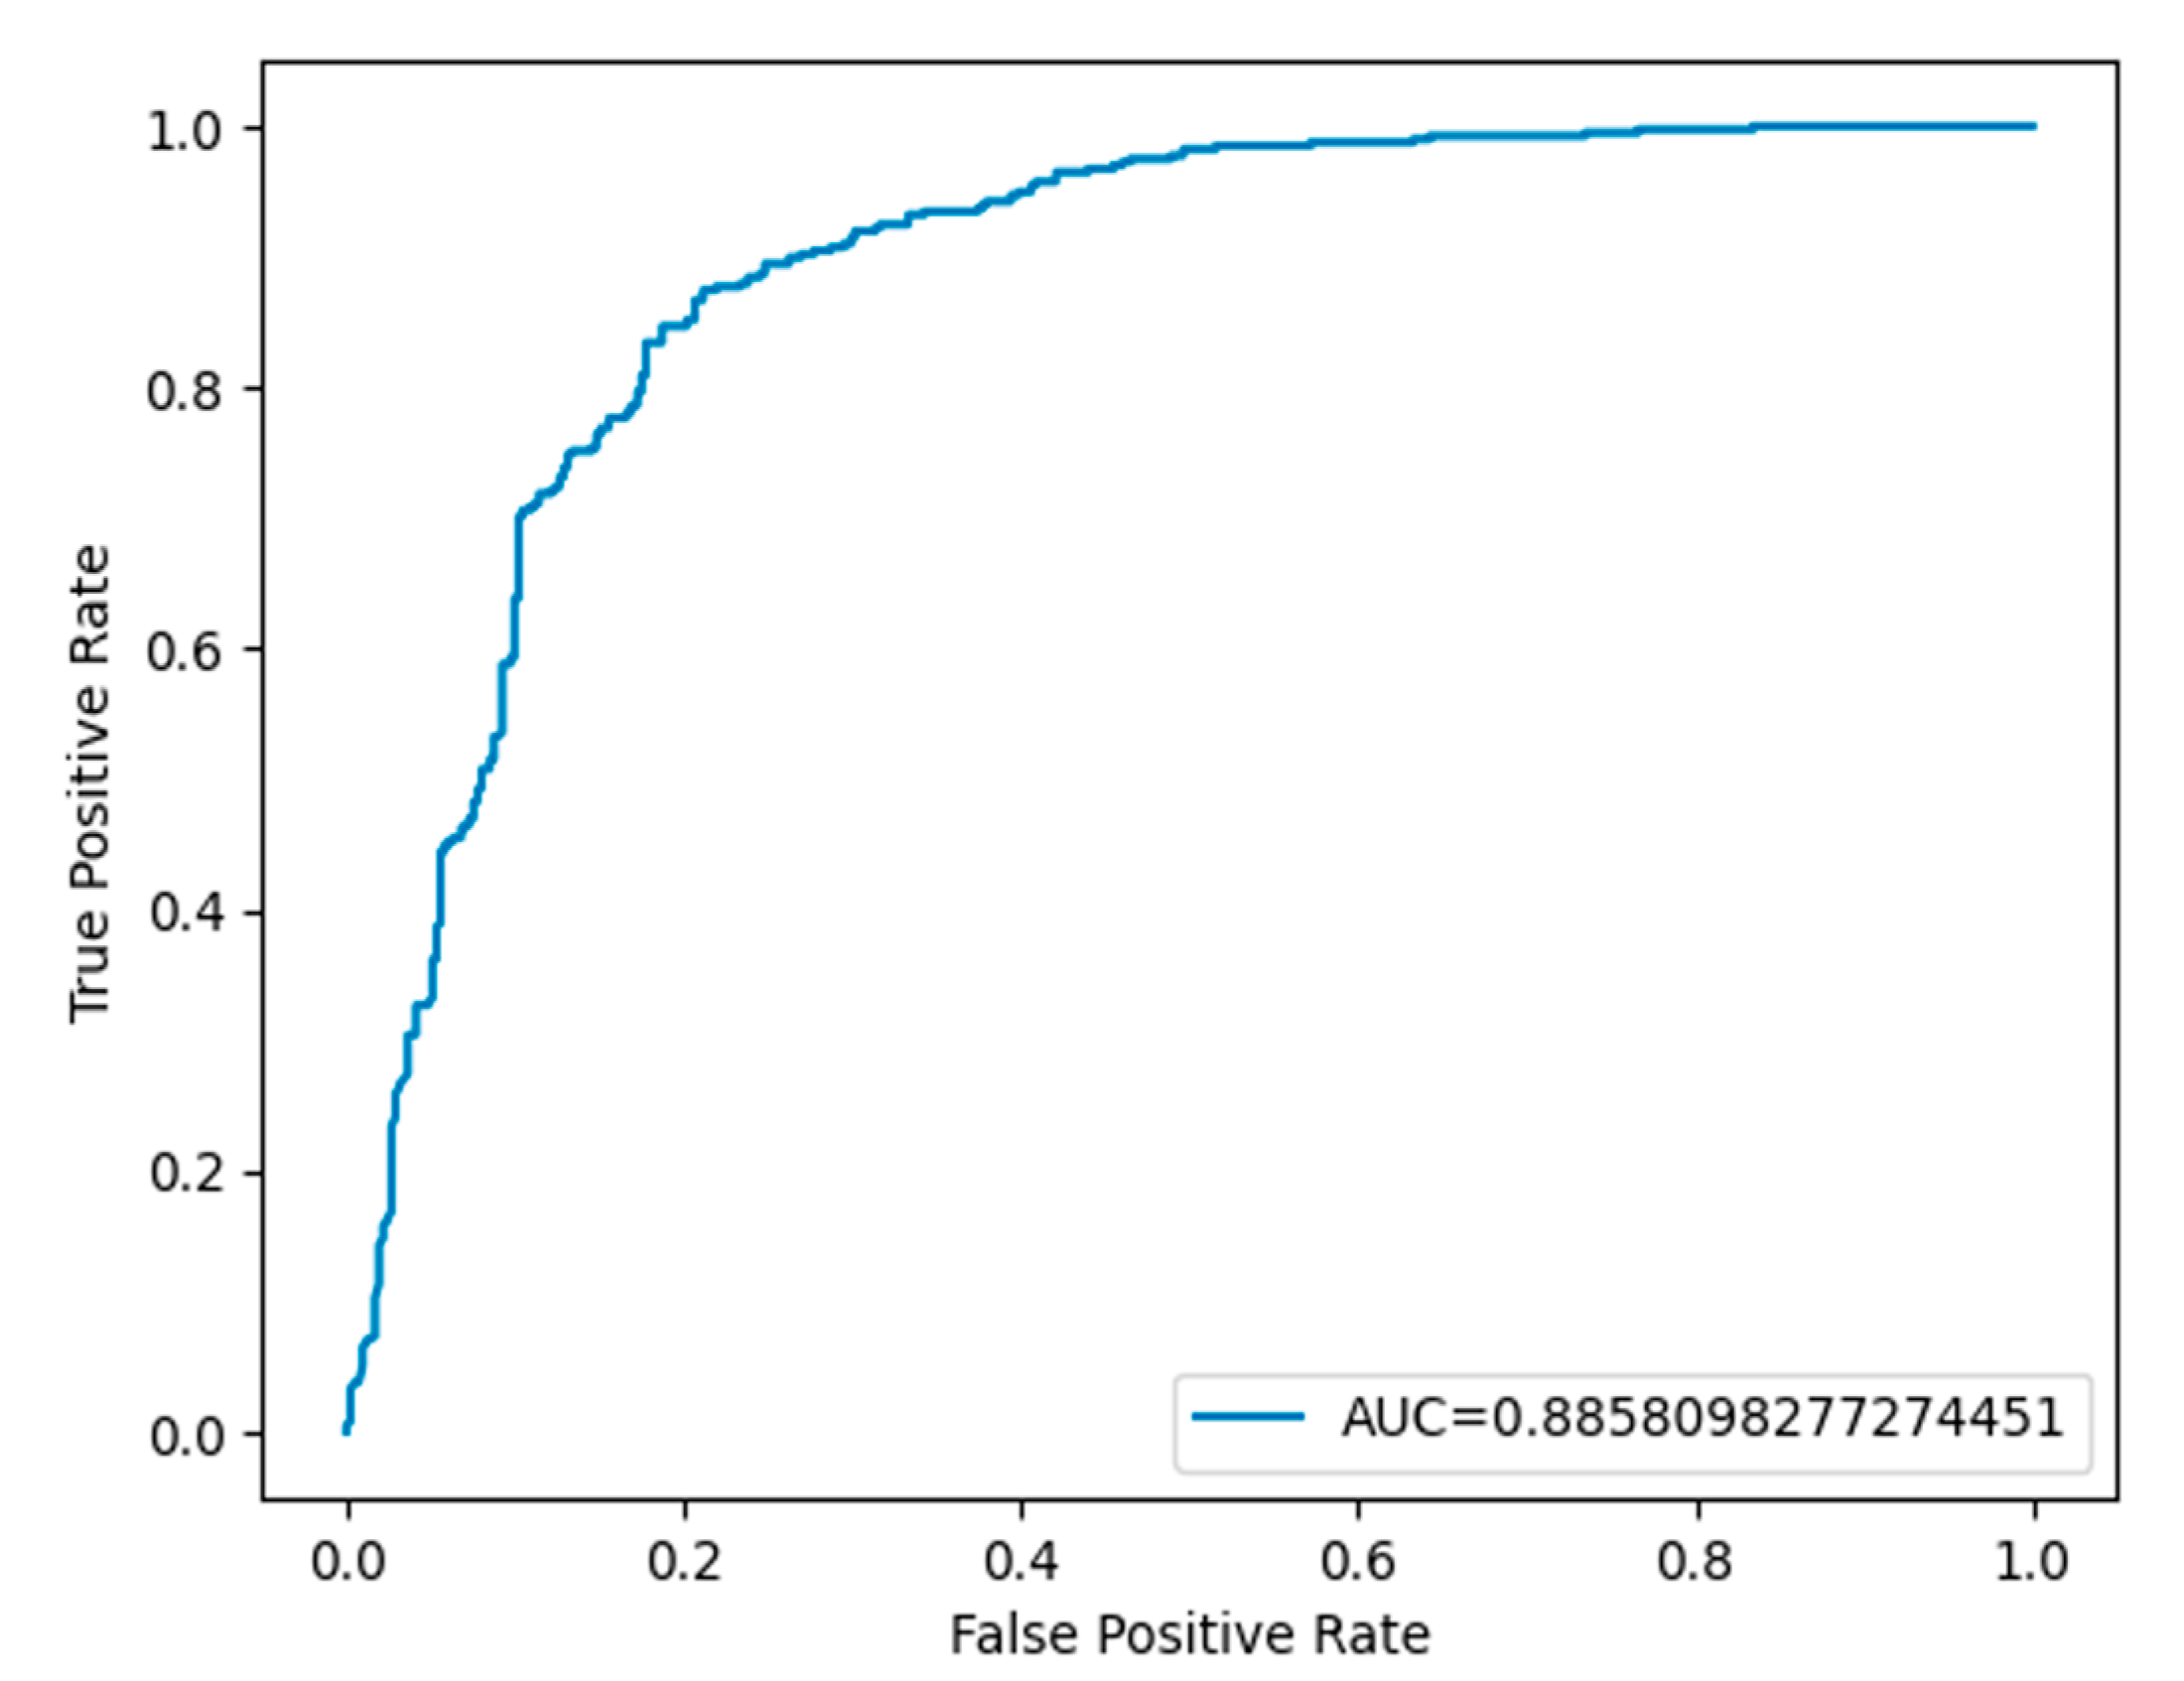
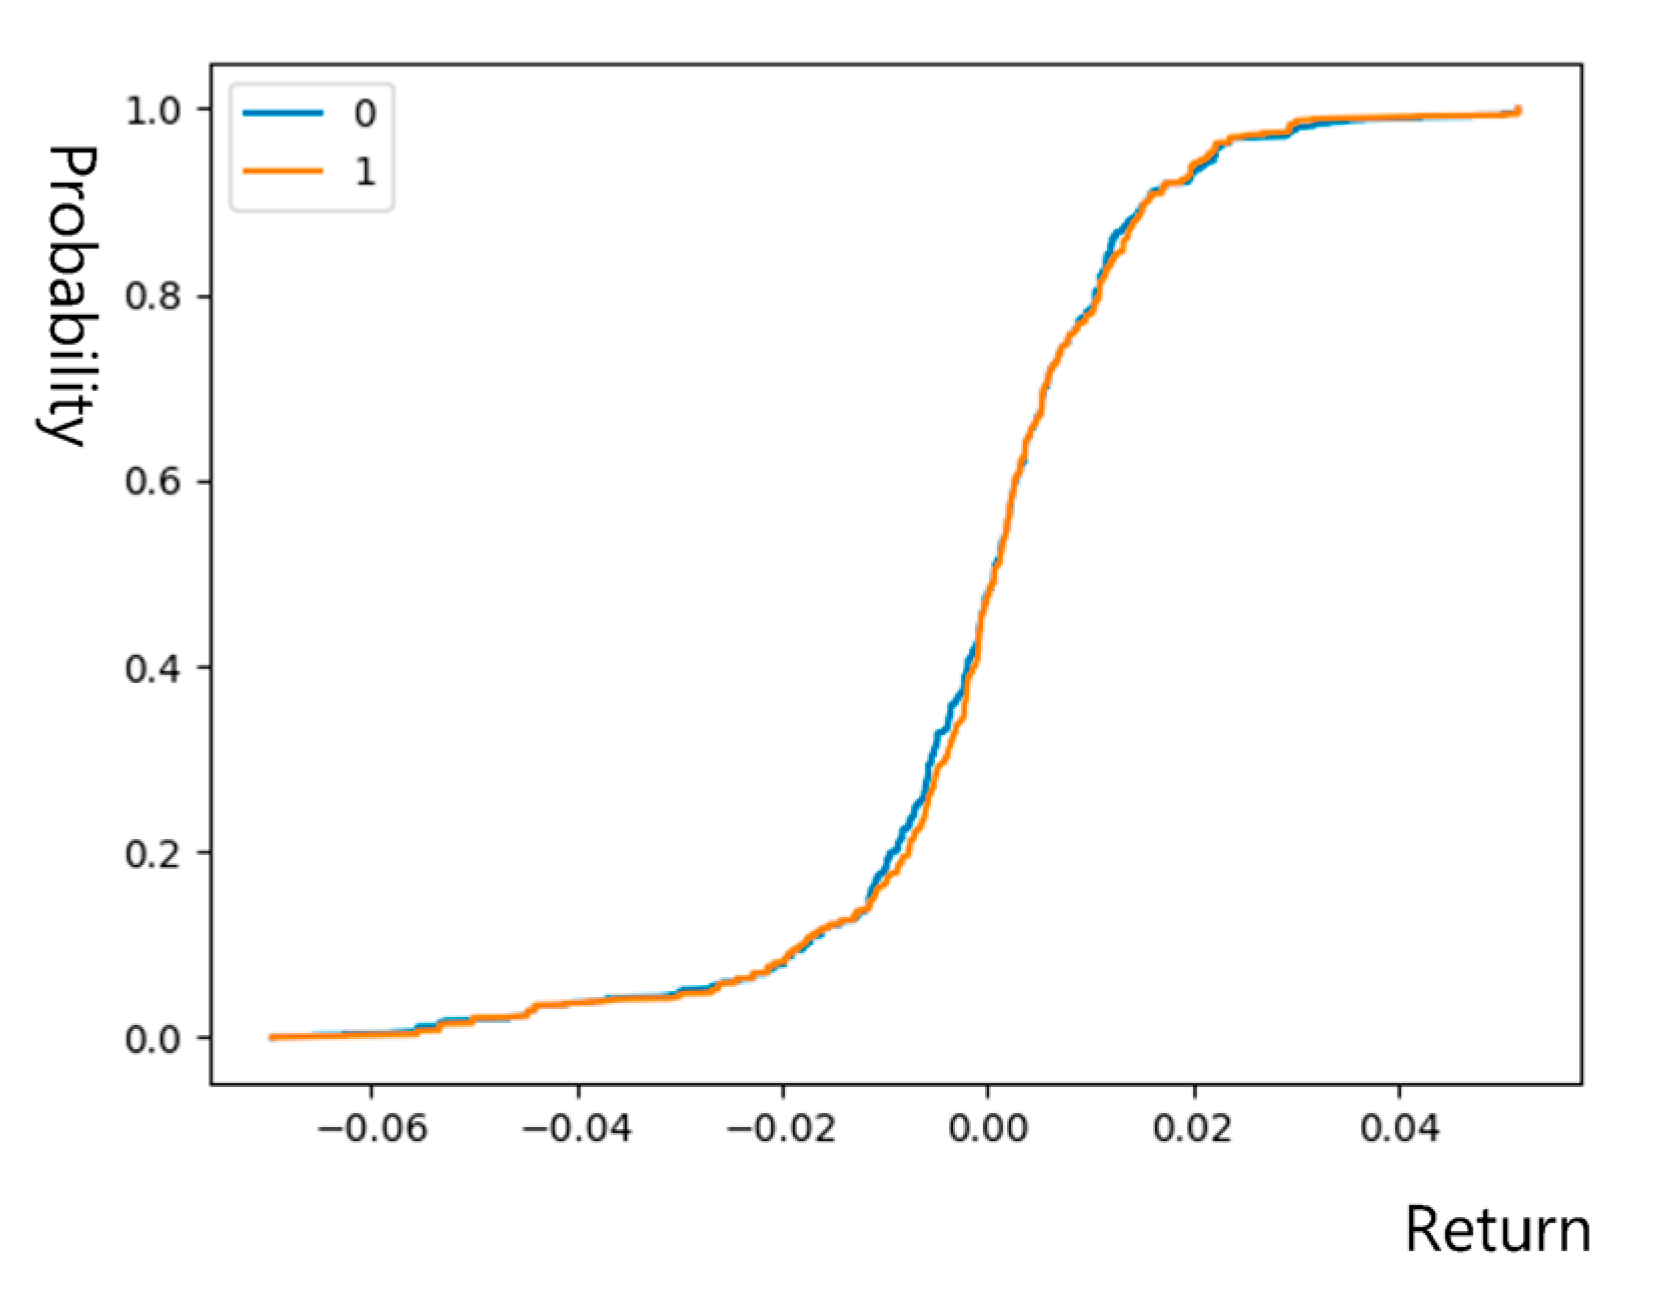
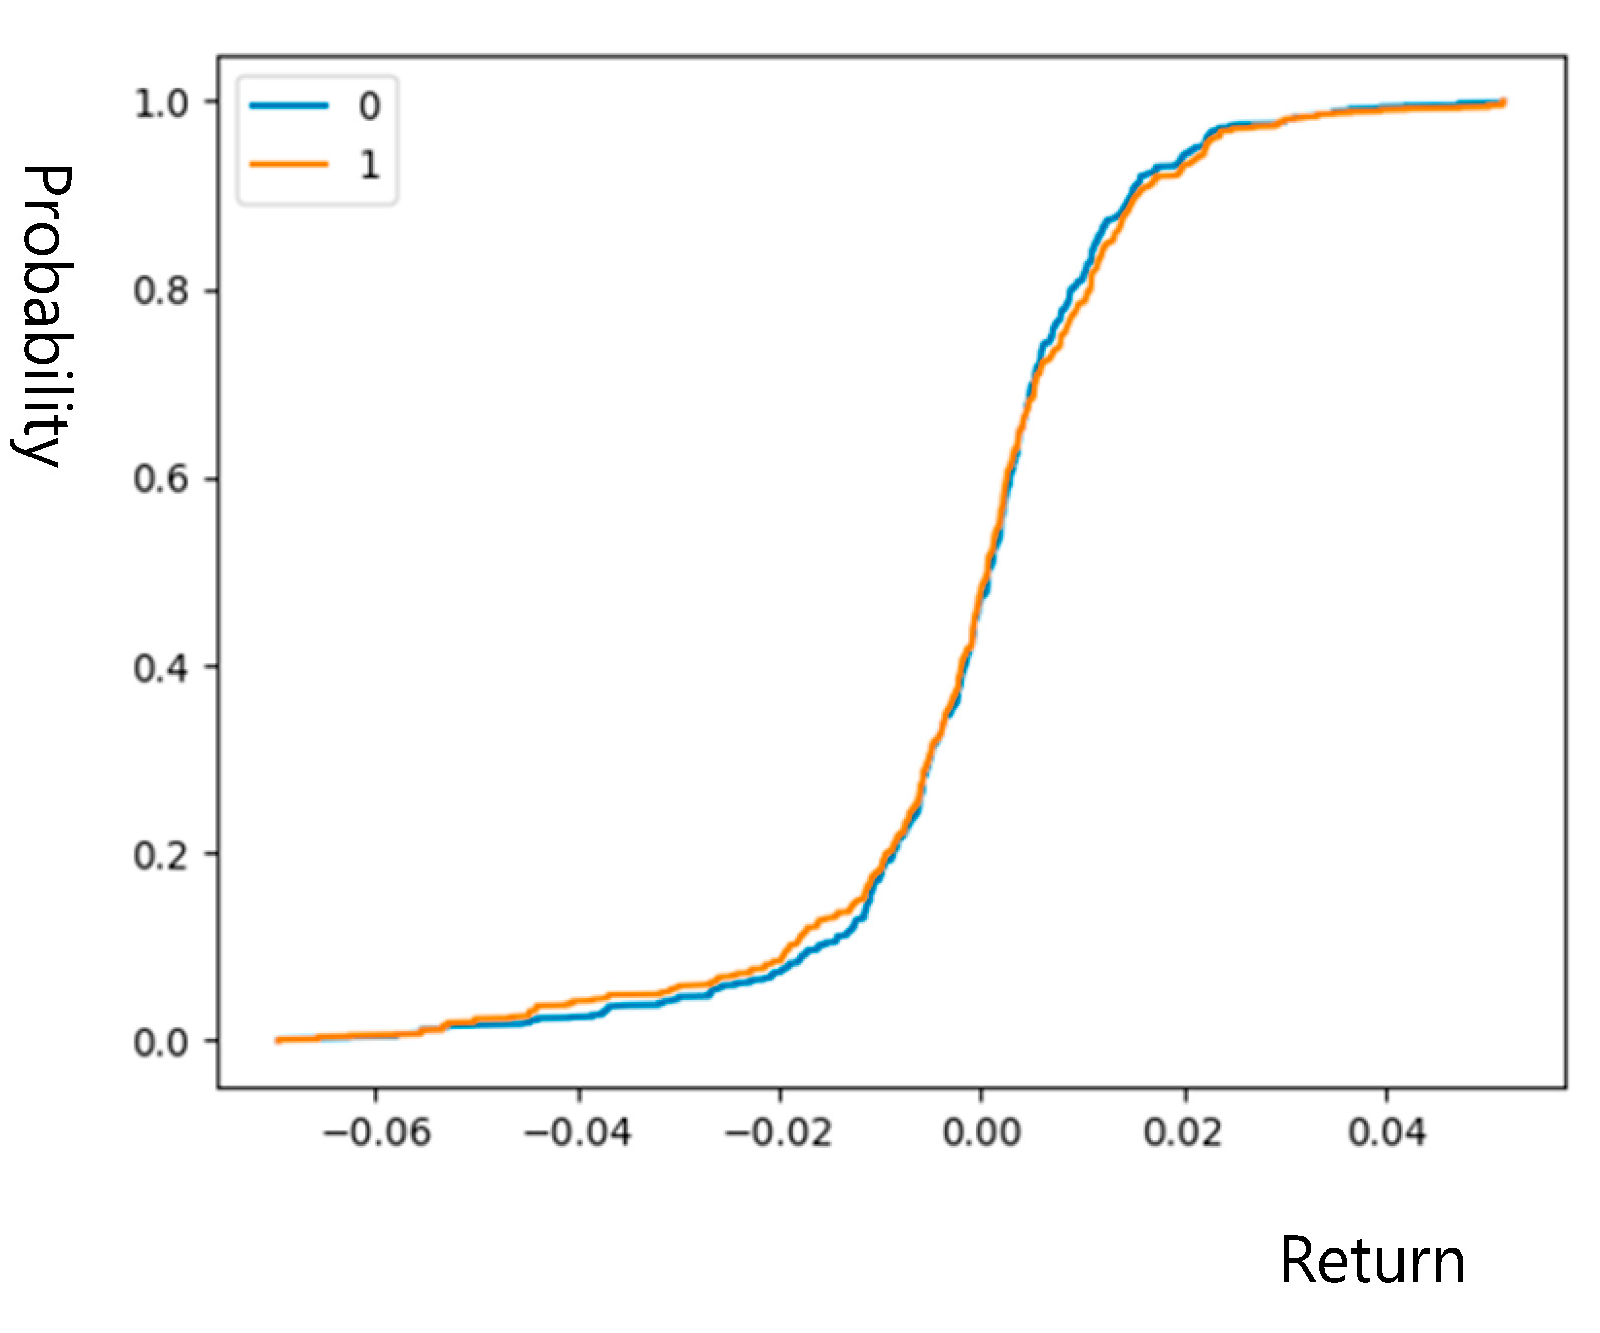
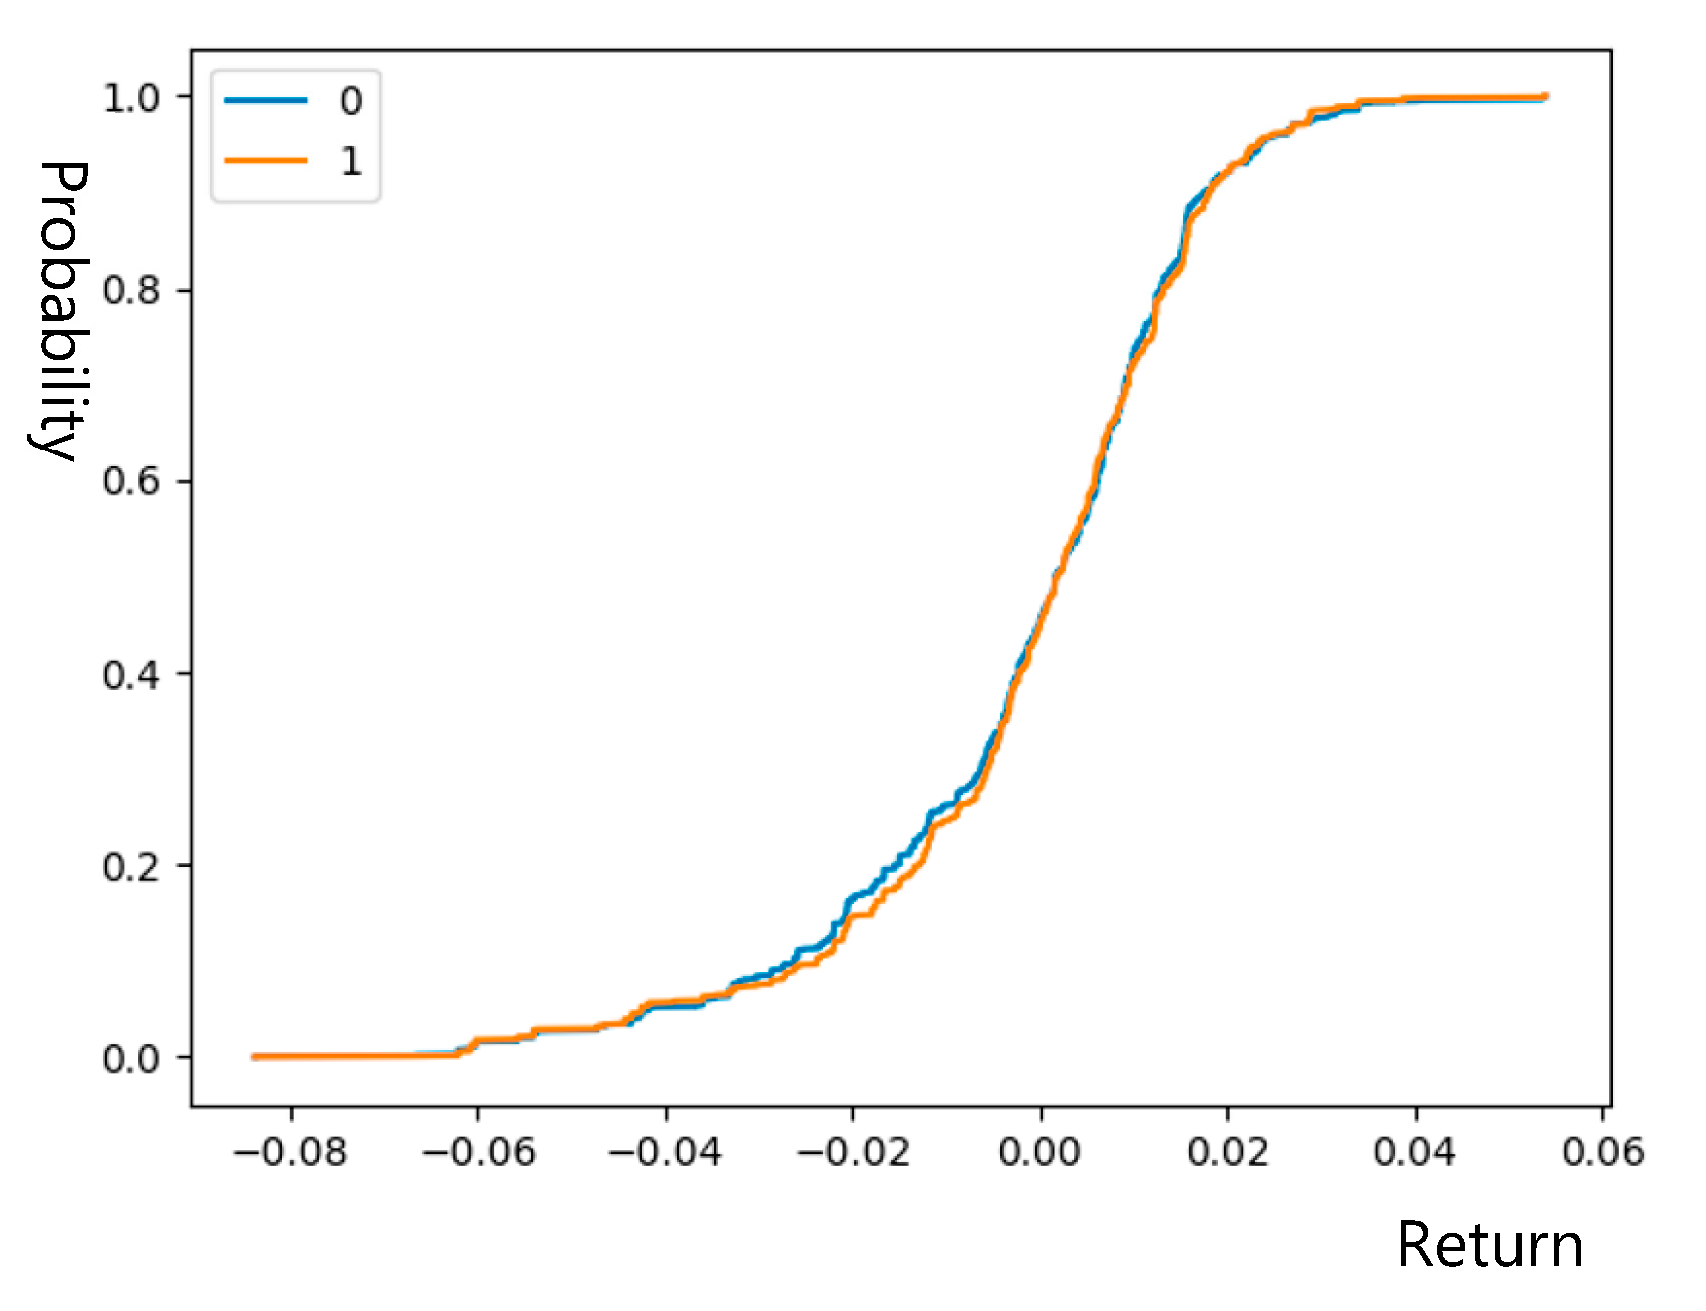
Sentiments Extracted from News and Stock Market Reactions in Vietnam
Abstract
1. Introduction
2. Literature Review
2.1. Sentiment Measures
2.2. News Sentiments and Investor Response
3. Methodology
- TP: True positive, the number of news articles containing positive sentiments is classified as Positive.
- TN: True negative, the number of news articles containing negative sentiments is classified as Negative.
- FP: False positive, the number of news articles containing negative sentiments is classified as Positive.
- FN: False negative, the number of news articles containing positive sentiments is classified as Negative.
4. Analysis Results and Discussion
4.1. NLP Results
4.2. Analysis Results on Market Reactions to News Sentiments
5. Conclusions and Future Research
Author Contributions
Funding
Institutional Review Board Statement
Informed Consent Statement
Data Availability Statement
Acknowledgments
Conflicts of Interest
References
- Aggarwal, Charu C. 2018. Opinion Mining and Sentiment Analysis. In Machine Learning for Text. Cham: Springer, pp. 413–34. [Google Scholar] [CrossRef]
- Antweiler, Werner, and Murray Z. Frank. 2004. Is all that talk just noise? The information content of Internet stock message boards. The Journal of Finance 59: 1259–94. [Google Scholar] [CrossRef]
- Baker, Malcolm, and Jeffrey Wurgler. 2006. Investor Sentiment and Cross-Section of Stock Returns. Journal of Finance 61: 1645–80. [Google Scholar] [CrossRef]
- Baker, Malcolm, Jeffrey Wurgler, and Yu Yuan. 2012. Global, Local, and Contagious Investor Sentiment. Journal of Financial Economics 104: 272–87. [Google Scholar] [CrossRef]
- Baker, Scott R., Nicholas Bloom, Steven J. Davis, and Kyle J. Kost. 2019. Policy News and Stock Market Volatility. NBER Working Papers 25720. Cambridge: National Bureau of Economic Research, Inc. [Google Scholar]
- Baker, Scott R., Nicholas Bloom, Steven J. Davis, Kyle Kost, Marco Sammon, and Tasaneeya Viratyosin. 2020. The unprecedented stock market reaction to COVID-19. Review of Asset Pricing Studies 10: 742–58. [Google Scholar] [CrossRef]
- Bali, Turan G., Andriy Bodnaruk, Anna Scherbina, and Yi Tang. 2016. Unusual News Flow and the Cross-Section of Stock Returns. SSRN Electronic Journal 64: 4137–55. [Google Scholar] [CrossRef][Green Version]
- Barber, Brad M., and Terrance Odean. 2008. All That Glitters: The Effect of Attention and News on the Buying Behavior of Individual and Institutional Investors. Review of Financial Studies 21: 785–818. [Google Scholar] [CrossRef]
- Barberis, Nicholas, Andrei Shleifer, and Robert Vishny. 1998. A model of investor sentiment. Journal of Financial Economics 49: 307–43. [Google Scholar] [CrossRef]
- Bar-Haim, Roy, Elad Dinur, Ronen Feldman, Moshe Fresko, and Guy Goldstein. 2011. Identifying and following expert investors in stock microblogs. In Proceedings of the 2011 Conference on Empirical Methods in Natural Language Processing. Edinburgh: Association for Computational Linguistics, pp. 1310–19. [Google Scholar]
- Bollen, Johan, Huina Mao, and Xiaojun Zeng. 2011. Twitter mood predicts the stock market. Journal of Computational Science 2: 1–8. [Google Scholar] [CrossRef]
- Brown, Gregory W., and Michael T. Cliff. 2004. Investor sentiment and the near-term stock market. Journal of Empirical Finance 11: 1–27. [Google Scholar] [CrossRef]
- Brown, Gregory W., and Michael T. Cliff. 2005. Investor sentiment and asset valuation. Journal of Business 78: 405–40. [Google Scholar] [CrossRef]
- Cho, Young-Hyun, Oliver Linton, and Yoon-Jae Whang. 2007. Are there Monday effects in stock returns: A stochastic dominance approach. Journal of Empirical Finance 14: 736–55. [Google Scholar] [CrossRef][Green Version]
- Chow, Sheung Chi, Yongchang Hui, João Paulo Vieito, and Zhenzhen Zhu. 2016. Market liberalizations and efficiency in Latin America. Studies in Economics and Finance 33: 553–75. [Google Scholar] [CrossRef]
- Chui, David, Wui Wing Cheng, Sheung Chi Chow, and Li Ya. 2020. Eastern Halloween effect: A stochastic dominance approach. Journal of International Financial Markets, Institutions and Money 68: 101241. [Google Scholar] [CrossRef]
- Costola, Michele, Oliver Hinz, Michael Nofer, and Loriana Pelizzon. 2020. Machine Learning Sentiment Analysis, COVID-19 News and Stock Market Reactions. SSRN Electronic Journal 64: 101881. [Google Scholar] [CrossRef]
- Daudert, Tobias. 2021. Exploiting textual and relationship information for fine-grained financial sentiment analysis. Knowledge-Based Systems 230: 107389. [Google Scholar] [CrossRef]
- De Long, J. Bradford, Andrei Shleifer, Lawrence H. Summers, and Robert J. Waldmann. 1990. Noise Trader Risk in Financial Markets. The Journal of Political Economy 98: 703–38. [Google Scholar] [CrossRef]
- Devlin, Jacob, Ming-Wei Chang, Kenton Lee, and Kristina Toutanova. 2019. BERT: Pre-training of Deep Bidirectional Transformers for Language Understanding. In Proceedings of the 2019 Conference of the North American Chapter of the Association for Computational Linguistics: Human Language Technologies. Edinburgh: Association for Computational Linguistics, pp. 4171–86. [Google Scholar]
- Dougal, Casey, Joseph Engelberg, Diego Garcia, and Christopher A. Parsons. 2012. Journalists and the Stock Market. Review of Financial Studies 25: 639–79. [Google Scholar] [CrossRef]
- Fama, Eugene F. 1970. Efficient Capital Market: A Review of Theory and Empirical Work. Journal of Finance 25: 382–417. [Google Scholar] [CrossRef]
- Fang, Yi, and Thierry Post. 2022. Optimal portfolio choice for higher-order risk averters. Journal of Banking & Finance 137: 106429. [Google Scholar]
- Feng, Lingbing, Tong Fu, and Yanlin Shi. 2022. How does news sentiment affect the states of Japanese stock return volatility? In International Review of Financial Analysis. Amsterdam: Elsevier, vol. 84. [Google Scholar]
- Fisher, Kenneth L., and Meir Statman. 2000. Investor Sentiment and Stock Returns. Financial Analysts Journal 56: 16–23. [Google Scholar] [CrossRef]
- Huang, Alan Guoming, Hongping Tan, and Russ Wermers. 2020. Institutional Trading around Corporate News: Evidence from Textual Analysis. The Review of Financial Studies 33: 4627–75. [Google Scholar] [CrossRef]
- Li, Xiaodong, Pangjing Wu, and Wenpeng Wang. 2020. Incorporating stock prices and news sentiments for stock market prediction: A case of Hong Kong. Information Processing & Management 57: 102212. [Google Scholar] [CrossRef]
- Liu, Jun, Kai Wu, and Ming Zhou. 2023. News tone, investor sentiment, and liquidity premium. In International Review of Economics & Finance. Amsterdam: Elsevier, vol. 84, pp. 167–81. [Google Scholar]
- Montier, James. 2002. Behavioural Finance: Insights into Irrational Minds and Markets. Chichester: John Wiley and Sons Ltd. [Google Scholar]
- Nguyen, Thien Hai, Kiyoaki Shirai, and Julien Velcin. 2015. Sentiment Analysis on Social Media for Stock Movement Prediction. Expert Systems with Applications 42: 9603–11. [Google Scholar] [CrossRef]
- Pandey, Piyush, and Sanjay Sehgal. 2019. Investor Sentiment and its Role in Asset Pricing: An Empirical Study for India. IIMB Management Review 31: 127–44. [Google Scholar] [CrossRef]
- Petropoulos, Anastasios, and Vasilis Siakoulis. 2021. Can Central Bank Speeches Predict Financial Market Turbulence? Evidence from an Adaptive NLP Sentiment Index Analysis Using XGBoost Machine Learning Technique. Central Bank Review 21: 141–53. [Google Scholar] [CrossRef]
- Pham, Ngoc Dong, Thi Hanh Le, Thanh Dat Do, Thanh Toan Vuong, Thi Hong Vuong, and Quang Thuy Ha. 2021. Vietnamese Fake News Detection Based on Hybrid Transfer Learning Model and TF-IDF. Paper presented at the 13th International Conference on Knowledge and Systems Engineering (KSE), Bangkok, Thailand, November 10–12; pp. 1–6. [Google Scholar] [CrossRef]
- Phan, Truc, Philippe Bertrand, Hong Hai Phan, and Xuan Vinh Vo. 2021. Investor sentiment and stock return: Evidence from Vietnam stock market. The Quarterly Review of Economics and Finance 87: 141–53. [Google Scholar] [CrossRef]
- Qiu, Lily, and Ivo Welch. 2004. Investor Sentiment Measures. NBER Working Paper. p. 10794. Available online: https://ssrn.com/abstract=595193 (accessed on 12 July 2022).
- Renault, Thomas. 2017. Intraday online investor sentiment and return patterns in the U.S. stock market. Journal of Banking & Finance 84: 25–40. [Google Scholar]
- Schumaker, Robert P., and Hsinchun Chen. 2009. Textual analysis of stock market prediction using breaking financial news: The azfin text system. ACM Transactions on Information Systems 27: 1–19. [Google Scholar] [CrossRef]
- Schwert, G. William. 2003. Anomalies and market efficiency. Handbook of the Economics of Finance 1: 939–74. [Google Scholar]
- Shapiro, Adam Hale, Moritz Sudhof, and Daniel J. Wilson. 2022. Measuring news sentiment. Journal of Econometrics 228: 221–43. [Google Scholar] [CrossRef]
- Shen, Shulin, Le Xia, Yulin Shuai, and Da Gao. 2022. Measuring news media sentiment using big data for Chinese stock markets. Pacific-Basin Finance Journal 74: 101810. [Google Scholar] [CrossRef]
- Sun, Licheng, Mohammad Najand, and Jiancheng Shen. 2016. Stock return predictability and investor sentiment: A high-frequency perspective. Journal of Banking & Finance 73: 147–64. [Google Scholar]
- Verma, Rahul, and Priti Verma. 2008. Are survey forecasts of individual and institutional investor sentiments rational? International Review of Financial Analysis 17: 1139–55. [Google Scholar] [CrossRef]
- Vu, Tien Thanh, Shu Chang, Quang Thuy Ha, and Nigel Collier. 2012. An Experiment in Integrating Sentiment Features for Tech Stock Prediction in Twitter. Paper presented at Workshop on Information Extraction and Entity Analytics on Social Media Data, Mumbai, India, December 9; pp. 23–38. [Google Scholar]


| Websites | Number of Articles | Period |
|---|---|---|
| Cafef | 30,471 | 21/10/2021–28/06/2022 |
| Vneconomy | 2837 | 01/09/2021–28/06/2022 |
| Stockbiz | 9374 | 12/07/2021–27/07//2022 |
| Name | Mean | Min | Max | Standard Deviation | Standard Error | Skewness |
|---|---|---|---|---|---|---|
| International finance | 15.13 | 4 | 42 | 5.55 | 0.35 | 0.50 |
| News | 15.24 | 0 | 41 | 4.75 | 0.30 | 0.21 |
| Business | 15.06 | 0 | 40 | 8.24 | 0.52 | −0.03 |
| Life | 15.19 | 0 | 46 | 7.39 | 0.47 | −0.25 |
| Macroeconomics | 15.20 | 0 | 37 | 8.20 | 0.52 | −0.67 |
| Stocks | 15.23 | 0 | 63 | 14.88 | 0.94 | 0.86 |
| Properties | 15.14 | 0 | 87 | 17.45 | 1.10 | 0.74 |
| Market | 15.20 | 0 | 89 | 20.50 | 1.29 | 0.84 |
| All | 121.40 | 5 | 280 | 59.48 | 3.75 | 0.30 |
| Name | Mean | Min | Max | Standard Deviation | Standard Error | Skewness |
|---|---|---|---|---|---|---|
| Real_estate | 1.21 | 0 | 8 | 1.12 | 0.03 | 1.73 |
| Finance | 1.56 | 0 | 12 | 2.02 | 0.06 | 1.32 |
| Economy | 1.56 | 0 | 25 | 3.27 | 0.09 | 2.90 |
| Market | 1.55 | 0 | 16 | 2.88 | 0.08 | 1.96 |
| World | 1.56 | 0 | 18 | 3.38 | 0.10 | 2.28 |
| All | 7.43 | 1 | 60 | 10.02 | 0.28 | 2.16 |
| Name | Mean | Min | Max | Standard Deviation | Standard Error | Skewness |
|---|---|---|---|---|---|---|
| Finance | 1.07 | 0 | 3 | 0.72 | 0.04 | 0.22 |
| Investments | 0.72 | 0 | 3 | 0.62 | 0.04 | 0.37 |
| Highlights | 1.36 | 0 | 4 | 0.85 | 0.05 | 0.49 |
| World economy | 0.79 | 0 | 3 | 0.68 | 0.04 | 0.42 |
| Market | 0.74 | 0 | 2 | 0.60 | 0.03 | 0.18 |
| Society | 0.99 | 0 | 2 | 0.66 | 0.04 | 0.01 |
| Society | 1.14 | 0 | 3 | 0.82 | 0.05 | 0.25 |
| Corporate finance | 1.00 | 0 | 3 | 0.78 | 0.05 | 0.46 |
| Stock market | 1.65 | 0 | 5 | 1.29 | 0.07 | 0.14 |
| All | 9.46 | 1 | 21 | 4.22 | 0.24 | −0.04 |
| Title | Label | |
|---|---|---|
| 1 | Trillions of billions of VND poured into Vietnamese stocks through ETFs | 2 |
| 2 | The Russia-Ukraine conflict added fuel to the fire, and the “ghost of inflation” began to haunt the Vietnamese stock exchange: Worried about leaving? | 1 |
| 3 | Dragon Capital: “Investors should not worry about short-term fluctuations from the Russia-Ukraine event but focus on the long-term prospects of the market” | 2 |
| 4 | HPG hit the ceiling with record liquidity, VN-Index broke through nearly 20 points, surpassing the 1500 points | 2 |
| 5 | Domestic investors opened more than 210,000 new stock accounts in February | 2 |
| 6 | Government’s financial strategy to 2030: Stock market capitalization reaches 120% of GDP | 2 |
| 7 | Unable to overcome the selling pressure, nearly 360 stocks were “on the floor”, VN-Index dropped 60 points, lost the 1270 points | 1 |
| 8 | Trading session 10/2/2022: Foreign investors suddenly net sold 740 billion dong on HoSE, selling hundreds of billions of VIC, HPG | 1 |
| 9 | Fertilizer, Petrol stocks all hit the floor, VN-Index lost more than 20 points in the first trading day of the week | 1 |
| 10 | Agriseco Research: Statistics since 2000, if inflation is below 10%, securities are still the most suitable investment channel | 2 |
| Precision | Recall | F1-Score | |
|---|---|---|---|
| Negative | 0.817 | 0.825 | 0.821 |
| Positive | 0.817 | 0.809 | 0.813 |
| Group | Mean | Std. Err. | Std. Dev. | |
|---|---|---|---|---|
| 0: 30 days after event date | ||||
| 1: 30 days before event date | ||||
| VN30-Index | ||||
| 0 | −0.00054 | 0.00041 | 0.01610 | |
| 1 | −0.00026 | 0.00040 | 0.01574 | |
| Combined | −0.00041 | 0.00029 | 0.01592 | |
| H0: ratio = 1 | f = 1.0464 | 2 × Pr(F > f) = 0.3719 | ||
| HNX30-Index | ||||
| 0 | −0.00143 | 0.00048 | 0.01919 | |
| 1 | −0.00101 | 0.00048 | 0.01882 | |
| Combined | −0.00122 | 0.00029 | 0.01592 | |
| H0: ratio = 1 | f = 1.0398 | 2 × Pr(F > f) = 0.4420 | ||
| 0: 5 days after event date | ||||
| 1: 5 days before event date | ||||
| VN30-Index | ||||
| 0 | −0.00147 | 0.00096 | 0.01684 | |
| 1 | −0.00195 | 0.00114 | 0.01813 | |
| Combined | −0.00122 | 0.00034 | 0.01901 | |
| H0: ratio = 1 | f = 0.8911 | 2 × Pr(F < f) = 0.2178 | ||
| HNX30-Index | ||||
| 0 | −0.00213 | 0.00115 | 0.02006 | |
| 1 | −0.00331 | 0.00136 | 0.02168 | |
| Combined | −0.00267 | 0.00088 | 0.02080 | |
| H0: ratio = 1 | f = 0.8564 | 2 × Pr(F < f) = 0.1952 | ||
| Group | Mean | Std. Err. | Std. Dev. | |
|---|---|---|---|---|
| 0: 30 days after event date | ||||
| 1: 30 days before event date | ||||
| VN30-Index | ||||
| 0 | −0.00051 | 0.00039 | 0.01515 | |
| 1 | −0.00082 | 0.00043 | 0.00043 | |
| Combined | −0.00066 | 0.00029 | 0.01586 | |
| H0: ratio = 1 | f = 0.8346 | 2 × Pr(F < f) = 0.0005 | ||
| HNX30-Index | ||||
| 0 | 0.00012 | 0.00046 | 0.01774 | |
| 1 | −0.00095 | 0.00050 | 0.01918 | |
| Combined | −0.00040 | 0.00029 | 0.01586 | |
| H0: ratio = 1 | f = 0.8558 | 2 × Pr(F < f) = 0.0027 | ||
| 0: 5 days after event date | ||||
| 1:5 days before event date | ||||
| VN30-Index | ||||
| 0 | −0.00070 | 0.00102 | 0.01743 | |
| 1 | 0.00001 | 0.00105 | 0.01640 | |
| Combined | −0.00040 | 0.00034 | 0.01846 | |
| H0: ratio = 1 | f = 1.1306 | 2 × Pr(F > f) = 0.3198 | ||
| HNX30-Index | ||||
| 0 | −0.00028 | 0.00117 | 0.02005 | |
| 1 | 0.00025 | 0.00025 | 0.01971 | |
| Combined | −0.00040 | 0.00034 | 0.01846 | |
| H0: ratio = 1 | f = 1.0349 | 2 × Pr(F > f) = 0.7826 | ||
| Group | Mean | Std. Err. | Std. Dev. | [95% Conf. Interval] | |
|---|---|---|---|---|---|
| 0: 30 days after the event date 1: 30 days before the event date | |||||
| VN30-Index—Equal variance test | |||||
| 0 | 0.0001801 | 0.0006097 | 0.017062 | −0.0010169 | 0.001377 |
| 1 | −0.0008694 | 0.0004649 | 0.0157799 | −0.0017816 | 0.0000428 |
| Difference | 0.0010495 | 0.0007555 | −0.0004321 | 0.0025311 | |
| H0: difference = 0 | t = 1.3892 | Pr(|T| > |t|) = 0.1649 | |||
| HNX30-Index—Equal variance test | |||||
| 0 | 0.0001183 | 0.0004552 | 0.0177408 | −0.0007745 | 0.0010112 |
| 1 | −0.0009462 | 0.0005019 | 0.0191769 | −0.0019307 | 0.0000383 |
| Difference | 0.0010645 | 0.0006776 | −0.000264 | 0.0023931 | |
| t = 1.5711 | Pr(|T| > |t|) = 0.1163 | ||||
| 0: 5 days after the event date 1: 5 days before the event date | |||||
| VN30-Index—Equal variance test | |||||
| 0 | −0.0014716 | 0.0009625 | 0.0168371 | −0.0033656 | 0.0004224 |
| 1 | −0.0019548 | 0.0011351 | 0.0181257 | −0.0041902 | 0.0002805 |
| −0.0016913 | 0.0007355 | 0.0174205 | −0.0031359 | −0.0002466 | |
| Difference | 0.0004832 | 0.0014783 | −0.0024205 | 0.0033869 | |
| H0: diff = 0 | t = 0.3269 | Pr(|T| > |t|) = 0.7439 | |||
| HNX30-Index—Equal variance test | |||||
| 0 | −0.002131 | 0.0011467 | 0.0200593 | −0.0043874 | 0.0001255 |
| 1 | −0.0033084 | 0.0013574 | 0.0216758 | −0.0059816 | −0.0006352 |
| Difference | 0.0011774 | 0.0017645 | −0.0022883 | 0.0046432 | |
| H0: diff = 0 | t = 0.6673 | Pr(|T| > |t|)= 0.5049 | |||
| Group | Mean | Std. Err. | Std. Dev. | [95% Conf. Interval] | |
|---|---|---|---|---|---|
| 0: 30 days after the event date; 1: 30 days before the event date | |||||
| VN30-Index—Unequal variance test | |||||
| 0 | −0.0005062 | 0.0003886 | 0.015145 | −0.0012684 | 0.000256 |
| 1 | −0.0008217 | 0.0004339 | 0.0165781 | −0.0016728 | 0.0000294 |
| Difference | 0003155 | 0.0005824 | −0.0008265 | 0.0014576 | |
| H0: difference = 0 | t = 0.5417 | Pr(|T| > |t|) = 0.5881 | |||
| HNX30-Index—Unequal variance test | |||||
| 0 | 0.0001183 | 0.0004552 | 0.0177408 | −0.0007745 | 0.0010112 |
| 1 | −0.0009462 | 0.0005019 | 0.0191769 | −0.0019307 | 0.0000383 |
| Difference | 0.0010645 | 0.0006776 | −0.000264 | 0.0023931 | |
| Ha: diff = 0 | t = 1.5711 | Pr(|T| > |t|) = 0.1163 | |||
| 0: 5 days after the event date 1: 5 days before the event date | |||||
| VN30-Index—Equal variance test | |||||
| 0 | −0.0007025 | 0.0010168 | 0.017434 | −0.0027036 | 0.0012986 |
| 1 | 0.0000139 | 0.0010475 | 0.016396 | −0.0020494 | 0.0020772 |
| Difference | −0.0007164 | 0.001468 | −0.0036002 | 0.0021673 | |
| H0: diff = 0 | t = −0.4880 | Pr(|T| > |t|) = 0.6257 | |||
| HNX30-Index—Equal variance test | |||||
| 0 | −0.0002755 | 0.0011695 | 0.0200522 | −0.0025771 | 0.0020262 |
| 1 | 0.0002452 | 0.0012593 | 0.019711 | −0.0022353 | 0.0027257 |
| Difference | −0.0005207 | 0.0017213 | −0.0039019 | 0.0028605 | |
| H0: diff = 0 | t = −0.3025 | Pr(|T| > |t|) = 0.7624 | |||
Disclaimer/Publisher’s Note: The statements, opinions and data contained in all publications are solely those of the individual author(s) and contributor(s) and not of MDPI and/or the editor(s). MDPI and/or the editor(s) disclaim responsibility for any injury to people or property resulting from any ideas, methods, instructions or products referred to in the content. |
© 2023 by the authors. Licensee MDPI, Basel, Switzerland. This article is an open access article distributed under the terms and conditions of the Creative Commons Attribution (CC BY) license (https://creativecommons.org/licenses/by/4.0/).
Share and Cite
Vu, L.T.; Pham, D.N.; Kieu, H.T.; Pham, T.T.T. Sentiments Extracted from News and Stock Market Reactions in Vietnam. Int. J. Financial Stud. 2023, 11, 101. https://doi.org/10.3390/ijfs11030101
Vu LT, Pham DN, Kieu HT, Pham TTT. Sentiments Extracted from News and Stock Market Reactions in Vietnam. International Journal of Financial Studies. 2023; 11(3):101. https://doi.org/10.3390/ijfs11030101
Chicago/Turabian StyleVu, Loan Thi, Dong Ngoc Pham, Hang Thu Kieu, and Thuy Thi Thanh Pham. 2023. "Sentiments Extracted from News and Stock Market Reactions in Vietnam" International Journal of Financial Studies 11, no. 3: 101. https://doi.org/10.3390/ijfs11030101
APA StyleVu, L. T., Pham, D. N., Kieu, H. T., & Pham, T. T. T. (2023). Sentiments Extracted from News and Stock Market Reactions in Vietnam. International Journal of Financial Studies, 11(3), 101. https://doi.org/10.3390/ijfs11030101


