Abstract
This study aimed to investigate the interactions between Bitcoin to euro, gold, and STOXX50 during the period of COVID-19. First, a bibliometric analysis based on the R package was applied to highlight the research trends in the field during the period of the COVID-19 pandemic. While investigating the effects of the pandemic on Bitcoin, the number of cases of COVID-19 was used as a proxy. Using daily data for the period 1 March 2020 to 3 March 2020 and based on a vector autoregressive model, impulse response, and variance decomposition were utilized to analyze the dynamic relationships among the variables. The results revealed that the COVID-19 cases and gold hurt the exchange rate of Bitcoin to euro, while there was great volatility regarding the response of Bitcoin to a shock of STOXX50. The Granger causality test was constructed to investigate the relationships among the variables. The results show the presence of unidirectional causality running from new cases to STOXX50 and from STOXX50 to gold. This study contributes to the existing scholarly research into the dynamic relationships that appeared among Bitcoin, gold, and STOXX50 in a period of great uncertainty. Finally, the findings have significant implications for investors, who are interested in diversifying their portfolios.
1. Introduction
The COVID-19 pandemic has posed a significant health and economic challenge to the global community by causing financial uncertainty for both businesses and consumers. Lockdowns and challenges such as those in the supply chain characterized the first half of 2020. The global economy began to return to normality with the launch of vaccine campaigns. However, this still had to deal with several obstacles such as investor anxiety, which causes investors to behave in unanticipated ways (Chen et al. 2020). According to Li et al. (2021), there is an increasing possibility of a market crash due to the fear sentiment because of the COVID-19 pandemic. According to the literature, the daily death rates and the number of new cases are used as proxies for the COVID-19 event (Apergis 2022; Baig et al. 2021; Zhang et al. 2020). When investors are more interested in a news event, the associated information is quickly reflected into asset prices, leading to higher volatility (Smales 2021). Furthermore, there is strong evidence that volatility spillovers rise abruptly during this period (Adekoya and Oliyide 2022; Akhtaruzzaman et al. 2021; Corbet et al. 2020). Under these circumstances, it is essential for investors to know which assets react as a safe heaven or have a hedging behavior to diversify their portfolio (Conlon and McGee 2020; Ji et al. 2020; Shehzad et al. 2021; Syuhada et al. 2022; Yan et al. 2022) and re-establish their confidence (Salisu and Vo 2020). According to the literature, cryptocurrencies are better hedging assets over other financial assets such as stocks and the U.S. dollar (Dyhrberg 2016), while gold acts as a safe haven (Baur and McDermott 2010; Jeribi et al. 2021). During COVID-19, many limitations were taken by governments such as lockdowns and quantitative easing programs implemented by central banks.
The current research focused on cryptocurrencies, among other financial markets, as a decentralized digital currency and independent of central banks and the government to isolate other parameters and examine the impact of new cases of COVID-19 on the volatility of cryptocurrencies. Moreover, it cannot be ignored that COVID-19 accelerated the digital transportation, where it was noticed that there was an increasing interest in digital currencies because of people’s fear that the virus may spread through monetary transactions (banknotes and coins) (Harbourt et al. 2020; Pal and Bhadada 2020). Bitcoin was used as the major cryptocurrency, gold was used as the proxy for commodities, and STOXX50 was used as the proxy for the stock market. Gold is one of the major precious metals. In turbulent times, investors seem to consider gold as a safe haven and tend to increase their demand for it. Gold was used in this study to investigate whether gold reacts either as a safe haven tool or as a hedging or diversification tool (Su and Kao 2022). With regard to the European stock index STOXX50, this was used as the finding of our bibliometric analysis revealed that cryptocurrencies and the stock market have cooperated most frequently.
There has been little previous research on this topic. Salisu and Ogbonna (2021) investigated the performance of cryptocurrencies in the period of COVID-19 and concluded that fear-induced news increased the volatility of cryptocurrencies in contrast to the pre-pandemic period. Similarly, Conlon and McGee (2020) confirmed the riskiness of Bitcoin in this period. In contrast, Sifat (2021) and Wang and Wang (2021) found that the COVID-19 pandemic did not influence the volatility of cryptocurrencies. On the other hand, Goodell and Goutte (2021) concluded that Bitcoin prices rose in the pandemic period and Corbet et al. (2020) suggested that large cryptocurrencies acted as a store of value during this period. Employing a time-varying parameter vector autoregression (TVP-VAR), Ha and Nham (2022) found that the health shocks of COVID-19 appeared to influence the dynamic connectedness between crude oil, gold, stock, and the cryptocurrency market.
The wavelet method was used by Karamti and Belhassine (2022) to explore the relatedness between the COVID-19 pandemic and major financial markets. They used the daily confirmed COVID-19 deaths as a proxy to the global COVID-19 fear, Asia was represented by the Nikkei 225 (Japan) and SSE (China), the U.S. was represented by the S&P500, and finally, the European market was represented by the CAC40 (France), DAC (Germany), and FTSE (United Kingdom). Oil (WTI) and gold were included as the most commonly traded commodities and Bitcoin and Ethereum as the two major cryptocurrencies. The results showed that SSE, WTI, and gold could act as safe havens during the COVID-19 period, while cryptocurrencies and the Nikkei were highly correlated with the COVID-19 outbreak. They concluded that there was a differentiation between the short-run and long-run period. Longer-term investors did not seem to be affected by the short-term market fluctuations due to the COVID-19 pandemic. Using the wavelet method, Umar et al. (2021) concluded that although Bitcoin reacted as a safe haven asset during the times of high uncertainties, this relationship tended to change during the short- to long-run. Similarly, Maneejuk et al. (2022) used network analysis and wavelet coherence in order to explore the connectedness and comovement of financial markets consisting of stocks, commoditiess, gold, real estate investment trust, U.S. exchange, oil, and cryptocurrencies before and during the COVID-19 pandemic. Yarovaya et al. (2022) investigated the financial market reaction and the recovery of four classes of financial assets (stock market, precious metals, bonds, and cryptocurrencies) to the COVID-19 outbreak. The findings imply that gold offers limited mean reversion. Regarding stock markets, these assets seem to be more predictable, and as a result, less risky, while cryptocurrencies are considered to be the riskiest asset class in the long-run in terms of the unpredictability of returns. Using a two-stage DCC-EGARCH model analysis, Ampountolas (2023) examined the correlations between the return-volatility of cryptocurrencies and global stock market indices such as the S&P500, DJI, GDAXI, and FTSE during the pandemic period.
To sum up, the COVID-19 crisis can be considered as a black swan event, so it is of great value to investigate the reaction and recovery of the major financial markets during this period. This study intends to contribute to the scientific community by (i) investigating the volatility of cryptocurrencies during the health and economic crisis of COVID-19 and (ii) exploring the interaction among cryptocurrencies and other traditional financial markets such as gold and the stock markets in this period. Few researchers have investigated the volatility spillover among Bitcoin and other financial assets. Instead, this study attempts to fill this gap by employing an impulse response analysis and variance decomposition analysis, in a VAR framework, in order to explore the interactions between Bitcoin, gold, and the STOXX50. The results revealed that Bitcoin had a significant fluctuation in this period. It seemed to be sensitive to all variables (gold, STOXX50), but it appeared to have the ability to recover quickly. Gold only seemed to be affected by the stock market, while COVID-19 cases had no significant impact on the prices of gold, confirming its role as a safe haven in periods of uncertainty. The STOXX50 fluctuated a lot and was affected by all variables (Bitcoin, gold).
The rest of this paper is structured as follows. Section 2 presents the research trends in the field with the use of bibliometric analysis based on R package. Section 3 presents the materials and methods, while Section 4 discusses the results. Section 5 discusses the most crucial findings, highlights the limitations of the research, indicates future paths for research in the field, and concludes the paper.
2. Literature Review
A crisis like the COVID-19 pandemic might disrupt the stochastic process that determines the returns and volatility (Di and Xu 2022). Before to the 2013 price fall, Bitcoin volatility was asymmetric, moving in the opposite direction of traditional assets; however, this asymmetry was not apparent following the crash (Baur et al. 2022). Similarly, a global disaster such as the COVID-19 pandemic might have a substantial impact on the volatility and returns (Bourghelle et al. 2022; Sifat 2021). As a result, this topic has captured the attention of most experts for future research. Academics in this area, for example, have reported significant increases in both the returns and quantities traded in the major cryptocurrencies, confirming that COVID-19 levels propelled the Bitcoin prices upward (Foroutan and Lahmiri 2022; Le et al. 2021). According to the World Health Organization, the People’s Republic of China is the origin of the COVID-19 pandemic (WHO). The World Health Organization’s national office gathered data from the Wuhan Local Health Commission, reporting cases of “viral pneumonia” on 31 December. Initially, the virus appeared to be exclusive to that region. France alerted the United Nations on 24 January of specific cases reported by people who had been in the Wuhan region, the first confirmed cases in Europe. Despite this, the COVID-19 infections and deaths remained at relatively low levels in January and February (Baur et al. 2022). Additionally, the number of those infected and died in Europe surged drastically in March before decreasing at the end of the month. After China, Europe was the first continent to be devastated by the pandemic, with the most devastating repercussions within a short period of time. In a recent study, Azimli used a quantile regression technique to assess the influence of COVID-19 on the daily returns of the S&P500 index (Azimli 2022). Moreover, Kwapié et al. used high-frequency data from 129 cryptocurrencies to evaluate the impact of COVID-19 on network architecture in the cryptocurrency market (Kwapié et al. 2023).
Following the previous lines, the purpose of this research was to investigate the global developments in cryptocurrencies, particularly Bitcoin, during the COVID-19 era. Many studies have been conducted on the impact of the COVID-19 crisis on financial markets, but it is especially important to investigate the volatility of cryptocurrencies because of the COVID-19 pandemic (Zhang and Mani 2021). Bibliometric analysis with the use of R-package was applied to highlight the research trends in the field during the COVID-19 pandemic. The research explored emerging trends and frontiers of blockchain by analyzing 457 articles on the field of blockchain that were retrieved from the Scopus database for the time frame of 2013 to 2020.
Following the bibliometric analysis, the terms “stock market” and “COVID-19” were included in the analysis. The tree map (Figure 1), which was exported with the use of the bibliometric tool Biblioshiny, showed that investments in Bitcoin were favored above gold throughout the COVID-19 timeframe (Goodell and Goutte 2021). Experts and academics in the field alike are predicting a recession. The Great Recession of the 2000s was followed by the COVID-19 recession, a decade later, which was one of the most crucial and widespread in global history. Because recessions occur on a regular basis, investors want to lose as little money as possible if one occurs. Historically, an investor would retain some of their money in precious metals such as gold (Ji et al. 2020; Zhang and Mani 2021). This safeguards against the losses that equities may suffer during a downturn in the economy. This has been and continues to be beneficial, but a new option is challenging this time-honored approach of capital preservation (Corbet et al. 2020; Foroutan and Lahmiri 2022). Bitcoin has been shown to be an appealing asset for investors as it has been around long enough to obtain recognition and acceptance, and is even exhibiting certain trends. Therefore, this type of initial coin offering has become a viable alternative investment for certain people. It also has a wide range of potential applications and might be a worthwhile investment if utilized wisely (Le et al. 2021; Ullah et al. 2022; Zhang and Mani 2021).
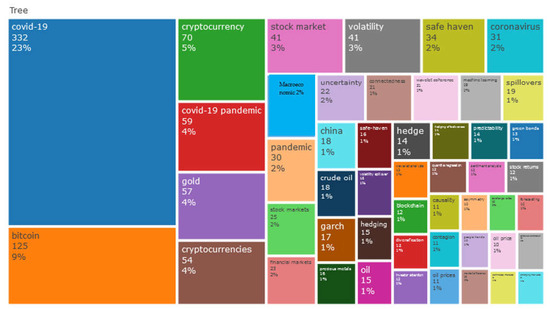
Figure 1.
Tree map. Source: Biblioshony/Scopus.
In line with the findings of Figure 1, the map of cluster analysis based on the authors’ keywords (Figure 2) showed that “cryptocurrencies” and “COVID-19” received the most attention of scholars during the COVID-19 period. In addition, the term of safe haven is strongly connected to the terms cryptocurrencies and the COVID-19 pandemic. Investor loss aversion drives the concept of an investment safe haven, where investors are more concerned about avoiding losses than with any potential rewards (Jeribi et al. 2021; Ji et al. 2020). At times of market turmoil such as COVID-19, investors are compelled to seek safe-haven assets that are uncorrelated or negatively correlated with conventional assets (Atri et al. 2021; Chen et al. 2020). Many assets that can be classified as safe havens such as gold currencies, long-dated treasury bonds, and, most recently, cryptocurrencies, have emerged across short- to medium-time horizons (Shehzad et al. 2021; Wang and Wang 2021). In the case of cryptocurrencies, their rising popularity has inspired a flurry of research regarding their investment benefits, notably, their safe haven characteristics (Azimli 2022; Yarovaya et al. 2022). Scholars have studied Bitcoin’s hedging and safe haven properties on an hourly basis and determined that it serves as a hedge, diversifier, and safe haven for a range of international currencies (Assaf et al. 2023; Katsiampa et al. 2022). Instead, other experts in the field have employed a cross-quantilogram technique to identify safe haven features and discover some evidence that Bitcoin, gold, and the commodities index are poor safe havens, but that this behavior varies over time (Bekiros et al. 2021). Finally, other academics have discovered that using Bitcoin in a portfolio of gold, oil, and emerging market equities significantly reduces the portfolio risk.
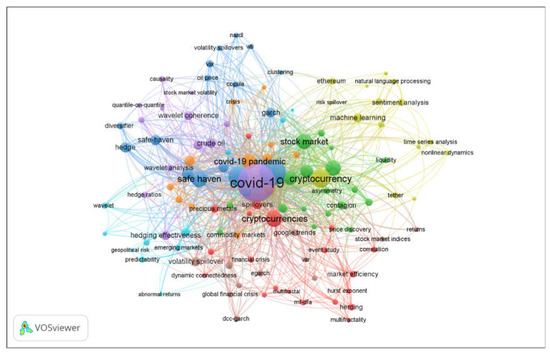
Figure 2.
Cluster analysis based on the authors’ keywords. Source: VOSviewer/Scopus.
Figure 3 depicts the country’s collaboration. The darker the color of the country, the more research, relative to the keywords, there are in the country. Additionally, the diffused blue in the map highlights the development of the current research work within the global context. As shown in Figure 3, China is the leader of the countries. According to the number and thickness of the lines, there are strong channels between China and Pakistan, China and Australia, China and UK, Tunisia and Saudi Arabia.
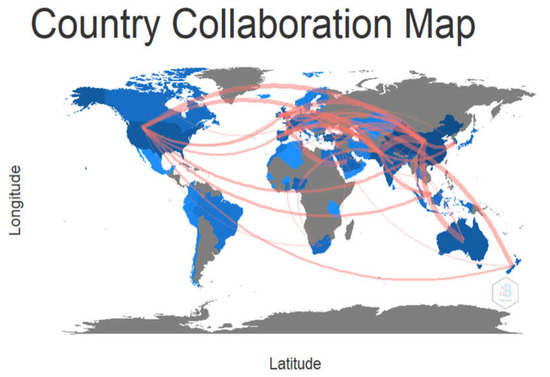
Figure 3.
Thematic map. Source: Scopus/Biblioshiny.
Figure 4 represents the thematic map. The thematic map is divided into four quadrants. The centrality of keywords is represented by the horizontal axis, while the density is represented by the vertical axis. The centrality shows the degree of interaction among clusters, while the density indicates the degree of connection between keywords in the clusters. The upper right quadrant represents the motor themes, which have been at the core of the researcher’s interests for a long time. The upper left quadrant is defined as highly developed and isolated themes including themes well-developed but not important for the current field. The lower left quadrant illustrates the emerging or declining themes. This category includes the themes that are less developed by scholars, indicating the appearance or disappearance of these themes. Finally, the lower right quadrant includes the basic and transversal themes. These themes are important and less developed, revealing the trend of the research field. Based on Figure 4, the COVID-19 pandemic appears in the first quadrant as a well-developed theme with strong centrality and high density. The appearance of cryptocurrencies in both quadrants of emerging and basic themes shows the increased interest of scholars on this topic, which provides a new pathway for future research on the subject area of the volatility of cryptocurrencies during a pandemic. In our study, we not only investigated the volatility of cryptocurrencies due to the pandemic, but also the dynamic and causal relationships between cryptocurrencies, commodities, and stock markets in this period of uncertainty.
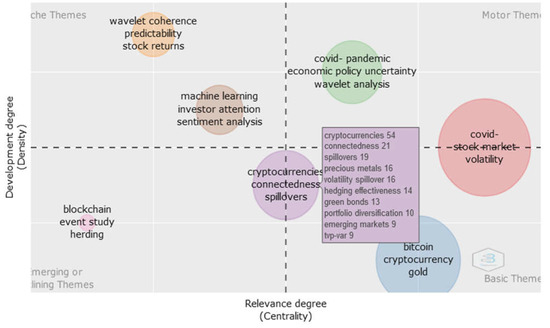
Figure 4.
Thematic map.
3. Data and Methods
3.1. Data
The scope of this investigation was to explore the volatility of cryptocurrencies, especially Bitcoin to euro in the period of COVID-19. Accordingly, the daily closing prices of Bitcoin to Euro, gold, and the European stock index STOXX50 were used for a period from 1 March 2020 to 3 March 2020. The daily number of new cases in the European Union was used as a proxy for the COVID-19 event. The original daily data were sourced from DATASTREAM managed by Thomson Reuters and transformed into logarithmic form. The sample period consisted of 734 daily observations including weekends, since Bitcoin is not confined to business days. In line with Baur et al. (Baur and McDermott 2010; Dyhrberg 2016), we assumed zero returns for Saturdays and Sundays to align all of the time series (gold, STOXX50) with the Bitcoin data.
3.2. Methodology
The time-series of BTC/EUR, GOLD, and STOXX50 are encountered as endogenous, so a vector autoregressive (VAR) model was constructed. VAR processes are popular in economics due to their flexibility and simplicity for multivariate time series data. They were introduced in econometrics by Sims (1980), as a natural generalization of the univariate autoregressive model AR to a multivariate autoregressive time-series model. Regarding the VAR model, every variable is affected by the previous values of all variables and error terms. The autoregressive term is the own lag of the dependent variable, while the vector is the number and lags of the other variables. The simplest VAR that can be constructed is a bivariate VAR, where there are only two variables and one lag. This can be described as:
where are the variables of the simultaneous system; are the variables with one lag; is the constant term; are the coefficients of the lagged variables; are stochastic error terms and are white noise disturbance terms with and , for
Ω is the matrix of variance-covariance:
An extension of the Bayesian VAR model with k variables and p lags is:
The VAR model designed for the variable of interest can be described as follows:
where is the constant term of the i variable; is the coefficient of i variable with j lags and represents the short-term relationship between the dependent and independent variable i.
A breakpoint unit root test was used to capture structural breaks. The two-lag selection for the VAR model estimation was based on the Akaike criterion, as it is considered to be superior and more effective compared to other information criteria (SC and HQ), providing more reliable results (Danish and Wang 2018).
Within the framework presented above, the impulse response shows how the dependent variable responds to shocks to each of the variables. Therefore, in these simultaneous equations for each variable from each equation separately, a unit shock occurs to the error, and the impact upon the VAR system over time is noted. Hence, the impulse response analysis was utilized in order to explore the dynamic relationship among the variables (Danish and Wang 2018; Etokakpan et al. 2020; Koch and Dimpfl 2023). Variance decomposition offers a slightly different method for examining the VAR system dynamics (Zhang 2011). It gives the proportion of the movements in the independent variable that are due to its own’ shocks, versus shocks to other variables. Finally, a Granger causality test was performed in order to capture the causal relationships among the variables (Adekoya and Oliyide 2022; Banerjee et al. 2022; Foroutan and Lahmiri 2022). In the VAR framework, the Granger causality test tries to explore whether variable x causes changes in variable y. If x causes y, then lags of x should be significant in the equation of y. In this case, it can be said that x Granger causes y or that there exists a unidirectional causality from x to y. If both sets of lags are significant, it can be said that there is bi-directional causality.
4. Results
Table 1 shows the descriptive statistical measures of the variables. The lowest mean appeared in the STOXX50 (0.000221), while the highest price appeared in GOLD (1.00382). The lowest deviation from the mean value based on the standard deviation was (0.011385) and appeared to be in GOLD, while CASES had the highest price (0.209430). Most of the variables (BTC/EUR, GOLD, STOXX50) had negative skewed data (−1.131362 < 0, −0.169894, −1.289818, respectively), while all the variables were leptokurtic (20.38825 > 3, 3.369737 > 3, 7.569779 > 3, 15.91682 > 3).

Table 1.
Descriptive statistics.
Table 2 presents the results of the breakpoint unit root test. The null hypothesis can be rejected at a 1% significance level, as a result, all the variables do not have unit roots with structural breaks.

Table 2.
Augmented Dickey–Fuller break unit root results.
In order to provide evidence about the volatility of financial markets in the pandemic period, we utilized the impulse response analysis. The following figures show the impulse responses of a variable to one-standard-deviation shock in other variables in the future and their 95% confidence bands from the four-variable VARs. The number of days (10 days period) is represented by the horizontal axis (X) of the chart and the vertical axis (Y) depicts the amount of the variable expected to change following a unit impulse. Since the impulse response analysis is sensitive to the ordering of the variables, we put the dependent variable BTC/EUR in the first place (Li and Su 2017; Zhang et al. 2017).
Specifically, Figure 5 presents that BTC/EUR was sensitive to COVID-19 cases. A shock in the COVID-19 cases had an initially negative effect from 1 to 2.5 days, reaching its minimum rate on the second day, after which it turned weakly positive. This implies that COVID-19 cases have a significant impact on BTC/EUR returns. Similarly, Apergis (Apergis 2022) concluded that the pandemic factor exerted a significant negative impact on the mean of cryptocurrency returns. On the other hand, our results contradict those of Sifat (2021) and Wang and Wang (2021), who documented that global sentiment proxies did not influence the volatility of cryptocurrencies, and mostly those associated with the COVID-19 pandemic. In response to shocks stemming from the gold, BTC/EUR remained unaffected in the first two days and had a negative impact from 2 to 4 days, then was stabilized to zero. The response of BTC/EUR to STOXX50 fluctuated constantly, reaching the maximum level on the second day and the minimum on the third. This stabilized to zero after the sixth day.
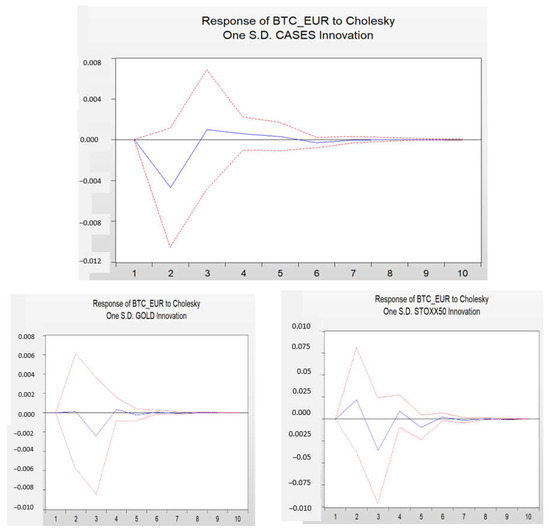
Figure 5.
Impulse response of BTC/EUR. Notes: The red line depicts the confidence interval, while the blue line depicts the response of bitcoin to Cholesky. One S.D innovation of each variable.
Figure 6 depicts the impulse response of Bitcoin to all of the variables. According to these results, the cases, gold, and the STOXX50 exerted a negative influence on BTC/EUR most of the time, while there was a significant fluctuation in the period of COVID-19. Bitcoin seemed to be most affected by the COVID-19 cases. Similarly, Salisu and Ogbonna (Salisu and Ogbonna 2021) showed that the volatility of Bitcoin was higher during COVID-19 than the period before it. There were two significant findings in our study. The first one revealed that Bitcoin was very sensitive to all of the variables, even though cryptocurrencies were decentralized digital currencies. The second finding was that although Bitcoin had a great fluctuation, it appeared to be able to recover quickly from the shocks nearly to the sixth day.
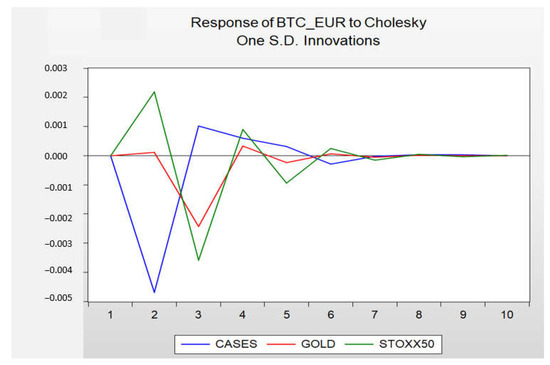
Figure 6.
Impulse response of BTC/EUR to all.
Figure 7 illustrates the response of gold to a shock from the COVID-19 cases, the Bitcoin to euro, and the STOXX50. Based on our findings, a shock in the exchange rate of Bitcoin to euro did not seem to affect the gold. On the other hand, a shock in the STOXX50 seemed to positively affect the gold after the first day. According to the literature, gold and stock markets were highly correlated during the COVID-19 pandemic (Benlagha and Omari 2022; Hung and Vo 2021). As far as COVID-19 cases are concerned, a shock in this variable appeared to negatively affect gold until the middle of the third day. Paramati et al. (2022) concluded that decreases in COVID-19 new cases and increases in recoveries made investors more optimistic and tended to demand more gold. In contrast to our results, Atri et al. (2021) and Gautam et al. (Gautam et al. 2022) showed that gold prices increased in the period of COVID-19. Other scholars have concluded that gold has a permanent causality with the number of COVID-19 cases (Tuna and Tuna 2022).
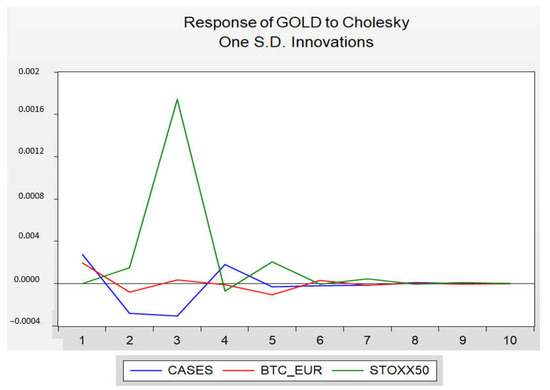
Figure 7.
Impulse response of gold.
Subsequently, it was observed in Figure 8 that the response of STOXX50 to the other variables had the highest fluctuation. More specifically, a shock in the cases seemed to affect the STOXX50 in a positive way during the first 2.5 days and in a negative way on days 3–4. The appearance of this volatility is in contrast with Tuna and Tuna (2022), who concluded that the number of COVID-19 cases had neither a temporary nor permanent effect on conventional stock markets. Baker et al. (2020) confirmed that COVID-19 had the greatest impact on the global stock market. The impact of Bitcoin on STOXX50 was negative most of the time, reaching the lowest rate on the third day. The response of STOXX50 to gold was positive over the entire time frame. According to Dutta et al. (2020), gold plays an important role in the downside hedging in stock markets. Similarly, Le et al. (2021) demonstrated that volatility transmission across Fintech stocks, gold, and Bitcoin was exacerbated during COVID-19.
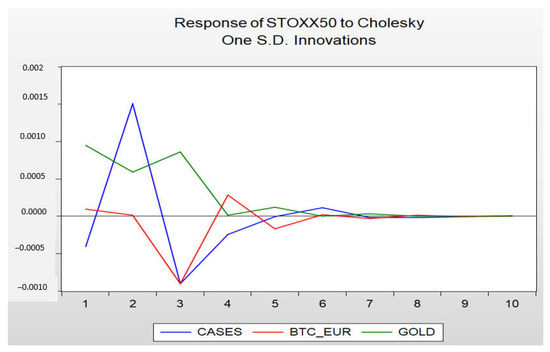
Figure 8.
Impulse response of the STOXX50.
To further investigate the volatility of the variables, variance decomposition analysis was employed. The results are summarized in Table 3, which shows the calculations in 10-time horizons. At the 10-day forecasting horizon, CASES, GOLD. and STOXX50 explained 0.49%, 0.13%. and 0.40% of Bitcoin to euro respectively, with 98.97% of BTC/EUR being explained by its own innovations. The results revealed that the variance decomposition of Bitcoin is explained mostly by its own shock and then by COVID-19 CASES and STOXX50, while GOLD contributed little to the explanation of BTC/EUR.

Table 3.
Variance decomposition of BTC/EUR.
The causal relationships among the variables were explored by using the Granger causality test. We proceeded to estimate the pairwise Granger causality to determine the uni, bi, or no direction of causality among the variables. According to Table 4, there was a unidirectional causality from COVID-19 cases to STOXX50 at a significance level of 5%, while STOXX50 Granger caused GOLD at a significance level of 1%. Similarly, Balcilar et al. (2019) stated that there was a causal relationship between gold and the stock market, but it was not permanent.

Table 4.
Pairwise Granger causality test.
5. Discussion and Conclusions
The impact of the COVID-19 pandemic has affected the global financial markets almost across all dimensions, from traditional financial assets such as stock markets and precious metals, to the more contemporary assets such as cryptocurrencies, due to the presence of a fear sentiment among investors. According to our bibliometric analysis, Bitcoin and COVID-19 are a major theme of academic research. Furthermore, keywords such as stock market and precious metals indicate an increasing interest of researchers.
This study analyzed the volatility of cryptocurrencies in the COVID-19 period and the dynamic relationships among Bitcoin, gold, and STOXX50 in this period. For this purpose, the daily European number of new COVID-19 cases, Bitcoin to euro, gold, and European index STOXX50 between 1 March 2020 and 3 March 2022 were used. Despite the limitations of this study, the correlation coefficient does not account for changes over time as it deals with a single number for the entire period in a VAR framework, so we utilized the impulse response analysis and the variance decomposition method to capture the dynamic relationships among the variables.
The findings revealed that fear-induced news such as newly confirmed COVID-19 cases increased the volatility of Bitcoin to euro. In particular, a shock in the COVID-19 cases had an initially strong negative effect from 1 to 2.5 days, reaching its minimum rate on the second day, after which it turned weakly positive. This is in line with other scholars, who have concluded that negative sentiments associated with COVID-19 significantly influenced Bitcoin returns (Apergis 2022; Corbet et al. 2020). Yarovaya et al. (2022) investigated whether the COVID-19 crises served as a black swan event on cryptocurrencies, resulting in behavioral anomalies such as investor herding. In a similar vein, Conlon and McGee (Conlon and McGee 2020) documented that Bitcoin failed to act as a safe haven. It is crucial to explain the cryptocurrencies’ behavior in this period by considering two different approaches: the first one concerns the fear sentiment of the investors, whereas the second one concerns the increasing global interest in digital transactions. Based on the fear sentiment approach, we can explain the strong negative impact of COVID-19 cases on the volatility of Bitcoin to euro in the first 2.5 days. After this, is seemed to turn weakly positive, a behavior that can be explained by considering the second approach of the increasing rate of digital transactions.
In our study, we tried to compare the behavior of cryptocurrencies with less volatile markets such as commodity markets. Gold is considered to be a safe haven for many investors, especially in periods of great uncertainty (Baur and McDermott 2010). Our results revealed that in response to shocks stemming from gold, BTC/EUR remained unaffected in the first two days and had a negative impact from 2 to 4 days. On the other hand, gold did not seem to be affected from a shock of Bitcoin. The results confirm the role of gold as a safe haven. Similarly, Shehzad et al. (2021) concluded that the return on investments in gold was higher than portfolio investments combined with stocks and Bitcoin. Based on our findings, there is a significant interaction between gold and the stock market.
Regarding the dynamic relationship between Bitcoin and STOXX50, we concluded that these variables had the highest fluctuation. The response of BTC/EUR to STOXX50 fluctuated constantly, reaching the maximum level on the second day and the minimum on the third. It is worthwhile mentioning that even though Bitcoin was sensitive to the shocks of all variables, it seemed to have the ability to recover quickly, possibly revealing its safe haven characteristic. Finally, according to the Granger causality test, there was a unidirectional causality from COVID-19 cases to STOXX50 at a significance level of 5%, while STOXX50 Granger caused GOLD at a significance level of 1%.
The current analysis has several implications for academics, policymakers, and investors. Constructing a bibliometric analysis, we identified that the volatility of cryptocurrencies and the connectedness spillover among Bitcoin, gold, and stock markets are important themes to the research field, as a promising research area, and further investigations are recommended. Policymakers should consider the interaction among cryptocurrencies and traditional financial markets such as commodities and stock markets in turbulent periods, in order to better react to the dynamics of digital currencies and adjust their monetary policy decisions. During stressful periods with high volatility, our findings are crucial for investors to make investment decisions by adopting the right trading strategies (Loizia et al. 2021; Vardopoulos et al. 2021). Our study had some limitations, as we focused on European Union data. Regarding future research, we could expand our study by including a comparison with other countries such as China or the USA. Furthermore, a subject of future research could be the investigation of the volatility of cryptocurrencies through an asymmetric modeling approach such as the ADCC-GARCH model to capture the impact of positive and negative shocks. The increasing interest of digital transformation and blockchain technology could lead researchers to investigate not only Bitcoin, but also other cryptocurrencies such as Ethereum, Ripple, Litecoin, Platicoin, and Stellar. Moreover, with respect to the use of the Granger causality test, it is a measure based on second-order, correlation-based statistics, which limits its use to linear systems. As a result, to quantify the information flow, and because the VAR technique cannot estimate this connection, measures sensitive to non-linear interactions and linkages must be used such as transfer entropy. Given the authors’ discovery of nonlinearities in the data, the analysis should be enhanced by including a method that is resistant to nonlinearities. This will also be a subject of our future research work.
Author Contributions
Conceptualization, K.R., A.G. and S.K.; methodology, S.K. and N.S.; software, S.K. and K.R.; validation, N.S., A.G. and K.R.; formal analysis, S.K.; investigation, I.P.; resources, A.G. and S.K.; data curation, K.R.; writing—original draft preparation, S.K., K.R., A.G., N.S. and I.P.; writing—review and editing, S.K., K.R., A.G., N.S. and I.P.; visualization, N.S. and S.K.; supervision, N.S. and A.G.; project administration, A.G., K.R. and I.P. All authors have read and agreed to the published version of the manuscript.
Funding
This research received no external funding.
Informed Consent Statement
Not applicable.
Data Availability Statement
Not applicable.
Conflicts of Interest
The authors declare no conflict of interest.
References
- Adekoya, Oluwasegun B., and Johnson A. Oliyide. 2022. Commodity and Financial Markets’ Fear before and during COVID-19 Pandemic: Persistence and Causality Analyses. Resources Policy 76: 102598. [Google Scholar] [CrossRef]
- Akhtaruzzaman, Md, Sabri Boubaker, and Ahmet Sensoy. 2021. Financial Contagion during COVID–19 Crisis. Finance Research Letters 38: 101604. [Google Scholar] [CrossRef] [PubMed]
- Ampountolas, Apostolos. 2023. The Effect of COVID-19 on Cryptocurrencies and the Stock Market Volatility: A Two-Stage DCC-EGARCH Model Analysis. Journal of Risk and Financial Management 16: 25. [Google Scholar] [CrossRef]
- Apergis, Nicholas. 2022. COVID-19 and Cryptocurrency Volatility: Evidence from Asymmetric Modelling. Finance Research Letters 2022: 102659. [Google Scholar] [CrossRef]
- Assaf, Ata, Khaled Mokni, Imran Yousaf, and Avishek Bhandari. 2023. Long Memory in the High Frequency Cryptocurrency Markets Using Fractal Connectivity Analysis: The Impact of COVID-19. Research in International Business and Finance 64: 101821. [Google Scholar] [CrossRef]
- Atri, Hanen, Saoussen Kouki, and Mohamed imen Gallali. 2021. The Impact of COVID-19 News, Panic and Media Coverage on the Oil and Gold Prices: An ARDL Approach. Resources Policy 72: 102061. [Google Scholar] [CrossRef]
- Azimli, Asil. 2022. Degree and Structure of Return Dependence among Commodities, Energy Stocks and International Equity Markets during the Post-COVID-19 Period. Resources Policy 77: 102679. [Google Scholar] [CrossRef] [PubMed]
- Baig, Ahmed S., Hassan Anjum Butt, Omair Haroon, and Syed Aun R. Rizvi. 2021. Deaths, Panic, Lockdowns and US Equity Markets: The Case of COVID-19 Pandemic. Finance Research Letters 38: 101701. [Google Scholar] [CrossRef] [PubMed]
- Baker, Scott, Nicholas Bloom, Steven Davis, and Stephen Terry. 2020. COVID-Induced Economic Uncertainty. Cambridge, MA: National Bureau of Economic Research, vol. 17. [Google Scholar]
- Balcilar, Mehmet, Zeynel Abidin Ozdemir, and Muhammad Shahbaz. 2019. On the Time-Varying Links between Oil and Gold: New Insights from the Rolling and Recursive Rolling Approaches. International Journal of Finance and Economics 24: 1047–65. [Google Scholar] [CrossRef]
- Banerjee, Ameet Kumar, Md Akhtaruzzaman, Andreia Dionisio, Dora Almeida, and Ahmet Sensoy. 2022. Nonlinear Nexus between Cryptocurrency Returns and COVID–19 COVID-19 News Sentiment. Journal of Behavioral and Experimental Finance 36: 100747. [Google Scholar] [CrossRef] [PubMed]
- Baur, Dirk G., Lai T. Hoang, and Md Zakir Hossain. 2022. Is Bitcoin a Hedge? How Extreme Volatility Can Destroy the Hedge Property. Finance Research Letters 47: 102655. [Google Scholar] [CrossRef]
- Baur, Dirk G., and Thomas K. McDermott. 2010. Is Gold a Safe Haven? International Evidence. Journal of Banking and Finance 34: 1886–98. [Google Scholar] [CrossRef]
- Bekiros, Stelios, Axel Hedström, Evgeniia Jayasekera, Tapas Mishra, and Gazi Salah Uddin. 2021. Correlated at the Tail: Implications of Asymmetric Tail-Dependence Across Bitcoin Markets. Computational Economics 58: 1289–99. [Google Scholar] [CrossRef]
- Benlagha, Noureddine, and Salaheddine El Omari. 2022. Connectedness of Stock Markets with Gold and Oil: New Evidence from COVID-19 Pandemic. Finance Research Letters 46: 102373. [Google Scholar] [CrossRef] [PubMed]
- Bourghelle, David, Fredj Jawadi, and Philippe Rozin. 2022. Do Collective Emotions Drive Bitcoin Volatility? A Triple Regime-Switching Vector Approach. Journal of Economic Behavior and Organization 196: 294–306. [Google Scholar] [CrossRef]
- Chen, Conghui, Lanlan Liu, and Ningru Zhao. 2020. Fear Sentiment, Uncertainty, and Bitcoin Price Dynamics: The Case of COVID-19. Emerging Markets Finance and Trade 56: 2298–2309. [Google Scholar] [CrossRef]
- Conlon, Thomas, and Richard McGee. 2020. Safe Haven or Risky Hazard? Bitcoin during the Covid-19 Bear Market. Finance Research Letters 35: 101607. [Google Scholar] [CrossRef]
- Corbet, Shaen, Charles Larkin, and Brian Lucey. 2020. The Contagion Effects of the COVID-19 Pandemic: Evidence from Gold and Cryptocurrencies. Finance Research Letters 35: 101554. [Google Scholar] [CrossRef]
- Danish, Bo Wang, and Zhaohua Wang. 2018. Imported Technology and CO2 Emission in China: Collecting Evidence through Bound Testing and VECM Approach. Renewable and Sustainable Energy Reviews 82: 4204–14. [Google Scholar] [CrossRef]
- Di, Michael, and Ke Xu. 2022. COVID-19 Vaccine and Post-Pandemic Recovery: Evidence from Bitcoin Cross-Asset Implied Volatility Spillover. Finance Research Letters 50: 103289. [Google Scholar] [CrossRef] [PubMed]
- Dutta, Anupam, Debojyoti Das, R. K. Jana, and Xuan Vinh Vo. 2020. COVID-19 and Oil Market Crash: Revisiting the Safe Haven Property of Gold and Bitcoin. Resources Policy 69: 101816. [Google Scholar] [CrossRef]
- Dyhrberg, Anne Haubo. 2016. Bitcoin, Gold and the Dollar—A GARCH Volatility Analysis. Finance Research Letters 16: 85–92. [Google Scholar] [CrossRef]
- Etokakpan, Mfonobong Udom, Sakiru Adebola Solarin, Vedat Yorucu, Festus Victor Bekun, and Samuel Asumadu Sarkodie. 2020. Modeling Natural Gas Consumption, Capital Formation, Globalization, CO2 Emissions and Economic Growth Nexus in Malaysia: Fresh Evidence from Combined Cointegration and Causality Analysis. Energy Strategy Reviews 31: 100526. [Google Scholar] [CrossRef]
- Foroutan, Parisa, and Salim Lahmiri. 2022. The Effect of COVID-19 Pandemic on Return-Volume and Return-Volatility Relationships in Cryptocurrency Markets. Chaos, Solitons and Fractals 162: 112443. [Google Scholar] [CrossRef]
- Gautam, Roshan, Yoochan Kim, Erkan Topal, and Michael Hitch. 2022. Correlation between COVID-19 Cases and Gold Price Fluctuation. International Journal of Mining, Reclamation and Environment 36: 574–86. [Google Scholar] [CrossRef]
- Goodell, John W., and Stephane Goutte. 2021. Co-Movement of COVID-19 and Bitcoin: Evidence from Wavelet Coherence Analysis. Finance Research Letters 38: 101625. [Google Scholar] [CrossRef] [PubMed]
- Ha, Le Thanh, and Nguyen Thi Hong Nham. 2022. An Application of a TVP-VAR Extended Joint Connected Approach to Explore Connectedness between WTI Crude Oil, Gold, Stock and Cryptocurrencies during the COVID-19 Health Crisis. Technological Forecasting and Social Change 183: 121909. [Google Scholar] [CrossRef] [PubMed]
- Harbourt, David E., Andrew D. Haddow, Ashley E. Piper, Holly Bloomfield, Brian J. Kearney, David Fetterer, Kathleen Gibson, and Timothy Minogue. 2020. Modeling the Stability of Severe Acute Respiratory Syndrome Coronavirus 2 (SARS-CoV-2) on Skin, Currency, and Clothing. PLoS Neglected Tropical Diseases 14: e0008831. [Google Scholar] [CrossRef]
- Hung, Ngo Thai, and Xuan Vinh Vo. 2021. Directional Spillover Effects and Time-Frequency Nexus between Oil, Gold and Stock Markets: Evidence from Pre and during COVID-19 Outbreak. International Review of Financial Analysis 76: 10–11. [Google Scholar] [CrossRef] [PubMed]
- Jeribi, Ahmed, Sangram Keshari Jena, and Amine Lahiani. 2021. Are Cryptocurrencies a Backstop for the Stock Market in a Covid-19-Led Financial Crisis? Evidence from the Nardl Approach. International Journal of Financial Studies 9: 33. [Google Scholar] [CrossRef]
- Ji, Qiang, Dayong Zhang, and Yuqian Zhao. 2020. Searching for Safe-Haven Assets during the COVID-19 Pandemic. International Review of Financial Analysis 71: 101526. [Google Scholar] [CrossRef]
- Karamti, Chiraz, and Olfa Belhassine. 2022. COVID-19 Pandemic Waves and Global Financial Markets: Evidence from Wavelet Coherence Analysis. Finance Research Letters 45: 102136. [Google Scholar] [CrossRef]
- Katsiampa, Paraskevi, Larisa Yarovaya, and Damian Zięba. 2022. High-Frequency Connectedness between Bitcoin and Other Top-Traded Crypto Assets during the COVID-19 Crisis. Journal of International Financial Markets, Institutions and Money 79: 101578. [Google Scholar] [CrossRef]
- Koch, Sophia, and Thomas Dimpfl. 2023. Attention and Retail Investor Herding in Cryptocurrency Markets. Finance Research Letters 51: 103474. [Google Scholar] [CrossRef]
- Kwapié, M., José F. F. Mendes, Marcin W. Atorek, Jarosław Kwapié, and Stanisław Dro Zdz. 2023. Cryptocurrencies Are Becoming Part of the World Global Financial Market. Entropy 25: 377. [Google Scholar] [CrossRef]
- Le, Lan T. N., Larisa Yarovaya, and Muhammad Ali Nasir. 2021. Did COVID-19 Change Spillover Patterns between Fintech and Other Asset Classes? Research in International Business and Finance 58: 101441. [Google Scholar] [CrossRef]
- Li, Rongrong, and Min Su. 2017. The Role of Natural Gas and Renewable Energy in Curbing Carbon Emission: Case Study of the United States. Sustainability 9: 600. [Google Scholar] [CrossRef]
- Li, Yuze, Shangrong Jiang, Xuerong Li, and Shouyang Wang. 2021. The Role of News Sentiment in Oil Futures Returns and Volatility Forecasting: Data-Decomposition Based Deep Learning Approach. Energy Economics 95: 105140. [Google Scholar] [CrossRef]
- Loizia, Pantelitsa, Irene Voukkali, Antonis A. Zorpas, Jose Navarro Pedreño, Georgia Chatziparaskeva, Vassilis J. Inglezakis, Ioannis Vardopoulos, and Maria Doula. 2021. Measuring the Level of Environmental Performance in Insular Areas, through Key Performed Indicators, in the Framework of Waste Strategy Development. Science of The Total Environment 753: 141974. [Google Scholar] [CrossRef]
- Maneejuk, Paravee, Nuttaphong Kaewtathip, Peemmawat Jaipong, and Woraphon Yamaka. 2022. The Transition of the Global Financial Markets’ Connectedness during the COVID-19 Pandemic. North American Journal of Economics and Finance 63: 101816. [Google Scholar] [CrossRef]
- Pal, Rimesh, and Sanjay K. Bhadada. 2020. Cash, Currency and COVID-19. Postgraduate Medical Journal 96: 427–28. [Google Scholar] [CrossRef] [PubMed]
- Paramati, Sudharshan Reddy, Hussein Abedi Shamsabadi, and Harshavardhan Reddy Kummitha. 2022. How Did Gold Prices Respond to the COVID-19 Pandemic? Applied Economics Letters 2022: 1–7. [Google Scholar] [CrossRef]
- Salisu, Afees A., and Ahamuefula E. Ogbonna. 2021. The Return Volatility of Cryptocurrencies during the COVID-19 Pandemic: Assessing the News Effect. Global Finance Journal 2021: 100641. [Google Scholar] [CrossRef]
- Salisu, Afees A., and Xuan Vinh Vo. 2020. Predicting Stock Returns in the Presence of COVID-19 Pandemic: The Role of Health News. International Review of Financial Analysis 71: 101546. [Google Scholar] [CrossRef]
- Shehzad, Khurram, Faik Bilgili, Umer Zaman, Emrah Kocak, and Sevda Kuskaya. 2021. Is Gold Favourable than Bitcoin during the COVID-19 Outbreak? Comparative Analysis through Wavelet Approach. Resources Policy 73: 102163. [Google Scholar] [CrossRef]
- Sifat, Imtiaz. 2021. On Cryptocurrencies as an Independent Asset Class: Long-Horizon and COVID-19 Pandemic Era Decoupling from Global Sentiments. Finance Research Letters 43: 102013. [Google Scholar] [CrossRef]
- Sims, Christopher A. 1980. Macroeconomics and Reality. Econometrica 48: 1. [Google Scholar] [CrossRef]
- Smales, L. A. 2021. Investor Attention and Global Market Returns during the COVID-19 Crisis. International Review of Financial Analysis 73: 101616. [Google Scholar] [CrossRef]
- Su, Jung Bin, and Yu Sheng Kao. 2022. How Does the Crisis of the COVID-19 Pandemic Affect the Interactions between the Stock, Oil, Gold, Currency, and Cryptocurrency Markets? Frontiers in Public Health 10: 933264. [Google Scholar] [CrossRef] [PubMed]
- Syuhada, Khreshna, Arief Hakim, Djoko Suprijanto, Intan Muchtadi-Alamsyah, and Lukman Arbi. 2022. Is Tether a Safe Haven of Safe Haven amid COVID-19? An Assessment against Bitcoin and Oil Using Improved Measures of Risk. Resources Policy 79: 103111. [Google Scholar] [CrossRef] [PubMed]
- Tuna, Gülfen, and Vedat Ender Tuna. 2022. Are Effects of COVID-19 Pandemic on Financial Markets Permanent or Temporary? Evidence from Gold, Oil and Stock Markets. Resources Policy 76: 102637. [Google Scholar] [CrossRef]
- Ullah, Subhan, Rexford Attah-Boakye, Kweku Adams, and Ghasem Zaefarian. 2022. Assessing the Influence of Celebrity and Government Endorsements on Bitcoin’s Price Volatility. Journal of Business Research 145: 228–39. [Google Scholar] [CrossRef]
- Umar, Muhammad, Chi Wei Su, Syed Kumail Abbas Rizvi, and Xue Feng Shao. 2021. Bitcoin: A Safe Haven Asset and a Winner amid Political and Economic Uncertainties in the US? Technological Forecasting and Social Change 167: 120680. [Google Scholar] [CrossRef]
- Vardopoulos, Ioannis, Ioannis Konstantopoulos, Antonis A. Zorpas, Lionel Limousy, Simona Bennici, Vassilis J. Inglezakis, and Irene Voukkali. 2021. Sustainable Metropolitan Areas Perspectives through Assessment of the Existing Waste Management Strategies. Environmental Science and Pollution Research 28: 24305–20. [Google Scholar] [CrossRef] [PubMed]
- Wang, Jingjing, and Xiaoyang Wang. 2021. COVID-19 and Financial Market Efficiency: Evidence from an Entropy-Based Analysis. Finance Research Letters 42: 101888. [Google Scholar] [CrossRef]
- Yan, Yu, Yiming Lei, and Yiming Wang. 2022. Bitcoin as a Safe-Haven Asset and a Medium of Exchange. Axioms 11: 415. [Google Scholar] [CrossRef]
- Yarovaya, Larisa, Roman Matkovskyy, and Akanksha Jalan. 2022. The COVID-19 Black Swan Crisis: Reaction and Recovery of Various Financial Markets. Research in International Business and Finance 59: 101521. [Google Scholar] [CrossRef]
- Zhang, Chi, Kaile Zhou, Shanlin Yang, and Zhen Shao. 2017. Exploring the Transformation and Upgrading of China’s Economy Using Electricity Consumption Data: A VAR–VEC Based Model. Physica A: Statistical Mechanics and Its Applications 473: 144–55. [Google Scholar] [CrossRef]
- Zhang, Dayong, Min Hu, and Qiang Ji. 2020. Financial Markets under the Global Pandemic of COVID-19. Finance Research Letters 36: 101528. [Google Scholar] [CrossRef]
- Zhang, Stephen, and Ganesh Mani. 2021. Popular Cryptoassets (Bitcoin, Ethereum, and Dogecoin), Gold, and Their Relationships: Volatility and Correlation Modeling. Data Science and Management 4: 30–39. [Google Scholar] [CrossRef]
- Zhang, Yue Jun. 2011. The Impact of Financial Development on Carbon Emissions: An Empirical Analysis in China. Energy Policy 39: 2197–2203. [Google Scholar] [CrossRef]
Disclaimer/Publisher’s Note: The statements, opinions and data contained in all publications are solely those of the individual author(s) and contributor(s) and not of MDPI and/or the editor(s). MDPI and/or the editor(s) disclaim responsibility for any injury to people or property resulting from any ideas, methods, instructions or products referred to in the content. |
© 2023 by the authors. Licensee MDPI, Basel, Switzerland. This article is an open access article distributed under the terms and conditions of the Creative Commons Attribution (CC BY) license (https://creativecommons.org/licenses/by/4.0/).