
A Combined AHP-PROMETHEE Approach for Portfolio Performance Comparison


Abstract
1. Introduction
2. An Overview of Literature
3. Theoretical Framework
3.1. AHP
3.2. PROMETHEE II
4. Empirical Findings
4.1. Data Collection
4.1.1. Submitting the Alternatives
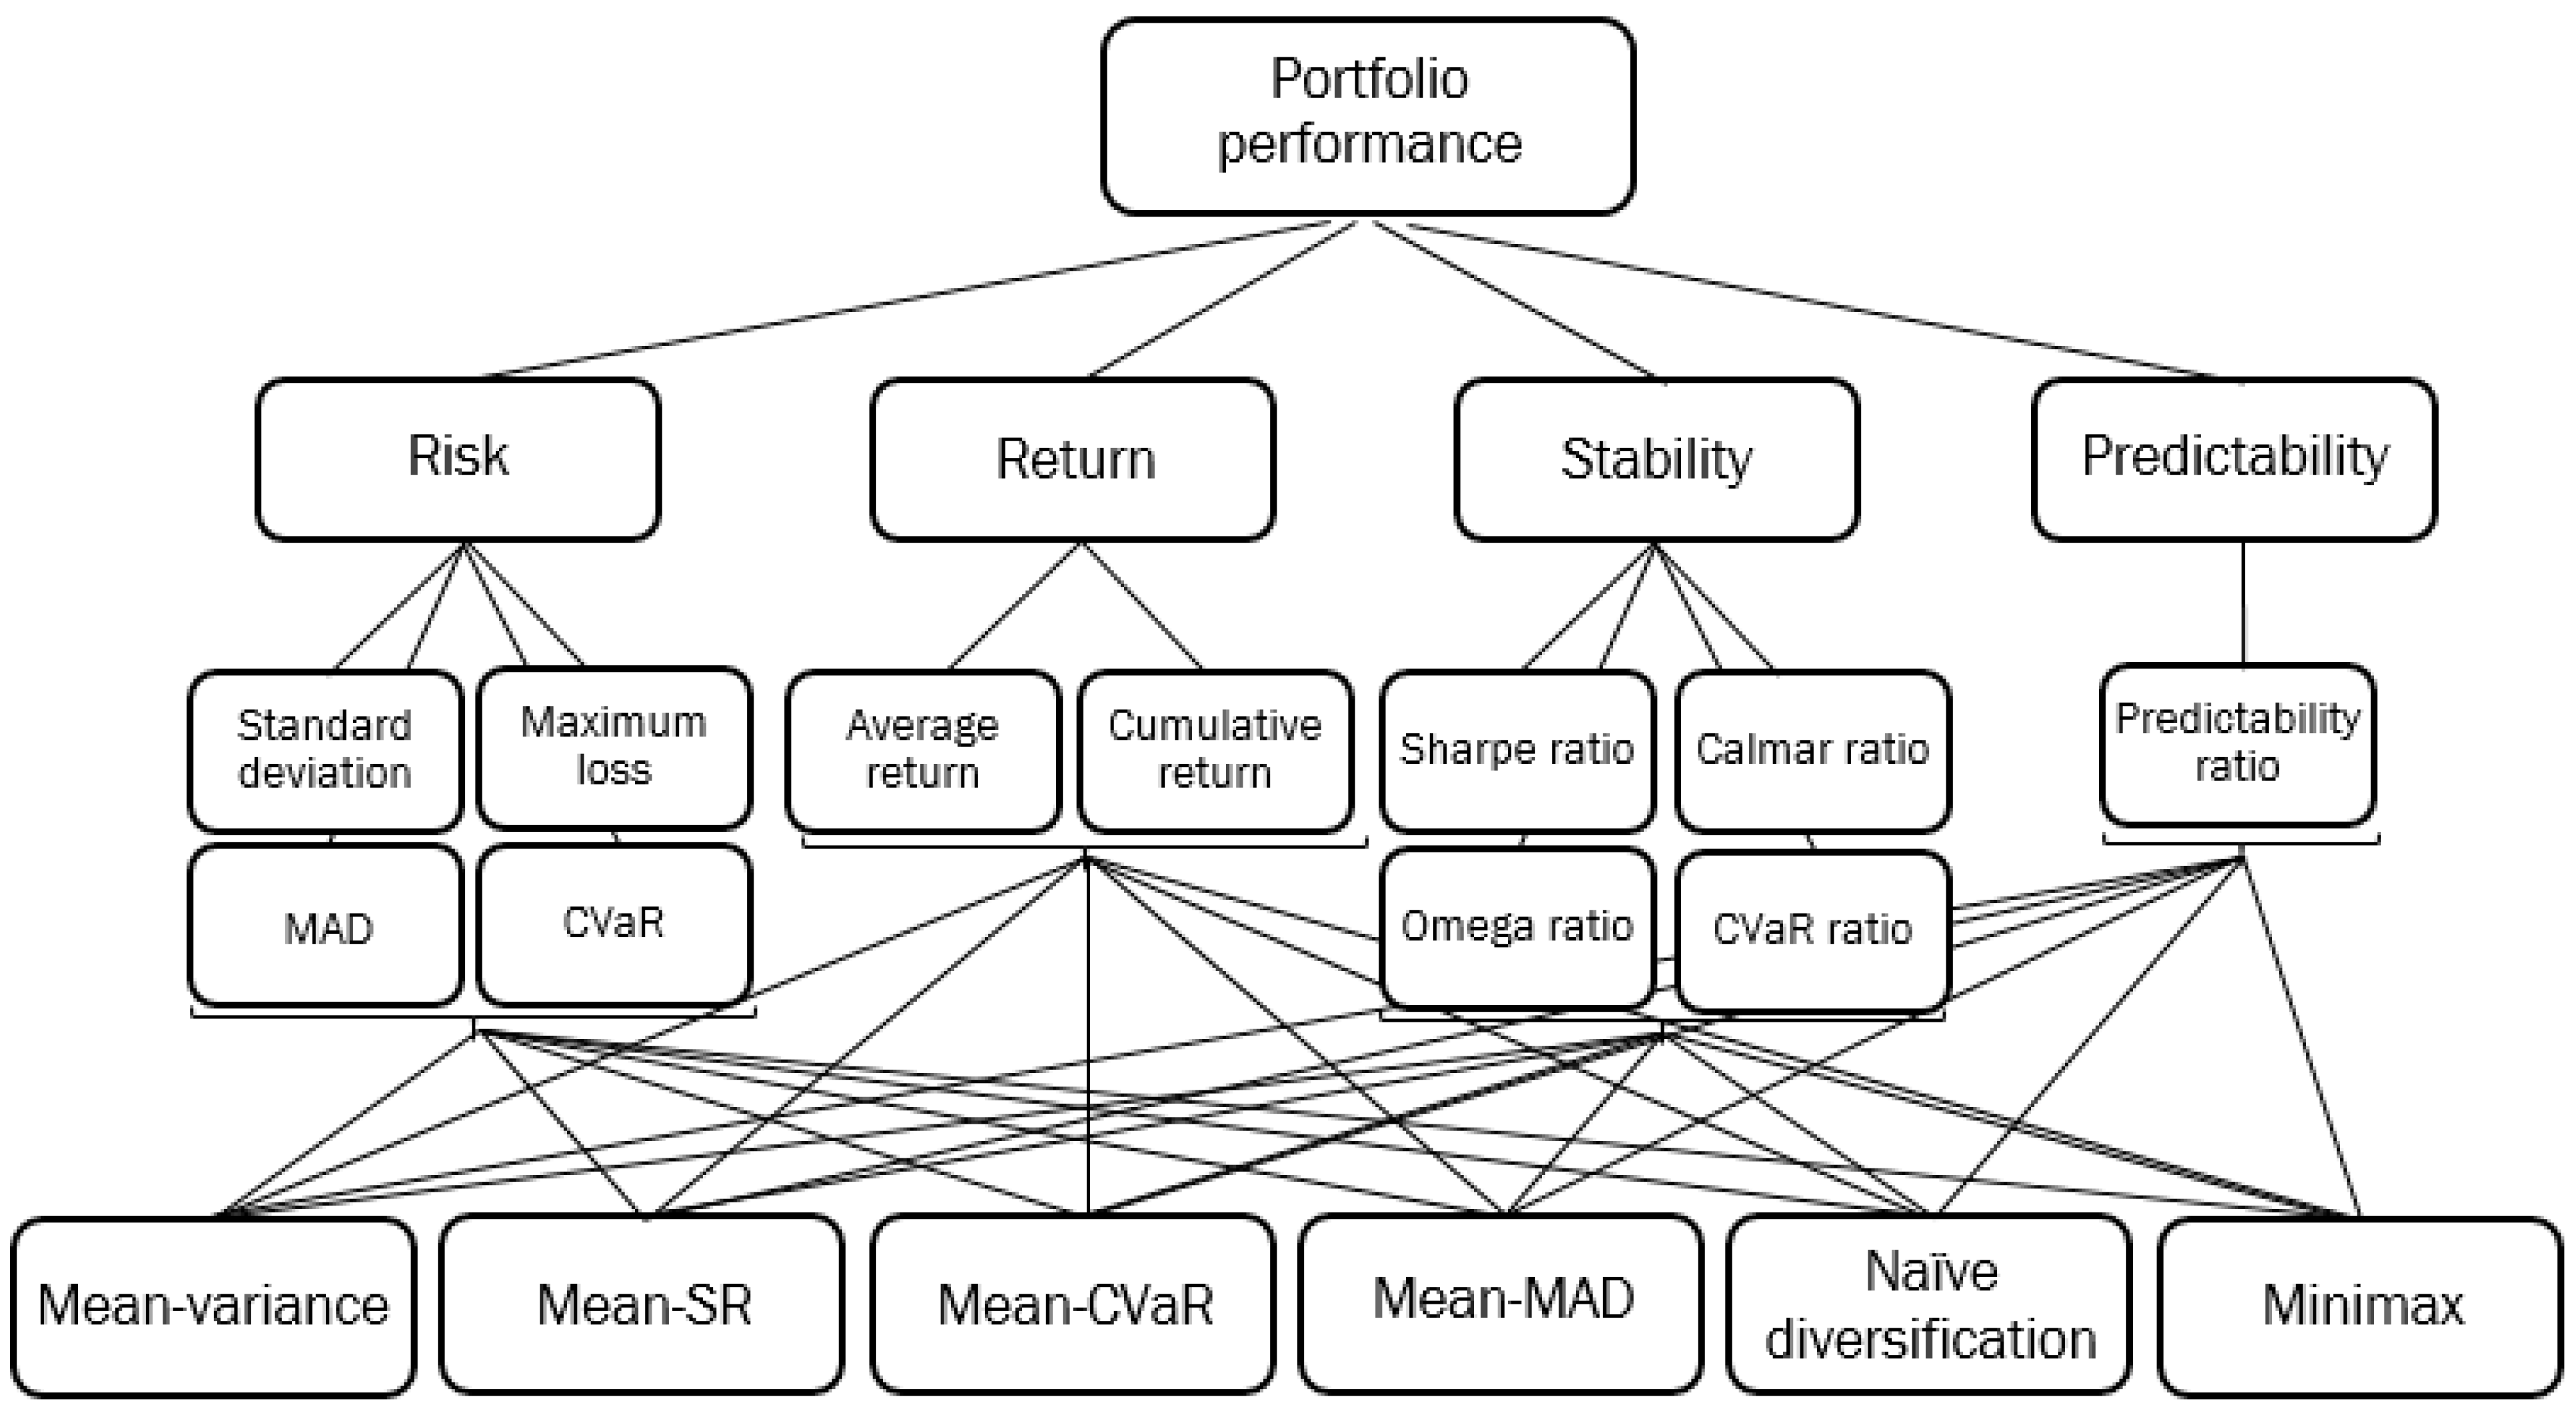
4.1.2. Key Objectives Identifying and Translating into Criteria
4.2. AHP
4.3. PROMETHEE
5. Conclusions
Author Contributions
Funding
Informed Consent Statement
Data Availability Statement
Conflicts of Interest
Appendix A

| SD | ML | MAD | CVaR | AR | CMLR | SR | CR | OR | CVR | PRED | |
|---|---|---|---|---|---|---|---|---|---|---|---|
| SD | 1.00 | ||||||||||
| ML | −0.81 | 1.00 | |||||||||
| MAD | 0.86 | −0.67 | 1.00 | ||||||||
| CVaR | 0.85 | −0.97 | 0.74 | 1.00 | |||||||
| AR | 0.29 | −0.17 | 0.24 | 0.17 | 1.00 | ||||||
| CMLR | 0.12 | −0.09 | 0.02 | 0.08 | 0.76 | 1.00 | |||||
| SR | −0.15 | 0.14 | −0.17 | −0.17 | 0.81 | 0.68 | 1.00 | ||||
| CR | 0.00 | 0.08 | −0.04 | −0.09 | 0.88 | 0.68 | 0.92 | 1.00 | |||
| OR | 0.11 | 0.08 | 0.15 | −0.09 | 0.26 | 0.31 | 0.21 | 0.19 | 1.00 | ||
| CVR | −0.04 | 0.08 | −0.08 | −0.11 | 0.88 | 0.72 | 0.94 | 0.98 | 0.20 | 1.00 | |
| PRED | −0.08 | 0.12 | −0.10 | −0.14 | 0.27 | 0.25 | 0.24 | 0.25 | 0.09 | 0.25 | 1.00 |
Appendix B
| SD | MAD | CVaR | ML | AR | CMR | SR | CR | OR | CVR | PRED | |
|---|---|---|---|---|---|---|---|---|---|---|---|
| Mean | 0.028486 | 0.033400 | 0.047229 | 0.819443 | 0.229557 | 0.901543 | 1.10339 | 4.47109 | 0.900686 | 5.64087 | 0.016557 |
| Median | 0.022400 | 0.027600 | 0.043300 | 0.945100 | 0.237300 | 1.00220 | 1.20230 | 4.75090 | 1.04290 | 5.90920 | −0.001600 |
| Std. Deviation | 0.015853 | 0.013718 | 0.008588 | 0.333059 | 0.093986 | 0.310632 | 0.479598 | 2.65749 | 0.372970 | 2.86971 | 0.042870 |
| Skewness | 2.574 | 2.540 | 1.557 | −2.645 | −0.278 | −2.624 | −2.210 | −0.299 | −2.599 | −1.064 | 2.450 |
| Kurtosis | 6.707 | 6.556 | 2.236 | 6.996 | −1.634 | 6.911 | 5.417 | 0.713 | 6.807 | 3.068 | 6.198 |
| Minimum | 0.0202 | 0.0262 | 0.0394 | 0.0642 | 0.1105 | 0.1985 | 0.0585 | 0.0585 | 0.0585 | 0.0585 | −0.0101 |
| Maximum | 0.0642 | 0.0642 | 0.0642 | 0.9497 | 0.3433 | 1.0485 | 1.5004 | 8.4781 | 1.0752 | 9.6449 | 0.1120 |
References
- Adcock, Christopher, Nelson Areal, Maria Céu Cortez, Benilde Oliveira, and Florinda Silva. 2020. Does the choice of fund performance measure matter? Investment Analysts Journal 49: 53–77. [Google Scholar] [CrossRef]
- Alali, Fatih, and Cagri A. Tolga. 2019. Portfolio allocation with the TODIM method. Expert Systems with Applications 124: 341–48. [Google Scholar] [CrossRef]
- Albadvi, Amir S., Kamal S. Chaharsooghi, and Akbar Esfahanipour. 2007. Decision making in stock trading: An application of PROMETHEE. European Journal of Operational Research 177: 673–83. [Google Scholar] [CrossRef]
- Altin, Hakan. 2020. Sector Analysis of Turkish Markets Using the Promethee Method. Journal of Business Economics and Finance 9: 196–208. [Google Scholar] [CrossRef]
- Altınırmak, Serpil, Bayezid Gülcan, and Çağlar Karamaşa. 2016. Analyzing Securities Investment Trusts Traded in Bist via Ahp-Promethee Methodology. Economy and Business 10: 458–72. [Google Scholar]
- Basilio, Marcio Pereira, Jessica Galdino de Freitas, Milton George Fonesca Kämpffe, and Ricardo Bordeaux Rego. 2018. Investment portfolio formation via multicriteria decision aid: A Brazilian stock market study. Journal of Modelling in Management 13: 394–417. [Google Scholar] [CrossRef]
- Basilio, Marcio Pereira, Valdecy Pereira, Helder Gomes Costa, Marcos Santos, and Amartya Ghosh. 2022. A Systematic Review of the Applications of Multi-Criteria Decision Aid Methods (1977–2022). Electronics 11: 1720. [Google Scholar] [CrossRef]
- Birungi, Criscent, and Lucy Muthoni. 2021. Analysis of Risk Measures in Portfolio Optimization for the Uganda Securities Exchange. Journal of Financial Risk Management 10: 135–52. [Google Scholar] [CrossRef]
- Bouri, Abdelfettah, Jean-Marc Martel, and Habib Chabchoub. 2002. A multi-criterion approach for selecting attractive portfolio. Journal of Multi-Criteria Decision Analysis 11: 269–77. [Google Scholar] [CrossRef]
- Brans, Jean-Pierre, Philippe Vincke, and Bertrand Mareschal. 1986. How to select and how to rank projects: The Promethee method. European Journal of Operational Research 24: 228–38. [Google Scholar] [CrossRef]
- Brans, Jean-Pierre. 1982. Lingenierie de la Decision. Elaboration DinstrumentsDaide a la Decision, Methode PROMETHEE. In L’aide à la décision:Nature, Instruments et Perspectives d’Avenir. Edited by Nadeau Raymond and Maurice Landry. Québec: Presses de l’Université Laval, pp. 183–214. [Google Scholar]
- Byrne, Peter, and Stephen Lee. 2004. Different risk measures: Different portfolio compositions? Journal of Property Investment and Finance 22: 501–11. [Google Scholar] [CrossRef]
- Cogneau, Philippe, and Georges Hübner. 2009. The 101 Ways to Measure Portfolio Performance. Available online: https://doi.org/10.2139/ssrn.1326076 (accessed on 29 December 2022).
- Ghahtarani, Alireza, Ahmed Saif, and Alireza Ghasemi. 2022. Robust portfolio selection problems: A comprehensive review. Operational Research 22: 3203–64. [Google Scholar] [CrossRef]
- Halimi, Wahiba, Dalila Taleb, and Yamina Grari. 2021. Multicriteria Decision Aid Methods and portfolio selection: Case study. Paper presented at the 1st Gulf University International Conference in Accounting and Finance (ICAF), Online, December 8–9. [Google Scholar]
- Hunjra, Ahmed Imran, Suha Mahmoud Alawi, Sisira Colombage, Uroosa Sahito, and Mahnoor Hanif. 2020. Portfolio Construction by Using Different Risk Models: A Comparison among Diverse Economic Scenarios. Risks 8: 126. [Google Scholar] [CrossRef]
- Ikwan, Favour, David Sanders, and Malik Haddad. 2020. A Combined AHP-PROMETHEE Approach for Intelligent Risk Prediction of Leak in a Storage Tank. International Journal of Reliability, Risk and Safety: Theory and Application 3: 55–61. [Google Scholar] [CrossRef]
- Ishak, Aulia, Asfriyati, and Vina Akmaliah. 2019. Analytical Hierarchy Process and PROMETHEE as Decision Making Tool: A Review. IOP Conference Series: Materials Science and Engineering 505: 012085. [Google Scholar] [CrossRef]
- Kalayci, Can B., Okkes Ertenlice, and Mehmet Anil Akbay. 2019. A comprehensive review of deterministic models and applications for mean-variance portfolio optimization. Expert Systems with Applications 125: 345–68. [Google Scholar] [CrossRef]
- Keating, Con, and William F. Shadwick. 2002. A Universal Performance Measure. Journal of Performance Measurement 6: 59–84. [Google Scholar]
- Komchornrit, Kraisee. 2021. Financial Evaluation by the Combined AHP-PROMETHEE Method: A Case Study of Integrated Logistics Service Providers in Thailand. Journal of Community Development Research (Humanities and Social Sciences) 14: 77–89. [Google Scholar] [CrossRef]
- Konno, Hiroshi, and Hiroaki Yamazaki. 1991. Mean-Absolute Deviation Portfolio Optimization Model and Its Applications to Tokyo Stock Market. Management Science 37: 519–31. [Google Scholar] [CrossRef]
- Le Sourd, Véronique. 2007. Performance Measurement for Traditional Investment: Literature Survey. Lille-Nice: EDHEC Risk and Asset Management Research Centre. [Google Scholar]
- Lee, Cheng-Wen, and Dolgion Gankhuyag. 2020. Portfolio Optimization in Post Financial Crisis of 2008–2009 in the Mongolian Stock Exchange. Jurnal METRIS 21: 2020. [Google Scholar] [CrossRef]
- Marasović, Branka, and Zoran Babić. 2011. Two-step multi-criteria model for selecting optimal portfolio. International Journal of Production Economics 134: 58–66. [Google Scholar] [CrossRef]
- Mareschal, Bertrand. 2020. PROMETHEE-GAIA Statistics. Visual PROMETHEE. Available online: http://en.promethee-gaia.net/assets/promethee-stats.pdf (accessed on 25 September 2022).
- Markowitz, Harry. 1952. Portfolio Selection. The Journal of Finance 7: 77. [Google Scholar] [CrossRef]
- Martel, Jean-Marc, Nabil T. Khoury, and Michael G. Bergeron. 1988. An Application of a Multicriteria Approach to Portfolio Comparisons. Journal of the Operational Research Society 39: 617–28. [Google Scholar] [CrossRef]
- Milhomem, Danilo A., and Maria Jose Pereira Dantas. 2022. Analysis of New Approaches Used in Portfolio Optimization: A Systematic Literature Review. In Evolutionary and Memetic Computing for Project Portfolio Selection and Scheduling. Edited by Kyle Robert Harrison, Saber Elsayed, Ivan Leonidovich Garanovich, Terence Weir, Sharon G. Boswell and Ruhul Amin Sarker. Berlin: Springer International Publishing, pp. 125–57. [Google Scholar] [CrossRef]
- Mitkova, Veronika, and Vladimir Mlynarovič. 2019. Investment Opportunities Identification Based on Macroeconomic Development, the Multiple Criteria Decision Approach. Symmetry 11: 827. [Google Scholar] [CrossRef]
- Nguyen, Phi-Hung, Jung-Fa Tsai, Venkata Ajay Kumar G., and Yi-Chung Hu. 2020. Stock Investment of Agriculture Companies in the Vietnam Stock Exchange Market: An AHP Integrated with GRA-TOPSIS-MOORA Approaches. The Journal of Asian Finance, Economics and Business 7: 113–21. [Google Scholar] [CrossRef]
- Palma, Manuel Munoz, Eva Luz Miranda Espinoza, and Pavel Anselmo Álvarez Carrillo. 2022. Ranking jerárquico del índice Dow Jones usando el método ELECTRE-III. Revista Vértice Universitario 24: 18–36. [Google Scholar] [CrossRef]
- Pant, Ssangeeta, Anuj Kumar, Mangey Ram, Yury Klochkov, and Hitesh Kumar Sharma. 2022. Consistency Indices in Analytic Hierarchy Process: A Review. Mathematics 10: 1206. [Google Scholar] [CrossRef]
- Pätäri, Eero, Ville Karell, Pasi Luukka, and Julian S. Yeomans. 2018. Comparison of the multicriteria decision-making methods for equity portfolio selection: The U.S. evidence. European Journal of Operational Research 265: 655–72. [Google Scholar] [CrossRef]
- Pendaraki, Konstantina, and Constantin Zopounidis. 2003. Evaluation of equity mutual funds’ performance using a multicriteria methodology. Operational Research 3: 69–90. [Google Scholar] [CrossRef]
- Ponsich, Antonin, Antonio Lopez Jaimes, and Carlos A. Coello Coello. 2013. A Survey on Multiobjective Evolutionary Algorithms for the Solution of the Portfolio Optimization Problem and Other Finance and Economics Applications. IEEE Transactions on Evolutionary Computation 17: 321–44. [Google Scholar] [CrossRef]
- Raju, Rajan, and Sobhesh Kumar Agarwalla. 2021. Equity Portfolio Diversification: How Many Stocks Are Enough? Evidence from India. Available online: https://papers.ssrn.com/sol3/papers.cfm?abstract_id=3790117 (accessed on 29 December 2022).
- Righi, Marcelo Brutti, and Denis Borenstein. 2018. A simulation comparison of risk measures for portfolio optimization. Finance Research Letters 24: 105–12. [Google Scholar] [CrossRef]
- Rockafellar, R. Tyrrell, and Stansilav Uryasev. 2000. Optimization of conditional value-at-risk. The Journal of Risk 2: 21–41. [Google Scholar] [CrossRef]
- Saaty, Thomas L. 1977. A scaling method for priorities in hierarchical structures. Journal of Mathematical Psychology 15: 234–81. [Google Scholar] [CrossRef]
- Saaty, Thomas L. 1990. How to make a decision: The analytic hierarchy process. European Journal of Operational Research 48: 9–26. [Google Scholar] [CrossRef]
- Saaty, Thomas L. 1994. How to Make a Decision: The Analytic Hierarchy Process. Interfaces 24: 19–43. [Google Scholar] [CrossRef]
- Schaarschmidt, Steffen, and Peter Schanbacher. 2012. Minimax: Portfolio Choice Based on Pessimistic Decision Making. Available online: https://ssrn.com/abstract=2078861 (accessed on 29 December 2022).
- Sharpe, William F. 1994. The Sharpe Ratio. The Journal of Portfolio Management 21: 49–58. [Google Scholar] [CrossRef]
- Sielska, Agata. 2010. Multicriteria rankings of open-end investment funds and their stability. Operations Research and Decisions 1: 112–29. [Google Scholar]
- Sikalo, Mirza, Almira Arnaut-Berilo, and Azra Zaimovic. 2022. Efficient Asset Allocation: Application of Game Theory-Based Model for Superior Performance. International Journal of Financial Studies 10: 20. [Google Scholar] [CrossRef]
- Tepeli, Yusuf, and Hatice Özkoç. 2020. An Evaluation of Alternative Methods for Financial Performance: Evidence from Turkey (Istanbul Stock Exchange). International Journal of Contemporary Economics and Administrative Sciences 10: 356–77. [Google Scholar] [CrossRef]
- Turcksin, Laurence, Annalia Bernardini, and Cathy Macharis. 2011. A combined AHP-PROMETHEE approach for selecting the most appropriate policy scenario to stimulate a clean vehicle fleet. Procedia—Social and Behavioral Sciences 20: 954–65. [Google Scholar] [CrossRef]
- Uygurtürk, Hasan. 2013. Performance Evaluation of Turkish Pension Funds By Using ELECTRE Method. International Journal of Research in Computer Application and Management 3: 100–7. [Google Scholar]
- Vásquez, Jaime Alberto, John Willmer Escobar, and Diego Fernando Manotas. 2022. AHP–TOPSIS Methodology for Stock Portfolio Investments. Risks 10: 4. [Google Scholar] [CrossRef]
- Vetschera, Rudolf, and Adiel Teixeira de Almeida. 2012. A PROMETHEE-based approach to portfolio selection problems. Computers and Operations Research 39: 1010–20. [Google Scholar] [CrossRef]
- Vuković, Marija, Snježana Pivac, and Zoran Babić. 2020. Comparative analysis of stock selection using a hybrid MCDM approach and modern portfolio theory. Croatian Review of Economic, Business and Social Statistics 6: 58–68. [Google Scholar] [CrossRef]
- Young, Martin R. 1998. A Minimax Portfolio Selection Rule with Linear Programming Solution. Management Science 44: 673–83. [Google Scholar] [CrossRef]
- Young, Terry W. 1991. Calmar ratio: A smoother tool. Futures 20: 40. [Google Scholar]
- Zopounidis, Constantin, Michael Doumpos, and Frank J. Fabozzi. 2014. Preface to the Special Issue: 60 years following Harry Markowitz’s contributions in portfolio theory and operations research. European Journal of Operational Research 234: 343–45. [Google Scholar] [CrossRef]


| Intensity of Importance | Definition | Explanation |
|---|---|---|
| 1 | Equal importance | Two elements contribute equally to the objective |
| 3 | Moderate importance | Experience and judgment moderately favor one activity over another |
| 5 | Strong importance | Experience and judgment strongly favor one activity over another |
| 7 | Very strong importance | An activity is strongly favored and its dominance demonstrated in practice |
| 9 | Complete dominance | The evidence favoring one activity over another is of the highest possible order of affirmation |
| 2, 4, 6, 8 | Intermediate values | When compromise is needed |
| Reciprocals | If activity i has one of the above numbers assigned when compared with activity j, then j has the reciprocal value when compared with i | |
| Criteria | SD | MAD | CVaR | ML | AR | CMR | SR | CR | OR | CVR | PRED |
|---|---|---|---|---|---|---|---|---|---|---|---|
| Max/Min | min | min | min | max | max | max | max | max | max | max | max |
| Weights | 0.0642 | 0.0642 | 0.0642 | 0.0642 | 0.1985 | 0.1985 | 0.0585 | 0.0585 | 0.0585 | 0.0585 | 0.1120 |
| Naïve | 0.0245 | 0.0316 | 0.0469 | 0.9431 | 0.3433 | 1.0269 | 1.4102 | 4.7509 | 1.0604 | 6.8771 | −0.0016 |
| Mean-Var | 0.0202 | 0.0268 | 0.0418 | 0.9497 | 0.1122 | 0.9994 | 1.2023 | 5.6683 | 1.0739 | 5.9092 | −0.0023 |
| Mean-SR | 0.0253 | 0.0301 | 0.0524 | 0.9370 | 0.2878 | 0.9989 | 1.2507 | 5.7628 | 0.9791 | 6.2522 | −0.0101 |
| Minimax | 0.0224 | 0.0262 | 0.0394 | 0.9488 | 0.3173 | 1.0364 | 1.5004 | 8.4781 | 1.0148 | 9.6449 | 0.0124 |
| Mean-CVaR | 0.0211 | 0.0276 | 0.0426 | 0.9482 | 0.2373 | 1.0485 | 1.1340 | 3.9506 | 1.0752 | 5.5934 | 0.0106 |
| Mean-MAD | 0.0217 | 0.0273 | 0.0433 | 0.9451 | 0.1105 | 1.0022 | 1.1676 | 2.6284 | 1.0429 | 5.1508 | −0.0051 |
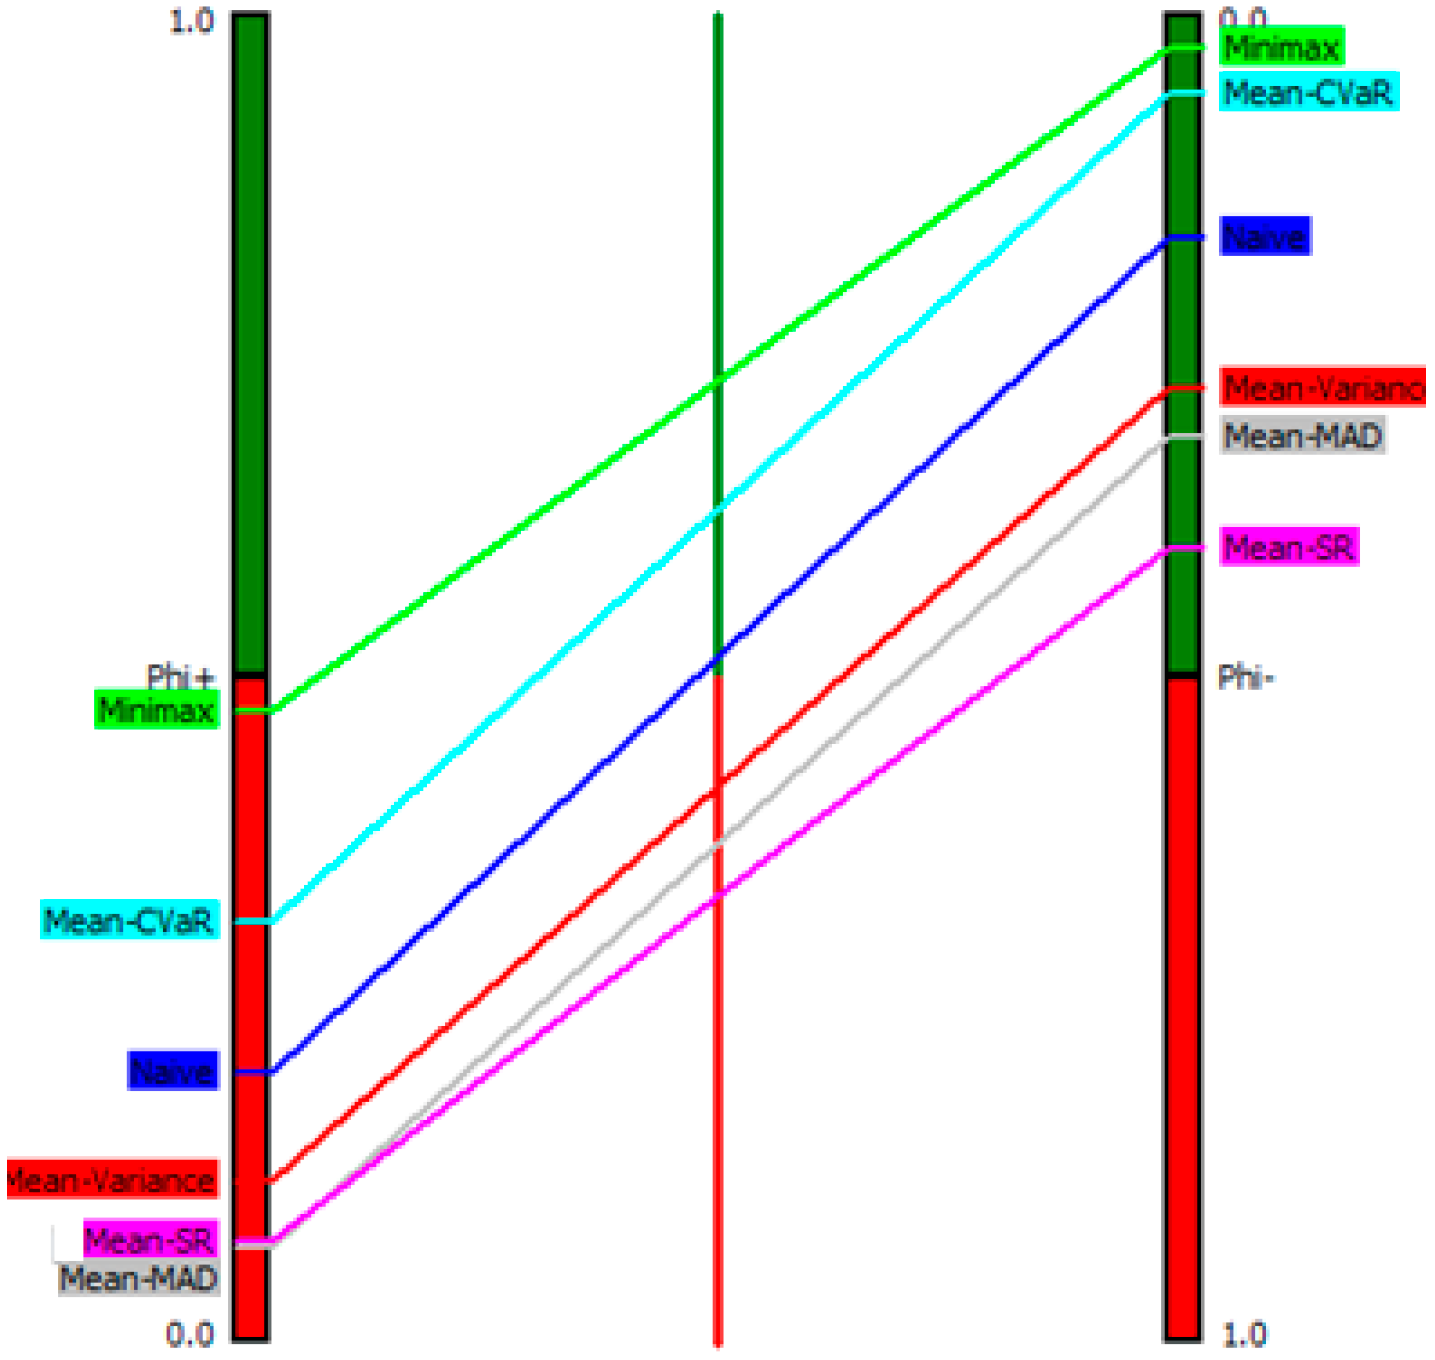
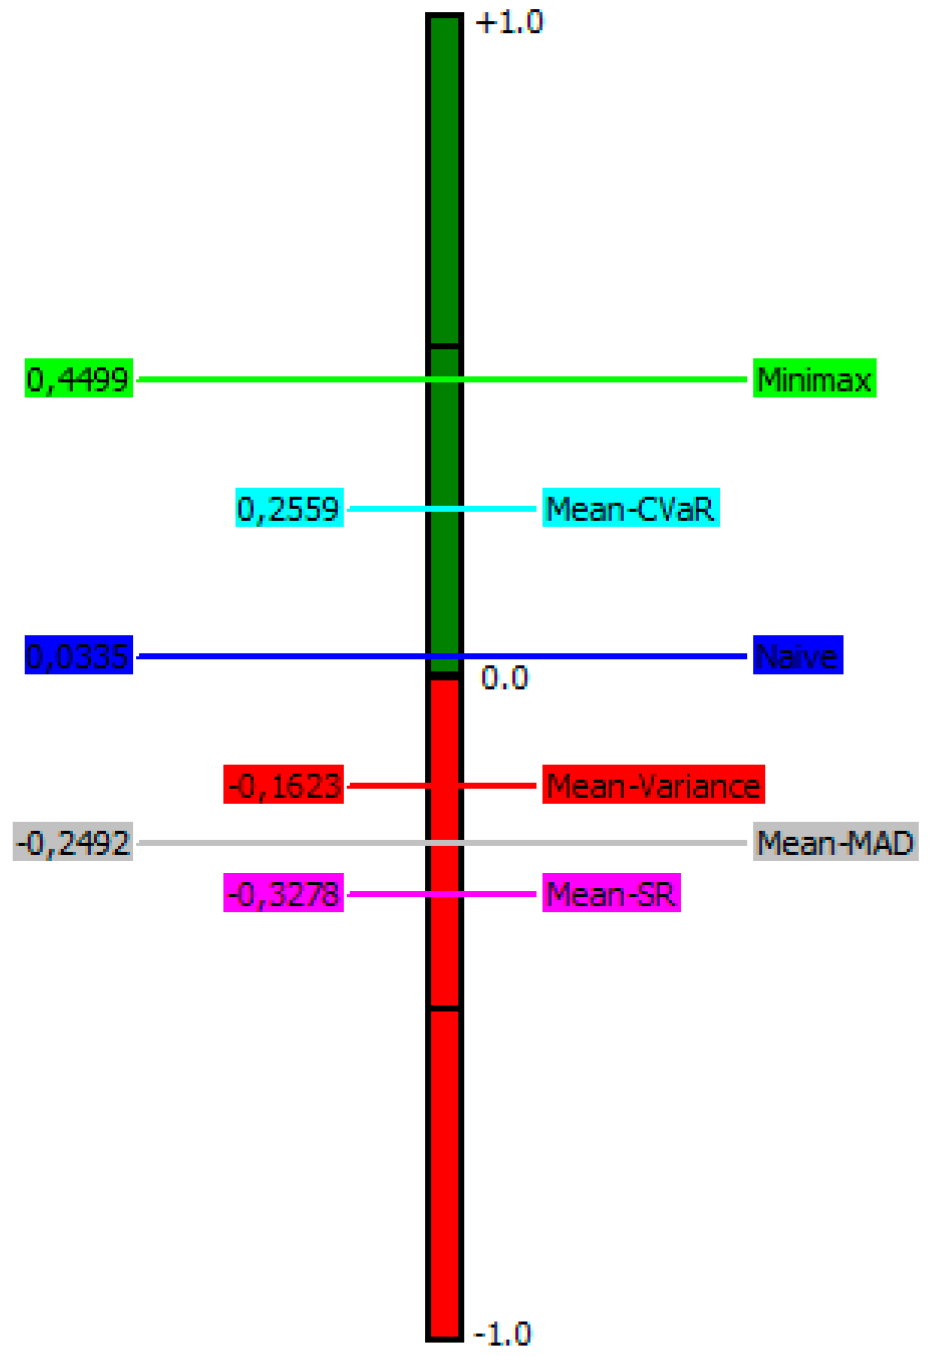
| Rank | Alternative | Phi | Phi+ | Phi− |
|---|---|---|---|---|
| 1 | Minimax | 0.4499 | 0.4745 | 0.0247 |
| 2 | Mean-CVaR | 0.2559 | 0.3159 | 0.0600 |
| 3 | Naïve | 0.0335 | 0.1677 | 0.1677 |
| 4 | Mean-Variance | −0.1623 | 0.1202 | 0.2825 |
| 5 | Mean-MAD | −0.2492 | 0.0698 | 0.3190 |
| 6 | Mean-SR | −0.3278 | 0.0750 | 0.4028 |
| Criteria | Weight | Minimax Remain 1st | Overall Ranking Remain Same |
|---|---|---|---|
| SD | 0.0642 | 0.00–0.48 | 0.00–0.22 |
| ML | 0.0642 | 0.00–0.92 | 0.00–0.36 |
| MAD | 0.0642 | 0.00–1.00 | 0.00–0.21 |
| CVaR | 0.0642 | 0.00–1.00 | 0.00–0.32 |
| AR | 0.1985 | 0.00–0.94 | 0.00–0.26 |
| CMLR | 0.1985 | 0.00–0.61 | 0.00–0.61 |
| SR | 0.0585 | 0.00–1.00 | 0.00–0.25 |
| CR | 0.0585 | 0.00–1.00 | 0.00–0.15 |
| OR | 0.0585 | 0.00–0.27 | 0.00–0.27 |
| CVR | 0.0585 | 0.00–1.00 | 0.00–0.73 |
| PRED | 0.1120 | 0.00–1.00 | 0.00–1.00 |
Disclaimer/Publisher’s Note: The statements, opinions and data contained in all publications are solely those of the individual author(s) and contributor(s) and not of MDPI and/or the editor(s). MDPI and/or the editor(s) disclaim responsibility for any injury to people or property resulting from any ideas, methods, instructions or products referred to in the content. |
© 2023 by the authors. Licensee MDPI, Basel, Switzerland. This article is an open access article distributed under the terms and conditions of the Creative Commons Attribution (CC BY) license (https://creativecommons.org/licenses/by/4.0/).
Share and Cite
Sikalo, M.; Arnaut-Berilo, A.; Delalic, A. A Combined AHP-PROMETHEE Approach for Portfolio Performance Comparison. Int. J. Financial Stud. 2023, 11, 46. https://doi.org/10.3390/ijfs11010046
Sikalo M, Arnaut-Berilo A, Delalic A. A Combined AHP-PROMETHEE Approach for Portfolio Performance Comparison. International Journal of Financial Studies. 2023; 11(1):46. https://doi.org/10.3390/ijfs11010046
Chicago/Turabian StyleSikalo, Mirza, Almira Arnaut-Berilo, and Adela Delalic. 2023. "A Combined AHP-PROMETHEE Approach for Portfolio Performance Comparison" International Journal of Financial Studies 11, no. 1: 46. https://doi.org/10.3390/ijfs11010046
APA StyleSikalo, M., Arnaut-Berilo, A., & Delalic, A. (2023). A Combined AHP-PROMETHEE Approach for Portfolio Performance Comparison. International Journal of Financial Studies, 11(1), 46. https://doi.org/10.3390/ijfs11010046